Article

Human–AI Collaboration in Programming Education: Student Perspectives on LLM-Based Coding Assistants

1
Department of Information Technology, Yarmouk University, Irbid 21110, Jordan
2
Department of Computer Science and Engineering, American University of Sharjah, Sharjah 26666, United Arab Emirates
*
Author to whom correspondence should be addressed.
Computers 2026, 15(3), 154; https://doi.org/10.3390/computers15030154
Submission received: 16 January 2026 / Revised: 12 February 2026 / Accepted: 19 February 2026 / Published: 2 March 2026

Abstract

The integration of large language models (LLMs) such as GitHub Copilot, ChatGPT, and DeepSeek into programming education has introduced a new form of human–AI collaboration. These tools provide real-time code suggestions, debugging assistance, and design support, yet their effects on learning, trust, productivity, and coding practices remain underexplored. We surveyed 248 students to examine relationships among these constructs, usage patterns by programming experience and academic level, the most frequently used assistants and programming languages, group differences in perceived learning and coding practices, and the extent to which learning, trust, and coding practices predict productivity. Students reported high adoption of ChatGPT and Python, generally positive perceptions of learning and productivity, and significant positive correlations among all constructs. Kruskal–Wallis tests indicated no significant differences in perceived learning across Basic, Intermediate, and Expert programmers, nor in coding practices across academic years (Years 1–4). Multiple regression showed that learning, trust, and coding practices jointly explained a substantial proportion of productivity variance (R2 = 0.628). These findings emphasize both opportunities and risks of AI integration and offer guidance for educators aiming to integrate AI tools while maintaining pedagogical rigor.

1. Introduction

The integration of artificial intelligence (AI) into education has transformed traditional learning paradigms, particularly in programming instruction. Recent developments in large language models (LLMs), such as GitHub Copilot, ChatGPT, and DeepSeek, have introduced AI-powered coding assistants that provide real-time suggestions, debugging assistance, and complete code snippets [1]. While these tools aim to enhance coding performance and learning experiences, their impact on learning outcomes, student behavior, and trust in AI-generated solutions remains unclear and requires further exploration [2].
Traditionally, programming education has emphasized hands-on practice, textbooks and tutorials, instructor feedback, and peer collaboration. However, the rise of LLM-based coding assistants introduces a new dynamic: human–AI collaboration, where students interact with AI as a collaborator rather than just a passive tool [3]. This shift raises significant pedagogical questions: Do these tools genuinely enhance students’ learning and productivity, or do they risk encouraging over-reliance? To what extent do students trust AI-generated code, and how does this trust shape their Code of Practice? While prior research has investigated AI in automated grading [4] and personalized learning [5], fewer studies have examined how students adopt, use, and perceive AI collaboration in programming courses.
From a socio-cognitive perspective, learning with AI aligns with Vygotsky’s concept of the More Knowledgeable Other (MKO), where learners benefit from scaffolding, whether from humans or intelligent systems [6]. However, unlike human tutors, AI lacks pedagogical intentionality, potentially leading to superficial learning if students accept AI-generated solutions without critical evaluation [7]. Empirical studies on intelligent tutoring systems (ITS) indicate that while AI can improve task performance, its impact on long-term retention and metacognitive skills varies based on learner engagement. In programming education, early findings indicate that overreliance on AI coding assistants may reduce debugging proficiency [8], yet students report higher confidence when using them [9]. These mixed results emphasize the need for deeper investigation into how students perceive and interact with AI tools in authentic learning contexts.
This study investigates students’ experiences and attitudes toward LLM-based coding assistants in programming education. Specifically, we address the following research questions:
  • RQ1: Are there significant correlations between trust, productivity, learning, and Code of Practice in human–AI collaboration for programming education?
  • RQ2: How often do students use AI tools for coding, and how does this relate to their experience or academic level?
  • RQ3: Which AI-based coding assistants and programming languages are most frequently used by students?
  • RQ4: Do students with Basic or Intermediate programming experience differ significantly from Expert programmers in their perceived learning outcomes when using AI tools?
  • RQ5: Are there significant differences in Code of Practice across students at different academic levels (Year 1, Year 2, Year 3, Year 4)?
  • RQ6: To what extent do Learning, Trust, and Code of Practice predict students’ Productivity when using AI-based coding assistants?
By answering these questions, our study provides insights into understanding how students perceive and engage with AI coding assistants in programming education. This research specifically examines adoption patterns; the interplay between learning, trust, productivity, and Code of Practice; and how these dynamics differ across levels of experience and academic progression.
Unlike prior studies that examined AI in grading or ITS, our work uniquely investigates students’ perceptions of trust, productivity, learning, and Code of Practice in the context of LLM-based assistants, providing both usage trends and predictive modeling insights.
The remainder of this paper is structured as follows. Section 2 reviews related work on AI in programming education and human–AI collaboration. Section 3 describes the survey design, measurement constructs, and data analysis methods used to address the six research questions (RQ1–RQ6). Section 4 presents the findings for each research question, including correlations between constructs (RQ1), usage patterns across experience and academic levels (RQ2, RQ3), group comparisons (RQ4, RQ5), and predictive modeling of productivity (RQ6). Section 5 concludes the paper with a discussion of implications for programming pedagogy and directions for future research.

2. Related Work

This section reviews prior research on the role of AI in education from three complementary perspectives: students, instructors, and pedagogical integration. This literature explains how trust, productivity, learning, and Code of Practice relate to human–AI collaboration and identifies the gap addressed by our research questions (RQ1–RQ6).

2.1. Student Perspectives

Students’ engagement with AI-based tools in education has been studied primarily in the context of programming, writing, and collaborative learning. Puryear and Sprint [1] reported that GitHub Copilot provided students with valuable scaffolding support in programming classes, though some learners expressed concerns about dependency on AI-generated solutions. Fan et al. [9] demonstrated that AI-assisted pair programming could enhance student motivation, reduce programming anxiety, and improve collaboration compared to traditional pair programming and individual work. These findings directly relate to productivity, as students often describe AI as reducing workload and improving efficiency. At the same time, Clarke and Konak [8] found that frequent reliance on AI in programming courses risked weakening students’ critical thinking skills, raising questions about how Code of Practice may evolve when AI support is heavily used. Beyond programming, Kim [10] examined students’ use of generative AI for academic tasks and found that while many perceived efficiency gains, concerns about fairness and academic integrity persisted. Similarly, Järvelä et al. [11] indicated how learners collaborate with AI in socially shared regulation contexts, emphasizing both the motivational benefits and the need for careful scaffolding to prevent overreliance. These studies show that student experiences with AI tools are shaped by a balance between enhanced productivity and learning benefits, and concerns about trust, fairness, and sustainable Code of Practice.

2.2. Instructor Perspectives

Educators’ perspectives reflect both opportunities and challenges in adopting AI in classrooms. Prather et al. [2] described how computing instructors are navigating the rise of generative AI, balancing the potential to enrich learning with concerns about plagiarism and the erosion of core skills. Yim [12] surveyed teachers’ acceptance of AI and found cautious optimism: instructors welcomed efficiency gains but were concerned about maintaining pedagogical control and addressing ethical risks. Gambo et al. [4] showcased how automated grading systems can reduce instructor workload and provide timely feedback, while Cheng et al. [3] noted that teachers’ trust in AI-powered code generation tools is influenced by wider community perceptions and shared experiences. Al-Mughairi and Bhaskar [13] investigated teachers’ perspectives on ChatGPT adoption in higher education using a qualitative approach. They identified motivating factors such as innovation, personalization, time-saving, and professional development, alongside inhibiting factors including reliability concerns, reduced human interaction, privacy, lack of institutional support, and overreliance. These findings parallel the themes observed in our student-focused study, indicating that both learners and instructors face similar opportunities and challenges when integrating AI into educational practice. Collectively, these studies find that instructors value AI as a potential partner in education but demand transparency, reliability, and strong institutional guidance before widespread adoption.

2.3. Pedagogical Integration

The literature stresses that meaningful integration of AI requires more than ad hoc adoption. Memarian and Doleck [14] reviewed the integration of artificial intelligence into assessment for learning (AFL) practices. They found that AI can enhance formative feedback and scaffolding, but highlighted risks such as bias, lack of trust, and over-reliance if not carefully aligned with pedagogical goals. Similarly, Mao et al. [15] examined the implications of generative AI in education, identifying opportunities such as adaptive testing and automated feedback, while also underscoring challenges including authenticity, academic integrity, and privacy. Their analysis emphasizes the need to balance human-centric and technology-centric approaches, which resonates with our findings that trust and responsible use are crucial for sustainable integration. Xia et al. [16] provided a broader perspective through a scoping review of 32 empirical studies on generative AI and assessment in higher education. Their analysis highlighted both opportunities, such as self-assessment and immediate feedback, and challenges, including threats to academic integrity and the need for teacher assessment literacy. Importantly, they emphasized that institutions must adapt policies and curricula to balance innovation with integrity, reinforcing that the integration of AI requires systemic, multi-level responses rather than isolated classroom practices.
Holmes et al. [17] emphasized that AI should not be seen as a replacement for teachers but as a means to augment both teaching and learning. They explored how AI can support collaborative learning, provide continuous assessment, and act as a learning companion, while also warning of ethical and social challenges if AI is deployed without pedagogical grounding. Edwards [18] demonstrated that the design of metacognitive support agents can encourage students to reflect, plan, and adapt collaboratively, though effectiveness depends on clear role definition and trust. Complementary findings by Järvelä et al. [11] highlight how AI can trigger socially shared regulation processes, helping groups coordinate and sustain engagement. Finally, Zawacki-Richter et al. [19] concluded that most AI in higher education research remains technology-driven, with limited involvement from educators or pedagogical theory. They emphasized the need for stronger educational perspectives, explicit theoretical grounding, and critical reflection on ethical and social risks to ensure meaningful and sustainable integration of AI in teaching and learning. These works frame pedagogical integration as a process of reconfiguration, where AI is positioned to enhance creativity, reflection, and collaboration rather than simply substituting traditional practices.

2.4. Summary and Research Gap

Prior research documents both benefits and concerns related to AI use in education. Studies not only report gains in motivation, efficiency, and collaborative learning but also raise concerns about dependency, fairness, and reduced critical engagement. Instructors acknowledge AI’s potential value yet often express caution in the absence of clear institutional guidance or pedagogical frameworks. Review studies also suggest that AI adoption is frequently driven by technological capability rather than educational theory.
These findings motivate RQ1 on the interplay between trust, learning, productivity, and Code of Practice, RQ2–RQ3 on adoption patterns across groups, and RQ4–RQ6 on differences and predictors of productivity. Building on these insights and the identified research gap, the next section outlines our methodological approach. We describe the survey design, participant demographics, measurement constructs, and data analysis procedures used to address the six research questions (RQ1–RQ6).

3. Methodology

3.1. Research Design

This study used a quantitative survey design to explore students’ perspectives on human–AI collaboration in programming education, with a specific focus on Large Language Model (LLM)-based coding assistants. The approach was chosen to capture measurable perceptions of learning, productivity, trust, and Code of Practice among a diverse group of students and to statistically test hypothesized relationships among these constructs. Figure 1 summarizes the overall methodology of this study, from participant recruitment and survey design to IRB-approved data collection with a reference (IRB/2025/263), data quality checks (cleaning, reliability, and validity testing), and normality assessment, culminating in analyses addressing the six research questions (RQ1–RQ6).

3.2. Participants and Sampling

Data were collected from 248 students enrolled in computer science and related programs across different academic levels (Year 1–4). Respondents represented a range of majors, including Computer Science, Information Systems, Cybersecurity, Artificial Intelligence, and Data Science. The participants varied in programming experience, self-reporting as Basic (n = 111), Intermediate (n = 118), or Expert (n = 19). All participants were enrolled in universities in Jordan. Participants were recruited from undergraduate and graduate programming-related courses (e.g., programming fundamentals, data structures, web development, and AI-related courses) at universities in Jordan, including Yarmouk University (YU) and the Jordanian University of Science and Technology (JUST). Participation was voluntary, and the survey was administered online during the academic term. A total of 248 valid responses were collected and included in the analysis. This sampling ensured adequate representation across academic and skill levels, strengthening the generalizability of findings within higher education contexts. Although the total sample comprised 248 respondents, analyses involving the Trust construct were conducted on a reduced sample ( N = 214 ) due to missing responses on selected Trust items. All other constructs retained the full sample size ( N = 248 ). First, we examined the extent of missing data in the Trust scale. Missing responses per item ranged from 15 to 22 cases (approximately 6–9% of the sample). To assess potential bias, we applied series mean imputation (SMEAN) to the Trust items and re-estimated reliability using the full sample (N = 248). Following imputation, no cases were excluded (100% valid cases), and the Cronbach’s alpha for Trust was α = 0.674 , compared to α = 0.692 in the original listwise-deletion analysis ( N = 214 ). The minimal change in alpha indicates that missingness did not materially affect the internal consistency of the Trust scale, suggesting that the missing data were unlikely systematic. Given the exploratory nature of the study, the five-item scale length, and established guidance for human–AI perception research, the observed reliability remains within an acceptable range. Importantly, substantive results involving Trust were consistent before and after imputation, indicating robustness to missing data handling.

3.3. Survey Instrument and Coding

We developed a closed-ended questionnaire to capture students’ perceptions of Human–AI collaboration in programming education, with a focus on LLM-based coding assistants (e.g., GitHub Copilot, ChatGPT). The instrument comprised four multi-item constructs: Learning, Productivity, Trust, and Code of Practice (5 items per construct). Items used a five-point Likert scale from 1 = Strongly Disagree to 5 = Strongly Agree. Responses were exported to Excel and cleaned by promoting the first row to headers, coercing all Likert items to numeric (1–5), and checking for out-of-range and missing values. Construct scores were computed as each respondent’s mean across items, provided at least half the items for that construct were non-missing (imputation was not applied). Table 1 lists the full item wording, construct mapping, and reverse-coded items.

3.4. Data Collection Procedure

The survey was administered online during the Spring 2025 term. Participation was voluntary, and responses were anonymous to encourage honest feedback. Survey data were exported to Excel and cleaned by converting Likert-scale responses to numeric values (1–5). Construct scores were calculated as the mean of their items, and responses were included only when at least half of the items in a construct were completed.

3.5. Reliability Analysis

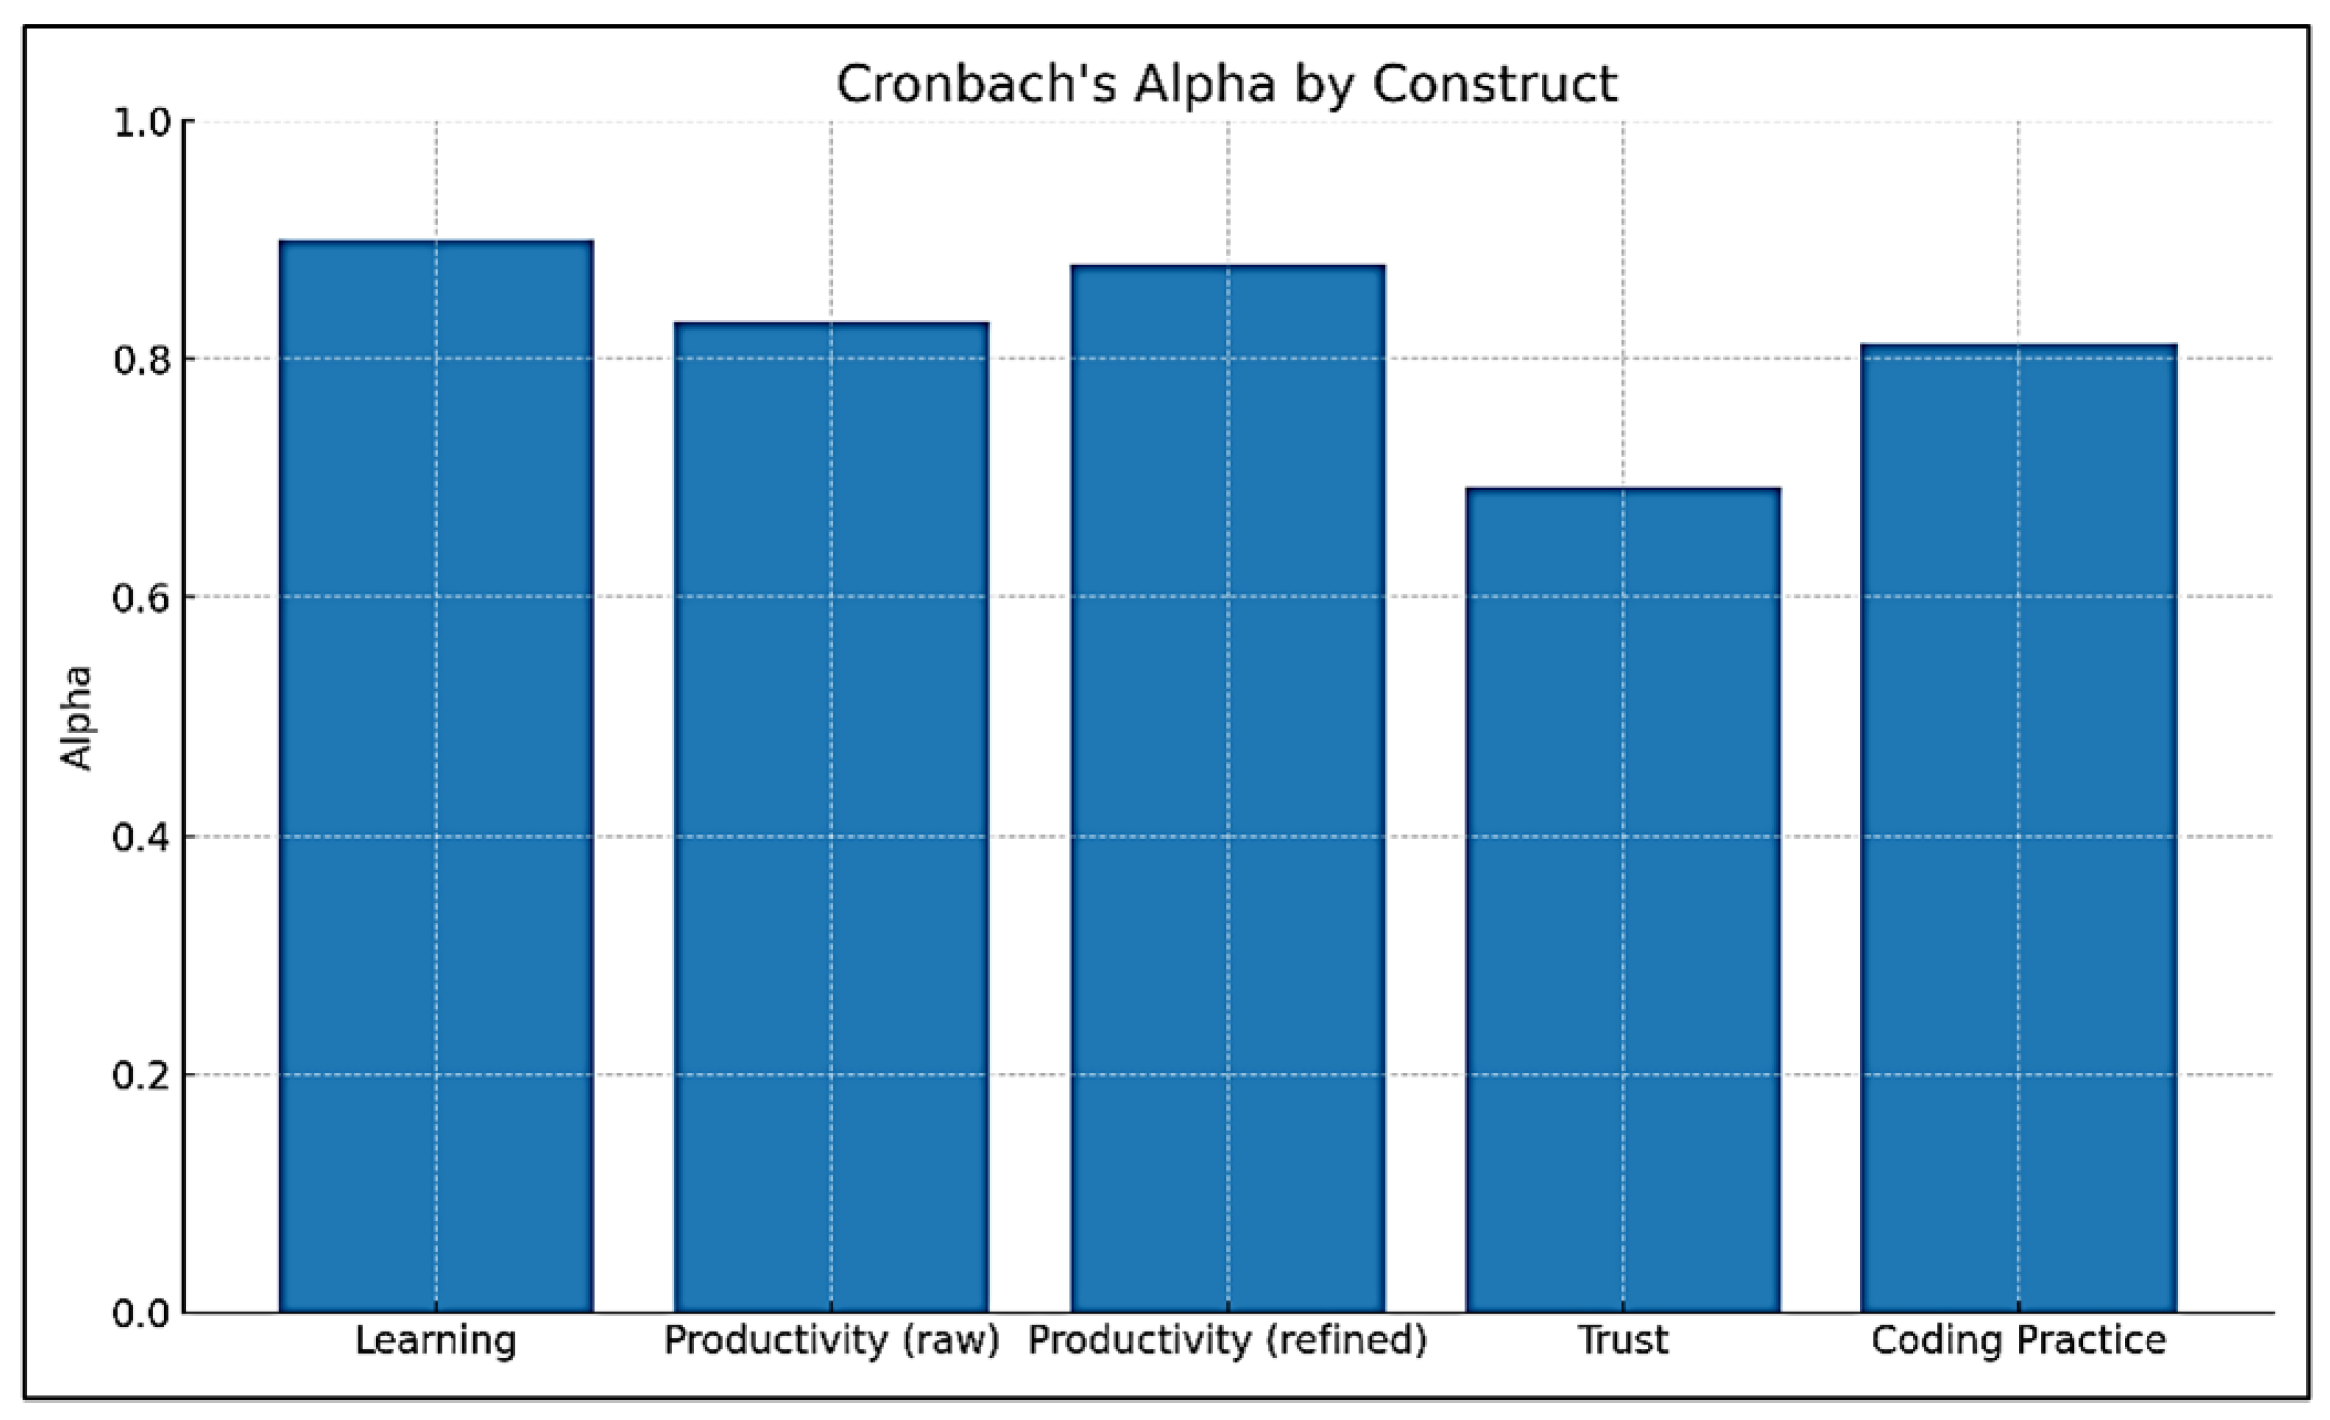
Internal consistency was evaluated with Cronbach’s alpha for each construct. With the original item sets, alpha coefficients were Learning α = 0.900, Productivity α = 0.832, Trust α = 0.692, and Code of Practice α = 0.814, indicating excellent to good reliability for Learning, Productivity, and Code of Practice, and borderline-acceptable reliability for Trust (appropriate for an exploratory study). Item diagnostics (item–total correlations and alpha-if-item-dropped) suggested that Productivity item 3 (“AI tools sometimes distract me or slow me down when coding.”) depressed scale consistency relative to other productivity items. Consistent with this diagnostic, the refined Productivity scale excluding Prod3 achieved α = 0.879, which we adopt for subsequent analyses. Trust was retained “as is,” since removing its weakest item yielded only a negligible improvement. Figure 2 summarizes the Cronbach’s alpha reliability scores across constructs.

3.6. Construct Refinement (Productivity)

The Productivity construct initially included five indicators targeting speed, debugging time, workload management, and focus on higher-level design. The negatively worded Prod3 behaved differently from the other items (largest alpha gain if dropped). To enhance reliability while preserving construct coherence, we removed Prod3 and computed the Productivity score as the mean of the remaining four items. This refinement does not change the construct’s substantive interpretation (efficiency and focus benefits in coding) and yields a more internally consistent measure ( α = 0.879 , up from 0.832). A reverse-coding was applied to check the influence on Cronbach’s alpha value. Accordingly, the item was reverse-coded (P3-R) and the reliability analysis was re-estimated using all five productivity items (P1, P2, P3-R, P4, P5). In this specification, Cronbach’s alpha was α = 0.658 (N = 248), indicating relatively low internal consistency despite correct reverse-coding. For comparison, we also re-ran the reliability analysis using the original five items without reverse-coding, which yielded a higher alpha ( α = 0.832 ). However, this configuration is methodologically inappropriate because it mixes positively and negatively worded items without alignment of scale direction and therefore does not represent a valid reliability estimate. As a result, we then examined the scale excluding item 3, resulting in a four-item productivity scale (P1, P2, P4, P5). This specification yielded the highest and most coherent internal consistency ( α = 0.879 , N = 248). Inspection of item behavior indicated that item 3—whether reverse-coded or not—did not align well with the remaining items, which focus on efficiency, time savings, task management, and cognitive focus. Conceptually, Productivity item 3 captures perceived distraction or slowdown, reflecting a cognitive cost of AI use rather than productivity gains.

3.7. Validity Checks (Exploratory Structure)

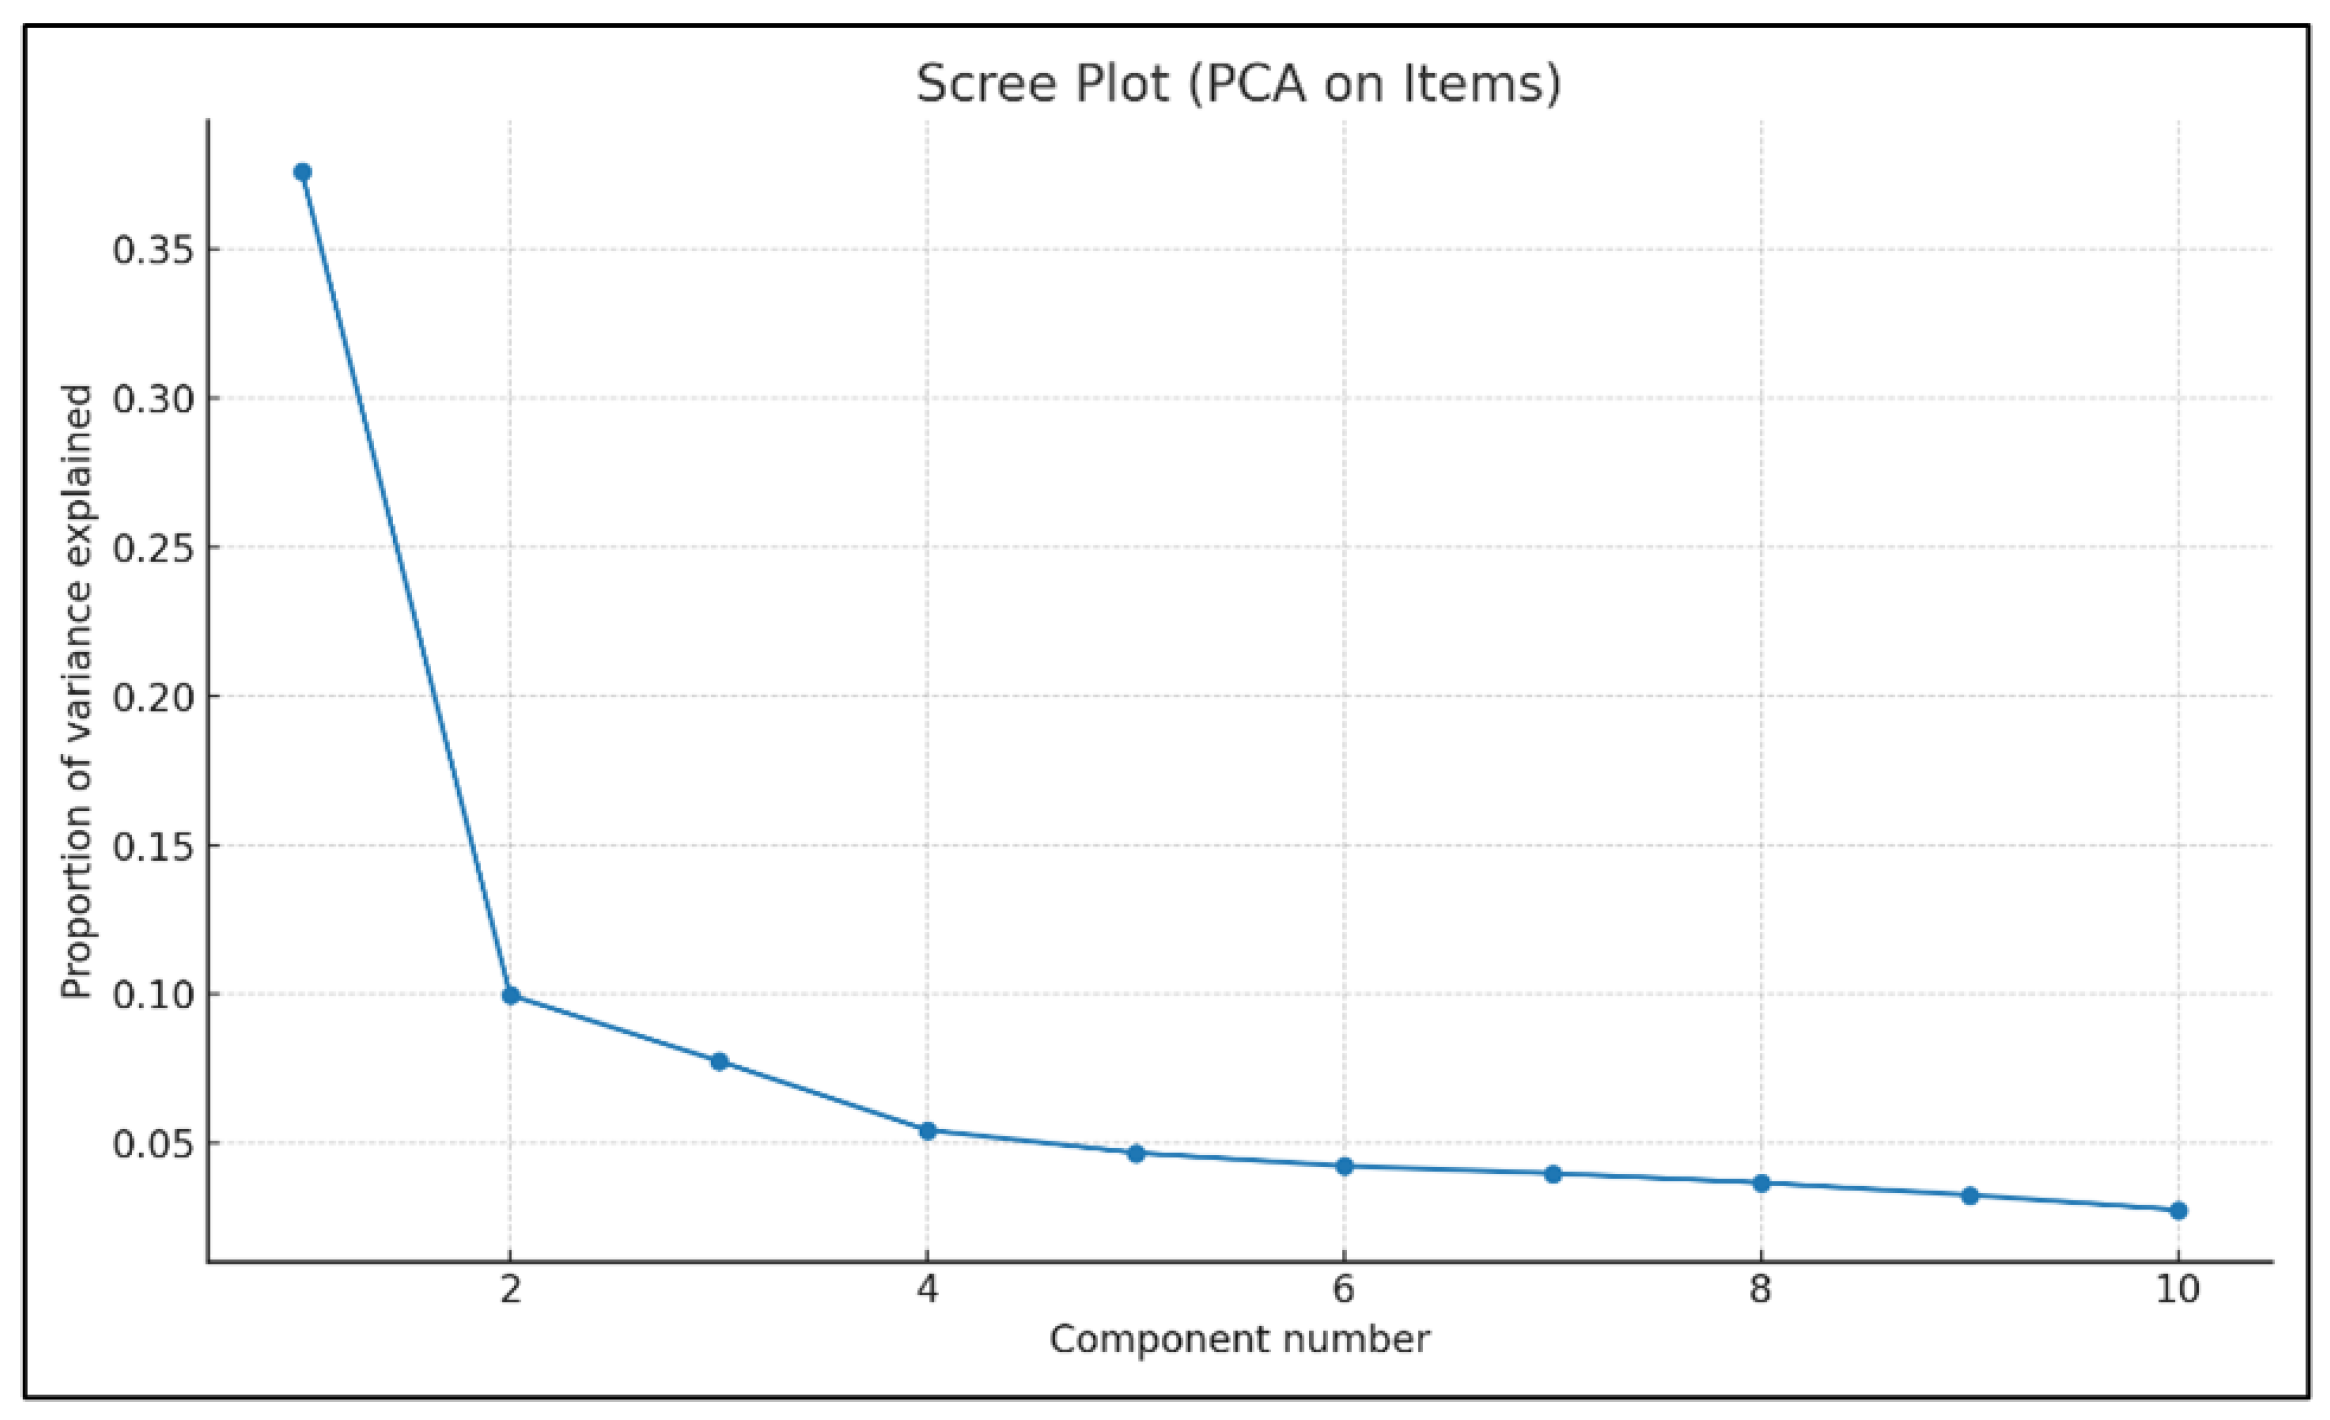
As an exploratory validity check, we performed a principal components analysis (PCA) on all items after applying the refinement described above (i.e., with Productivity excluding Prod3). Items were standardized, and the scree plot and component loadings were examined. The leading components explained a substantial portion of the variance, and the highest-loading items corresponded to their intended constructs (Learning, Productivity, Trust, and Code of Practice). These results support the questionnaire’s underlying four-dimensional structure at an exploratory level. The scree plot and component loadings are reported in Figure 3. While the findings are consistent with a four-factor interpretation, formal confirmatory factor analysis (CFA) would be required for confirmatory validation.

3.8. Distribution of Construct Scores

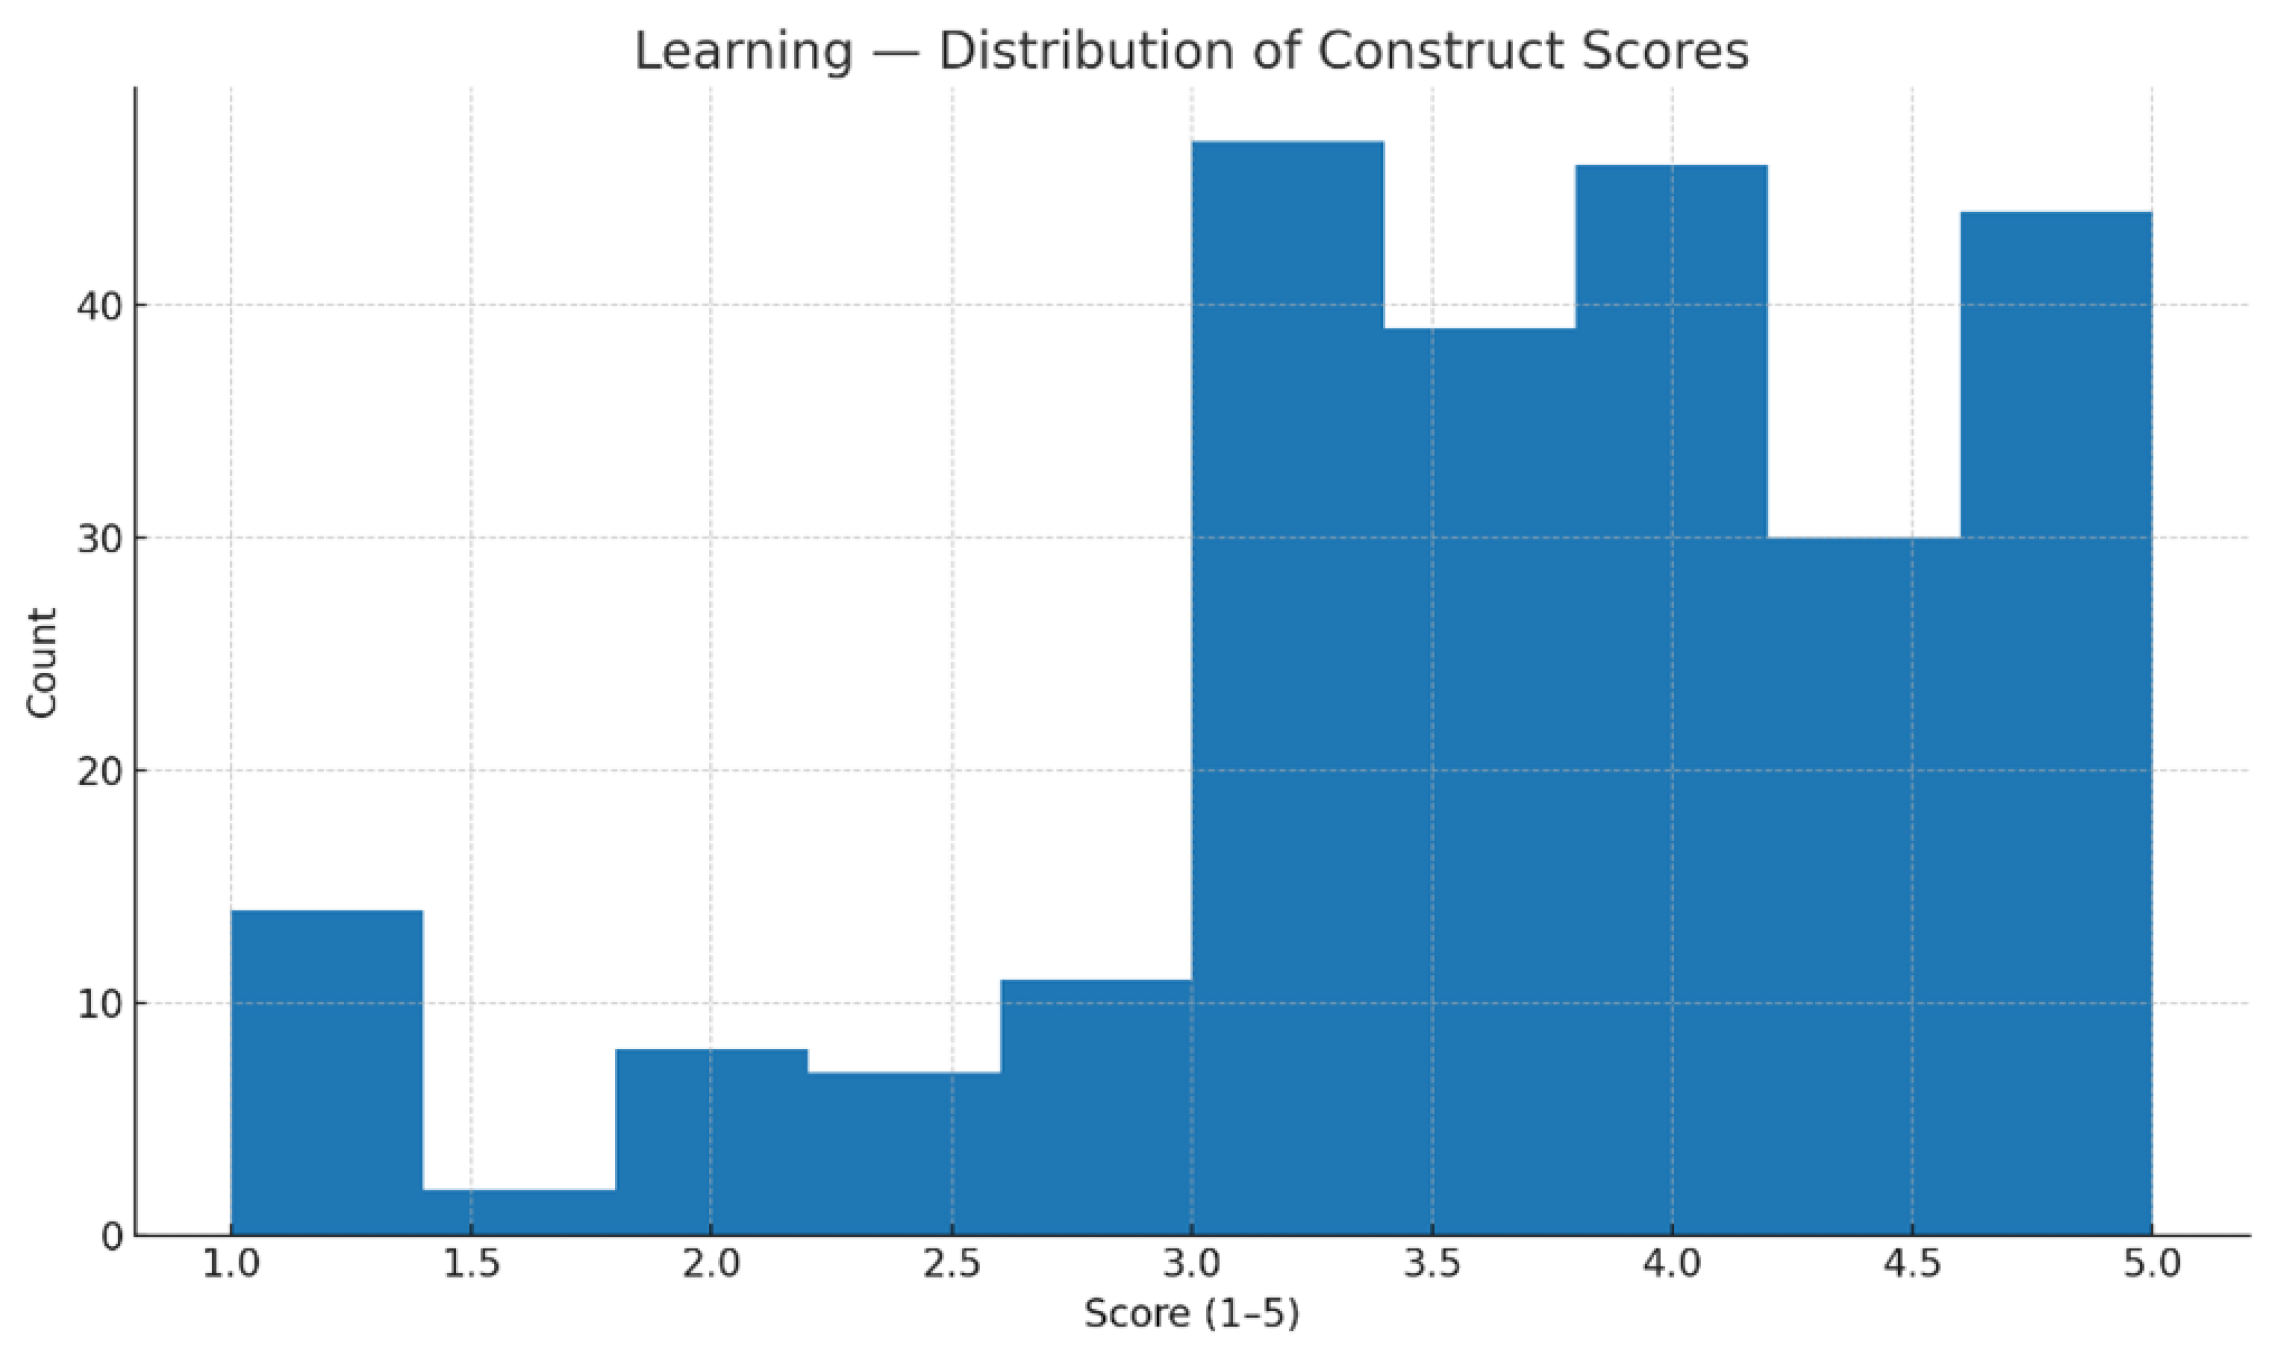
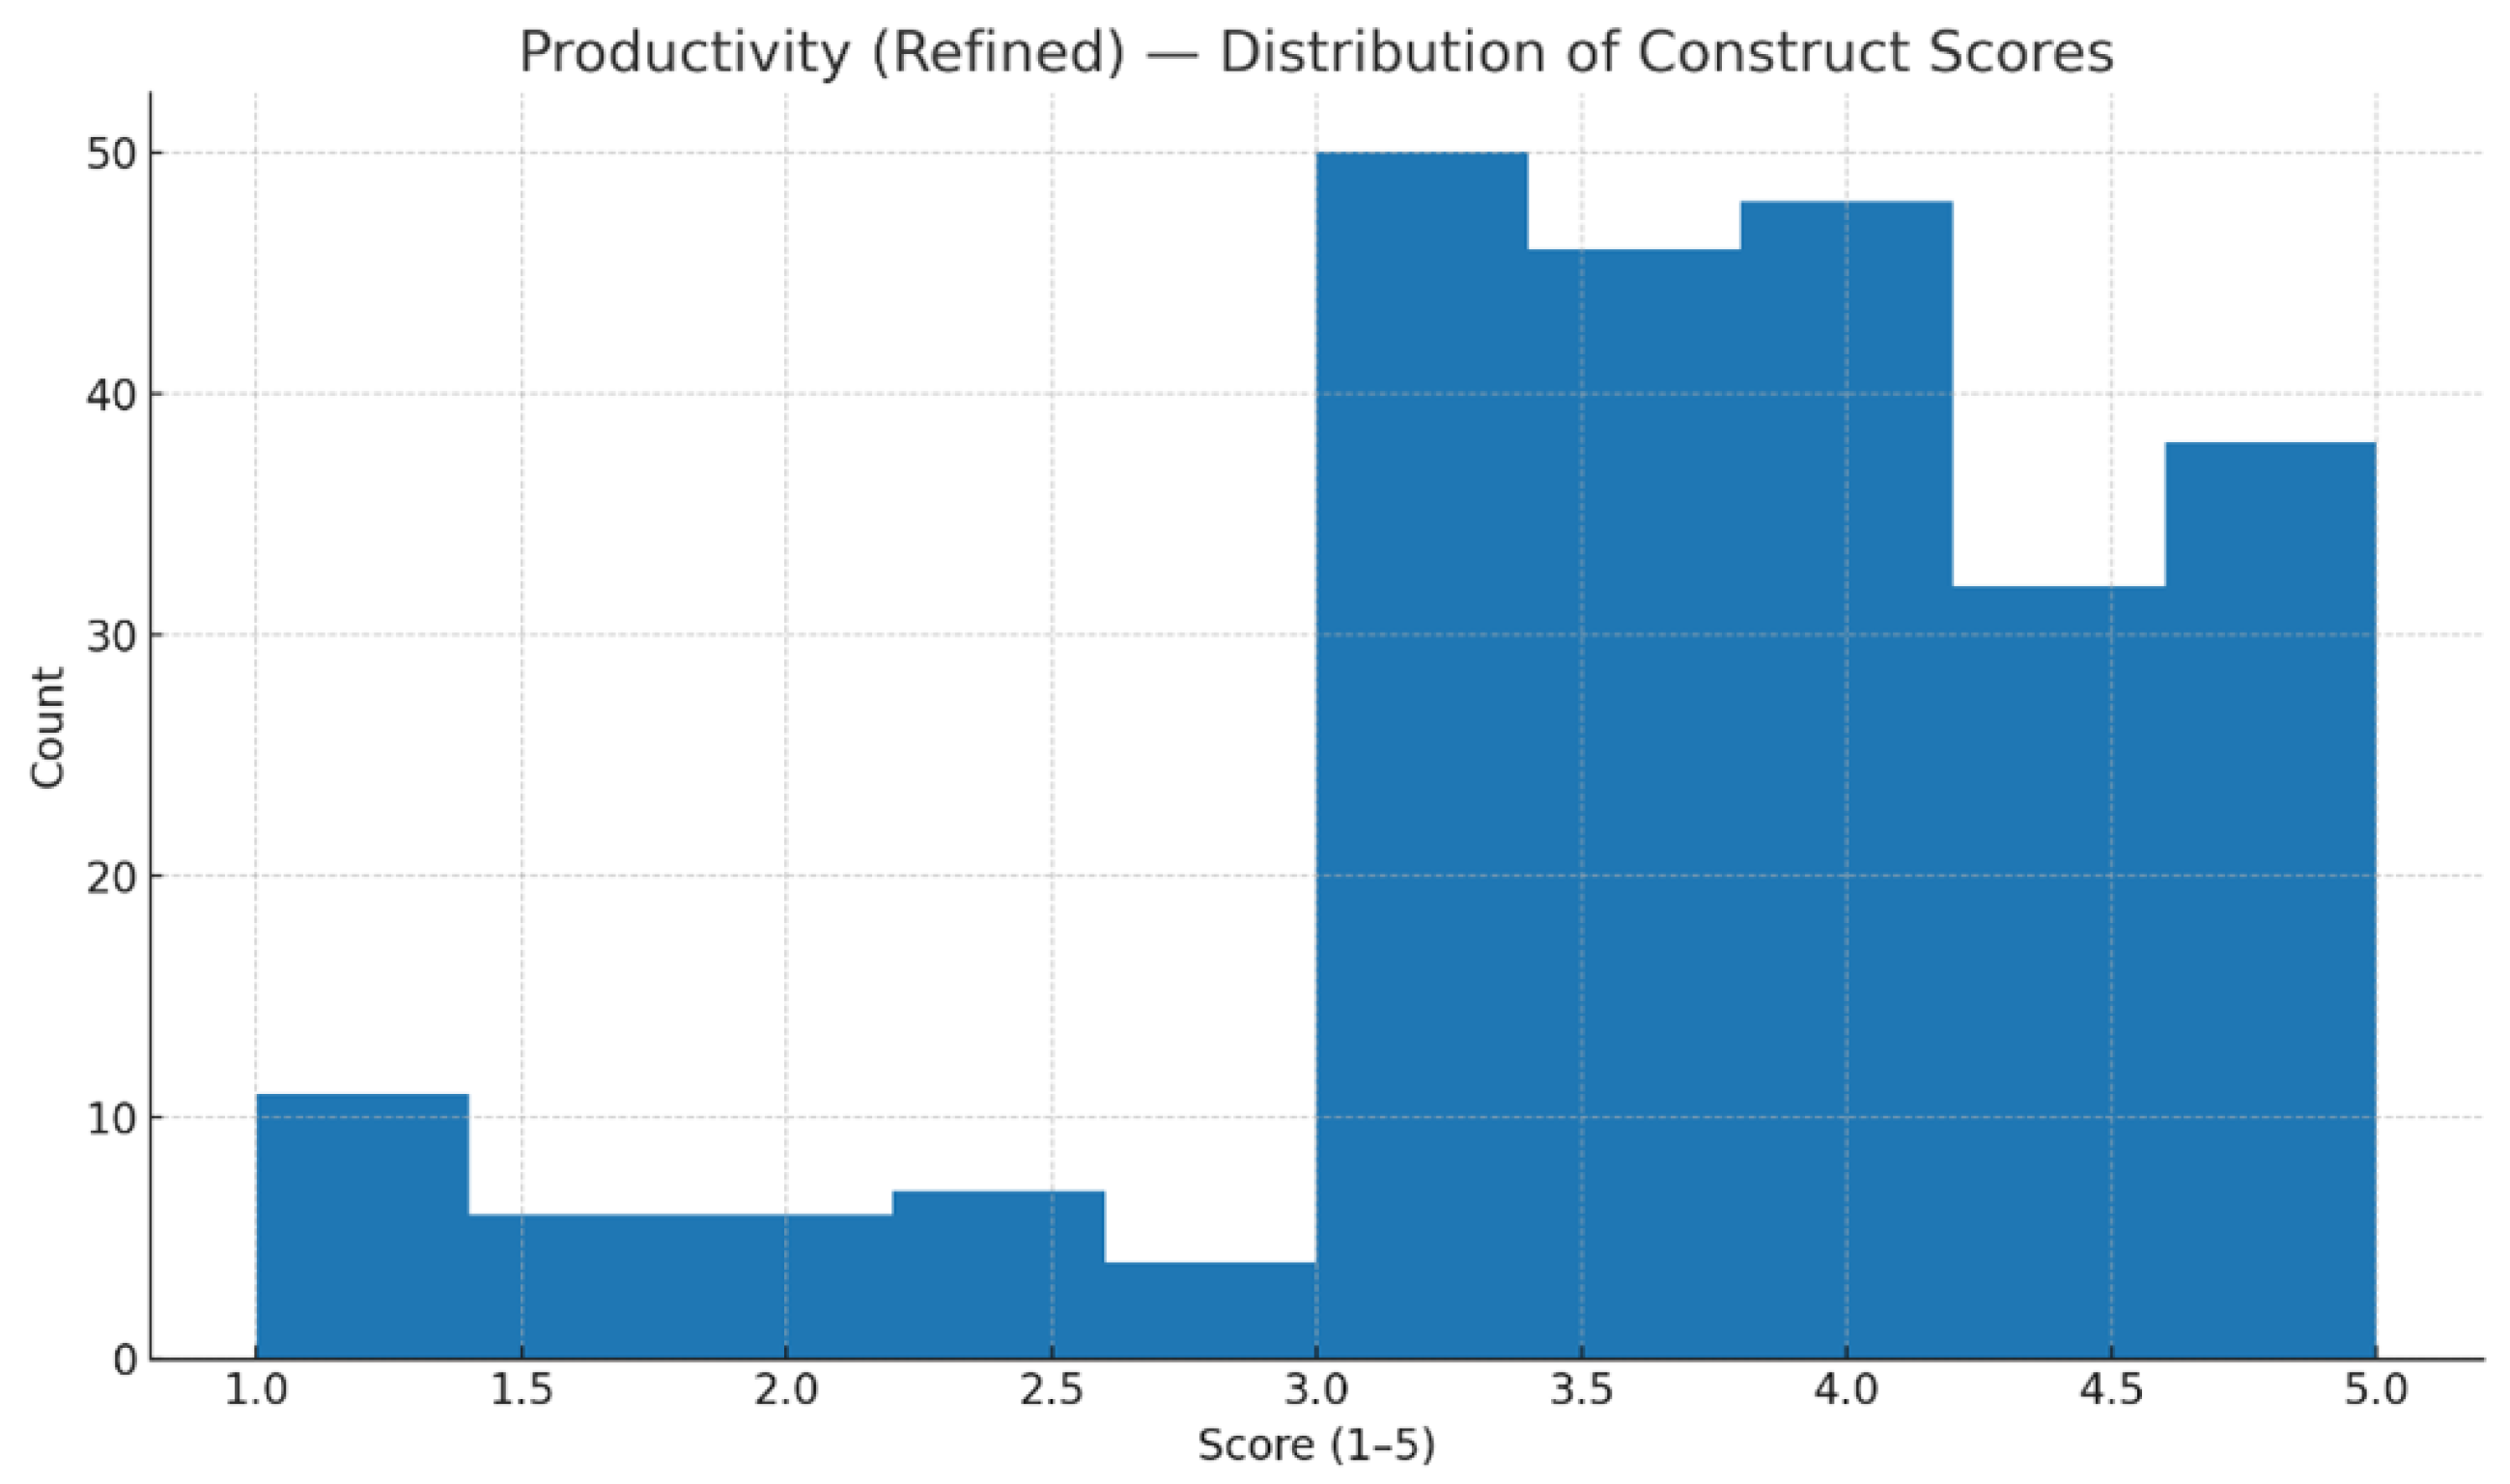
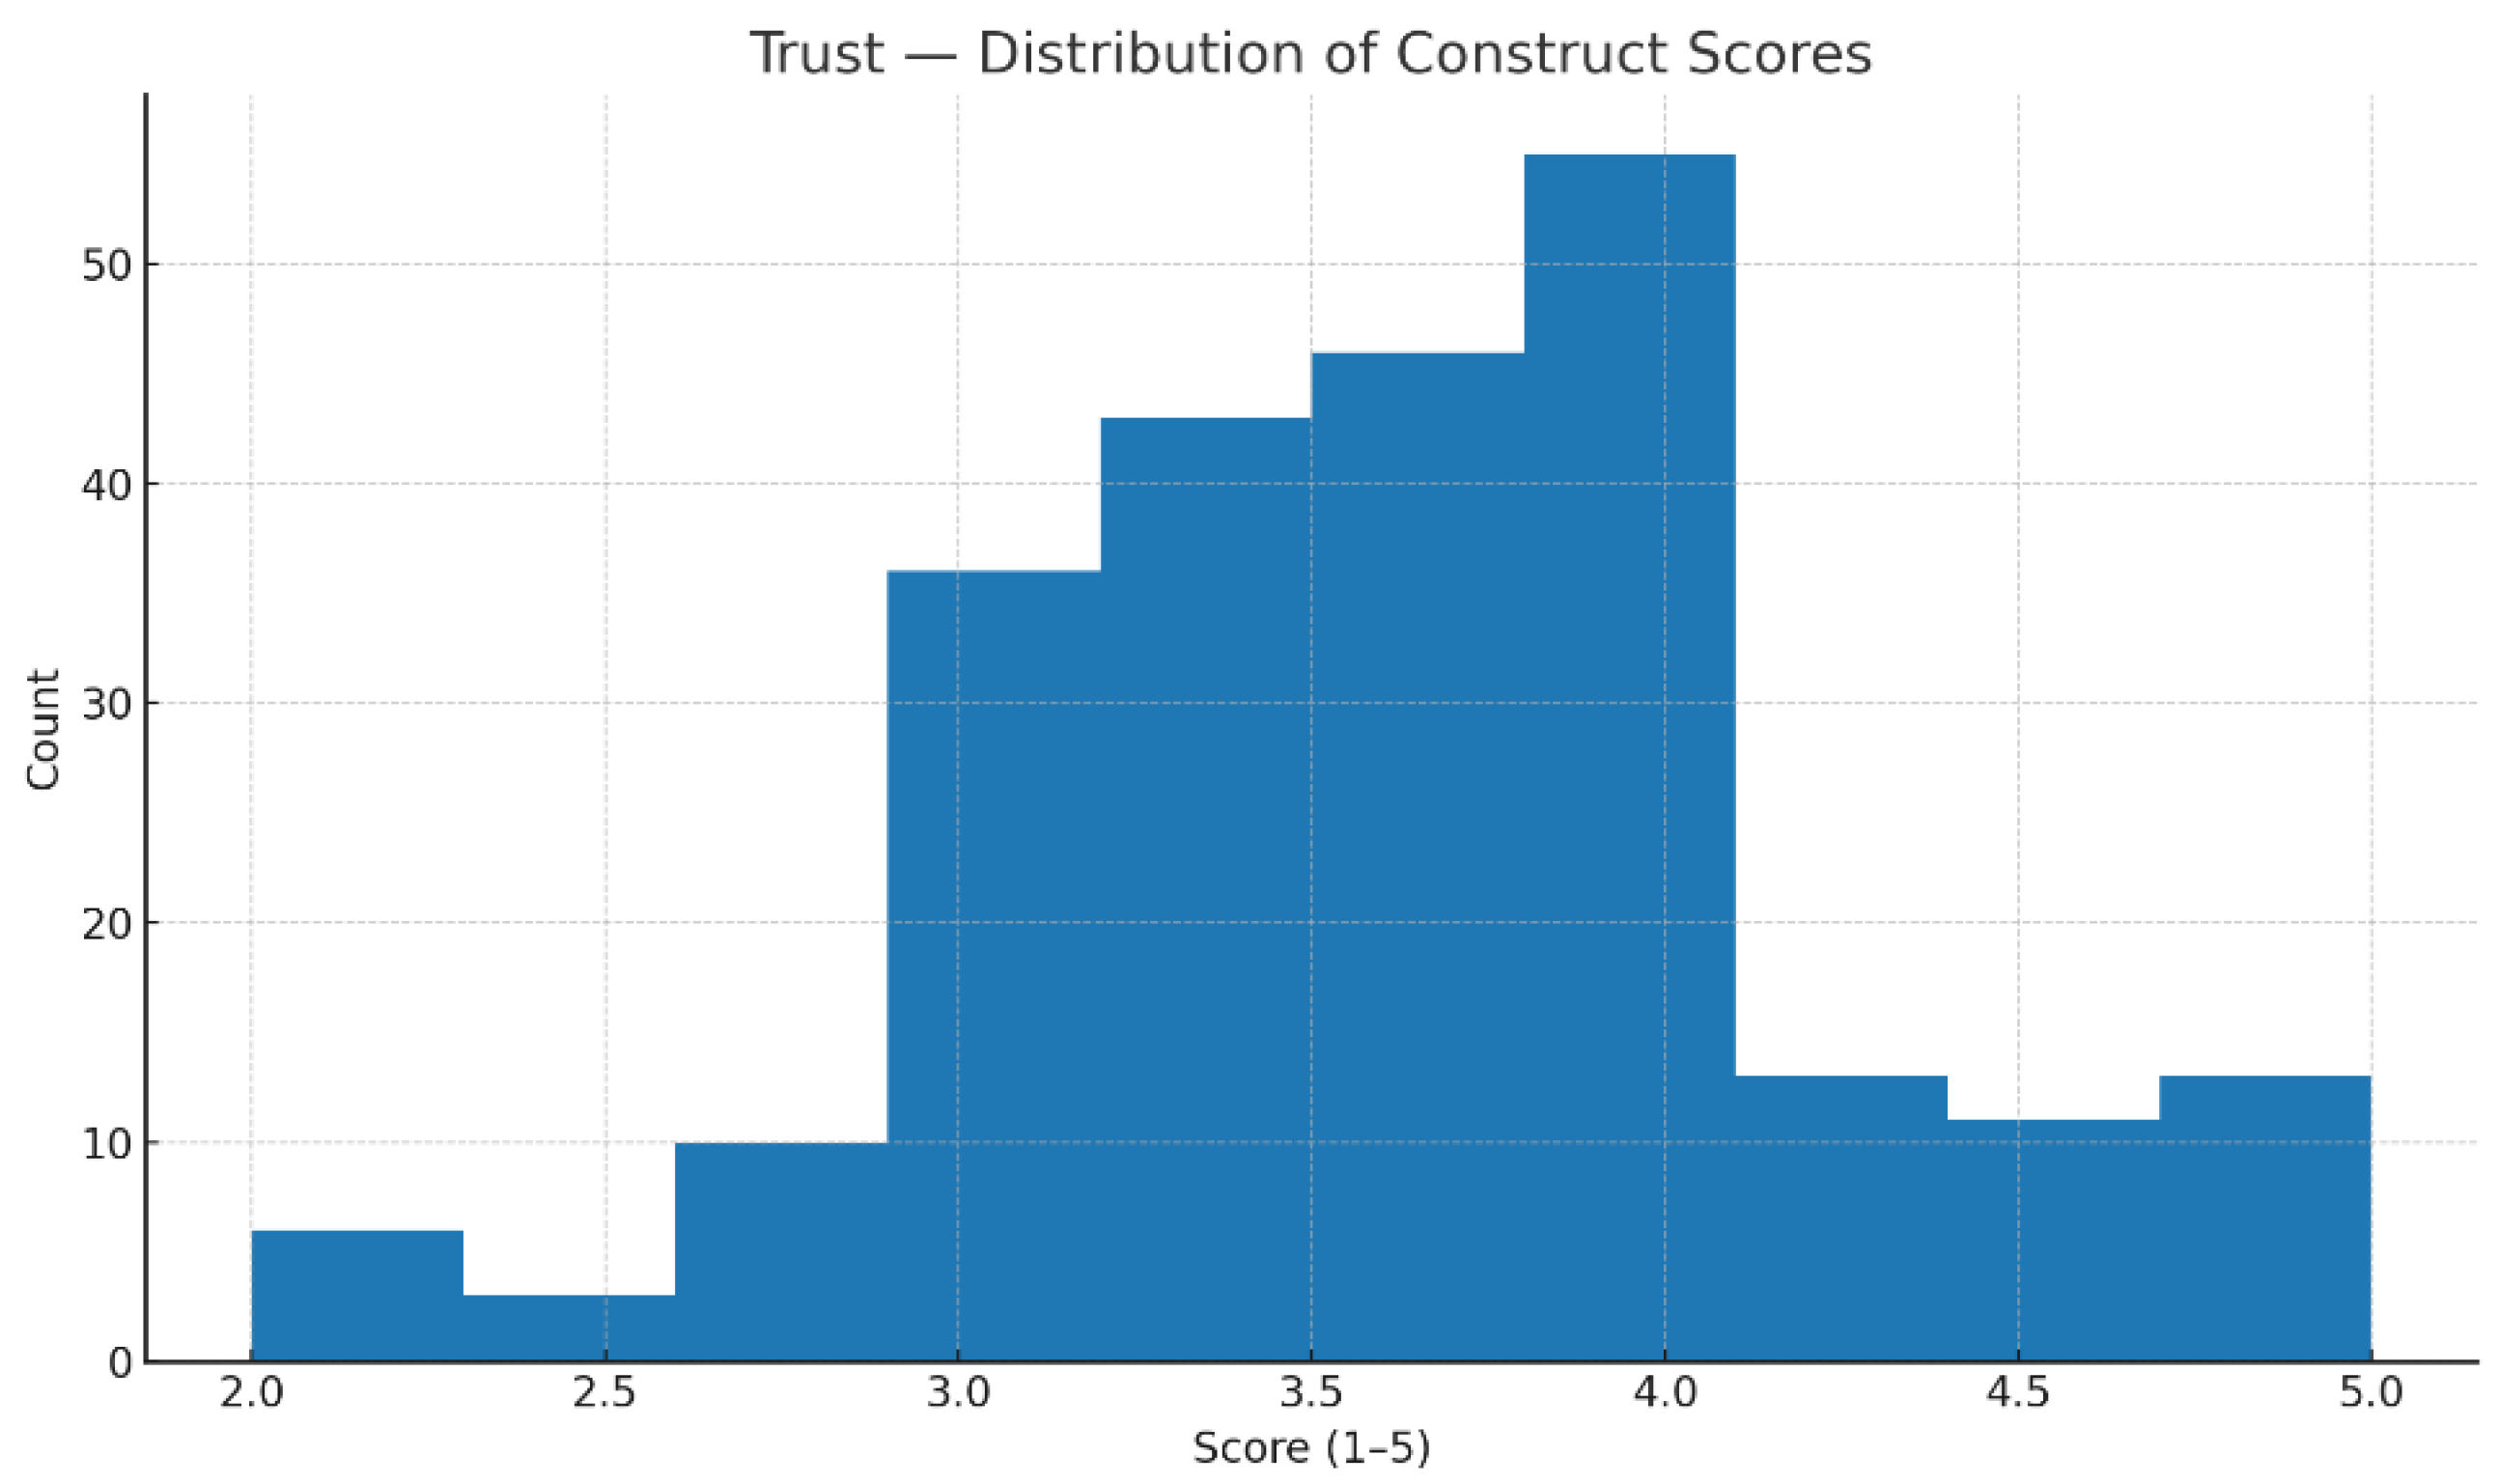
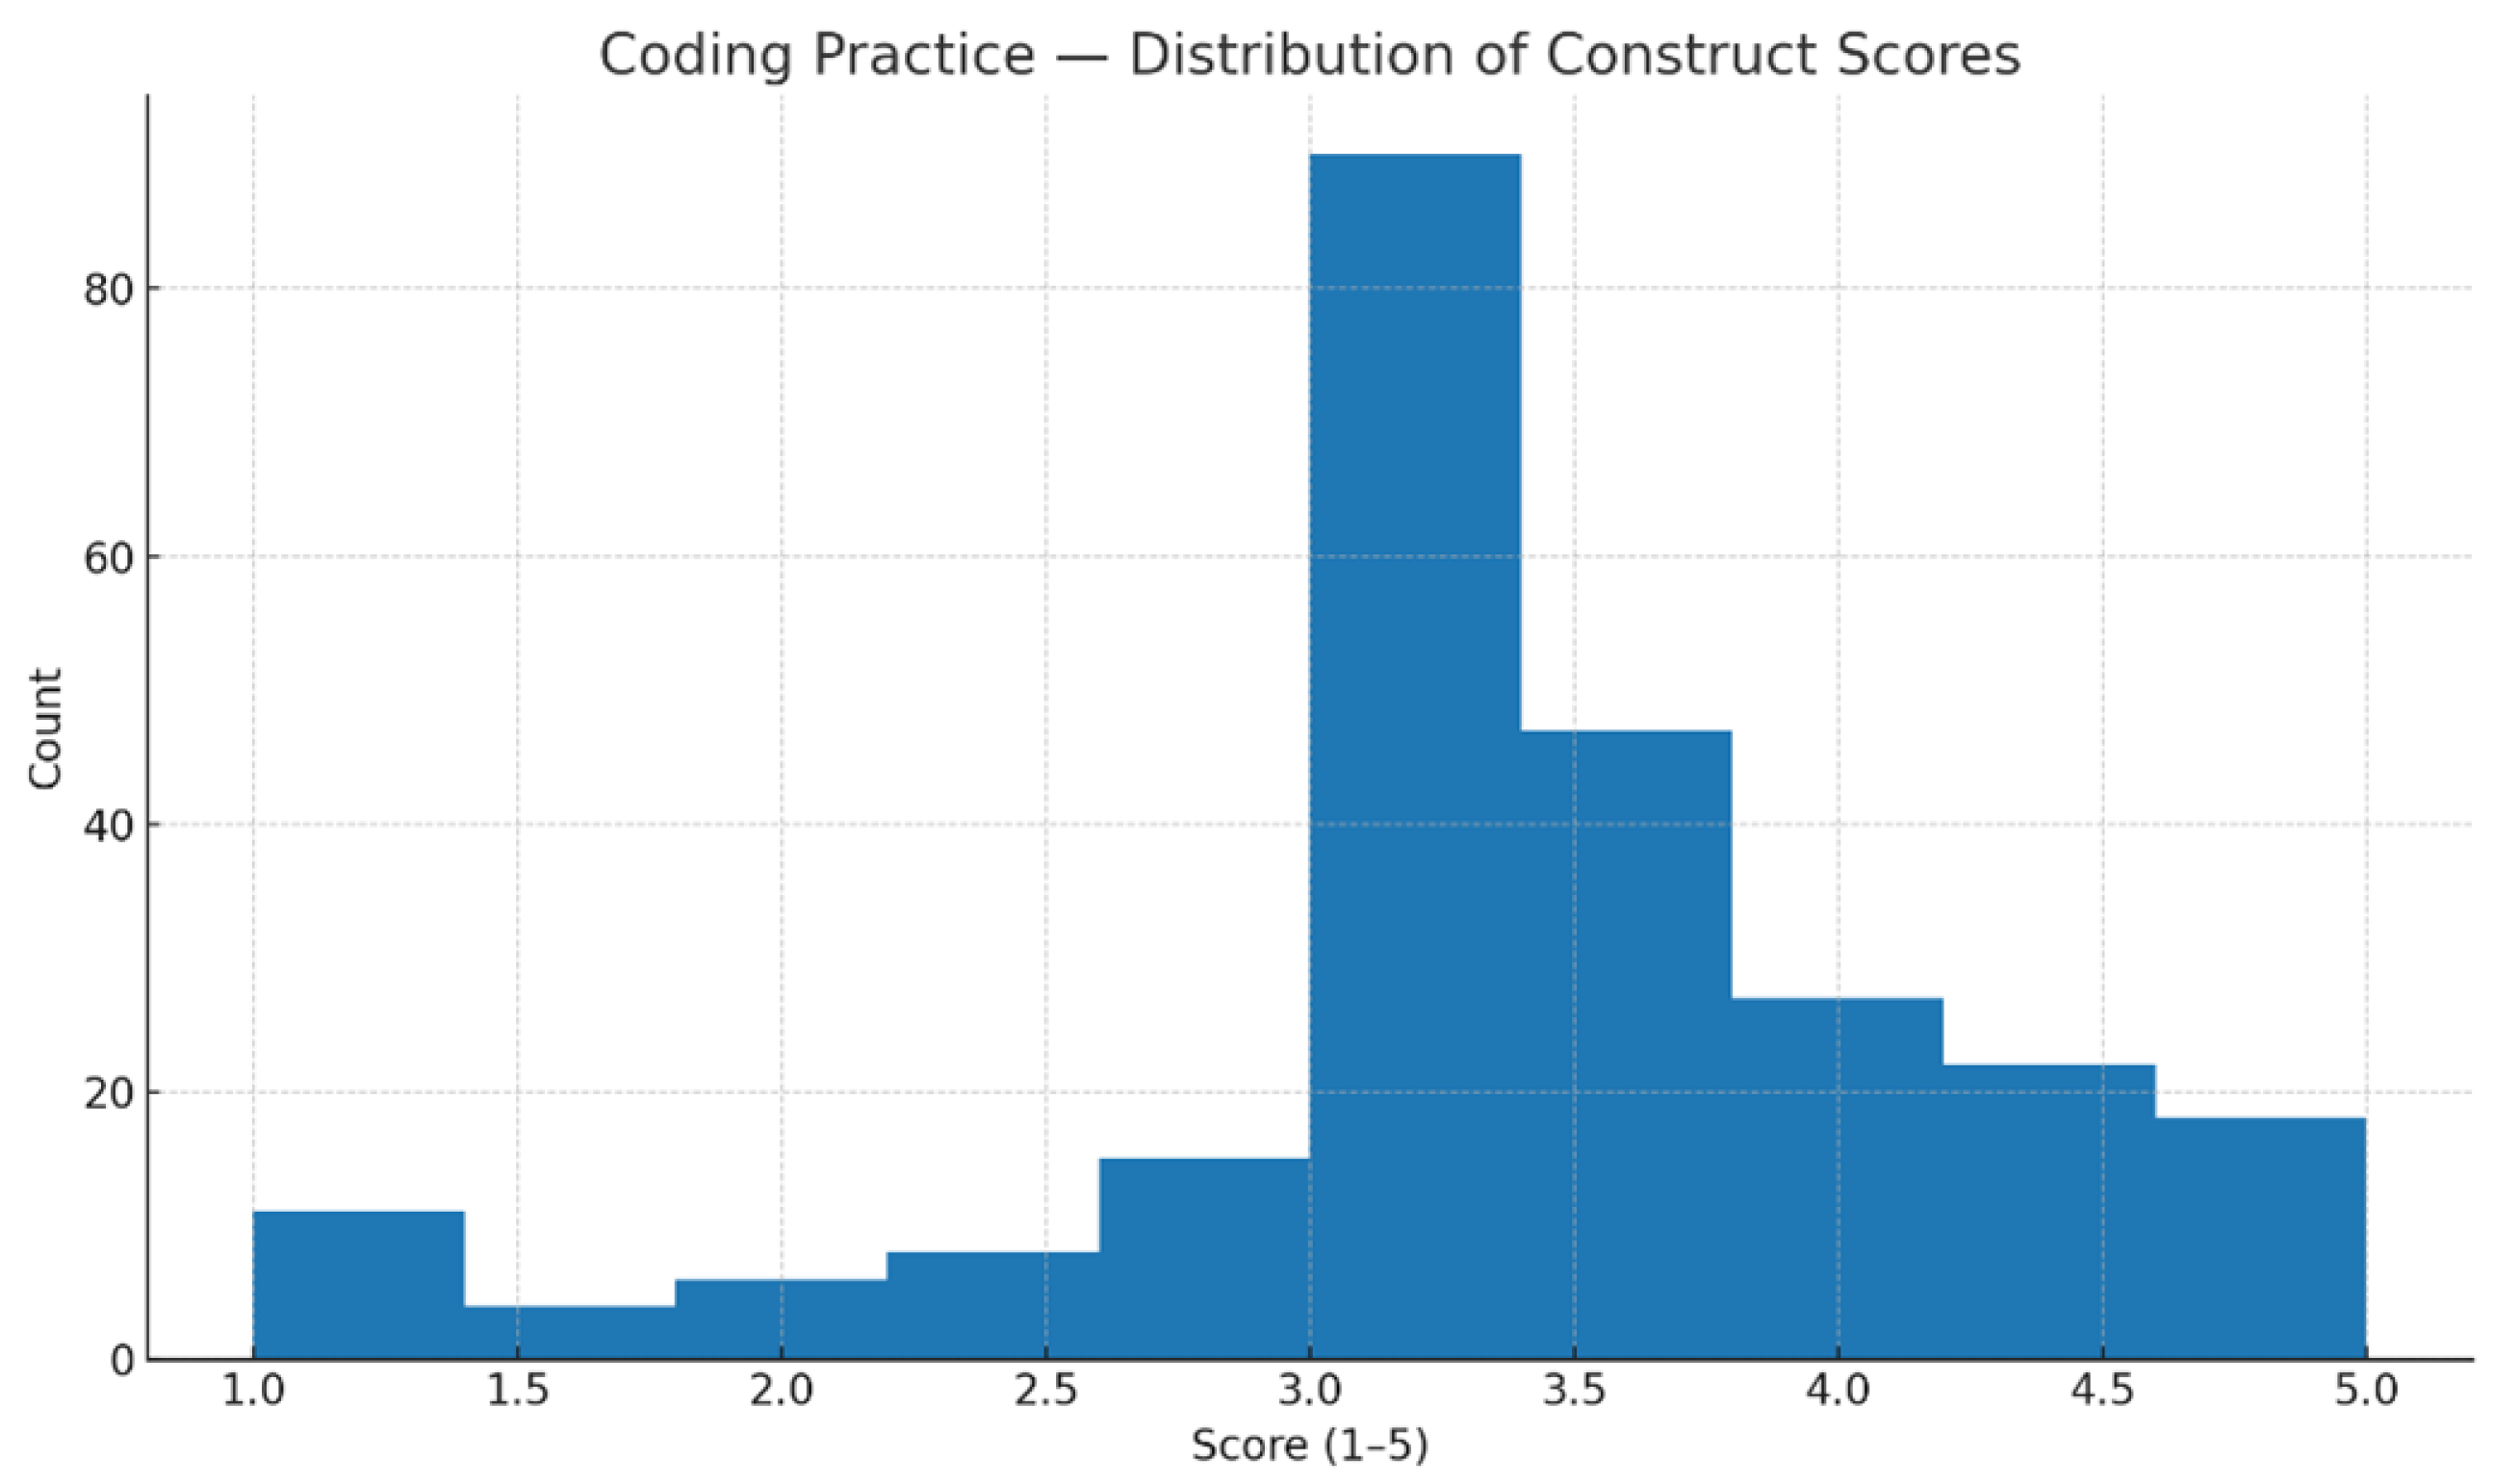
The distribution of construct scores was examined to provide an overview of participants’ perceptions across the four measured dimensions: Learning, Productivity, Trust, and Code of Practice. Figure 4, Figure 5, Figure 6 and Figure 7 present the histograms of the mean scores for each construct (1 = Strongly Disagree; 5 = Strongly Agree).
For Learning, scores were generally high, clustering toward the upper end of the scale. The distribution shows a strong positive skew, with the majority of respondents reporting values between 4 and 5, indicating widespread agreement that AI coding assistants enhanced understanding, knowledge retention, and problem-solving skills.
For Productivity (refined scale, excluding the negatively worded Prod3), the distribution also leaned toward higher scores, though it exhibited slightly greater spread than Learning. Most participants rated their productivity benefits from AI assistance between 3.5 and 5, suggesting that while the efficiency and workflow support were valued, some respondents held more neutral views.
The Trust scores displayed the widest variation among the constructs. While a substantial proportion of participants expressed moderate to high trust in AI-generated solutions (scores around 3.5–4.5), the distribution also revealed a noticeable portion of responses at the mid-point or below, reflecting a more cautious or critical stance toward AI outputs.
For Code of Practice, scores followed a moderately high distribution, with most values falling between 3.5 and 4.5. This pattern suggests that while AI use has influenced coding habits and approaches for many participants, opinions remain somewhat mixed, especially on items addressing potential over-reliance, ethics, and changes to long-term skills.
Collectively, the score distributions indicate generally favorable perceptions toward AI’s role in learning and productivity, tempered by measured trust and awareness of its potential impact on Code of Practice.

3.9. Normality Testing

To assess whether the construct scores followed a normal distribution, tests of normality were conducted for Learning, Productivity, Trust, and Code of Practice. The null hypothesis ( H 0 ) of these tests states that the data are normally distributed, while the alternative hypothesis ( H 1 ) indicates the data deviate from normality.
Results from both the Kolmogorov-Smirnov and Shapiro-Wilk tests showed significant p-values (all p < 0.001 ), rejecting the null hypothesis of normality across all four constructs. Specifically, Shapiro-Wilk statistics indicated deviations for Learning ( W = 0.945 , p < 0.001 ), Productivity ( W = 0.950 , p < 0.001 ), Trust ( W = 0.956 , p < 0.001 ), and Code of Practice ( W = 0.970 , p < 0.001 ). These results confirm that none of the constructs were normally distributed (Table 2).
Accordingly, correlations and group comparisons used non-parametric tests. For RQ6, we used multiple regression with bootstrap confidence intervals.

3.10. Data Analysis

All analyses were conducted using SPSS (version 31) and verified with Python (version 3.14.0) for reproducibility. The analysis proceeded in several stages:
  • Data Screening and Cleaning: Recoding Likert-scale responses into numeric format; checking for missing values, outliers, and inconsistent responses; computing standardized construct scores (Z-scores).
  • Reliability and Validity: Cronbach’s alpha was calculated for each construct to assess internal consistency; the Productivity scale was refined by excluding one item (Prod3). Before examining latent structure, the suitability of the data for factor analysis was assessed using principal component analysis (PCA). The Kaiser–Meyer–Olkin measure indicated meritorious sampling adequacy (KMO = 0.879), and Bartlett’s test of sphericity was significant, χ 2 ( 190 ) = 1918.857 , p < 0.001 , confirming that the correlation matrix was factorable. PCA yielded five components with eigenvalues greater than one, collectively explaining 64.35% of the total variance. Examination of the scree plot further supported this component structure. Rotated component loadings demonstrated coherent item groupings with strong primary loadings and minimal cross-loadings. PCA was used as an exploratory data-reduction technique and does not represent a latent factor model. Table 3 reports the KMO measure and Bartlett’s test of sphericity, confirming that the correlation matrix was suitable for factor analysis. The full rotated component matrix is provided in Table 4. The full EFA pattern matrix is reported in Table 5.
    Exploratory factor analysis was conducted using principal axis factoring with Promax rotation to examine the latent structure of the measurement instrument. Sampling adequacy was confirmed by a Kaiser–Meyer–Olkin value of 0.879 and a significant Bartlett’s test of sphericity ( χ 2 ( 190 ) = 1918.857 , p < 0.001 ). The analysis yielded a five-factor solution explaining approximately 53% of the shared variance. The pattern matrix demonstrated strong primary loadings for all items on their respective constructs, with minimal cross-loadings. Factor correlations were moderate, indicating related yet distinct constructs and supporting the use of oblique rotation.
    Finally, missing data were limited and primarily affected the Trust construct, resulting in a reduced sample size (N = 214) for those analyses. Item-level missingness rates were low and showed no systematic association with participant characteristics. Analyses were therefore conducted using a complete-case approach. Sensitivity checks using simple imputation yielded substantively similar results, indicating that findings were robust to missing-data handling.
  • Normality Testing: Kolmogorov–Smirnov and Shapiro–Wilk tests revealed non-normal distributions for all constructs ( p < 0.001 ); therefore, non-parametric statistical tests were applied.
  • Descriptive Statistics and Visualization: Frequencies, means, and standard deviations were reported for demographics and constructs; histograms and stacked bar charts illustrated distribution patterns across academic levels and programming experience.
  • Inferential Statistics: Spearman’s rank correlation was used to examine relationships among Learning, Productivity, Trust, and Code of Practice; Mann–Whitney U tests were applied for two-group comparisons (e.g., Basic vs. Expert programmers); Kruskal–Wallis tests were used for comparisons across multiple academic levels (e.g., Years 1–4). Multiple regression analysis with bootstrap confidence intervals was employed to examine predictors of Productivity, given its robustness to moderate non-normality.

3.11. Methodological Rationale and Alignment with Research Questions

Our design and analyses were chosen to match (a) the construct nature of the variables; (b) the cross-sectional, perception-focused scope of the study; and (c) distributional properties of the data.
The research questions (RQ1–RQ6) concern students’ perceptions, usage patterns, and relationships among latent constructs (Learning, Productivity, Trust, and Code of Practice). A cross-sectional questionnaire is appropriate for capturing these self-reports at scale and for estimating associations and predictive relations among constructs in authentic settings.
Each construct was measured with multiple Likert items, then aggregated to scale scores to reduce item-level noise and increase reliability. Internal consistency was assessed with Cronbach’s alpha, and an exploratory PCA provided evidence that items load on the intended dimensions (exploratory structure). Removing the negatively worded Productivity item (Prod3) was justified by item diagnostics (higher alpha-if-item-dropped) and the known tendency of reverse-worded items to introduce method variance.
Normality tests indicated non-normal composite distributions. Accordingly, we used Spearman’s ρ for monotonic associations among constructs (RQ1), and Kruskal–Wallis for multi-group comparisons (RQ4) and (RQ5), which make weaker distributional assumptions and are suitable for ordinal/approximately continuous Likert composites. Tests of normality (Kolmogorov–Smirnov and Shapiro–Wilk) indicated significant deviations from normality across all construct scores ( p < 0.001 ). Consequently, non-parametric statistical methods were selected for correlation and group-comparison analyses, including Spearman’s rho, and Kruskal–Wallis tests. This approach aligns with established methodological guidance for analyzing Likert-scale composites under non-normal conditions.
RQ6 asks to what extent Learning, Trust, and Code of Practice predict Productivity. Multiple linear regression estimates unique contributions while adjusting for inter-correlations among predictors. With N = 248 and three predictors, sample size amply exceeds common rules-of-thumb for stable estimates. We checked multicollinearity (VIF < 2 ), and used bootstrap confidence intervals to mitigate residual non-normality of errors. Treating Likert composites as approximately continuous is widely supported when distributions are not severely skewed and scales contain multiple items.
Analyses were accompanied by (i) internal-consistency checks, (ii) distributional diagnostics, (iii) multicollinearity checks, and (iv) non-parametric corroborations where appropriate.
Table 6 summarizes the alignment between each research question (RQ1–RQ6), the study variables, and the corresponding analysis choices.

3.12. Ethical Considerations

This study received formal approval from the Institutional Review Board (IRB) of Yarmouk University (Reference number: IRB/2025/263). Participation was entirely voluntary, and informed consent was obtained from all respondents. Anonymity and confidentiality were assured, as no personally identifiable information was collected. Data were analyzed only in aggregate form to protect participants’ privacy, and this study complied with all institutional and international research ethics guidelines.

4. Results and Discussion

This section presents the results of the statistical analyses conducted to address the six research questions (RQ1–RQ6). We first report the correlations among the four main constructs—Learning, Productivity, Trust, and Code of Practice—followed by patterns of AI usage across programming experience and academic level. Next, we examine group comparisons, including differences between Basic and Expert programmers as well as across academic years. Finally, we present the regression analysis to evaluate the predictive relationships among the constructs, and conclude with a discussion of the implications of these findings.

4.1. Spearman Analysis

4.1.1. RQ1: Are There Significant Correlations Between Trust, Productivity, Learning, and Code of Practice in Human–AI Collaboration for Programming Education?

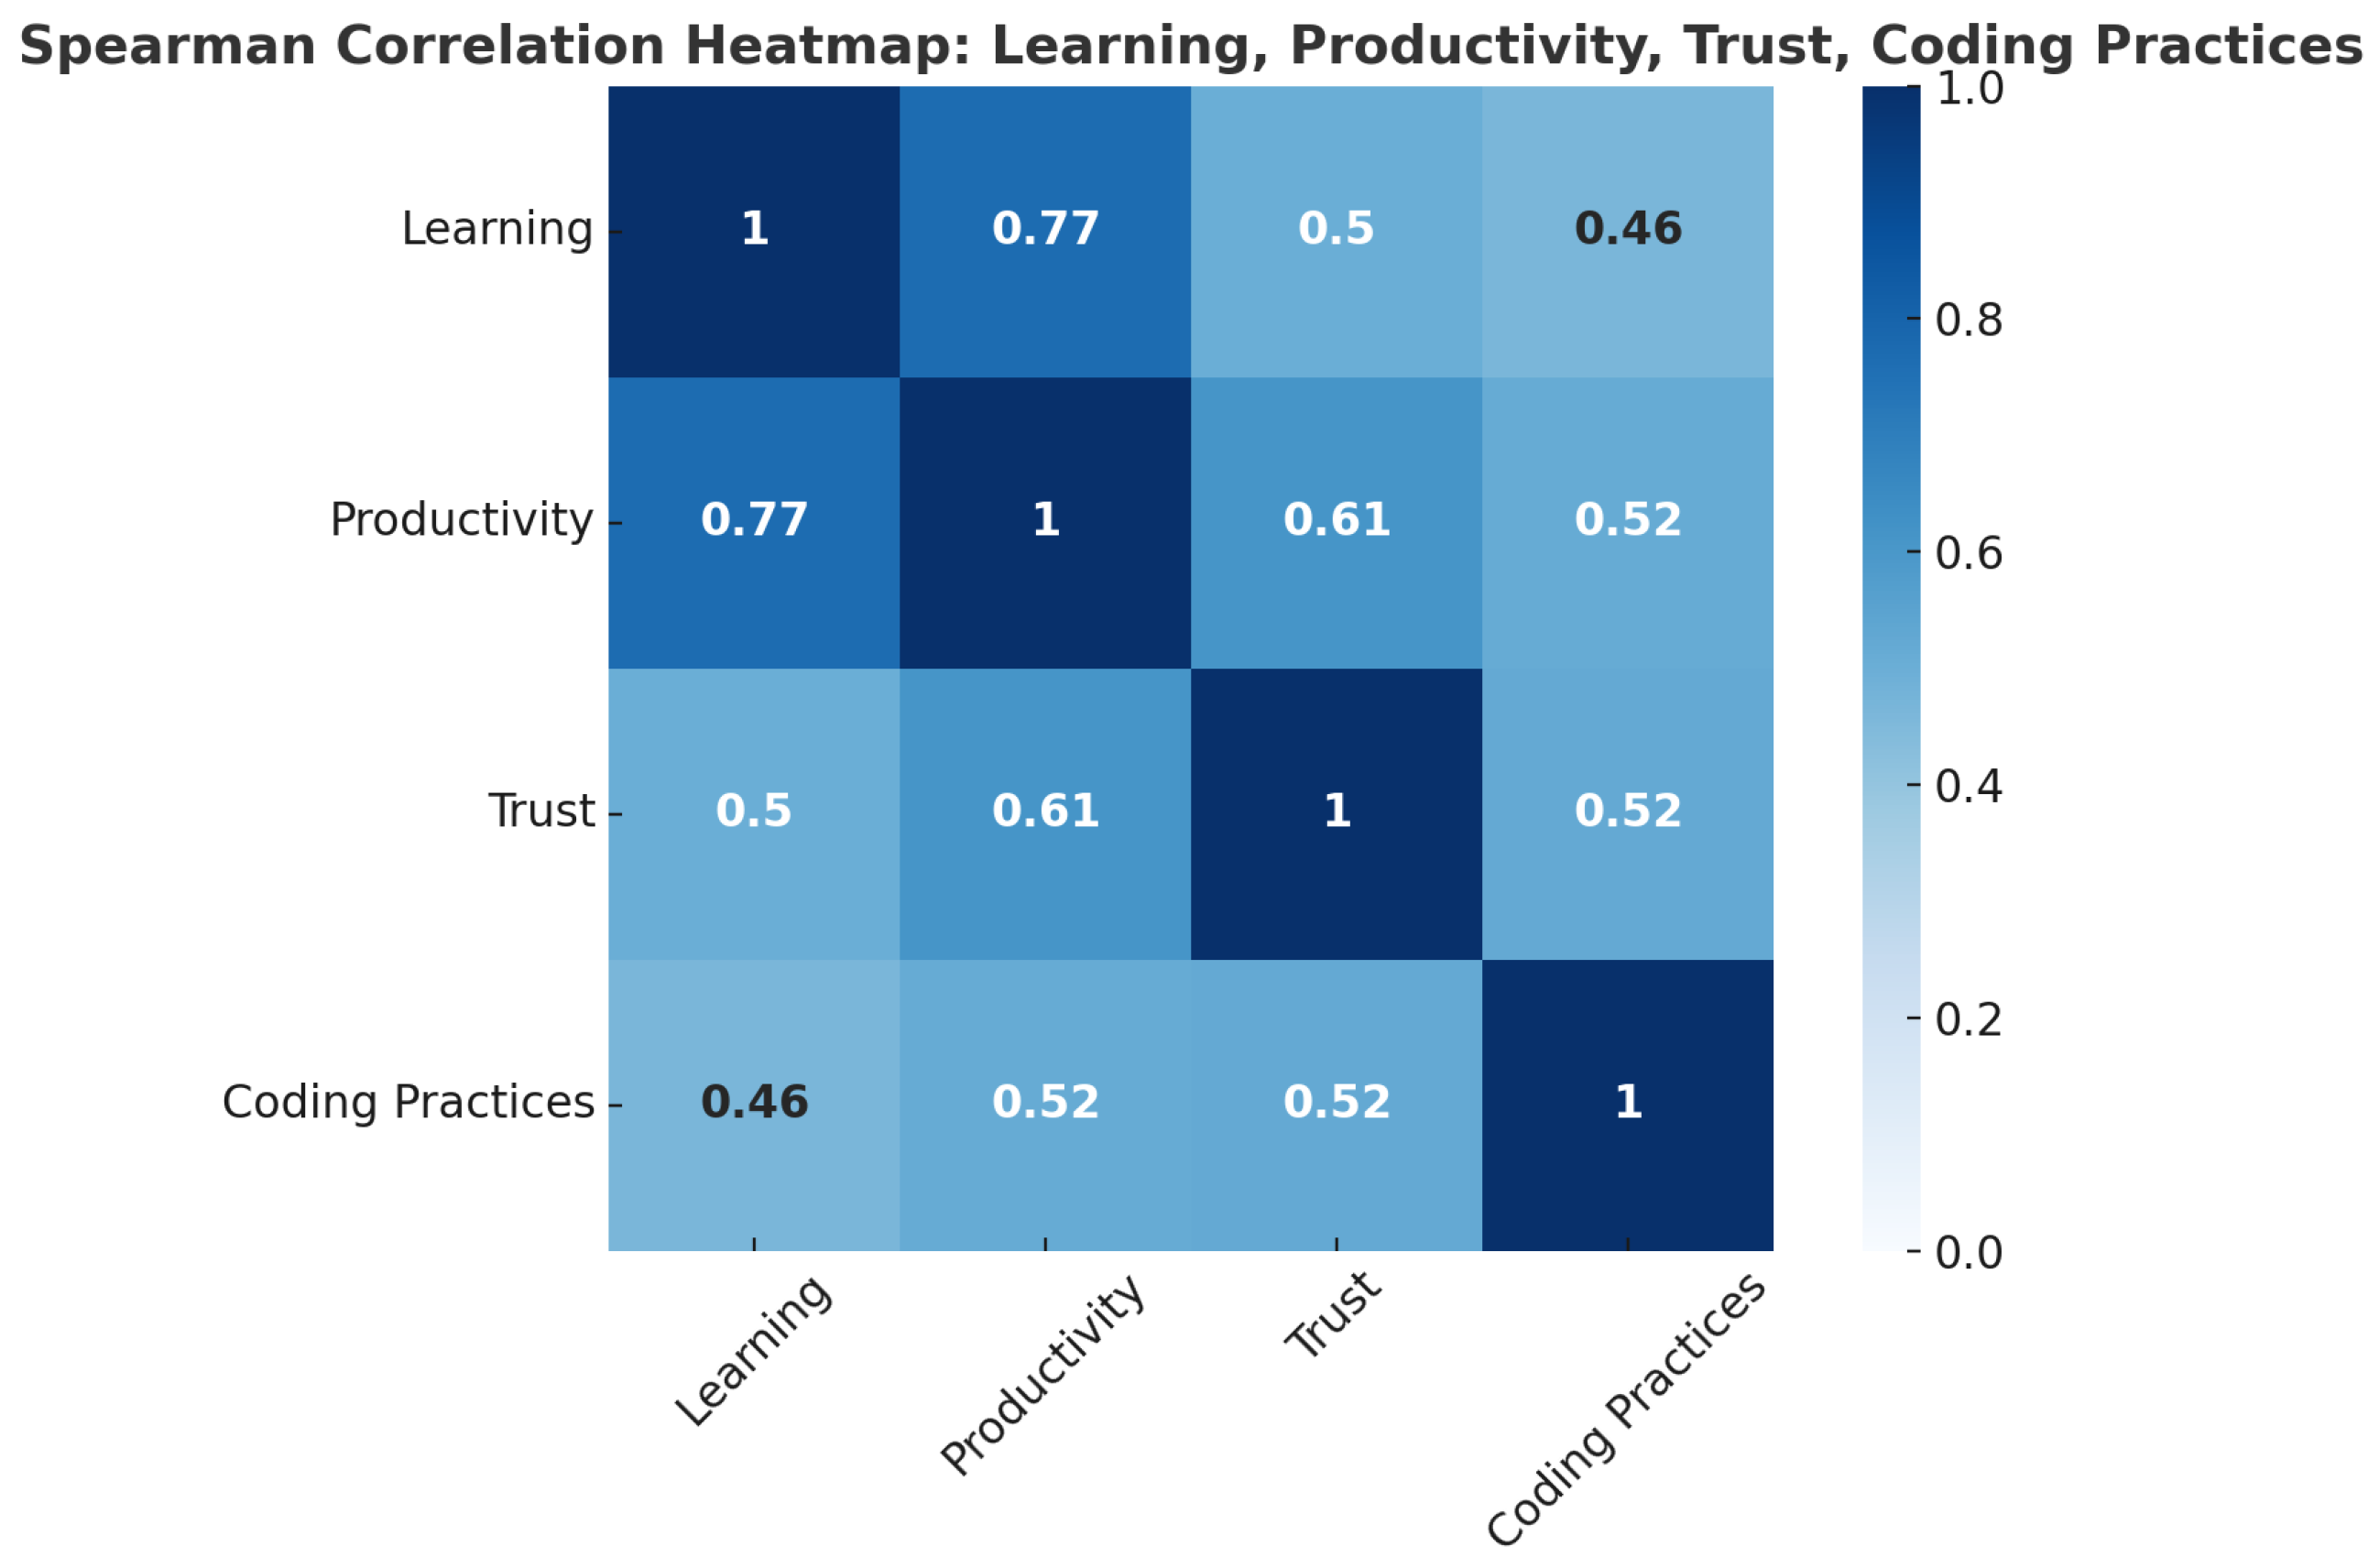
To examine the relationships among Learning, Productivity, Trust, and Code of Practice (RQ1), Spearman’s rank-order correlation was used because the construct scores did not follow normal distributions. The analysis identified positive and statistically significant associations among all constructs ( p < 0.001 ). Learning was strongly correlated with Productivity ( ρ = 0.769 ) and showed moderate correlations with Trust ( ρ = 0.501 ) and Code of Practice ( ρ = 0.462 ). Productivity was moderately to strongly related to Trust ( ρ = 0.611 ) and Code of Practice ( ρ = 0.515 ). Trust and Code of Practice were also positively correlated ( ρ = 0.521 ). Sample sizes varied slightly across analyses ( N = 214 –248) due to missing responses for some Trust items. Overall, the results indicate consistent relationships among learning perceptions, trust in AI tools, Code of Practice, and perceived productivity. These relationships are visualized in Figure 8.

4.1.2. RQ2: How Often Do Students Use AI Tools for Coding, and How Does This Relate to Their Experience or Academic Level?

The analysis of RQ2 revealed that most students reported using AI tools for coding regularly, with 61 students (24.6%) using them frequently and 59 students (23.8%) reporting usage in almost every coding session (“always”). This accounts for nearly half of the sample (48.4%). In contrast, 72 students (29%) used AI occasionally, while 38 students (15.3%) reported rare usage, and 18 students (7.3%) never used AI tools. This trend was especially pronounced among Basic (n = 111) and Intermediate (n = 118) programmers, indicating that AI serves as a critical guidance tool for learners still developing coding proficiency. In terms of academic level, juniors (87 students) and seniors (56 students) constituted the largest proportion of frequent users, suggesting that the increasing complexity of coursework drives greater reliance on AI assistance. By contrast, Expert programmers (19 students) and first-year students (25 students) represented smaller user groups, possibly due to higher independence in coding or limited exposure to advanced assignments, respectively. Overall, the findings suggest that AI tools are perceived as valuable aids for both learning and productivity, particularly among non-Experts at Intermediate academic stages. Programming experience levels in the sample are summarized in Table 7. Overall AI coding tool usage frequency is reported in Table 8. Participants’ academic levels are summarized in Table 9.
AI Usage by Programming Experience (with numbers)
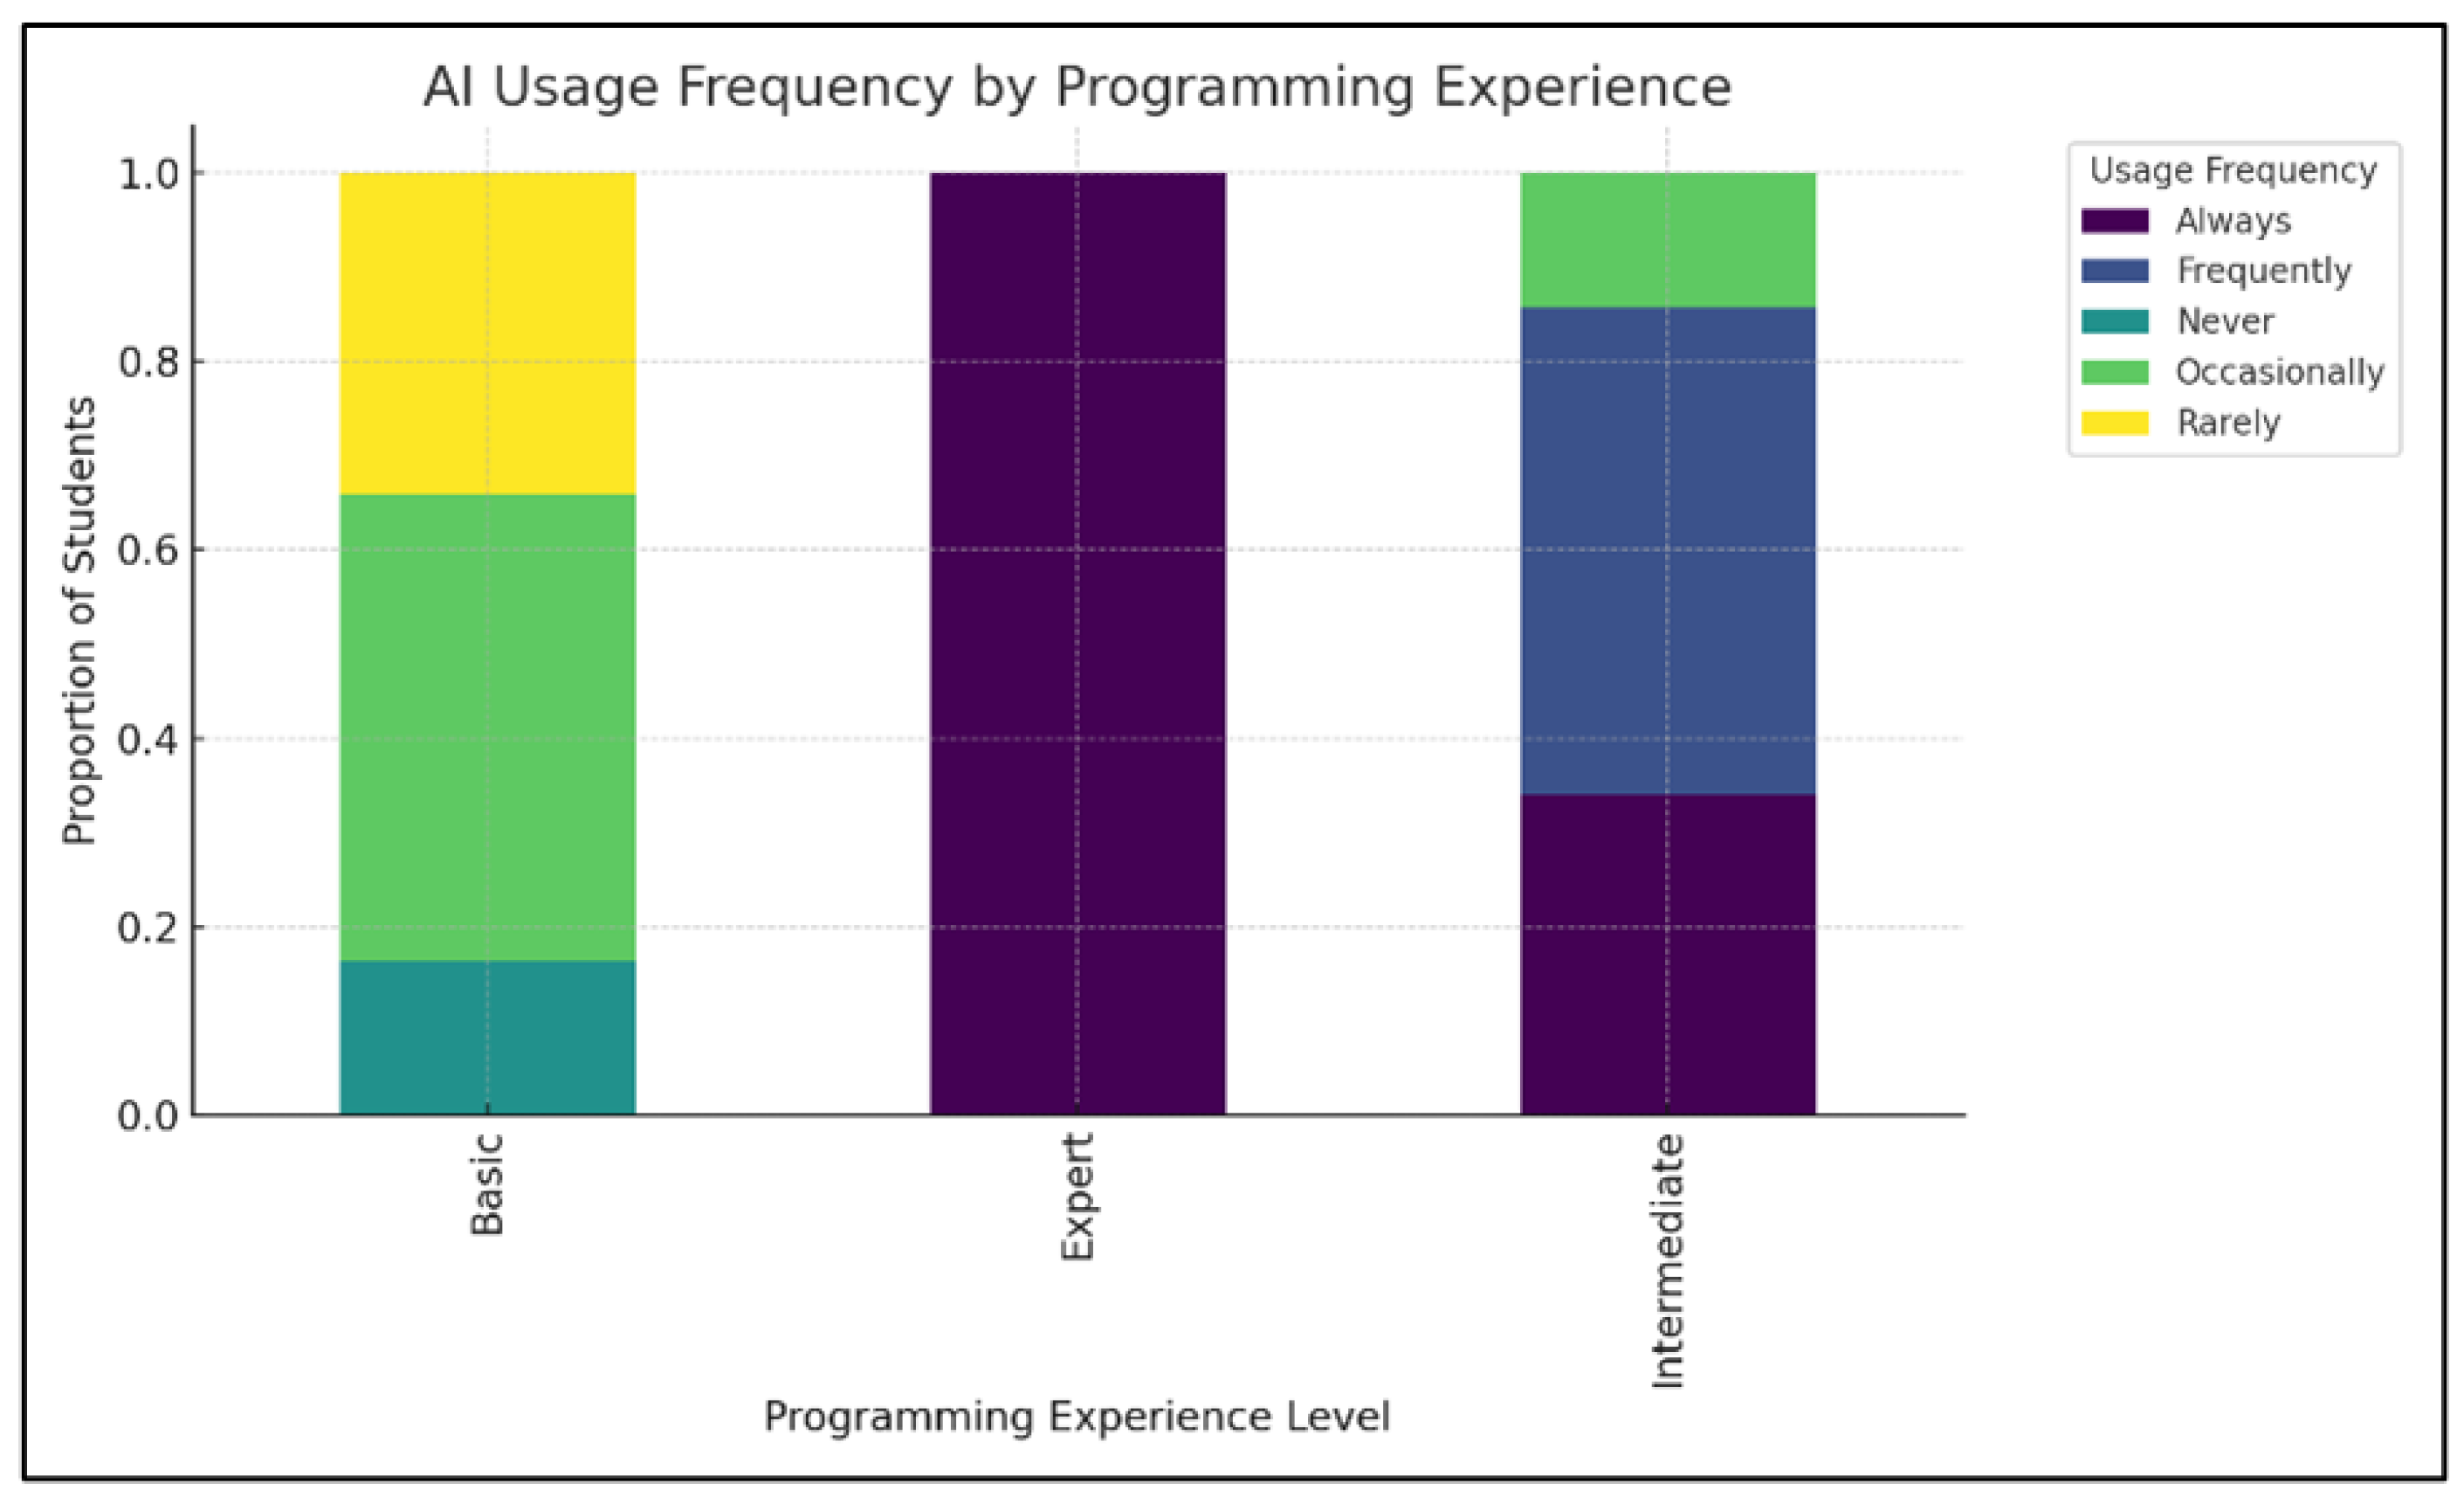
The stacked bar chart demonstrated that Basic programmers (n = 111) and Intermediate programmers (n = 118) form the bulk of AI tool users. Among Basic-level students, the largest share reported using AI occasionally (≈29%) or frequently (≈25%), while 23% reported always using AI tools. Intermediate students showed a similar but slightly higher pattern, with over 50% using AI either frequently (≈26%) or always (≈25%). In contrast, Expert programmers (n = 19) displayed a more balanced distribution, with a smaller proportion in the always category (≈16%) and more evenly spread across occasionally and frequently. These results highlight that non-Expert programmers (Basic and Intermediate combined, ≈92% of the sample) accounted for nearly all of the frequent and always usage, suggesting that AI tools serve primarily as supporting mechanisms for students still consolidating their coding expertise. As shown in Figure 9, the distribution of AI usage frequencies varies by programming experience.
AI Usage by Academic Level (Years 1–4 only, with numbers)
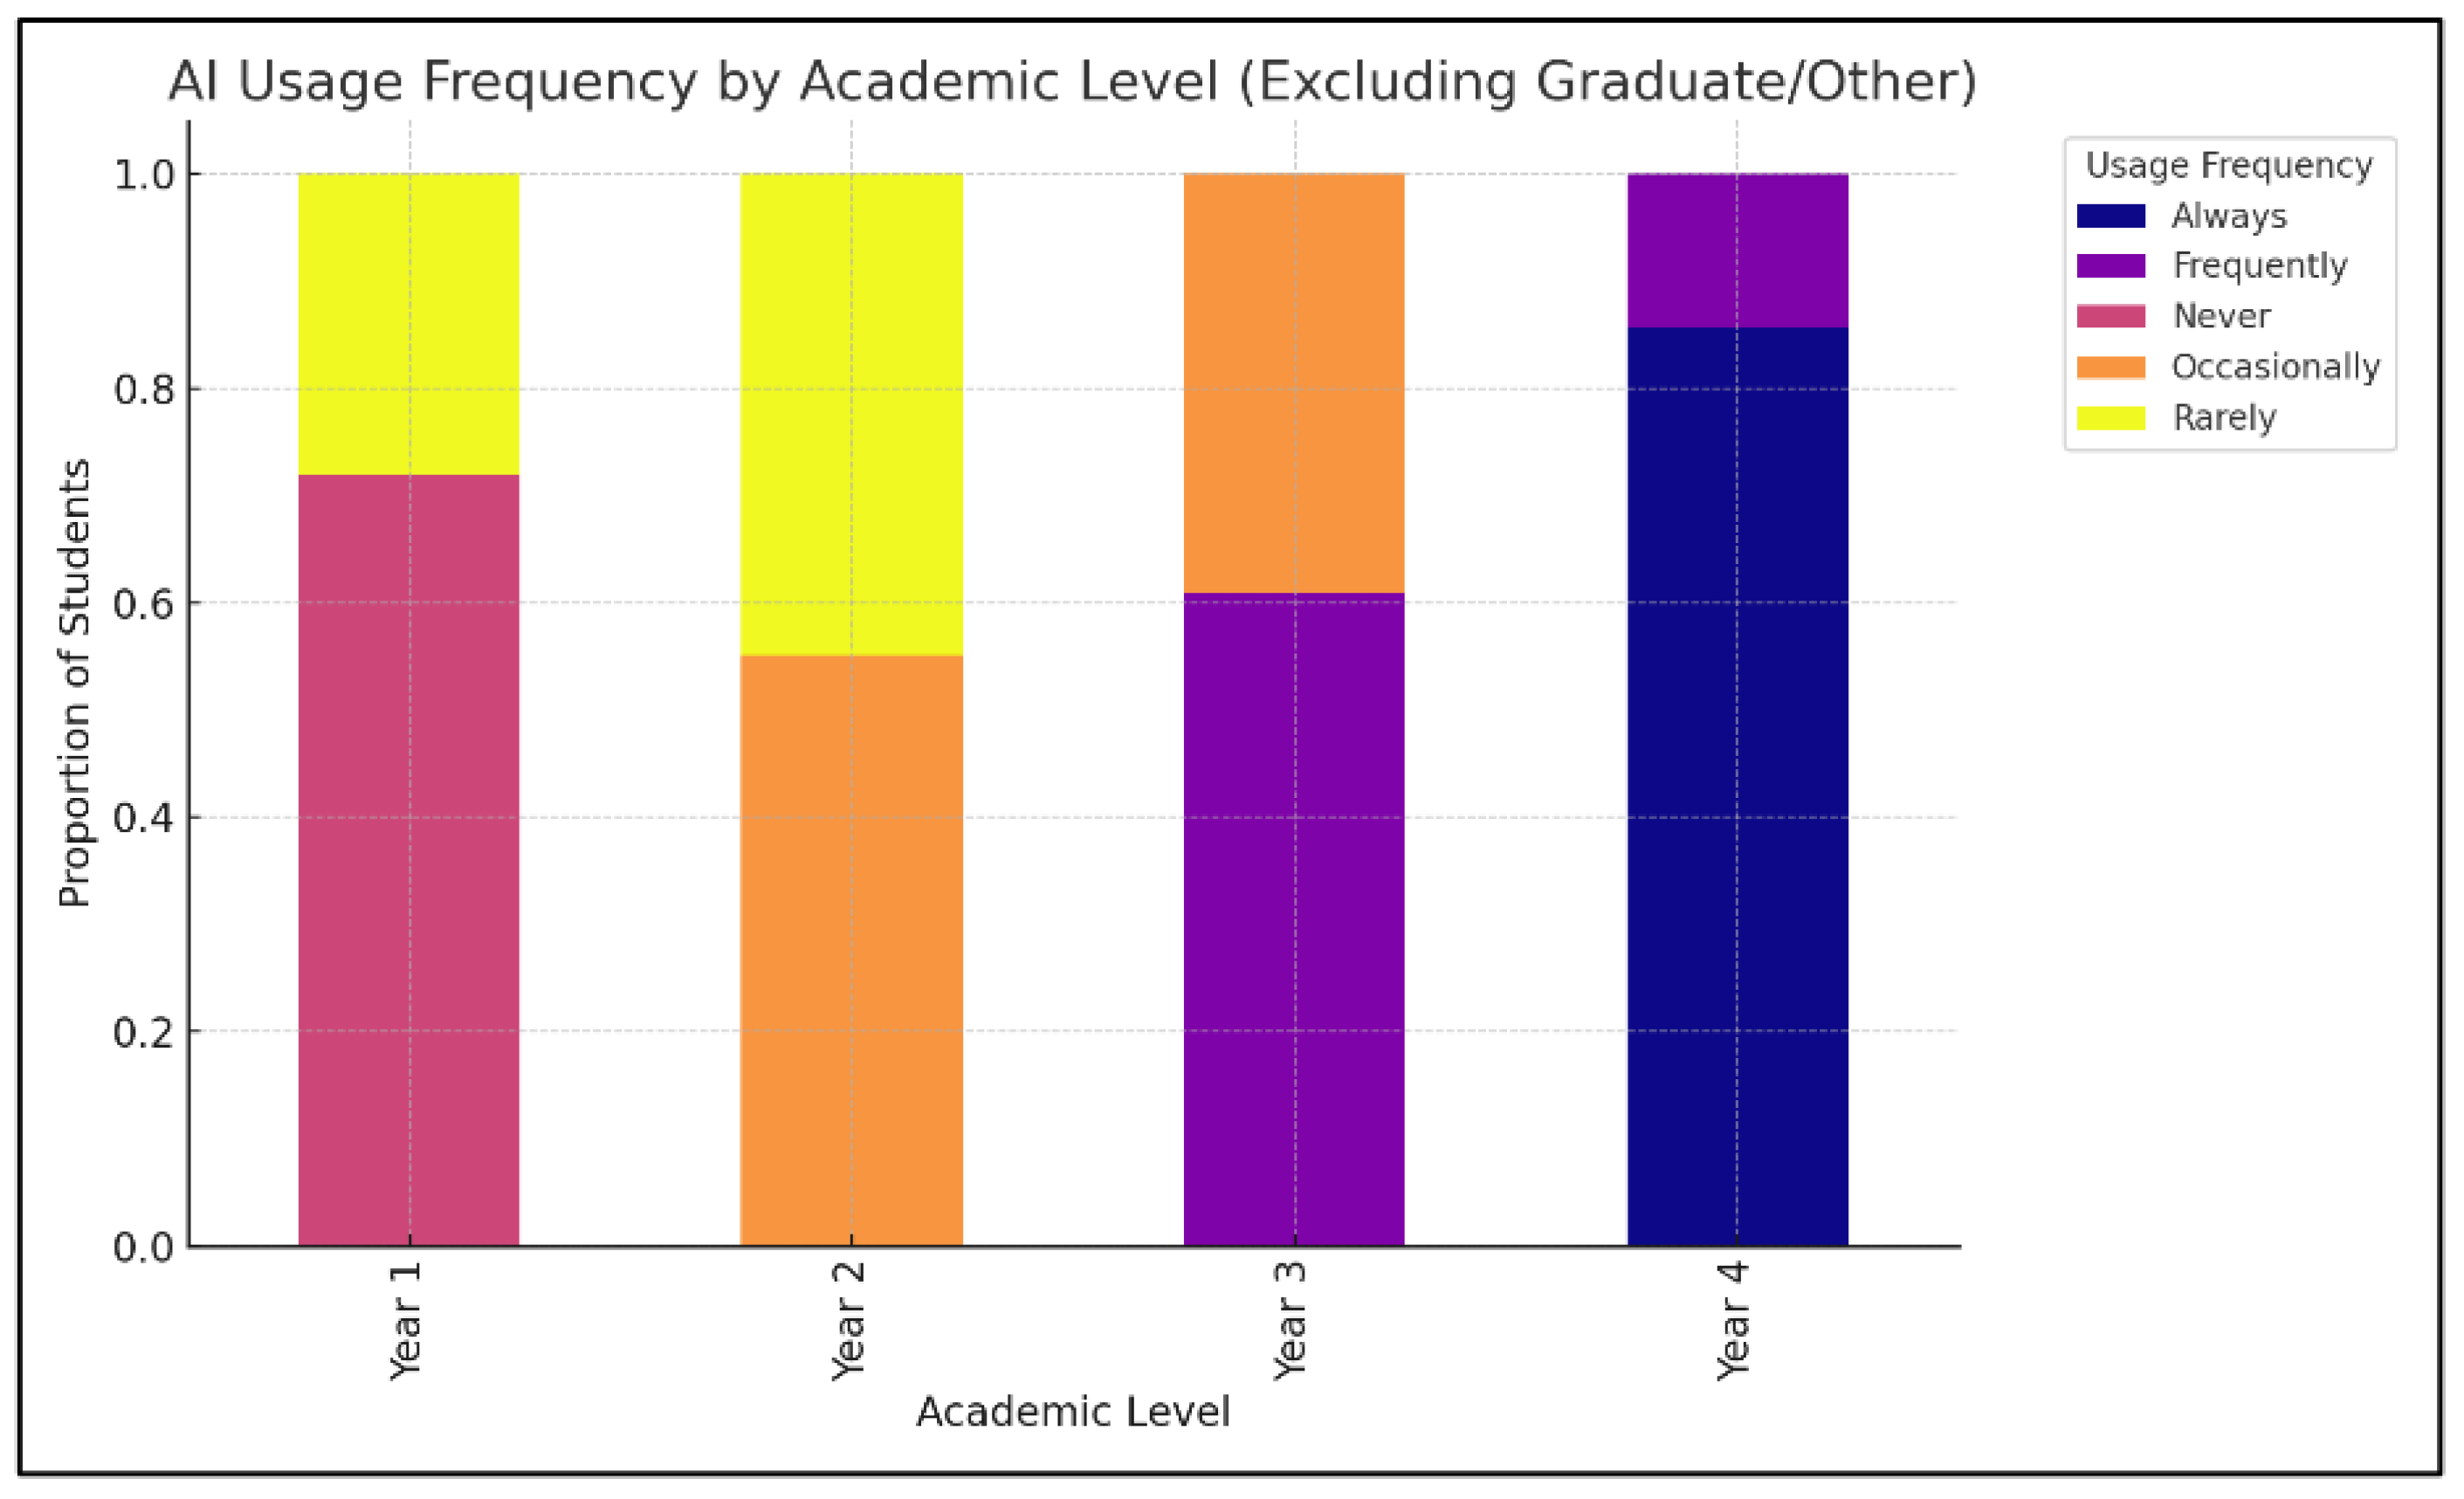
The distribution across academic levels showed that third-year (Junior) students (n = 87) reported the highest reliance on AI tools, with over 50% indicating frequent or always usage. Fourth-year (Senior) students (n = 56) followed closely, with nearly 45% in the frequent/always categories. Sophomores (n = 69) presented a mixed profile, with the majority (≈60%) using AI at least occasionally, while only about 20% used AI always. By comparison, first-year (Freshman) students (n = 25) reported the lowest uptake, with 40% using AI rarely or never, and only one in five students reported frequent usage. This pattern suggests that AI adoption rises progressively as students advance through their studies, peaking during the junior and senior years when coursework and project demands are greatest. As shown in Figure 10, the distribution of AI usage frequencies differs across academic levels.
These findings indicate that AI coding tools are most heavily adopted by Basic and Intermediate programmers (229 of 248 students, 92%) and by Juniors and Seniors (143 of 237 students, 60%), demonstrating that AI is perceived as especially valuable for learners at non-Expert skill levels and advanced stages of academic progression.

4.1.3. RQ3: Which AI-Based Coding Assistants and Programming Languages Are Most Frequently Used by Students?

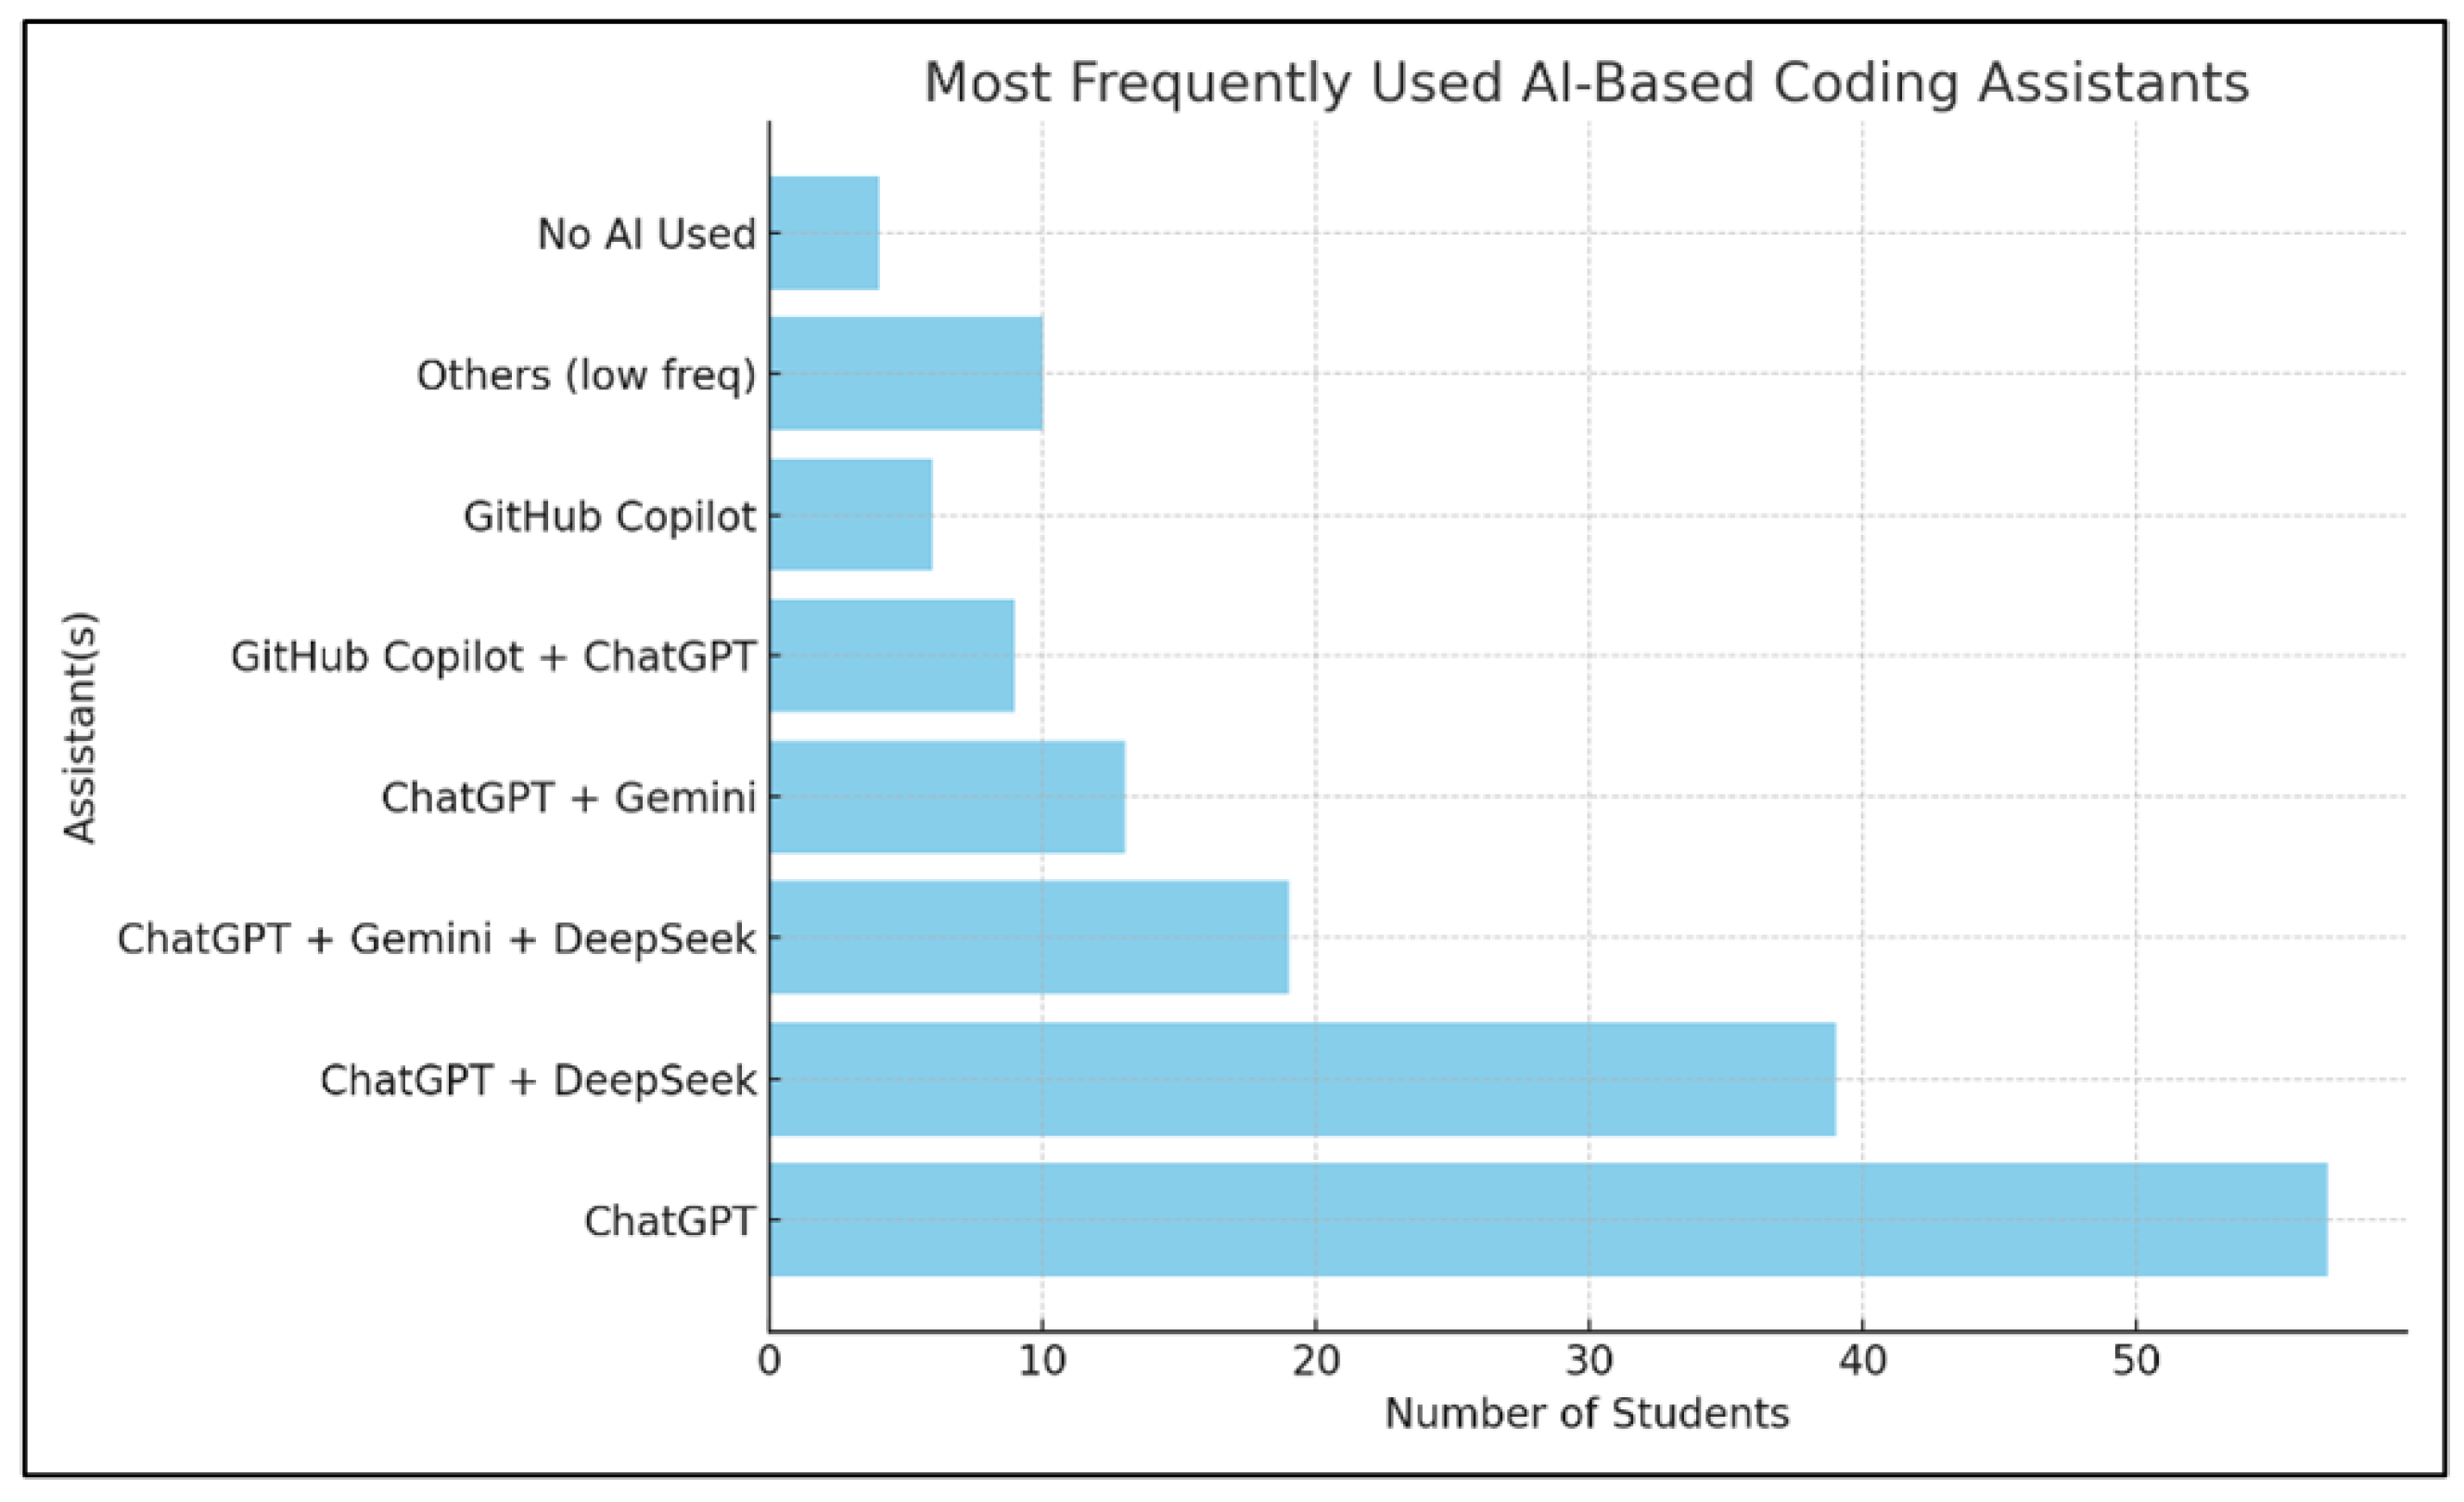
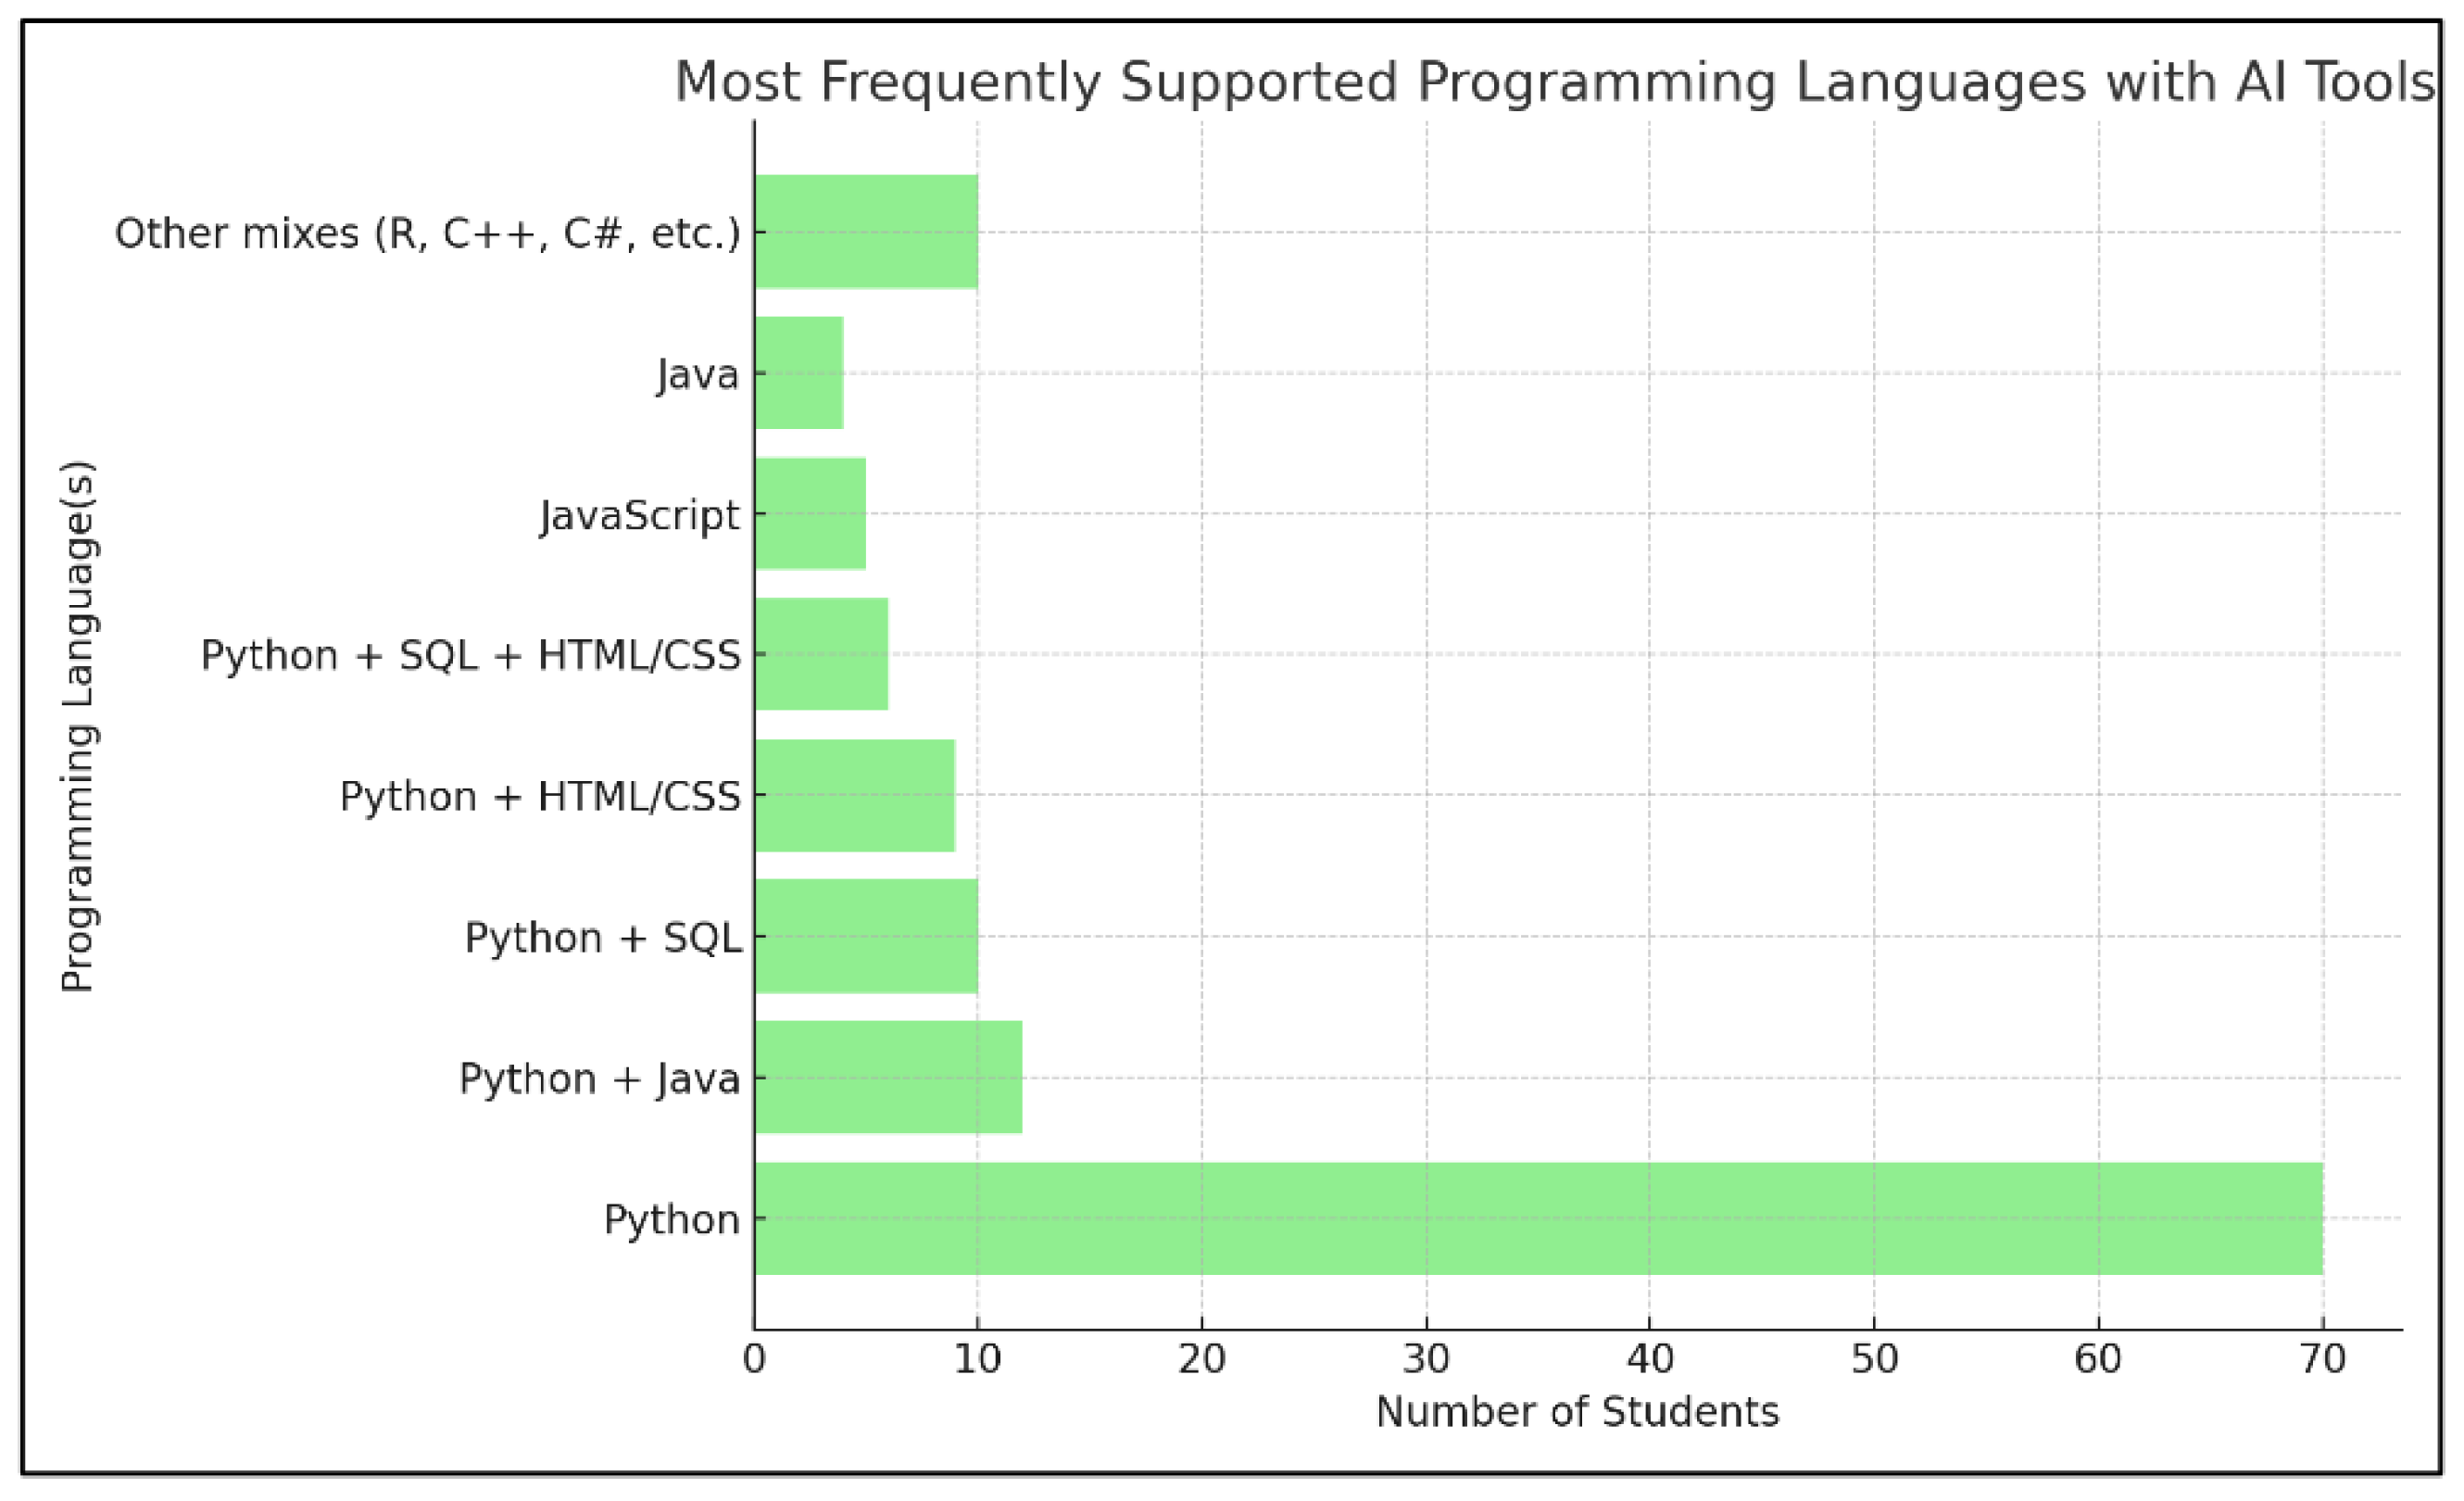
The analysis of RQ3 (Figure 11 and Figure 12) showed that students rely most heavily on ChatGPT as their primary AI coding assistant, with frequent supplementary use of DeepSeek, Google Gemini, and GitHub Copilot. Collectively, these tools represent the core ecosystem of AI-driven support in programming education. In terms of programming languages, Python emerged as the most frequently supported language, appearing in the majority of responses, followed by Java, JavaScript, SQL, and HTML/CSS. This distribution suggests that students turn to AI tools for both general-purpose programming and applied tasks in data analysis and web development, while more specialized languages (e.g., C++, C#, R) were less common. These findings highlight a clear alignment between students’ reliance on AI tools and the dominant languages in their coursework and professional preparation.

4.1.4. RQ4: Do Students with Basic Programming Experience Differ Significantly from the Intermediate or the Expert Programmers in Their Perceived Learning Outcomes When Using AI Tools?

To account for all programming experience levels represented in the sample, RQ4 aimed to examine differences in perceived learning outcomes across Basic, Intermediate, and Expert groups. Accordingly, a Kruskal–Wallis H test was conducted to compare learning scores among the three experience levels. The analysis revealed no statistically significant differences across groups, H(2) = 4.044, p = 0.132. Although the Intermediate group exhibited a slightly higher mean rank compared to the Basic and Expert groups, these differences were not statistically meaningful. Given the non-significant omnibus result, post hoc pairwise comparisons were not performed. Overall, these findings suggest that students’ perceived learning outcomes associated with AI use are broadly consistent across programming experience levels.

4.1.5. RQ5: Are There Significant Differences in Code of Practice Across Students at Different Academic Levels (Year 1, Year 2, Year 3, Year 4)?

To investigate whether students’ Code of Practice varied across different stages of academic progression, we compared scores among freshmen, sophomores, juniors, and seniors.
A Kruskal–Wallis H test was conducted (Table 10) to examine differences in Code of Practice scores across the four academic levels (Year 1–Year 4). The results indicated no statistically significant differences among the groups, H ( 3 ) = 1.515 , p = 0.679 (N = 237). Mean rank values were similar across academic levels (110.37–124.83), suggesting broadly consistent Code of Practice regardless of academic level. As the omnibus test was not significant, post hoc pairwise comparisons were not performed.

4.1.6. RQ6: To What Extent Do Learning, Trust, and Code of Practice Predict Students’ Productivity When Using AI-Based Coding Assistants?

To address RQ6, we examined whether Learning, Trust, and Code of Practice could serve as predictors of students’ Productivity when engaging with AI-based coding assistants. Given the strong correlations observed among the constructs in RQ1, a multiple regression analysis was employed to evaluate the unique and combined contributions of these factors. The following hypotheses guided this analysis.
Prior Hypotheses
H1: 
Higher Learning scores will be significantly associated with higher Productivity.
H2: 
Greater Trust in AI tools will be significantly associated with higher Productivity.
H3: 
Better Code of Practice will be significantly associated with higher Productivity.
H4: 
The combined model of Learning, Trust, and Code of Practice will significantly explain the variance in Productivity.
A multiple regression analysis was conducted (Table 11, Table 12 and Table 13) to predict Productivity from Learning, Trust, and Code of Practice. The overall model was strong, explaining 62.8% of the variance in Productivity (R2 = 0.628, Adjusted R2 = 0.623) with a multiple correlation of R = 0.793. The relatively small standard error of the estimate (0.485) indicates that the model predictions closely matched the observed values. These results indicate that Learning, Trust, and Code of Practice provide a robust explanation of students’ perceived Productivity when using AI-based coding assistants.
The ANOVA results indicated that the overall regression model significantly predicted Productivity, F(3, 210) = 118.31, p < 0.001. This confirms that the combined predictors of Learning, Trust, and Code of Practice explained a statistically significant proportion of the variance in Productivity. These findings support the conclusion that the model provides a robust explanation of how these constructs contribute to students’ productivity when using AI-based coding assistants.
The regression coefficients indicated that all three predictors made significant contributions to Productivity. Learning emerged as the strongest predictor ( β = 0.543 , p < 0.001 ), followed by Trust ( β = 0.240 , p < 0.001 ), and Code of Practice ( β = 0.163 , p = 0.002 ). This suggests that students who perceive greater learning support and trust in AI-based coding assistants tend to report higher productivity, with Code of Practice also contributing positively, albeit to a lesser extent. Collinearity diagnostics confirmed no multicollinearity concerns (VIF < 2).
Using standardized scores, the final regression model predicting Productivity can be expressed as
Z ( Productivity ) = 0.040 + 0.568 Z ( Learning ) + 0.189 Z ( Trust ) + 0.165 Z ( Code of Practice )
where
Learning (Z) = standardized learning score
Trust (Z) = standardized trust score
Code of Practice (Z) = standardized Code of Practice score
0.040 = constant (intercept, not significant in this case)
As summarized in Table 14, all four hypotheses were supported by the regression results.

4.2. Group Comparisons by Programming Experience (Boxplots)

Construct Scores by Programming Experience
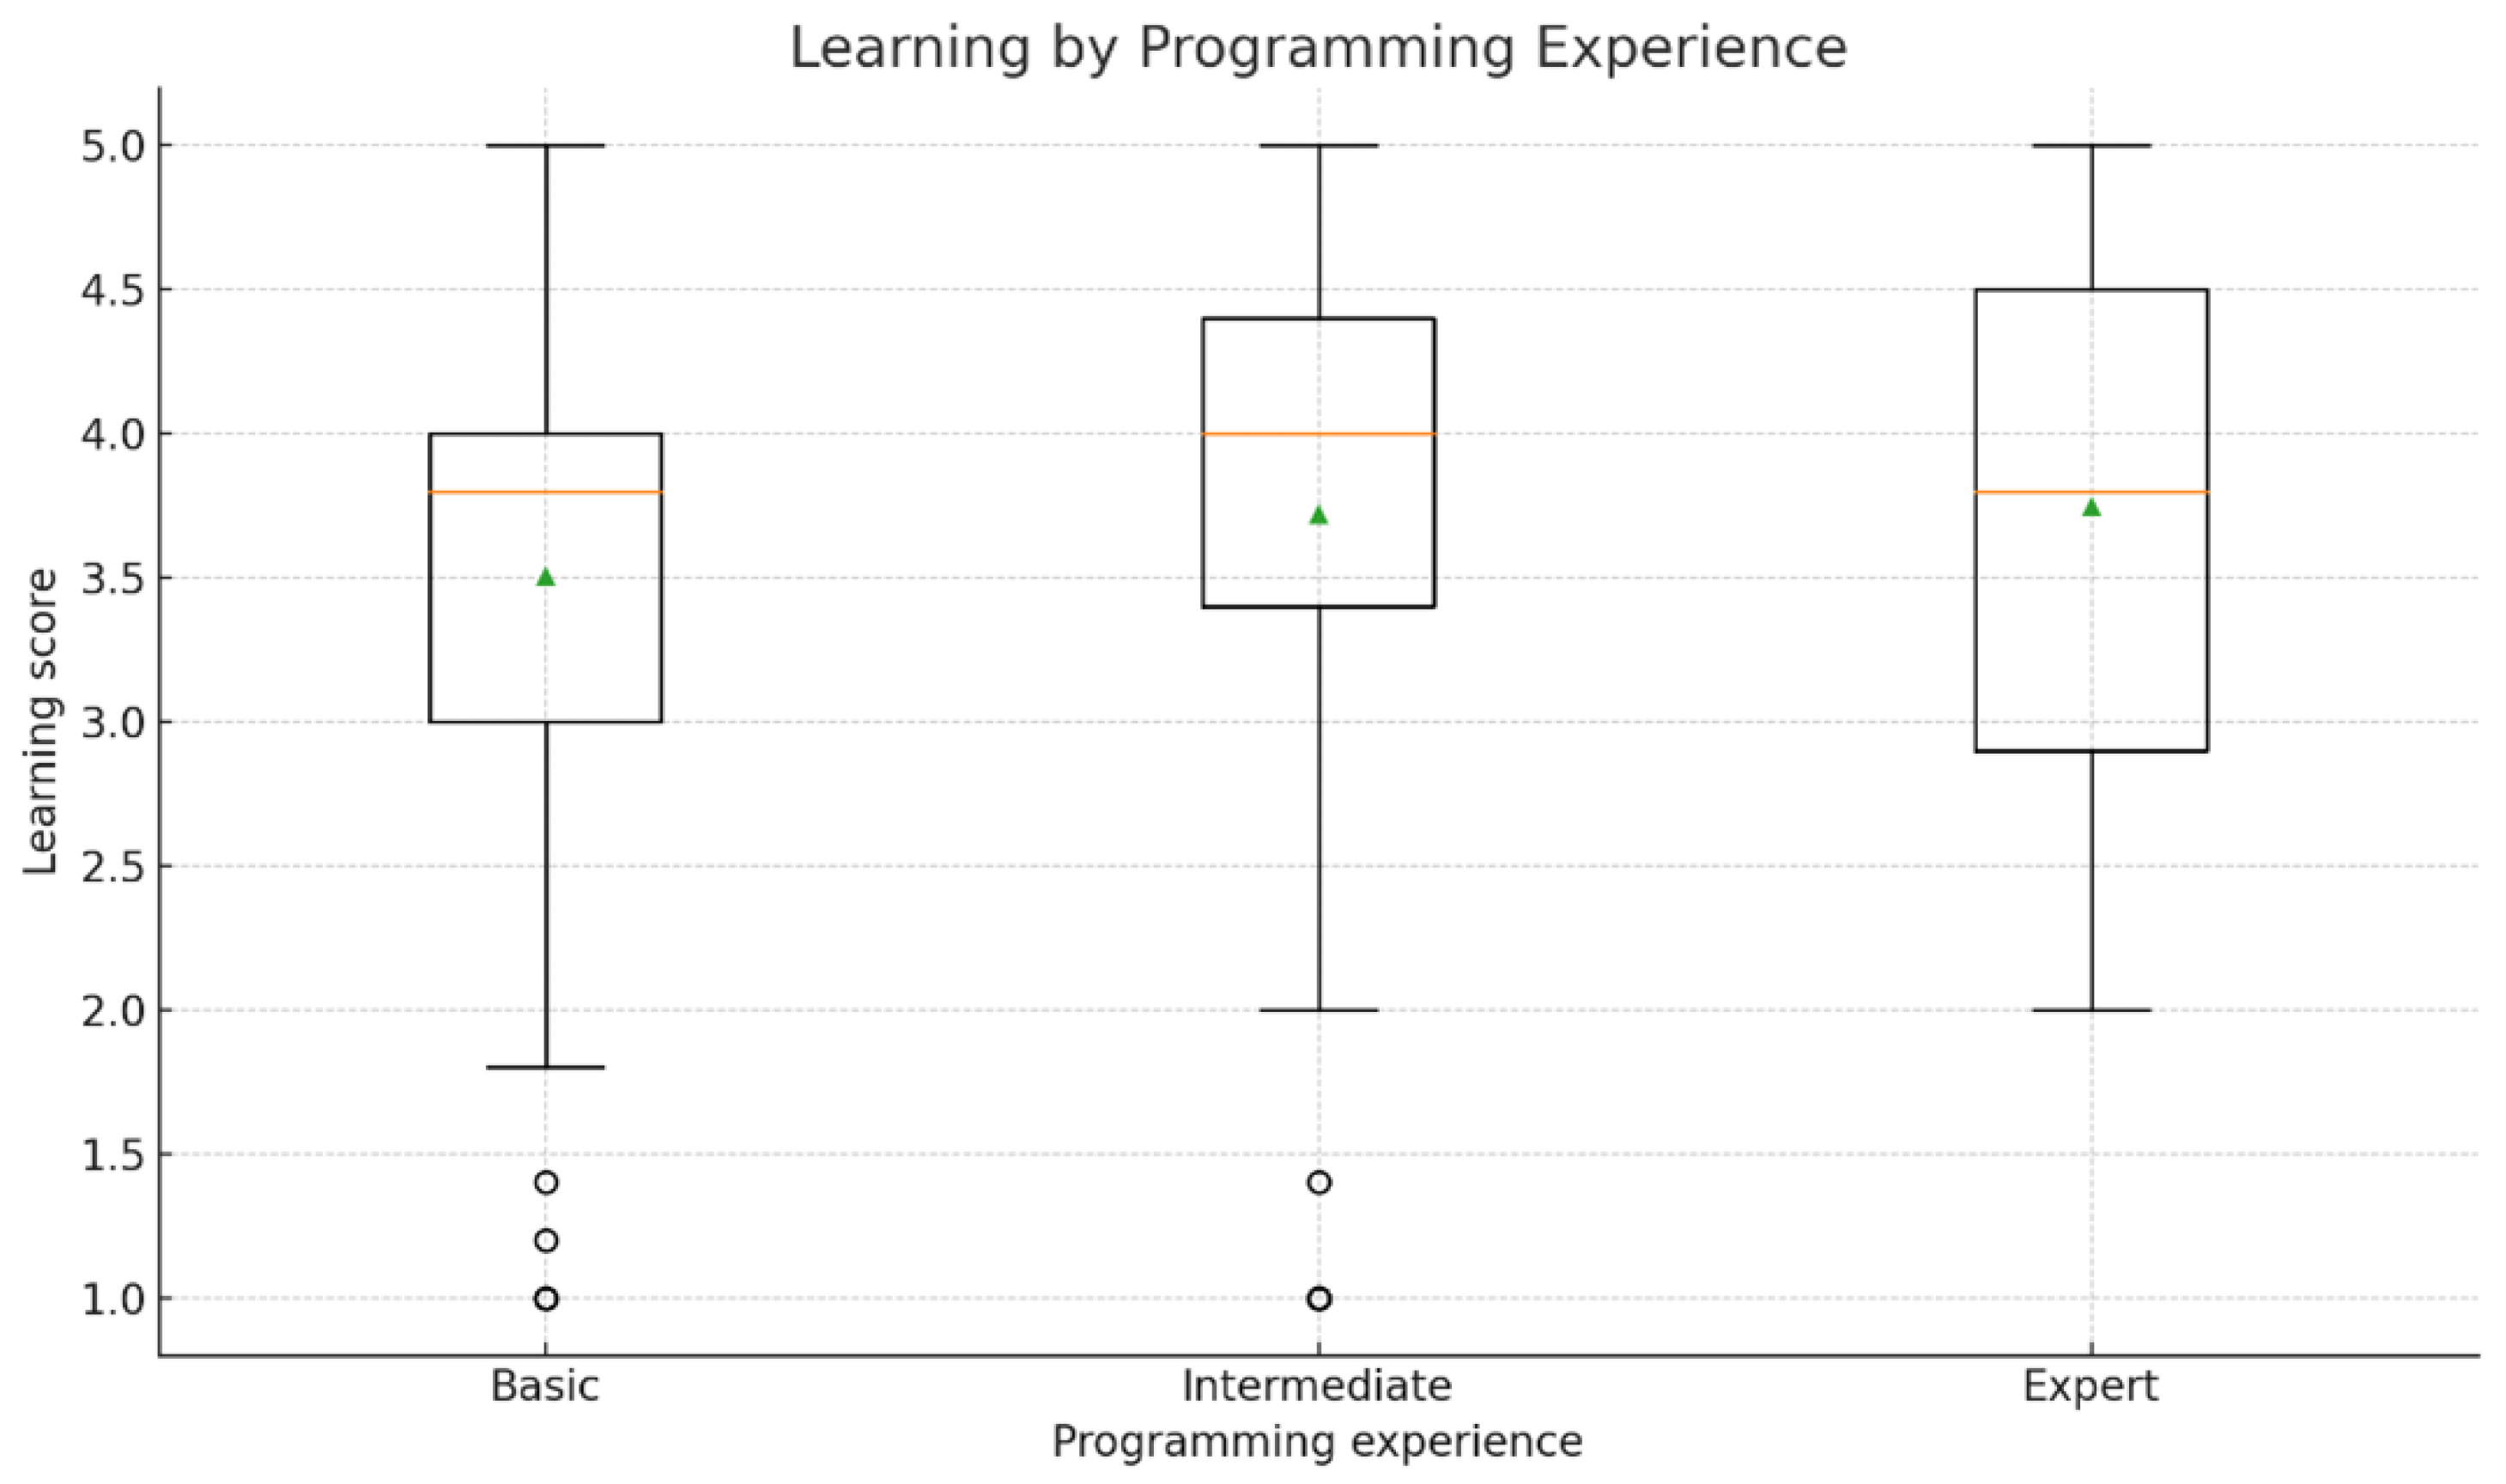
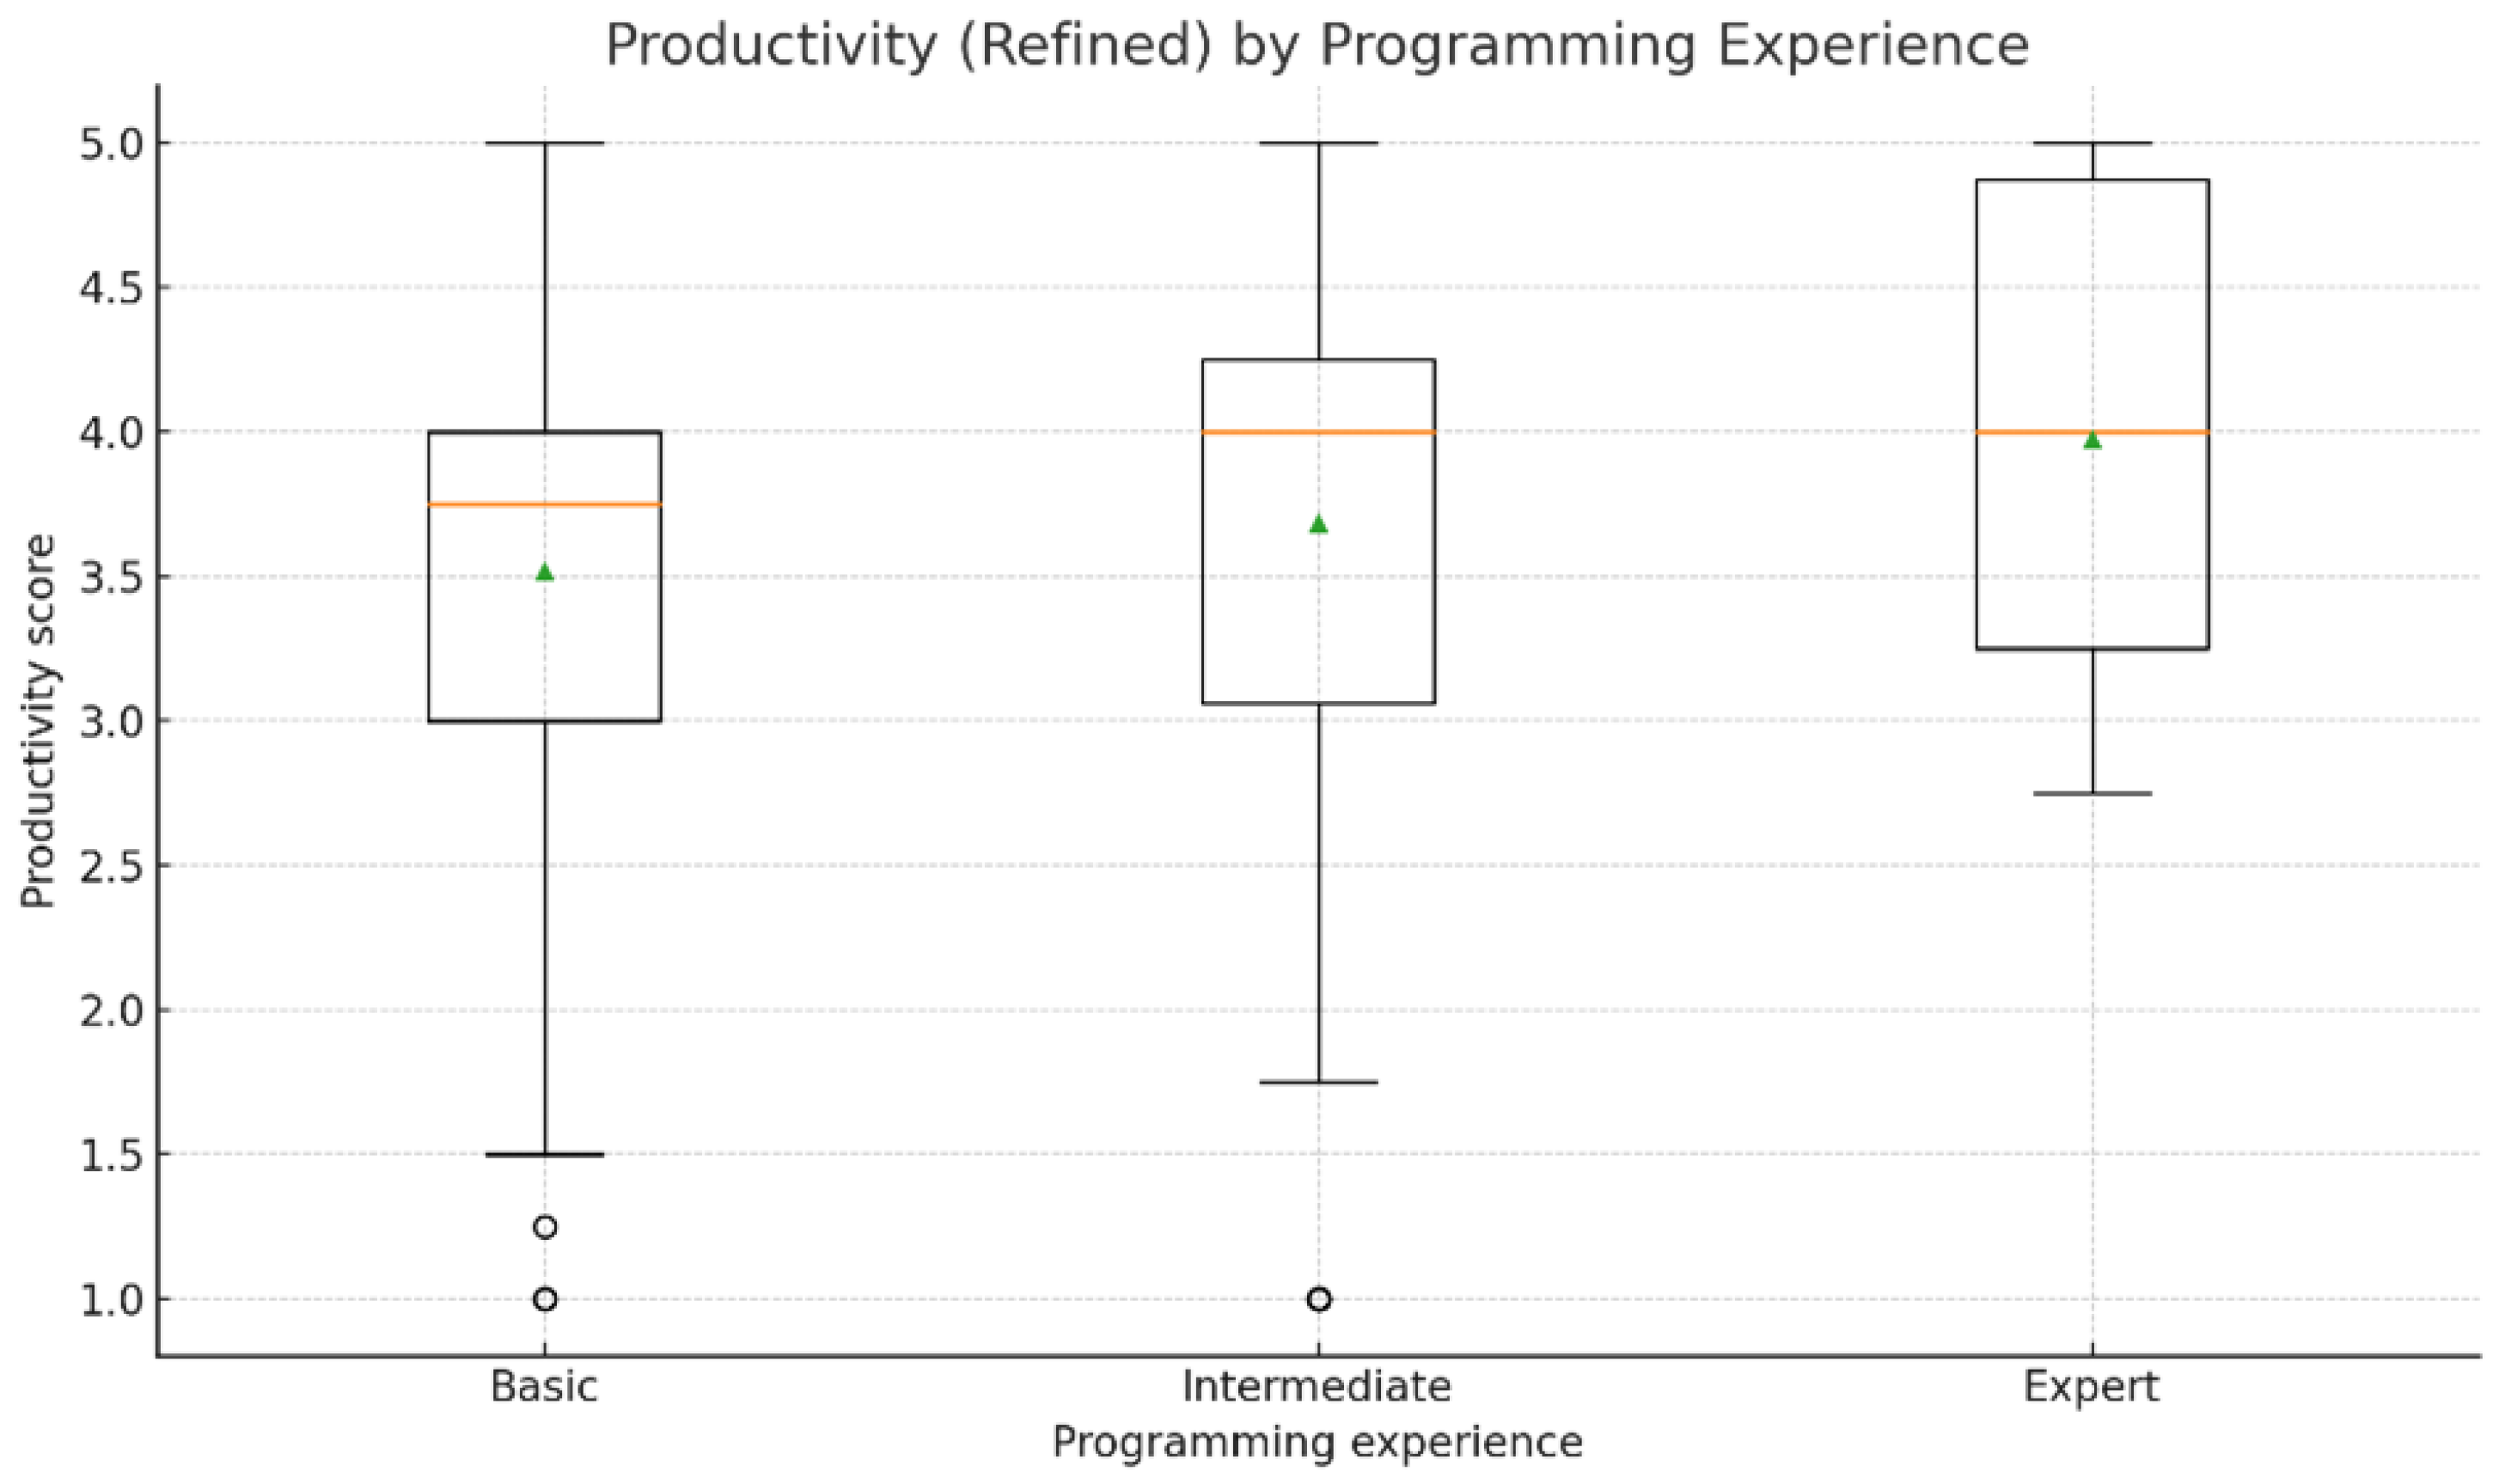
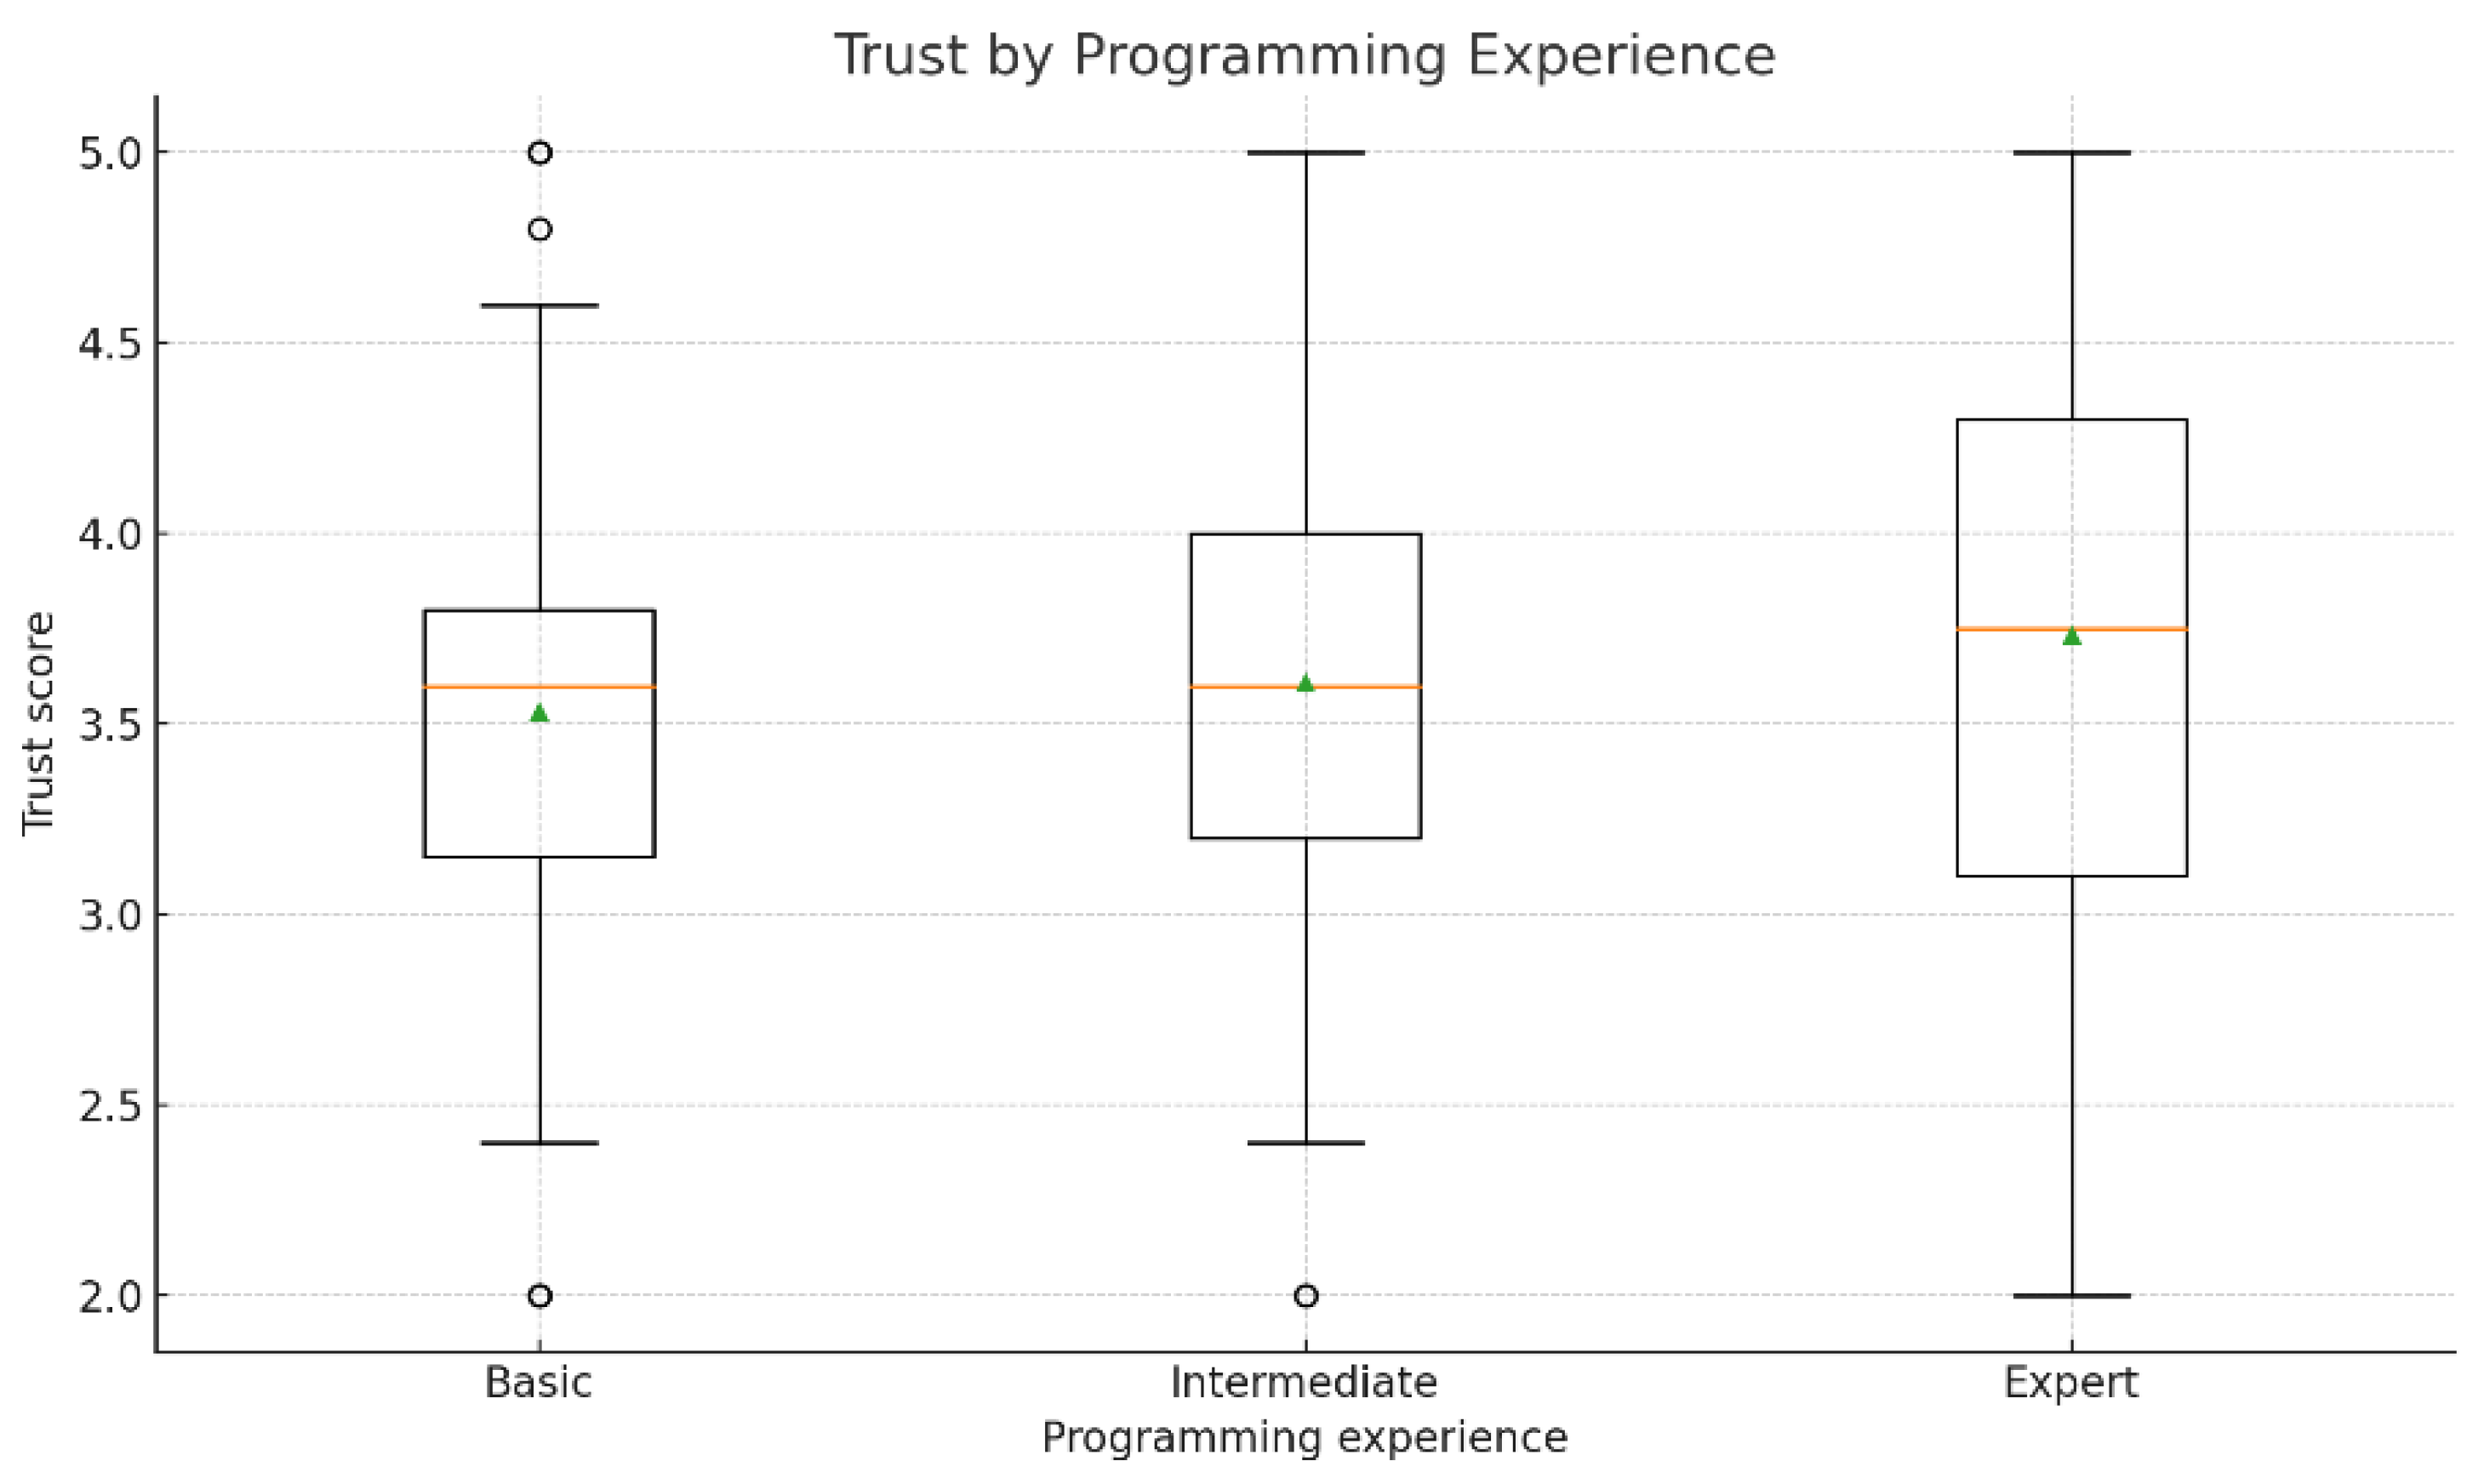
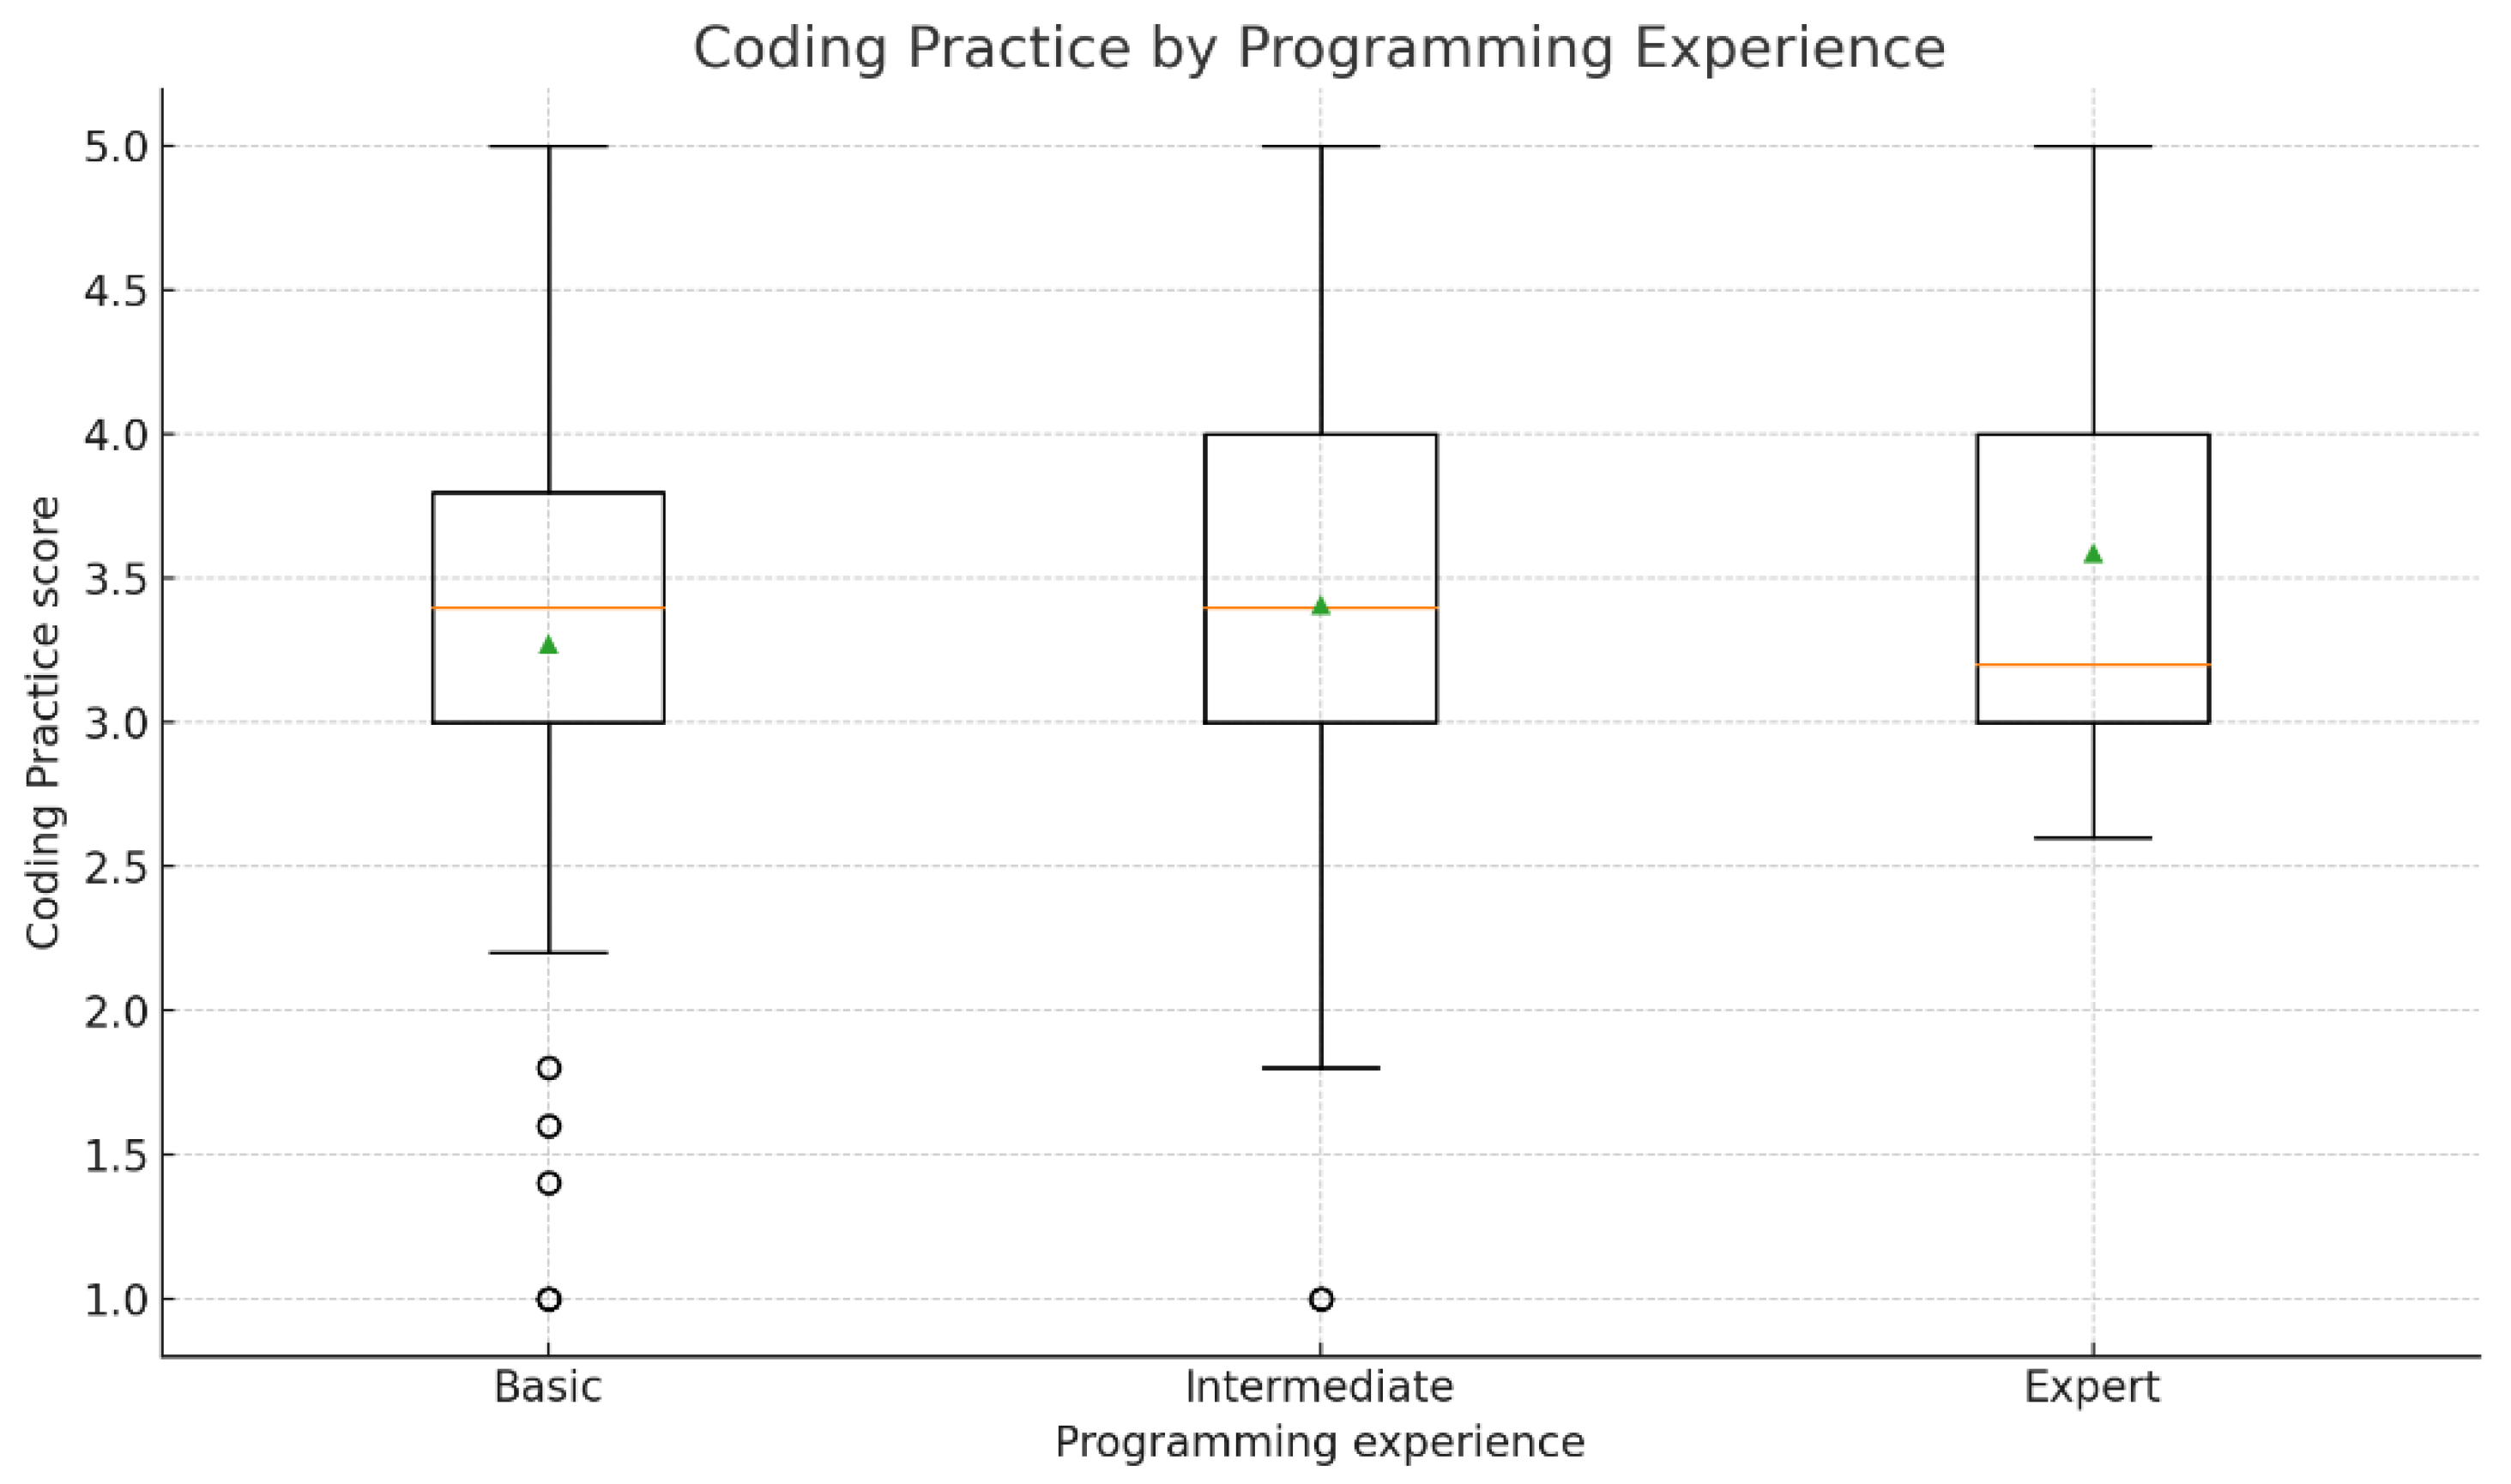
To explore differences in perceptions based on programming expertise, construct scores were compared across three self-reported experience levels: Basic, Intermediate, and Expert (Figure 13, Figure 14, Figure 15 and Figure 16).
For Learning, median scores were high across all groups, with Experts and Intermediates showing slightly higher central tendencies than Basics. The interquartile range was narrow, indicating consistent agreement within each group and that AI tools supported comprehension and retention.
Productivity (refined scale) scores followed a similar pattern: Experts reported the highest median productivity gains, followed closely by Intermediates, whereas Basics showed a slightly wider spread of responses and a small cluster of lower scores. This suggests that familiarity with programming may enhance one’s ability to leverage AI assistance for efficiency.
Trust scores showed the largest group differences. Experts displayed a relatively high median trust with moderate variation, Intermediates clustered slightly lower, and Basics exhibited the widest range, including several low-trust responses. These patterns may reflect varying levels of confidence in evaluating AI outputs across experience levels.
For Code of Practice, all three groups reported moderately high scores, but Experts’ responses were more tightly clustered, suggesting greater consensus on how AI has influenced their coding approaches. Basics and Intermediates displayed slightly broader spreads, with some respondents expressing more caution about potential long-term effects.
Overall, the boxplots highlight that while positive perceptions are common across experience levels, greater expertise is associated with more consistent and confident evaluations of AI’s role in programming tasks.

4.3. Discussion

The findings of this study align with and extend prior literature on human–AI collaboration in education. First, the strong correlation between Learning and Productivity (RQ1) resonates with Fan et al. [9], who reported that AI-assisted pair programming enhanced motivation and efficiency, and contrasts with Clarke and Konak [8], who cautioned about diminished critical thinking. Our results suggest that productivity gains may reinforce learning outcomes rather than undermine them, provided students engage critically with AI outputs.
Second, the variability in Trust echoes Yim [12], where both enthusiasm and caution characterized teachers’ attitudes toward AI. While Yim focused on instructors’ perspectives, our results reveal a comparable diversity of attitudes among students, suggesting that trust in AI is a cross-cutting issue in educational contexts. Similarly, our findings indicate that while many students place confidence in AI tools, others adopt a more skeptical stance, reflecting wider concerns about reliability and fairness [3]. This variation indicates the need for assistance strategies that not only build technical competence but also increase critical evaluation skills.
Third, the adoption patterns by experience and academic level (RQ2–RQ3) highlight AI’s role as a scaffolding tool, particularly for Basic and Intermediate programmers. This supports Vygotsky’s MKO perspective [6], where AI functions as a partner that extends learners’ capabilities. However, it also raises concerns about over-reliance, consistent with Asuncion and Natividad [7], who warned against superficial engagement when AI is treated merely as a shortcut.
Finally, the regression results (RQ6) demonstrate that Learning, Trust, and Code of Practice explain a substantial proportion of Productivity variance, complementing Memarian and Doleck’s [14] argument that effective integration requires alignment with pedagogical goals. These findings emphasize that productivity benefits are not solely technical but depend on the interplay between cognitive and behavioral factors.

5. Conclusions

This study examined students’ perceptions of LLM-based coding assistants in programming education through a survey of 248 participants. Guided by six research questions (RQ1–RQ6), the analysis explored correlations among constructs, adoption patterns, group differences, and predictors of productivity. Results revealed consistently positive associations between learning, productivity, trust, and Code of Practice, with learning emerging as the strongest predictor of productivity. ChatGPT and Python-based assistants were most frequently used, particularly among Basic and Intermediate programmers and students in advanced academic years. While students generally viewed AI tools as enhancing efficiency and understanding, trust in their outputs varied, reflecting a mix of enthusiasm and caution. This study provides empirical insight into how students use and perceive AI coding assistants and how trust, learning, productivity, and Code of Practice relate in programming education. It extends prior research by integrating adoption patterns with predictive modeling, thereby offering insights into when and how AI benefits are most effectively realized in programming education. Several limitations should be acknowledged. First, as with many survey-based studies, reliance on self-reported data collected at a single time point may introduce response bias and common-method bias. To mitigate these risks, procedural remedies such as participant anonymity and neutral item wording were employed during data collection. Nevertheless, future research should incorporate objective performance confirmation measures or multi-source data to further validate the observed relationships. Accordingly, the findings should be interpreted as reflecting students’ perceived, rather than directly measured, learning and productivity outcomes. Second, the cross-sectional design captures perceptions at a single time point and cannot address long-term effects on skill development or knowledge retention. Third, the study sample was drawn exclusively from universities in Jordan, which may limit the generalizability of the findings to other educational or cultural contexts. In addition, although three levels of programming experience were examined, the Expert group was relatively small (n = 19), reflecting the limited number of advanced programmers within the sampled courses. Accordingly, group comparisons should be interpreted with caution. Future studies should seek larger and more diverse samples across institutions and countries to validate and extend these findings. Finally, although the regression model explains a substantial proportion of variance, the findings should be interpreted with caution due to the use of self-reported measures collected at a single time point. While diagnostic checks indicated that common-method bias was unlikely to fully account for the observed relationships, future studies may benefit from multi-source data, objective performance measures, or structural equation modeling approaches to more rigorously test causal pathways.
Future studies should adopt longitudinal and experimental designs to track how reliance on AI evolves and its influence on deeper learning outcomes. Comparative research across cultural and institutional contexts would yield broader insights into adoption patterns. Moreover, future work should explore interventions that balance productivity gains with the cultivation of critical thinking, debugging, and independent problem-solving skills, ensuring that AI integration enhances rather than diminishes students’ long-term competencies. Future work should explore not only long-term impacts on programming proficiency but also how AI integration can be aligned with assessment strategies and curriculum design. As universities increasingly integrate AI into curricula, understanding student trust and responsible use will be critical for policy and instructional design.

Supplementary Materials

The following supporting information can be downloaded at: https://www.mdpi.com/article/10.3390/computers15030154/s1. The informed consent statement used in this study is provided in Supplementary File S1.

Author Contributions

Conceptualization, H.A. and S.B.; methodology, H.A. and S.B.; data curation, H.A. and S.B.; formal analysis, H.A.; investigation, H.A. and S.B.; writing—original draft preparation, H.A. and S.B.; writing—review and editing, H.A. and S.B.; visualization, H.A.; project administration, H.A. All authors have read and agreed to the published version of the manuscript.

Funding

This research received no external funding. The APC was not externally funded.

Institutional Review Board Statement

The study was conducted in accordance with institutional research ethics guidelines and approved by the Institutional Review Board (IRB) of Yarmouk University (Reference No. IRB/2025/263). The informed consent statement presented to participants is provided in Supplementary File S1.

Informed Consent Statement

Informed consent for participation was obtained from all subjects involved in the study.

Data Availability Statement

The data presented in this study are available from the corresponding author upon reasonable request.

Conflicts of Interest

The authors declare no conflicts of interest.

References

  1. Puryear, B.; Sprint, G. Github copilot in the classroom: Learning to code with AI assistance. J. Comput. Sci. Coll. 2022, 38, 37–47. [Google Scholar]
  2. Prather, J.; Denny, P.; Leinonen, J.; Becker, B.A.; Albluwi, I.; Craig, M.; Keuning, H.; Kiesler, N.; Kohn, T.; Luxton-Reilly, A.; et al. The robots are here: Navigating the generative ai revolution in computing education. In Proceedings of the 2023 Working Group Reports on Innovation and Technology in Computer Science Education; Association for Computing Machinery: New York, NY, USA, 2023; pp. 108–159. [Google Scholar]
  3. Cheng, R.; Wang, R.; Zimmermann, T.; Ford, D. “It would work for me too”: How online communities shape software developers’ trust in AI-powered code generation tools. ACM Trans. Interact. Intell. Syst. 2024, 14, 1–39. [Google Scholar] [CrossRef]
  4. Gambo, I.; Abegunde, F.J.; Gambo, O.; Ogundokun, R.O.; Babatunde, A.N.; Lee, C.C. GRAD-AI: An automated grading tool for code assessment and feedback in programming course. Educ. Inf. Technol. 2025, 30, 9859–9899. [Google Scholar] [CrossRef]
  5. Guettala, M.; Bourekkache, S.; Kazar, O.; Harous, S. Generative artificial intelligence in education: Advancing adaptive and personalized learning. Acta Inform. Pragensia 2024, 13, 460–489. [Google Scholar] [CrossRef]
  6. Vygotsky, L.S. Mind in Society: The Development of Higher Psychological Processes; Cole, M., John-Steiner, V., Scribner, S., Souberman, E., Eds.; Harvard University Press: Cambridge, MA, USA, 1978. [Google Scholar]
  7. Asuncion, I.M.; Natividad, L.R. The Double-Edge Sword of AI: Mitigating the Risk and Maximizing the Benefits of Artificial Intelligence in Education (AIED). SSRN 2025. [Google Scholar] [CrossRef]
  8. Clarke, C.J.S.F.; Konak, A. The Impact of AI Use in Programming Courses on Critical Thinking Skills. J. Cybersecur. Educ. Res. Pract. 2025, 2025, 5. [Google Scholar] [CrossRef]
  9. Fan, G.; Liu, D.; Zhang, R.; Pan, L. The impact of AI-assisted pair programming on student motivation, programming anxiety, collaborative learning, and programming performance: A comparative study with traditional pair programming and individual approaches. Int. J. STEM Educ. 2025, 12, 16. [Google Scholar] [CrossRef]
  10. Kim, J. Leading teachers’ perspective on teacher-AI collaboration in education. Educ. Inf. Technol. 2024, 29, 8693–8724. [Google Scholar] [CrossRef]
  11. Järvelä, S.; Nguyen, A.; Hadwin, A. Human and artificial intelligence collaboration for socially shared regulation in learning. Br. J. Educ. Technol. 2023, 54, 1057–1076. [Google Scholar] [CrossRef]
  12. Yim, I.H.Y.; Wegerif, R. Teachers’ perceptions, attitudes, and acceptance of artificial intelligence (AI) educational learning tools: An exploratory study on AI literacy for young students. Future Educ. Res. 2024, 2, 318–345. [Google Scholar] [CrossRef]
  13. Al-Mughairi, H.; Bhaskar, P. Exploring the factors affecting the adoption AI techniques in higher education: Insights from teachers’ perspectives on ChatGPT. J. Res. Innov. Teach. Learn. 2025, 18, 232–247. [Google Scholar] [CrossRef]
  14. Memarian, B.; Doleck, T. A review of assessment for learning with artificial intelligence. Comput. Hum. Behav. Artif. Hum. 2024, 2, 100040. [Google Scholar] [CrossRef]
  15. Mao, J.; Chen, B.; Liu, J.C. Generative artificial intelligence in education and its implications for assessment. TechTrends 2024, 68, 58–66. [Google Scholar] [CrossRef]
  16. Xia, Q.; Weng, X.; Ouyang, F.; Lin, T.J.; Chiu, T.K. A scoping review on how generative artificial intelligence transforms assessment in higher education. Int. J. Educ. Technol. High. Educ. 2024, 21, 40. [Google Scholar] [CrossRef]
  17. Holmes, W. Artificial intelligence in education. In Encyclopedia of Education and Information Technologies; Springer: Berlin/Heidelberg, Germany, 2020; pp. 88–103. [Google Scholar]
  18. Edwards, J.; Nguyen, A.; Lämsä, J.; Sobocinski, M.; Whitehead, R.; Dang, B.; Roberts, A.S.; Järvelä, S. Human-AI collaboration: Designing artificial agents to facilitate socially shared regulation among learners. Br. J. Educ. Technol. 2025, 56, 712–733. [Google Scholar] [CrossRef]
  19. Zawacki-Richter, O.; Marín, V.I.; Bond, M.; Gouverneur, F. Systematic review of research on artificial intelligence applications in higher education–where are the educators? Int. J. Educ. Technol. High. Educ. 2019, 16, 39. [Google Scholar] [CrossRef]
Figure 1. Methodology overview: participants and survey design, IRB-approved data collection, measurement preparation (cleaning, reliability, validity, normality), and analyses addressing RQ1–RQ6.
Computers 15 00154 g001
Figure 2. Cronbach alpha.
Computers 15 00154 g002
Figure 3. Principal components analysis plot and loadings supporting the four-construct structure (Learning, Productivity, Trust, Code of Practice).
Computers 15 00154 g003
Figure 4. Distribution of Learning construct scores (1–5), showing a strong positive skew toward higher agreement. Most students reported values between 4 and 5, indicating widespread perception that AI coding assistants enhanced their understanding, retention, and problem-solving skills.
Computers 15 00154 g004
Figure 5. Distribution of Productivity construct scores (refined scale), illustrating generally high ratings with slightly greater variability than Learning.
Computers 15 00154 g005
Figure 6. Distribution of Trust construct scores, reflecting the widest spread among all constructs, with both high-trust and cautious responses represented.
Computers 15 00154 g006
Figure 7. Distribution of Code of Practice construct scores, indicating moderately high agreement on AI’s influence on coding habits, with some variation in concerns about over-reliance and ethics.
Computers 15 00154 g007
Figure 8. Spearman correlation heatmap among Learning, Productivity, Trust, and Code of Practice, highlighting consistently positive and significant associations.
Computers 15 00154 g008
Figure 9. Numerical distribution of AI usage frequencies by programming experience.
Computers 15 00154 g009
Figure 10. Numerical distribution of AI usage frequencies by academic level.
Computers 15 00154 g010
Figure 11. Most frequently used AI coding assistants.
Computers 15 00154 g011
Figure 12. Most frequently used programming languages supported by AI tools, with Python emerging as the most common.
Computers 15 00154 g012
Figure 13. Boxplot of Learning scores by programming experience level, showing consistently high medians across all groups, with Experts and Intermediates slightly higher than Basics.
Computers 15 00154 g013
Figure 14. Boxplot of Productivity (refined) scores by programming experience, with Experts reporting the highest median gains and Basics showing the widest spread.
Computers 15 00154 g014
Figure 15. Boxplot of Trust scores by programming experience, highlighting the largest variation between groups, with Experts generally more trusting and Basics showing more dispersed trust levels.
Computers 15 00154 g015
Figure 16. Boxplot of Coding Practice scores by programming experience, with Experts exhibiting tighter clustering and greater consensus on AI’s influence than Basics or Intermediates.
Computers 15 00154 g016
Table 1. Survey instrument items.
ConstructCodeStatement
LearningL1The AI assistant helped me understand programming concepts more clearly.
L2I retain programming knowledge better when using an AI assistant.
L3Working with an AI assistant has improved my problem-solving approach.
L4The AI tool encourages me to explore new coding techniques or strategies.
L5I feel that my overall understanding of programming has improved with AI support.
ProductivityP1Using AI tools helped me complete programming tasks faster.
P2AI assistance reduces the time I spend debugging or fixing errors.
P3AI tools sometimes distract me or slow me down when coding (reverse-coded).
P4The AI assistant helps me stay on track and manage my coding workload better.
P5The use of AI tools allows me to focus more on high-level design and logic rather than syntax.
TrustT1I trust the output generated by the AI assistant.
T2I believe the AI tool provides reliable solutions in most cases.
T3I find the AI-generated code difficult to trust without extensive verification (reverse-coded).
T4I double-check the AI-generated code before using it in my work (reverse-coded).
T5I believe the AI assistant improves over time as I use it more frequently.
Code of PracticeCP1I actively try to solve problems on my own before turning to the AI assistant.
CP2I am concerned that relying on AI tools may reduce my long-term coding skills.
CP3I have become more efficient, but I fear I might be missing out on deeper learning.
CP4I am worried about plagiarism or ethical issues when using AI-generated code.
CP5Using AI tools has changed the way I approach and write code.
Table 2. Tests of normality for construct scores (N = 214).
ConstructKolmogorov–Smirnov aShapiro–Wilk
StatisticdfSig.StatisticdfSig.
Learning0.125214<0.0010.945214<0.001
Productivity0.120214<0.0010.950214<0.001
Trust0.105214<0.0010.956214<0.001
Code of Practice0.112214<0.0010.970214<0.001
a Lilliefors significance correction.
Table 3. Kaiser–Meyer–Olkin (KMO) measure and Bartlett’s test of sphericity.
MeasureValue
KMO measure of sampling adequacy0.879
Bartlett’s test of sphericity: Approx. χ 2 1918.857
Bartlett’s test of sphericity: df190
Bartlett’s test of sphericity: p-value<0.001
Table 4. Rotated component matrix from PCA (Varimax rotation).
Item/ConstructC1C2C3C4C5
Learning10.7180.0930.3230.1810.021
Learning20.8230.1140.159−0.028−0.089
Learning30.6080.2650.125−0.112−0.163
Learning40.728−0.0160.1330.179−0.090
Learning50.8150.1050.0060.155−0.025
Productivity10.7170.2060.1700.2180.376
Productivity20.6420.1250.1700.2810.324
Productivity30.1330.1460.1330.409−0.743
Productivity40.6370.3820.1570.1100.119
Productivity50.6070.3710.0750.2710.000
Trust10.1510.8700.0020.129−0.156
Trust20.2150.8390.1750.0550.022
Trust30.0680.0600.7920.051−0.254
Trust40.3280.0880.7420.1290.020
Trust50.4590.4210.1600.2100.330
CodingPractices10.2430.0210.4920.3860.178
CodingPractices20.0560.1590.5720.4400.201
CodingPractices30.1910.1850.1120.754−0.049
CodingPractices4−0.0420.0340.1970.696−0.208
CodingPractices50.3880.3850.0880.3330.231
Table 5. Pattern matrix from exploratory factor analysis (principal axis factoring, Promax rotation).
Item/ConstructFactor 1Factor 2Factor 3Factor 4Factor 5
Learning10.682
Learning20.858
Learning30.538
Learning40.614
Learning50.766
Productivity10.379 0.699
Productivity20.329 0.589
Productivity3 0.356 0.660
Productivity40.447
Productivity50.453
Trust1 0.856
Trust2 0.791
Trust3 0.633
Trust4 0.665
Trust5 0.484
Code of Practice1 0.357
Code of Practice2 0.432
Code of Practice3 0.3690.534
Code of Practice4 0.475
Code of Practice5 0.347
Note: Bold values indicate the highest absolute factor loading for each item.
Table 6. Alignment of research questions, variables, and analysis choices.
RQFocusMethodological Justification and Analysis
RQ1Correlations among Learning, Productivity, Trust, Code of PracticeSpearman’s ρ : monotonic associations; appropriate for non-normal Likert composites.
RQ2Usage patterns by experience/levelDescriptives and distribution plots; aligns with descriptive aim.
RQ3Most used tools/languagesFrequencies; aligns with descriptive aim.
RQ4Basic vs. Intermediate vs. Expert (Learning)Kruskal–Wallis: Three independent groups; robust to non-normality.
RQ5Academic levels (Code of Practice)Kruskal–Wallis: k > 2 independent groups; ordinal/continuous composites.
RQ6Predictors of ProductivityMultiple regression with diagnostics and bootstrap CIs; tests unique effects and overall explanatory power.
Table 7. Programming experience distribution (N = 248).
LevelFrequencyPercentCumulative %
Basic11144.844.8
Expert197.752.4
Intermediate11847.6100.0
Total248100.0100.0
Table 8. Distribution of AI coding tool usage frequencies (N = 248).
Usage FrequencyFrequencyPercentCumulative Percent
Always5923.823.8
Frequently6124.648.4
Never187.355.6
Occasionally7229.084.7
Rarely3815.3100.0
Total248100.0100.0
Table 9. Distribution of participants by academic level (N = 248).
Academic LevelFrequencyPercentCumulative Percent
Year 1 (Freshman)2510.110.1
Year 2 (Sophomore)6927.837.9
Year 3 (Junior)8735.173.0
Year 4 (Senior)5622.695.6
Graduate (Master’s/PhD)62.498.0
Other41.6100.0
Total248100.0100.0
Table 10. Comparison of Code of Practice scores across academic levels using Kruskal–Wallis test.
Academic LevelNMean Rank
Year 125123.52
Year 269124.83
Year 387118.63
Year 456110.37
Total237
Table 11. Regression model summary predicting Productivity from Learning, Trust, and Code of Practice.
ModelR R 2 Adjusted R 2 Std. Error of the Estimate
10.7930.6280.6230.485
Predictors: (Constant), Zscore(Code of Practice), Zscore(Learning), Zscore(Trust).
Table 12. ANOVA for the regression model predicting Productivity.
SourceSum of SquaresdfMean SquareFSig.
Regression83.473327.824118.305<0.001
Residual49.3902100.235
Total132.864213
Dependent variable: Zscore(Productivity). Predictors: (Constant), Zscore(Code of Practice), Zscore(Learning), Zscore(Trust).
Table 13. Regression coefficients and effect sizes for predictors of Productivity.
PredictorBStd. ErrorBetatSig.ToleranceVIF
(Constant)0.0400.0361.0990.273
Learning (Z)0.5680.0520.54310.866<0.0010.7091.411
Trust (Z)0.1890.0450.2404.246<0.0010.5561.799
Code of Practice (Z)0.1650.0520.1633.1710.0020.6691.495
Table 14. Hypotheses and results.
HStatementResult ( β , p-Value, R 2 )Supported?
H 1 Higher Learning scores will be significantly associated with higher Productivity. β = 0.543 , p < 0.001 Supported
H 2 Greater Trust in AI tools will be significantly associated with higher Productivity. β = 0.240 , p < 0.001 Supported
H 3 Better Code of Practice will be significantly associated with higher Productivity. β = 0.163 , p = 0.002 Supported
H 4 The combined model of Learning, Trust, and Code of Practice will significantly explain variance in Productivity. R 2 = 0.628 , F ( 3 , 210 ) = 118.31 , p < 0.001 Supported
Disclaimer/Publisher’s Note: The statements, opinions and data contained in all publications are solely those of the individual author(s) and contributor(s) and not of MDPI and/or the editor(s). MDPI and/or the editor(s) disclaim responsibility for any injury to people or property resulting from any ideas, methods, instructions or products referred to in the content.