Figure 1.
Methodology overview: participants and survey design, IRB-approved data collection, measurement preparation (cleaning, reliability, validity, normality), and analyses addressing RQ1–RQ6.
Figure 1.
Methodology overview: participants and survey design, IRB-approved data collection, measurement preparation (cleaning, reliability, validity, normality), and analyses addressing RQ1–RQ6.
Figure 2.
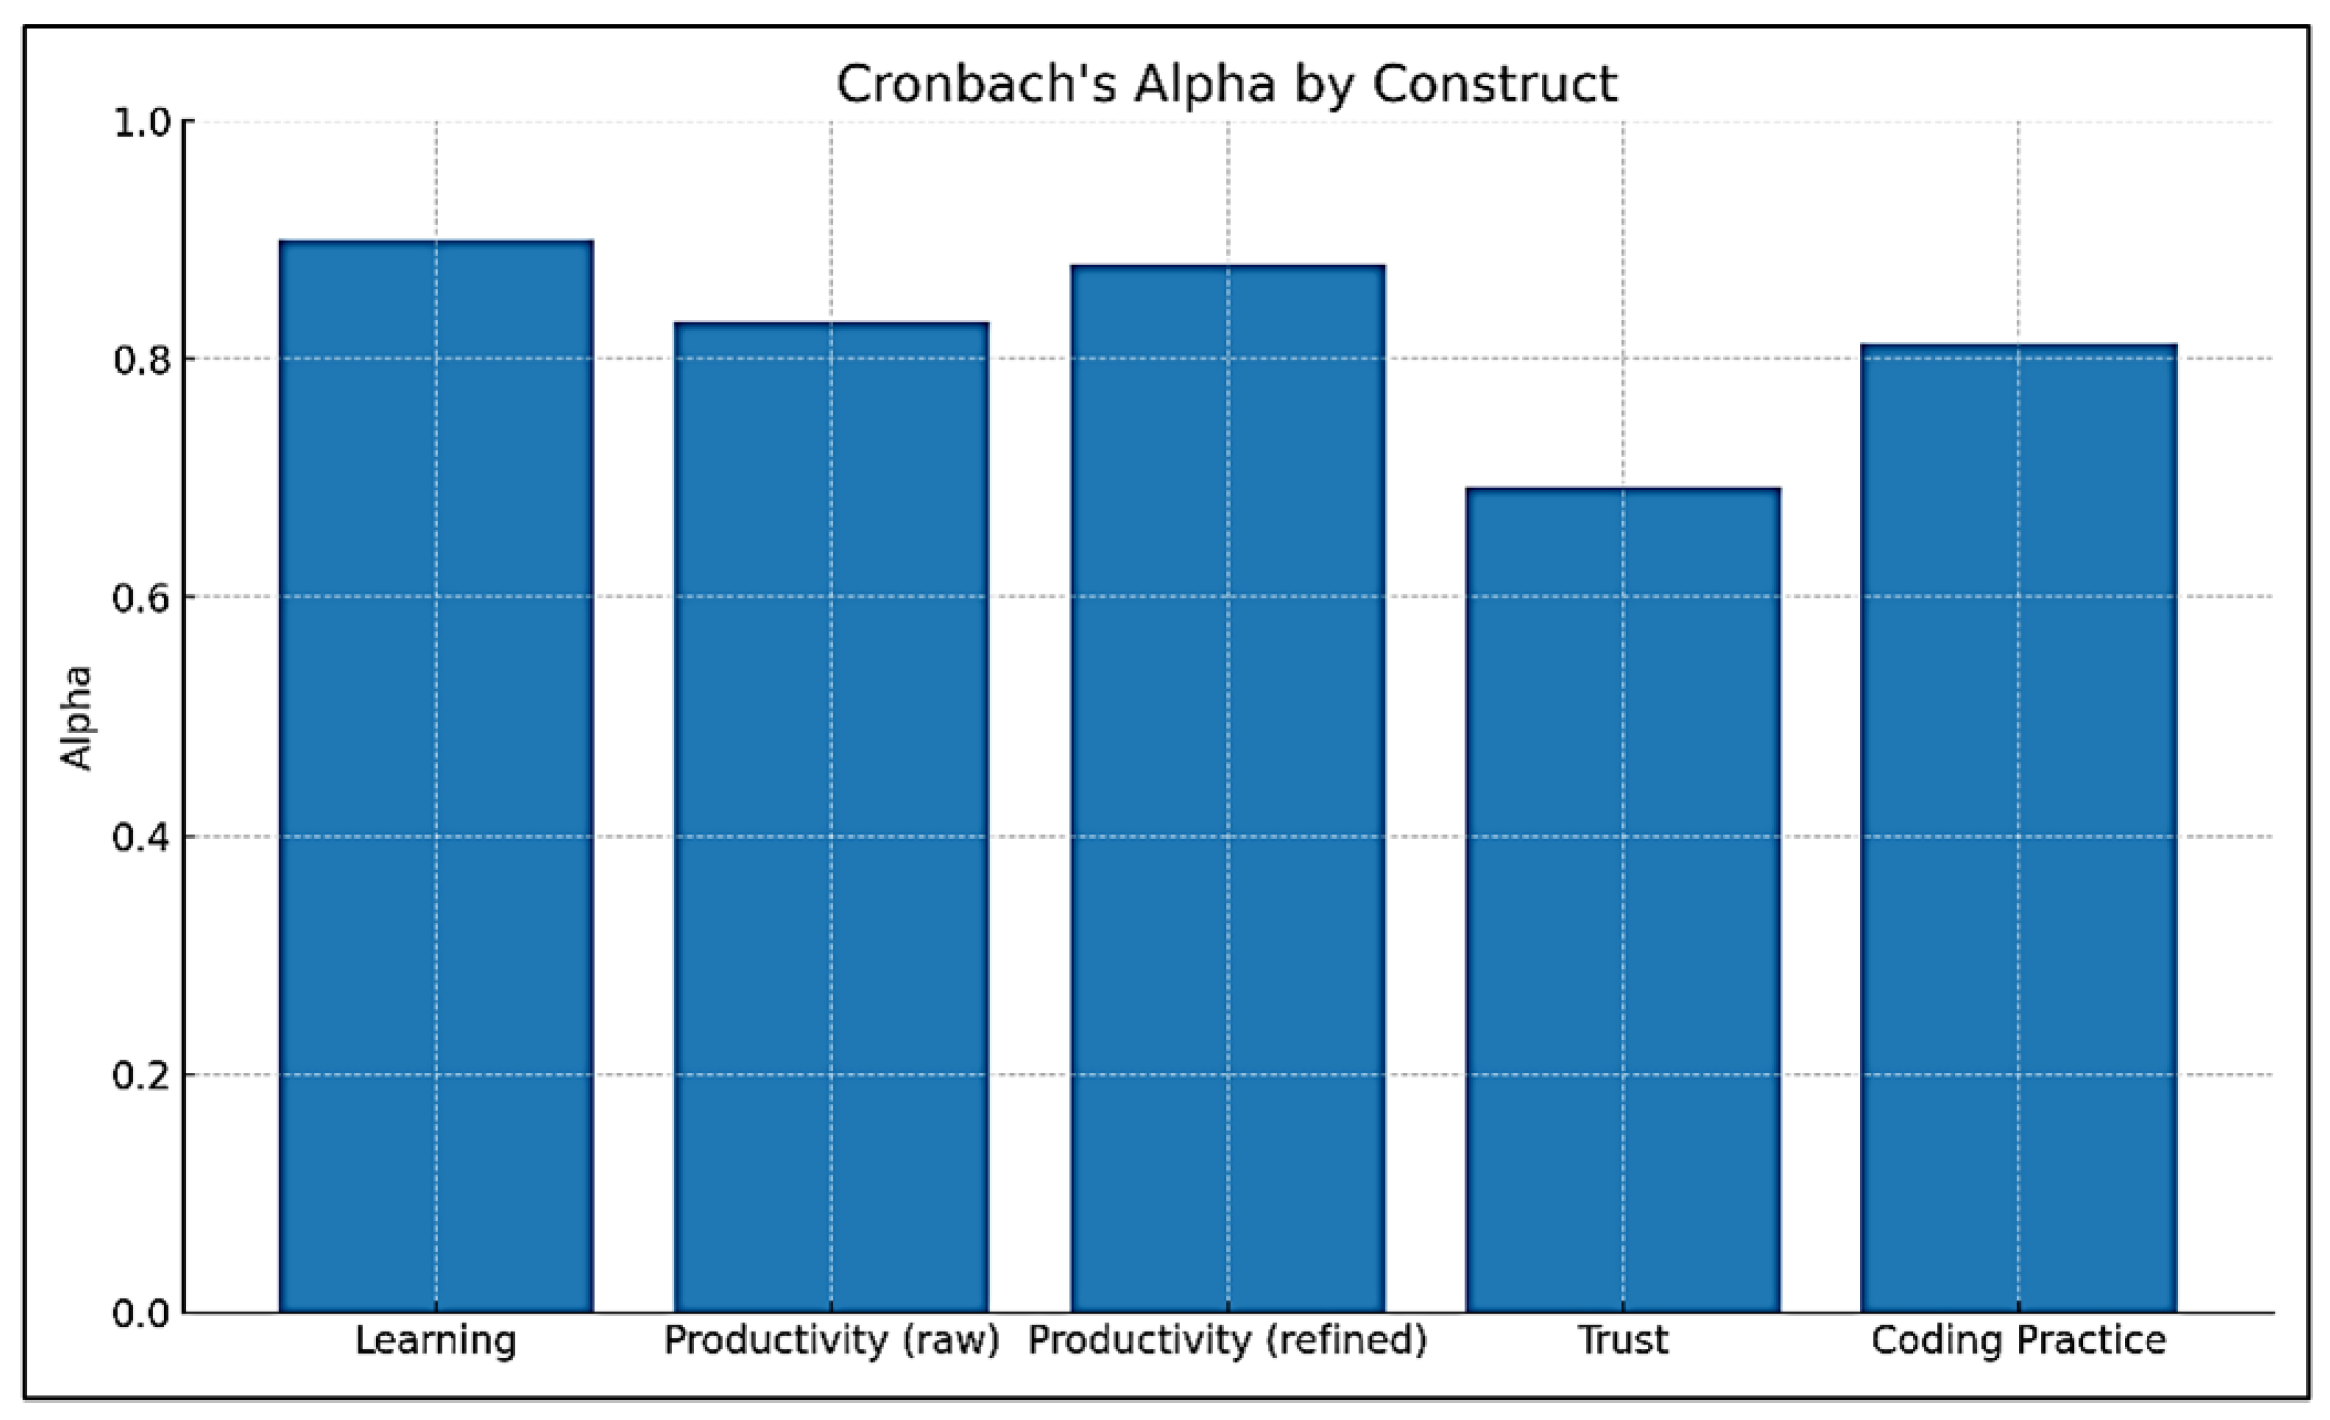
Cronbach alpha.
Figure 2.
Cronbach alpha.
Figure 3.
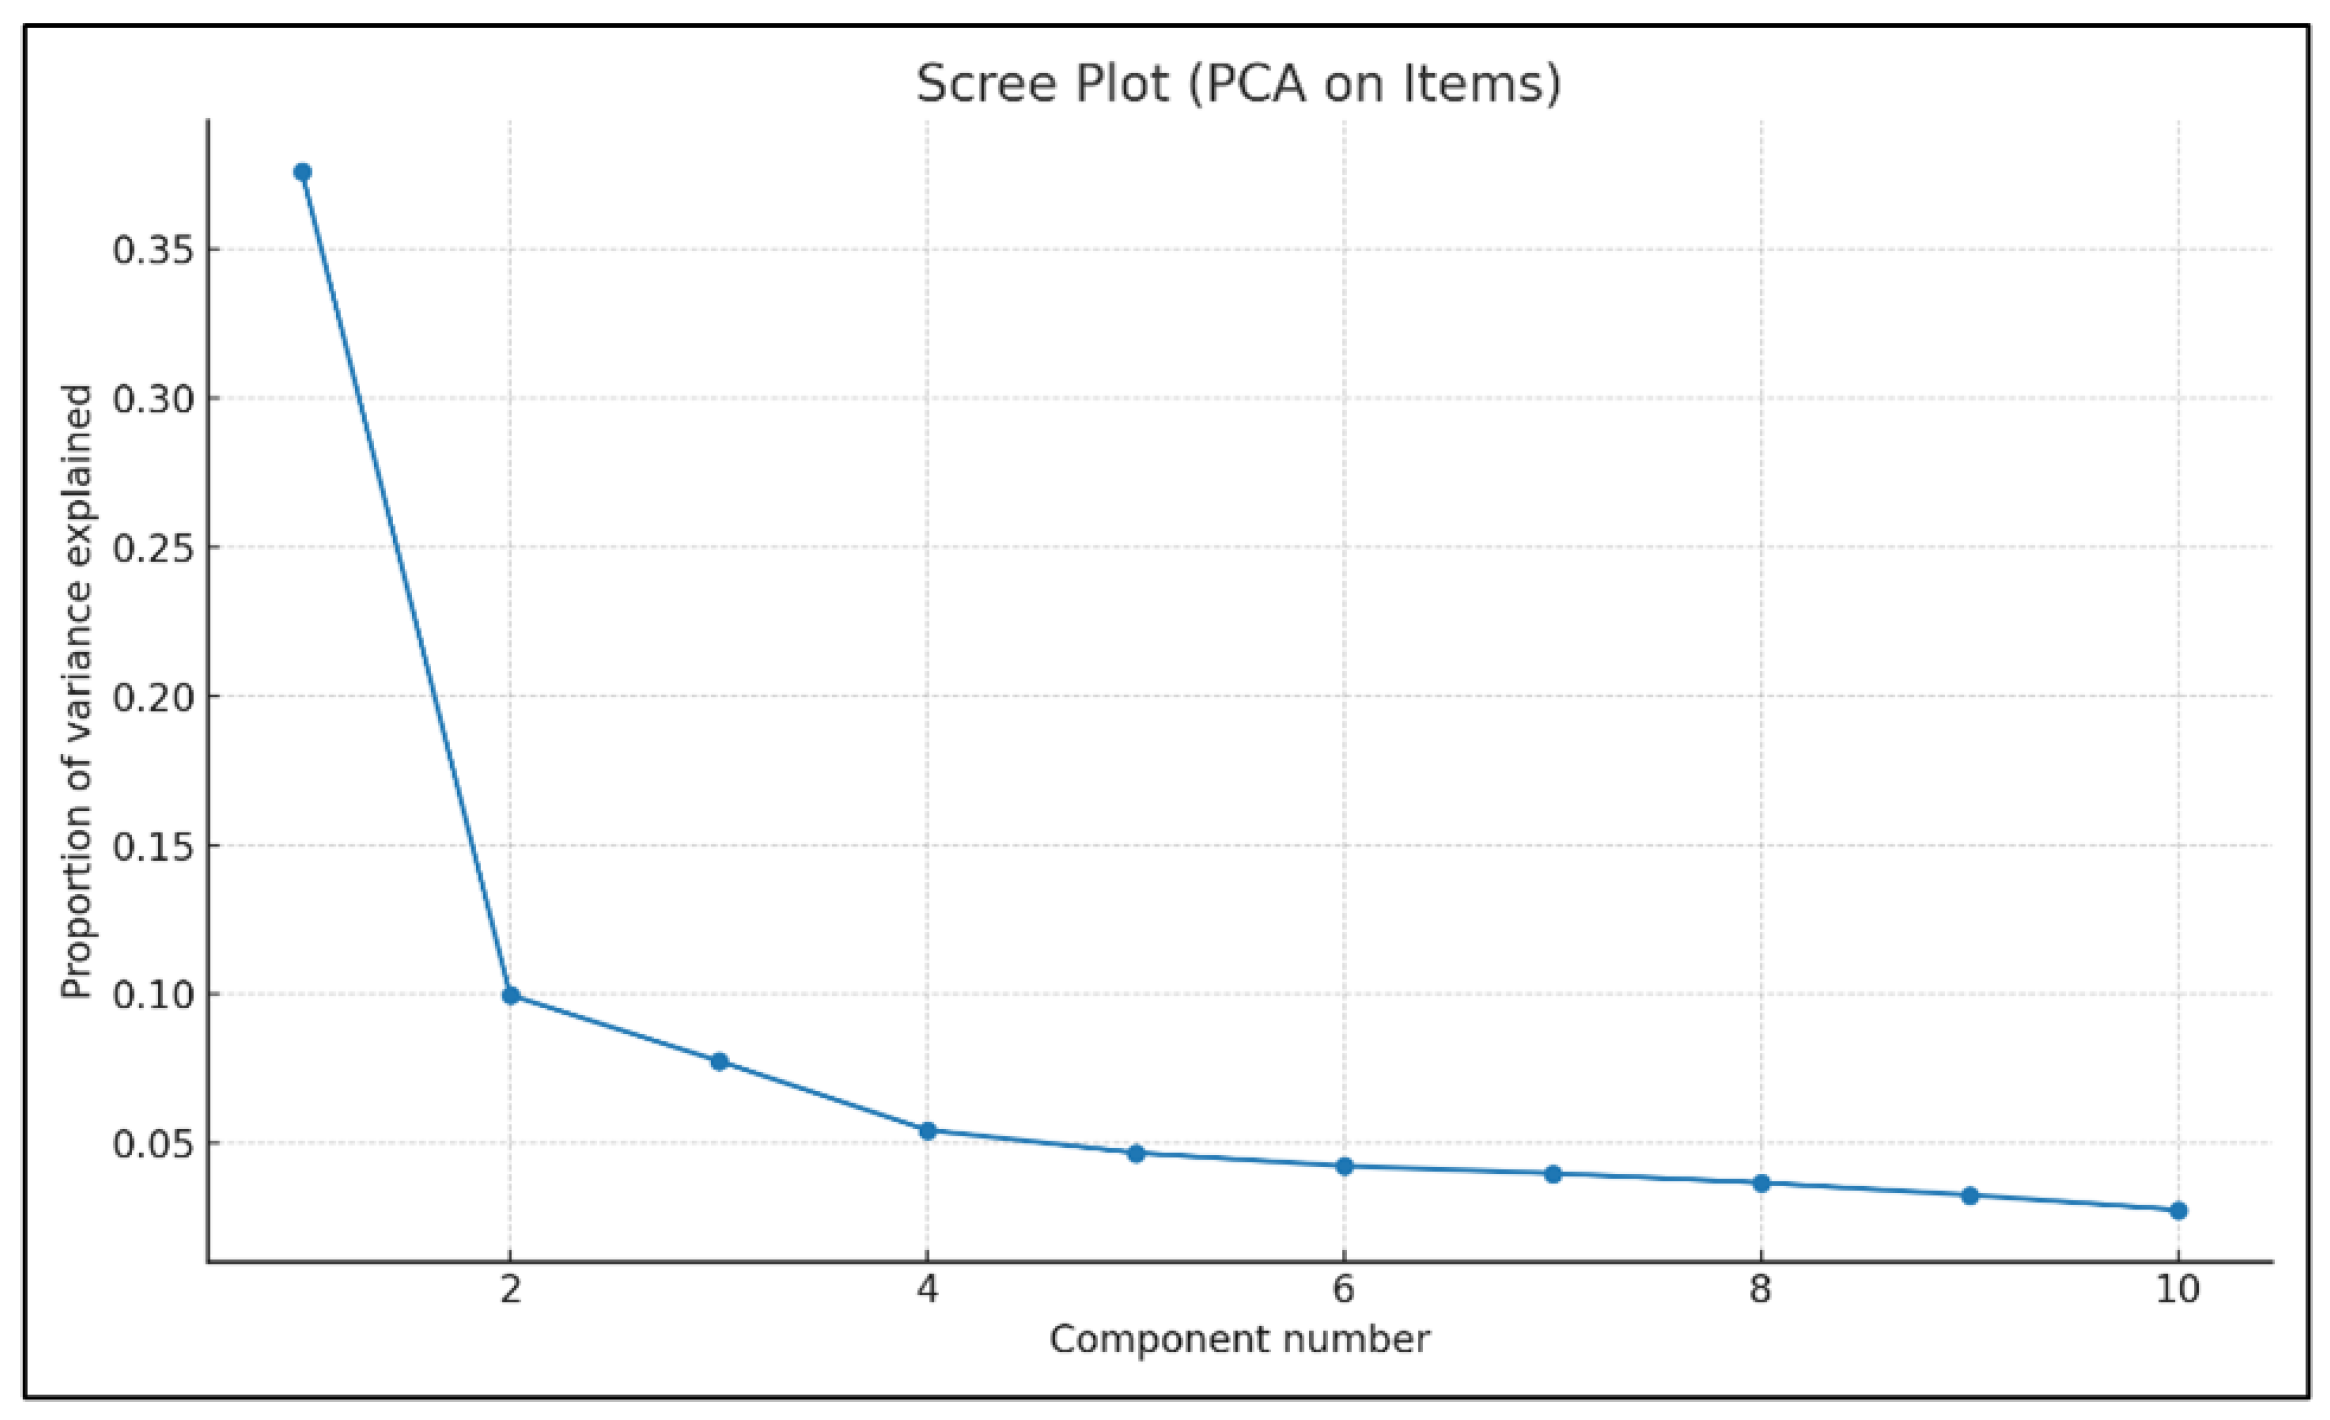
Principal components analysis plot and loadings supporting the four-construct structure (Learning, Productivity, Trust, Code of Practice).
Figure 3.
Principal components analysis plot and loadings supporting the four-construct structure (Learning, Productivity, Trust, Code of Practice).
Figure 4.
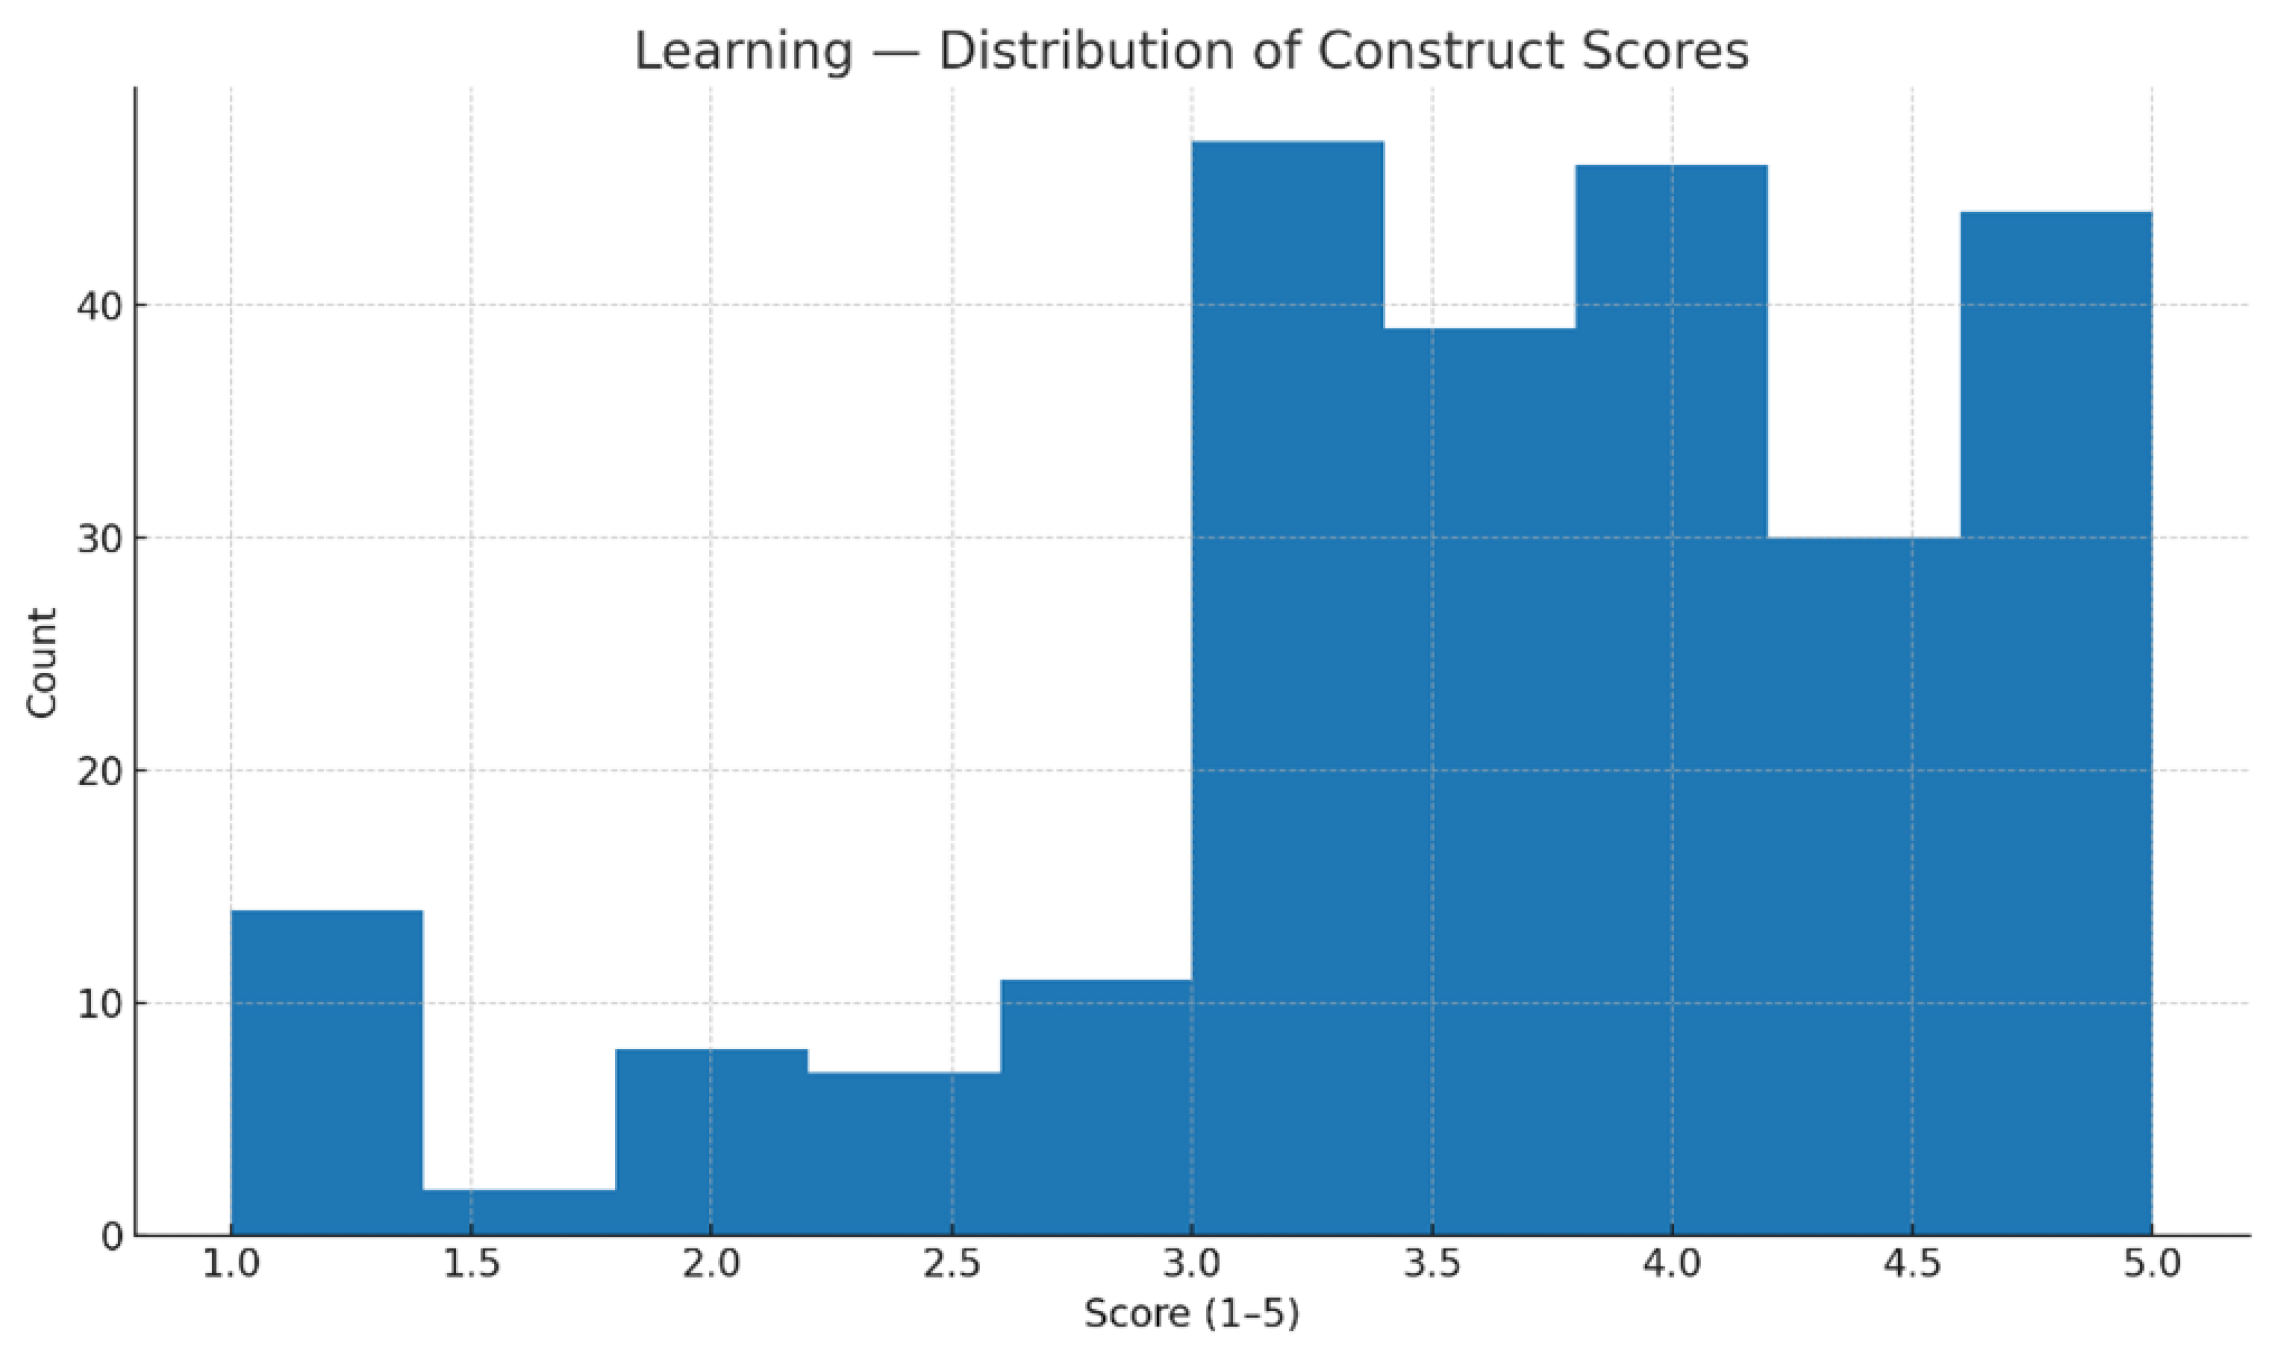
Distribution of Learning construct scores (1–5), showing a strong positive skew toward higher agreement. Most students reported values between 4 and 5, indicating widespread perception that AI coding assistants enhanced their understanding, retention, and problem-solving skills.
Figure 4.
Distribution of Learning construct scores (1–5), showing a strong positive skew toward higher agreement. Most students reported values between 4 and 5, indicating widespread perception that AI coding assistants enhanced their understanding, retention, and problem-solving skills.
Figure 5.
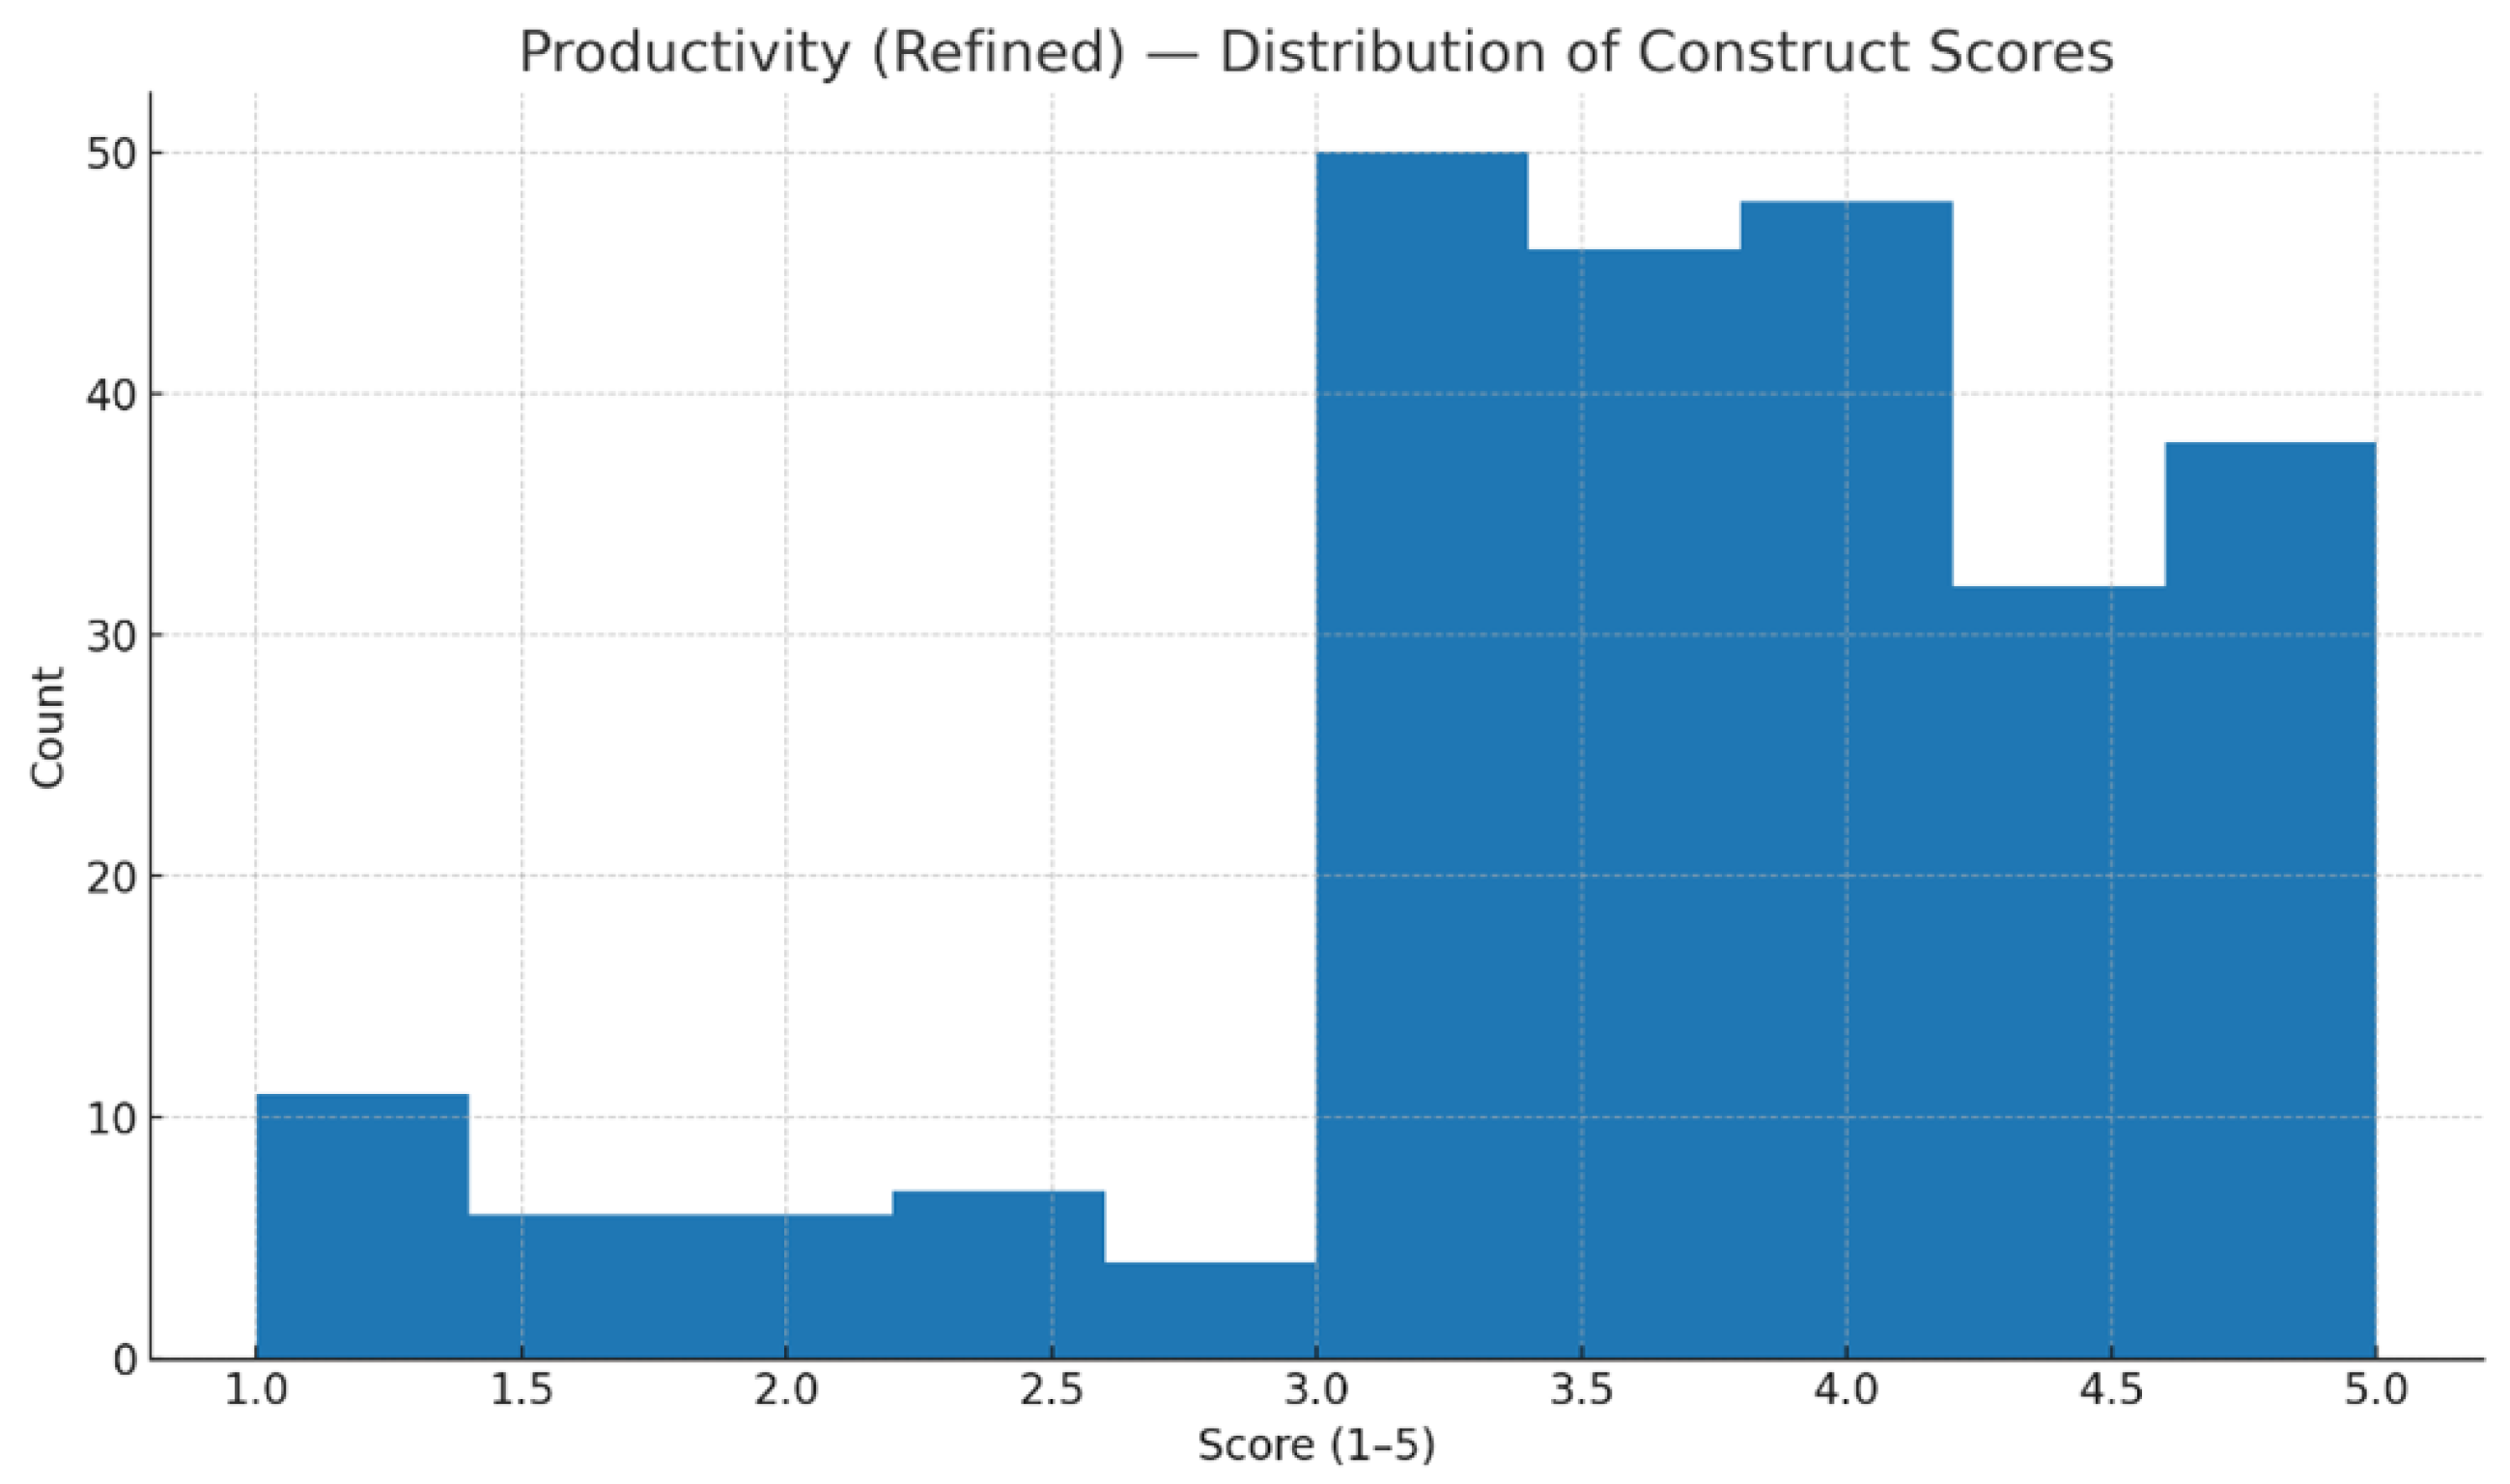
Distribution of Productivity construct scores (refined scale), illustrating generally high ratings with slightly greater variability than Learning.
Figure 5.
Distribution of Productivity construct scores (refined scale), illustrating generally high ratings with slightly greater variability than Learning.
Figure 6.
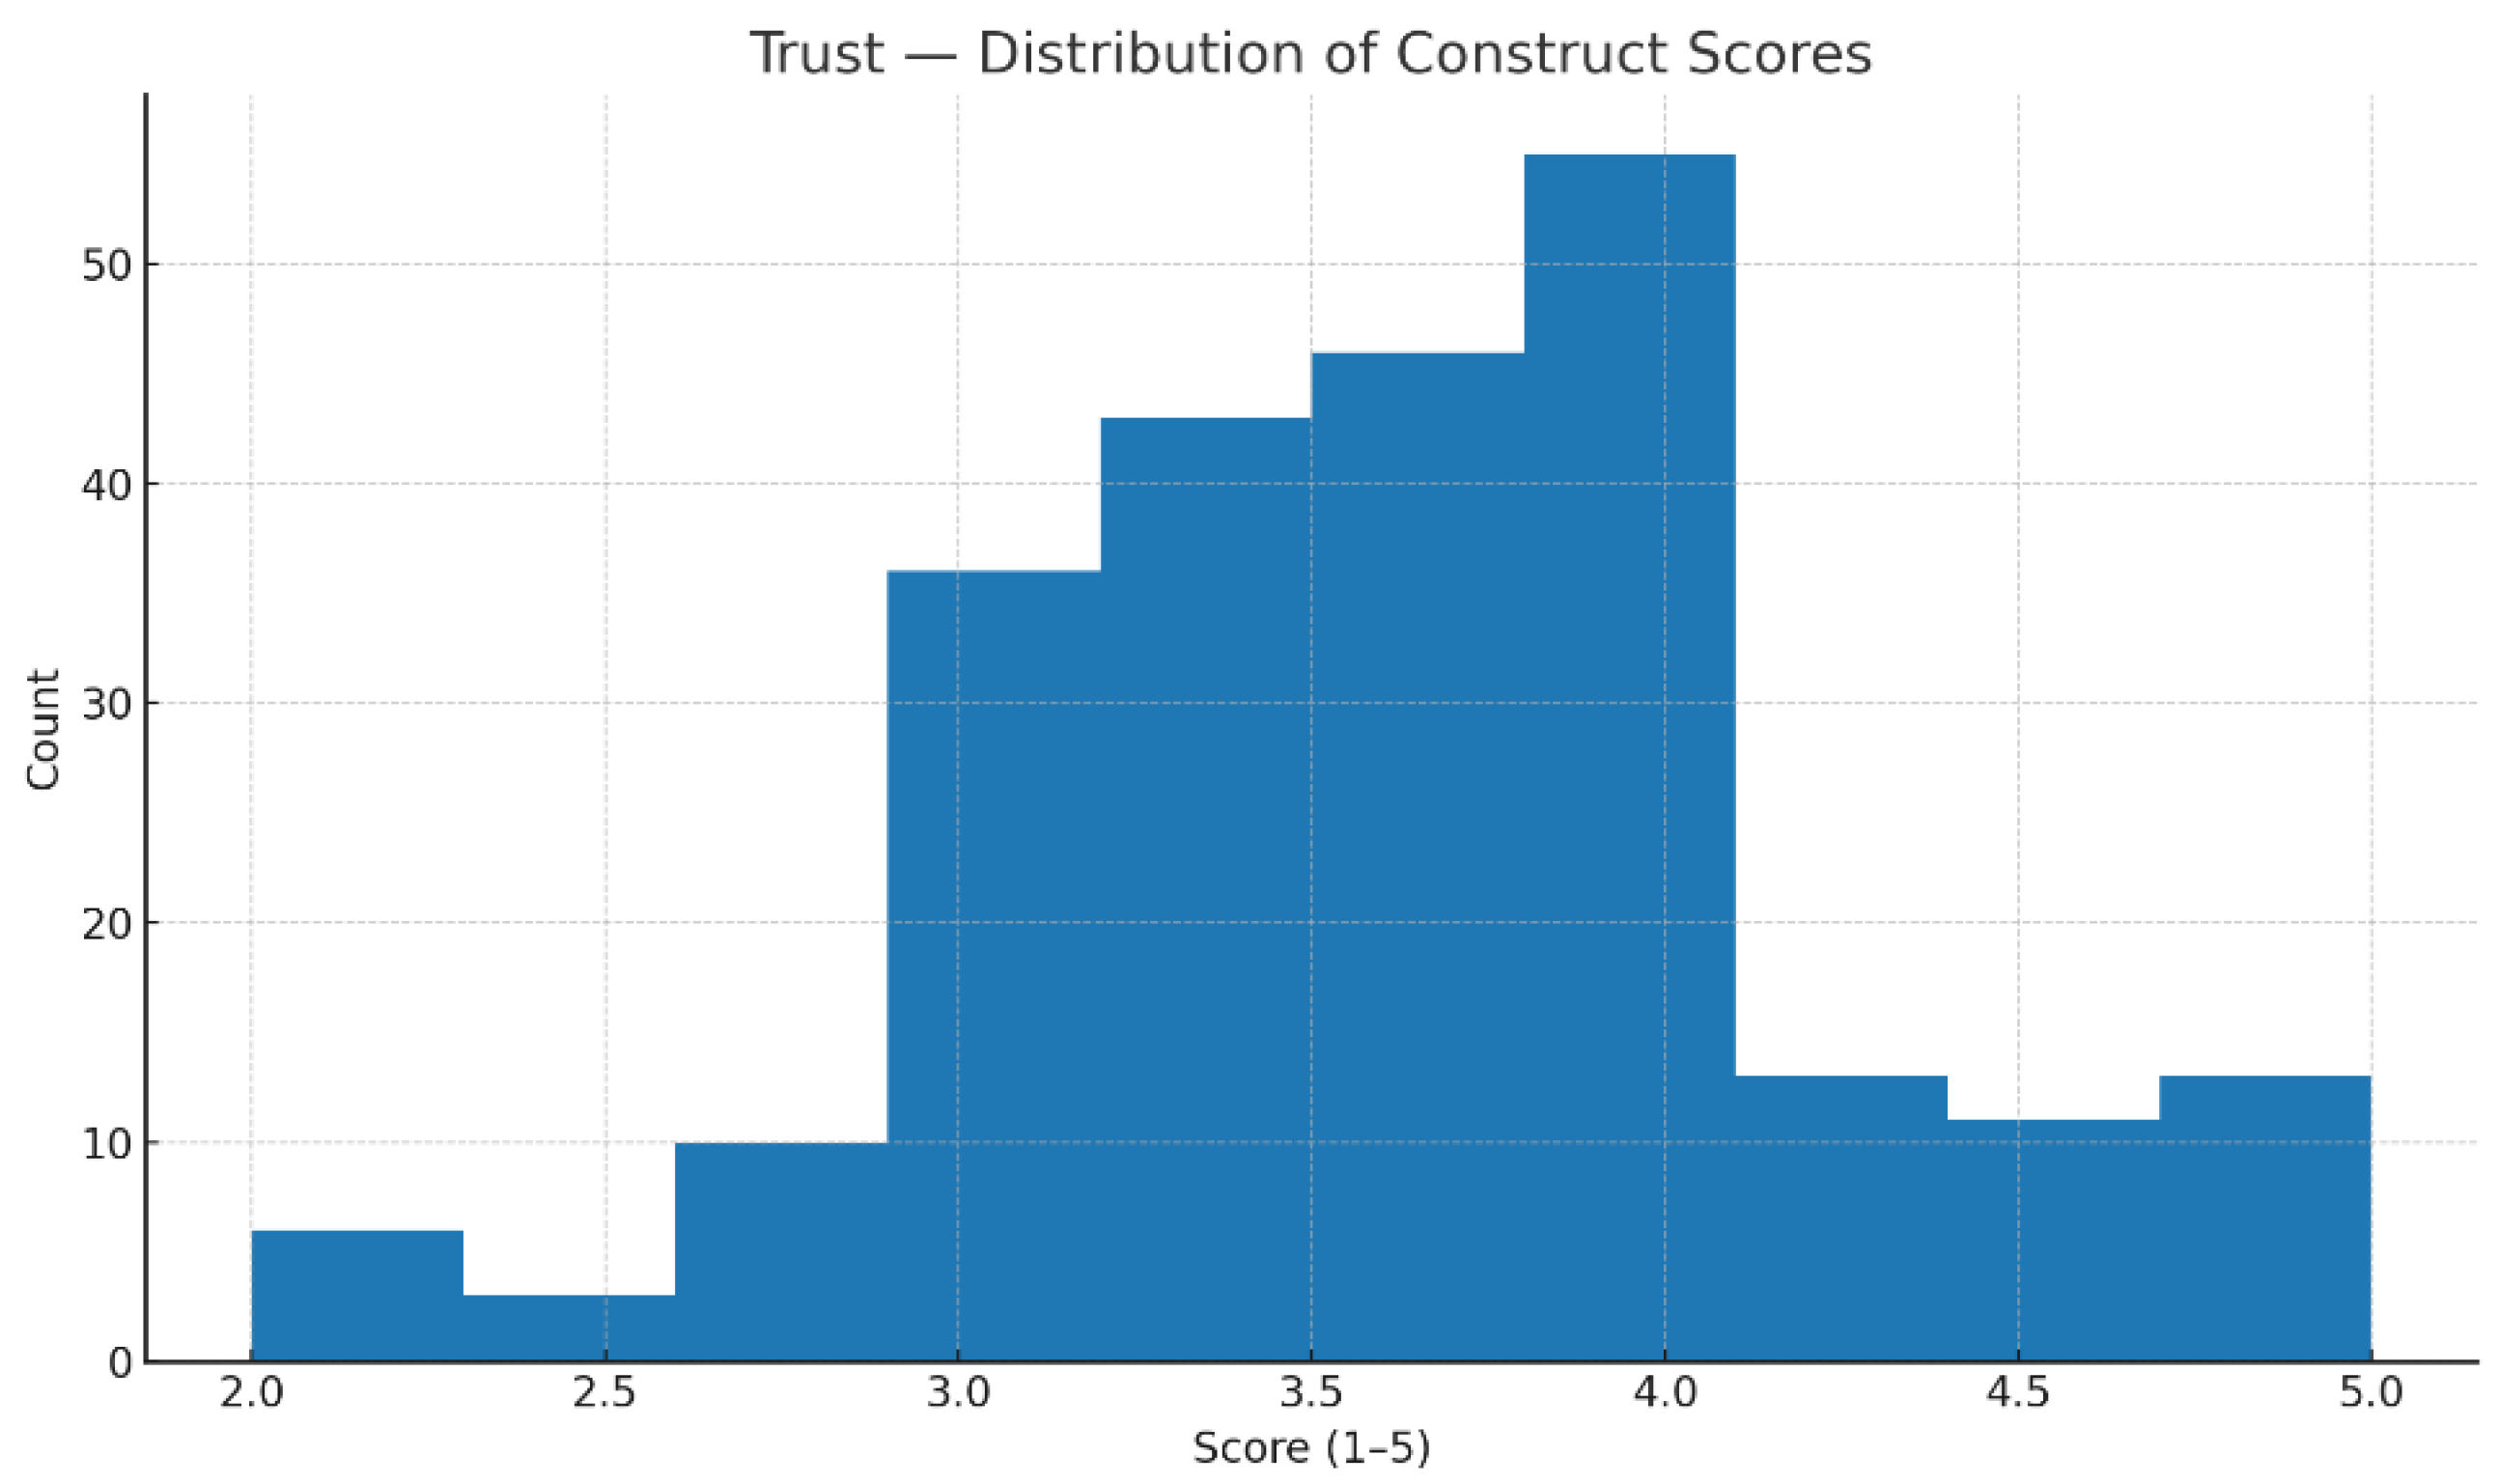
Distribution of Trust construct scores, reflecting the widest spread among all constructs, with both high-trust and cautious responses represented.
Figure 6.
Distribution of Trust construct scores, reflecting the widest spread among all constructs, with both high-trust and cautious responses represented.
Figure 7.
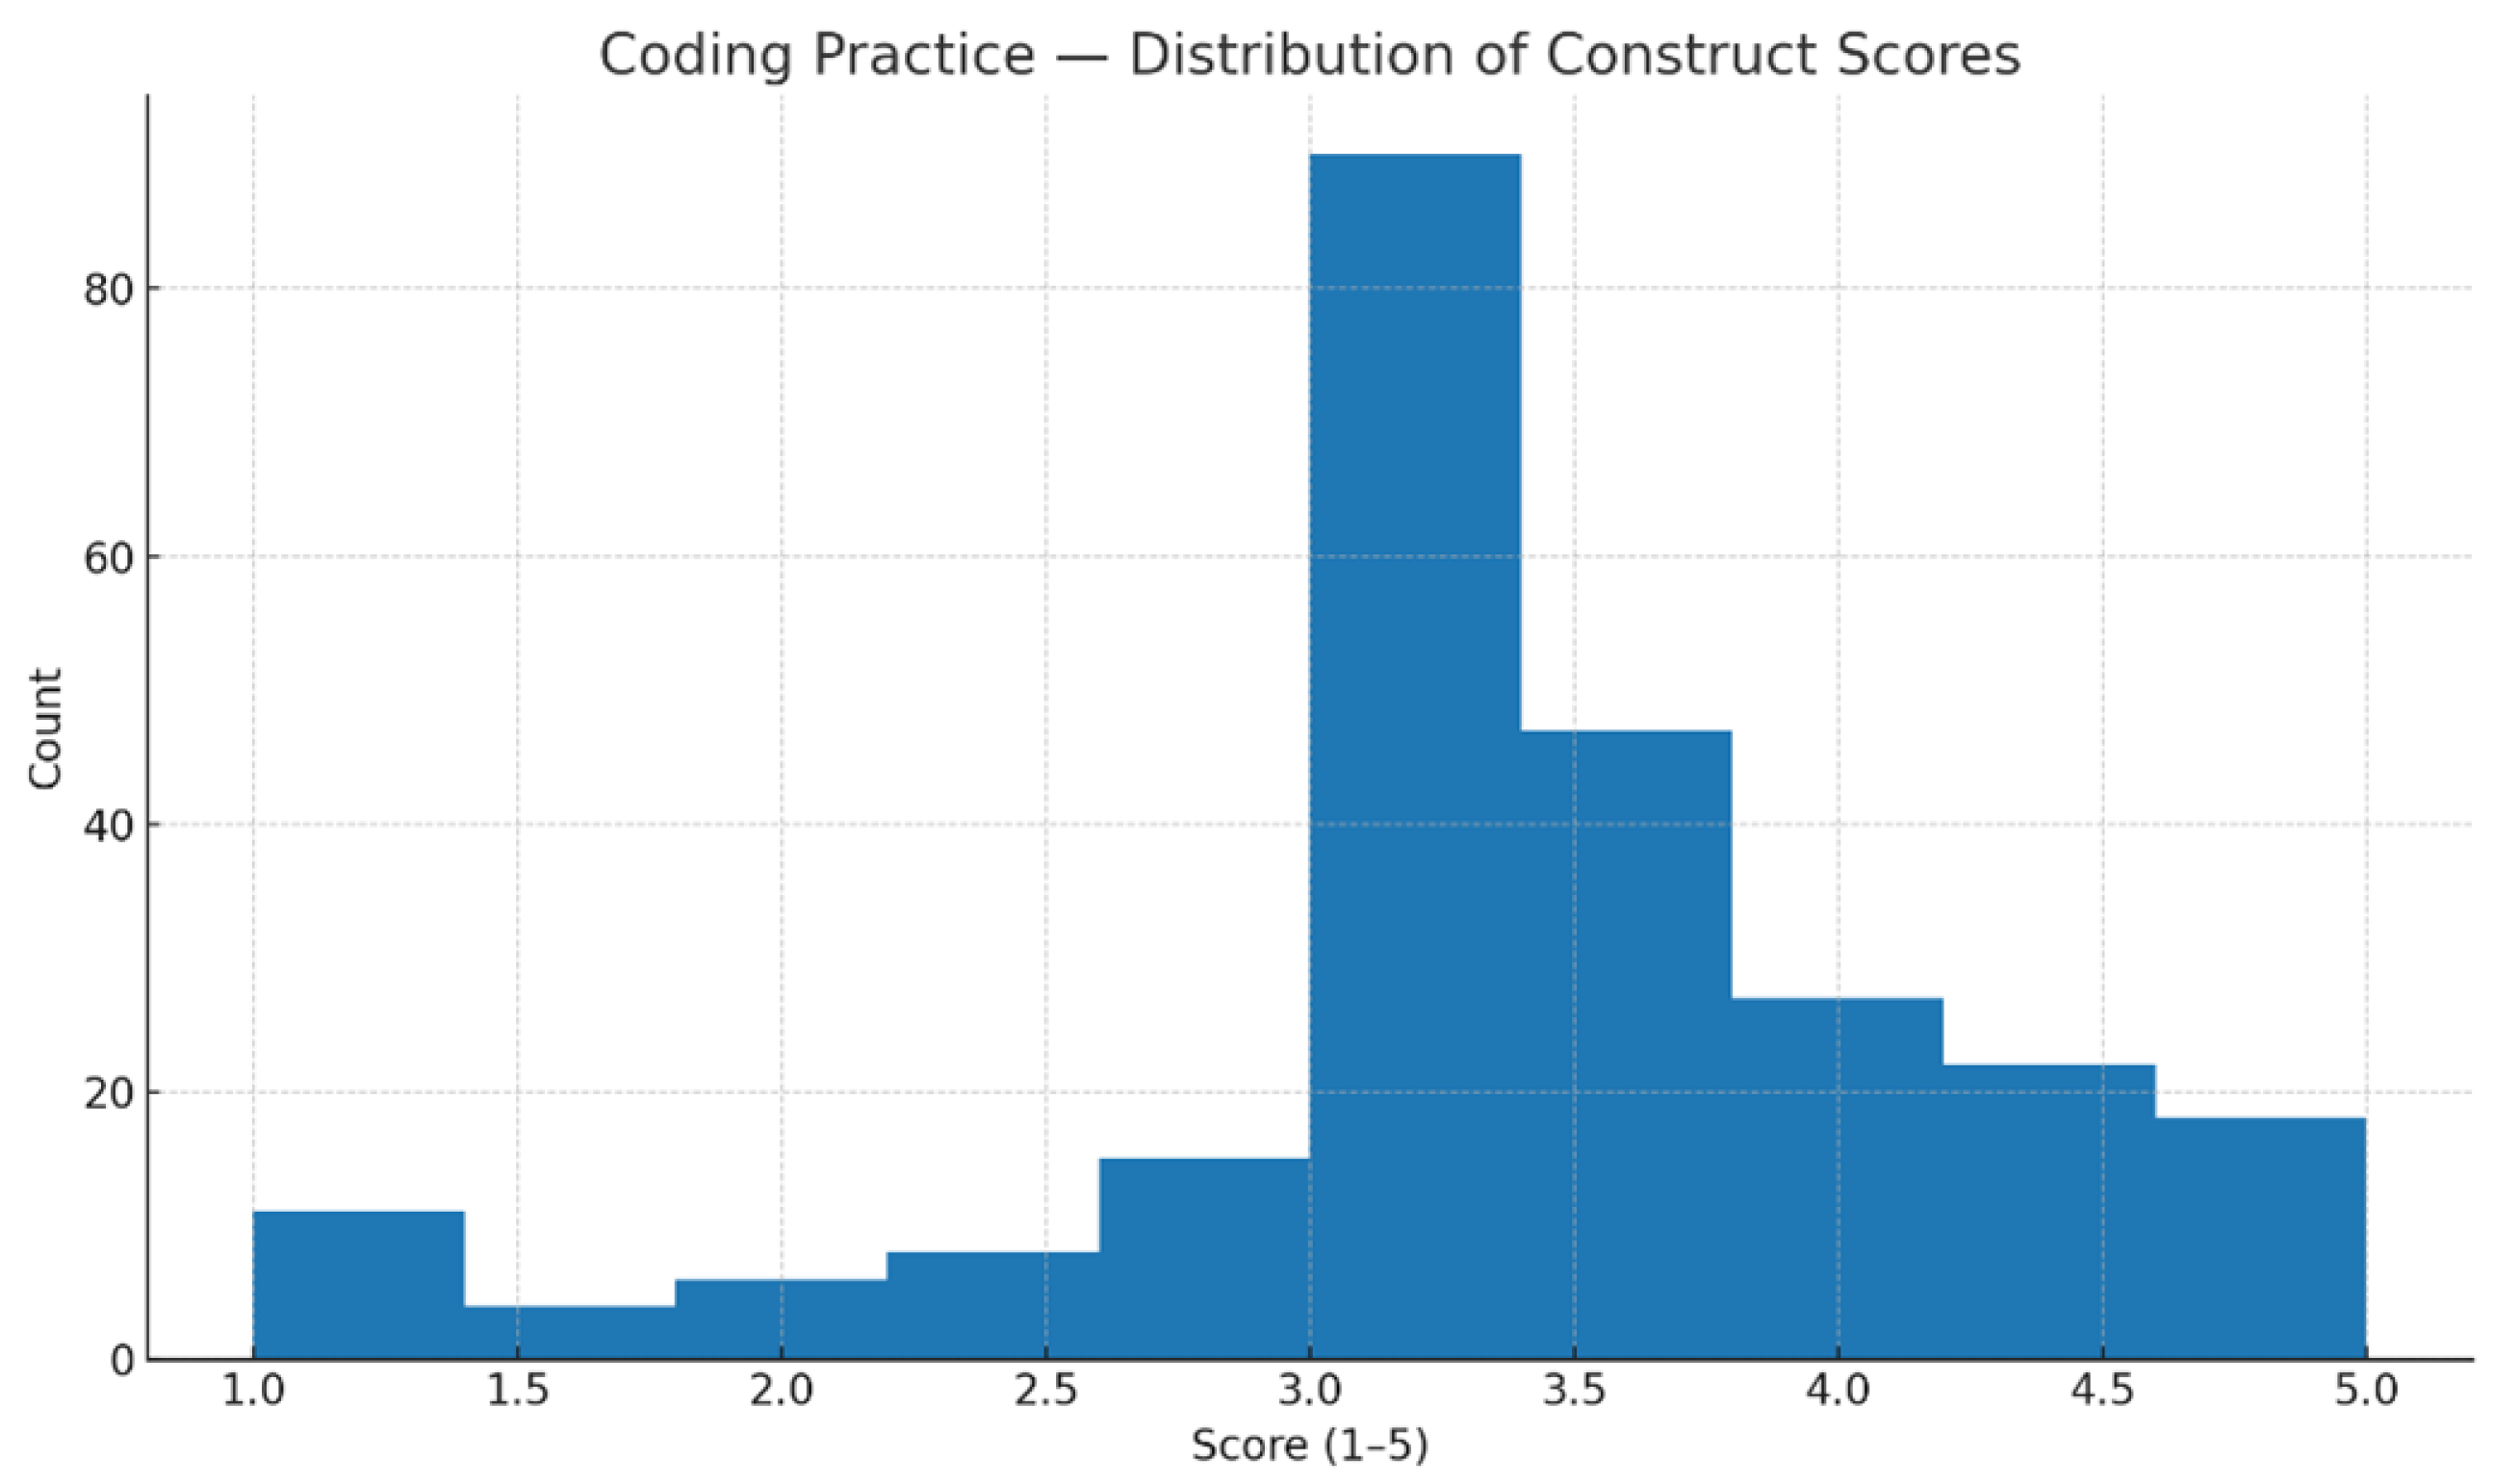
Distribution of Code of Practice construct scores, indicating moderately high agreement on AI’s influence on coding habits, with some variation in concerns about over-reliance and ethics.
Figure 7.
Distribution of Code of Practice construct scores, indicating moderately high agreement on AI’s influence on coding habits, with some variation in concerns about over-reliance and ethics.
Figure 8.
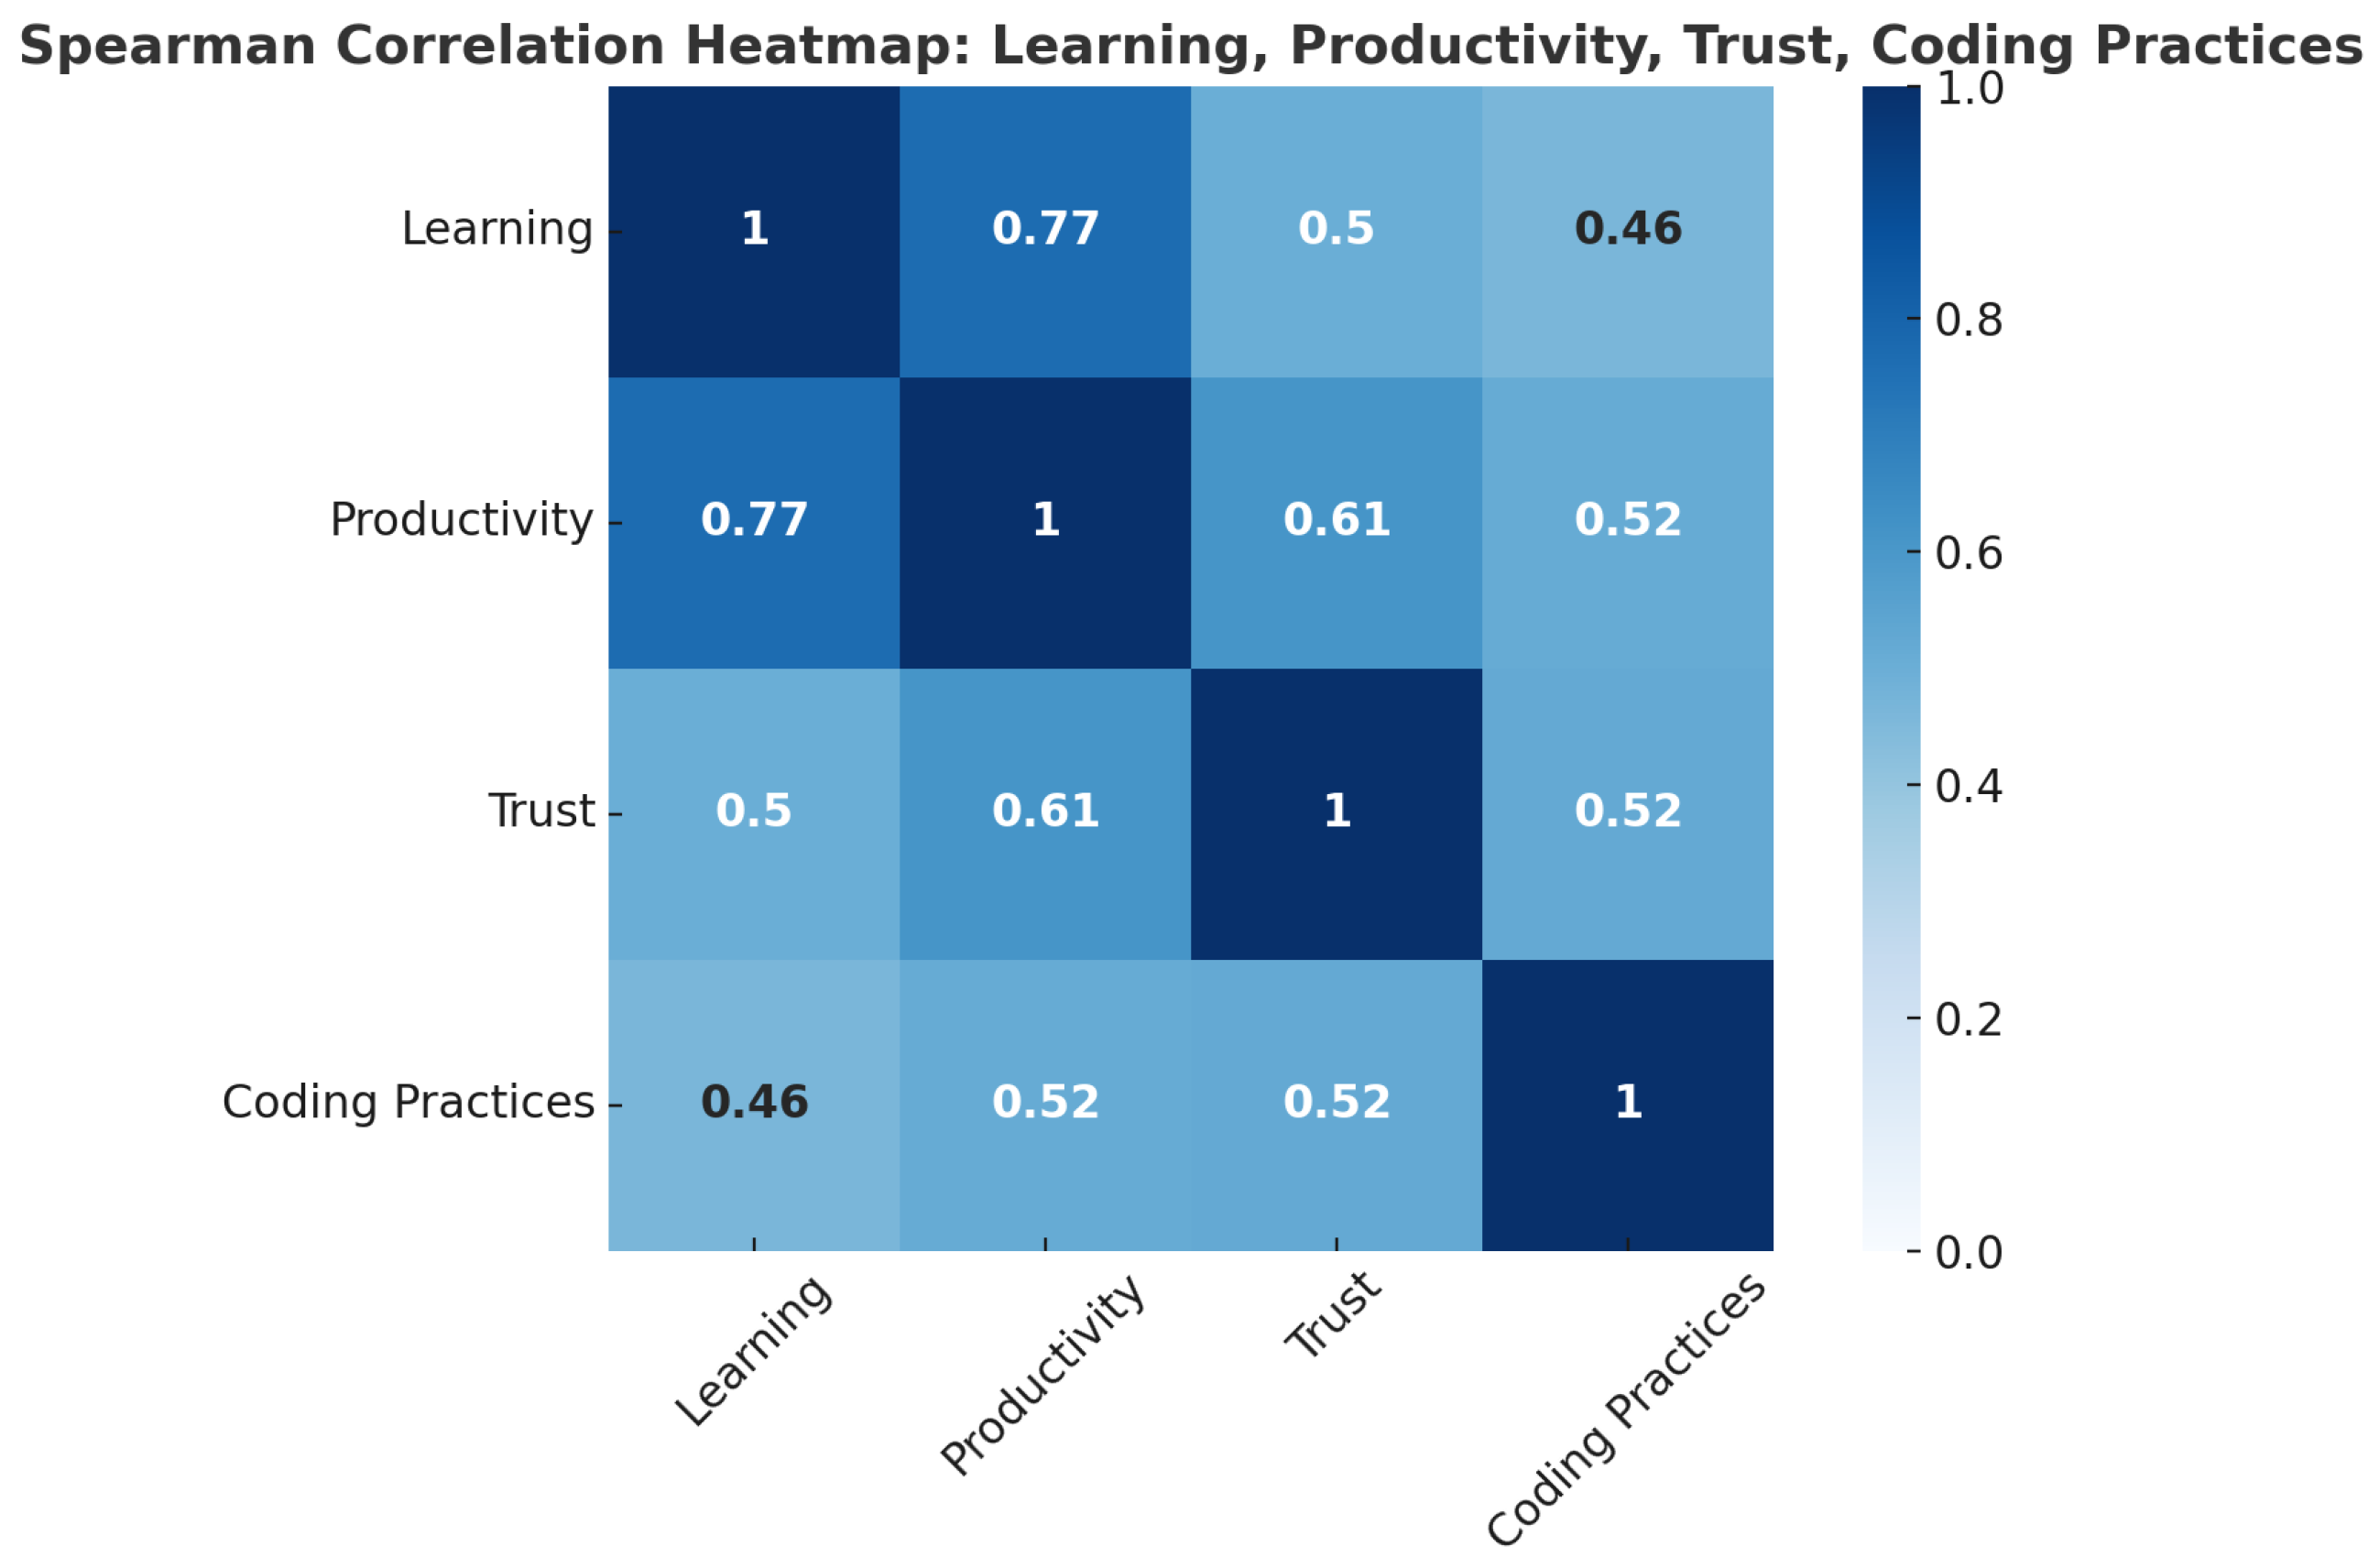
Spearman correlation heatmap among Learning, Productivity, Trust, and Code of Practice, highlighting consistently positive and significant associations.
Figure 8.
Spearman correlation heatmap among Learning, Productivity, Trust, and Code of Practice, highlighting consistently positive and significant associations.
Figure 9.
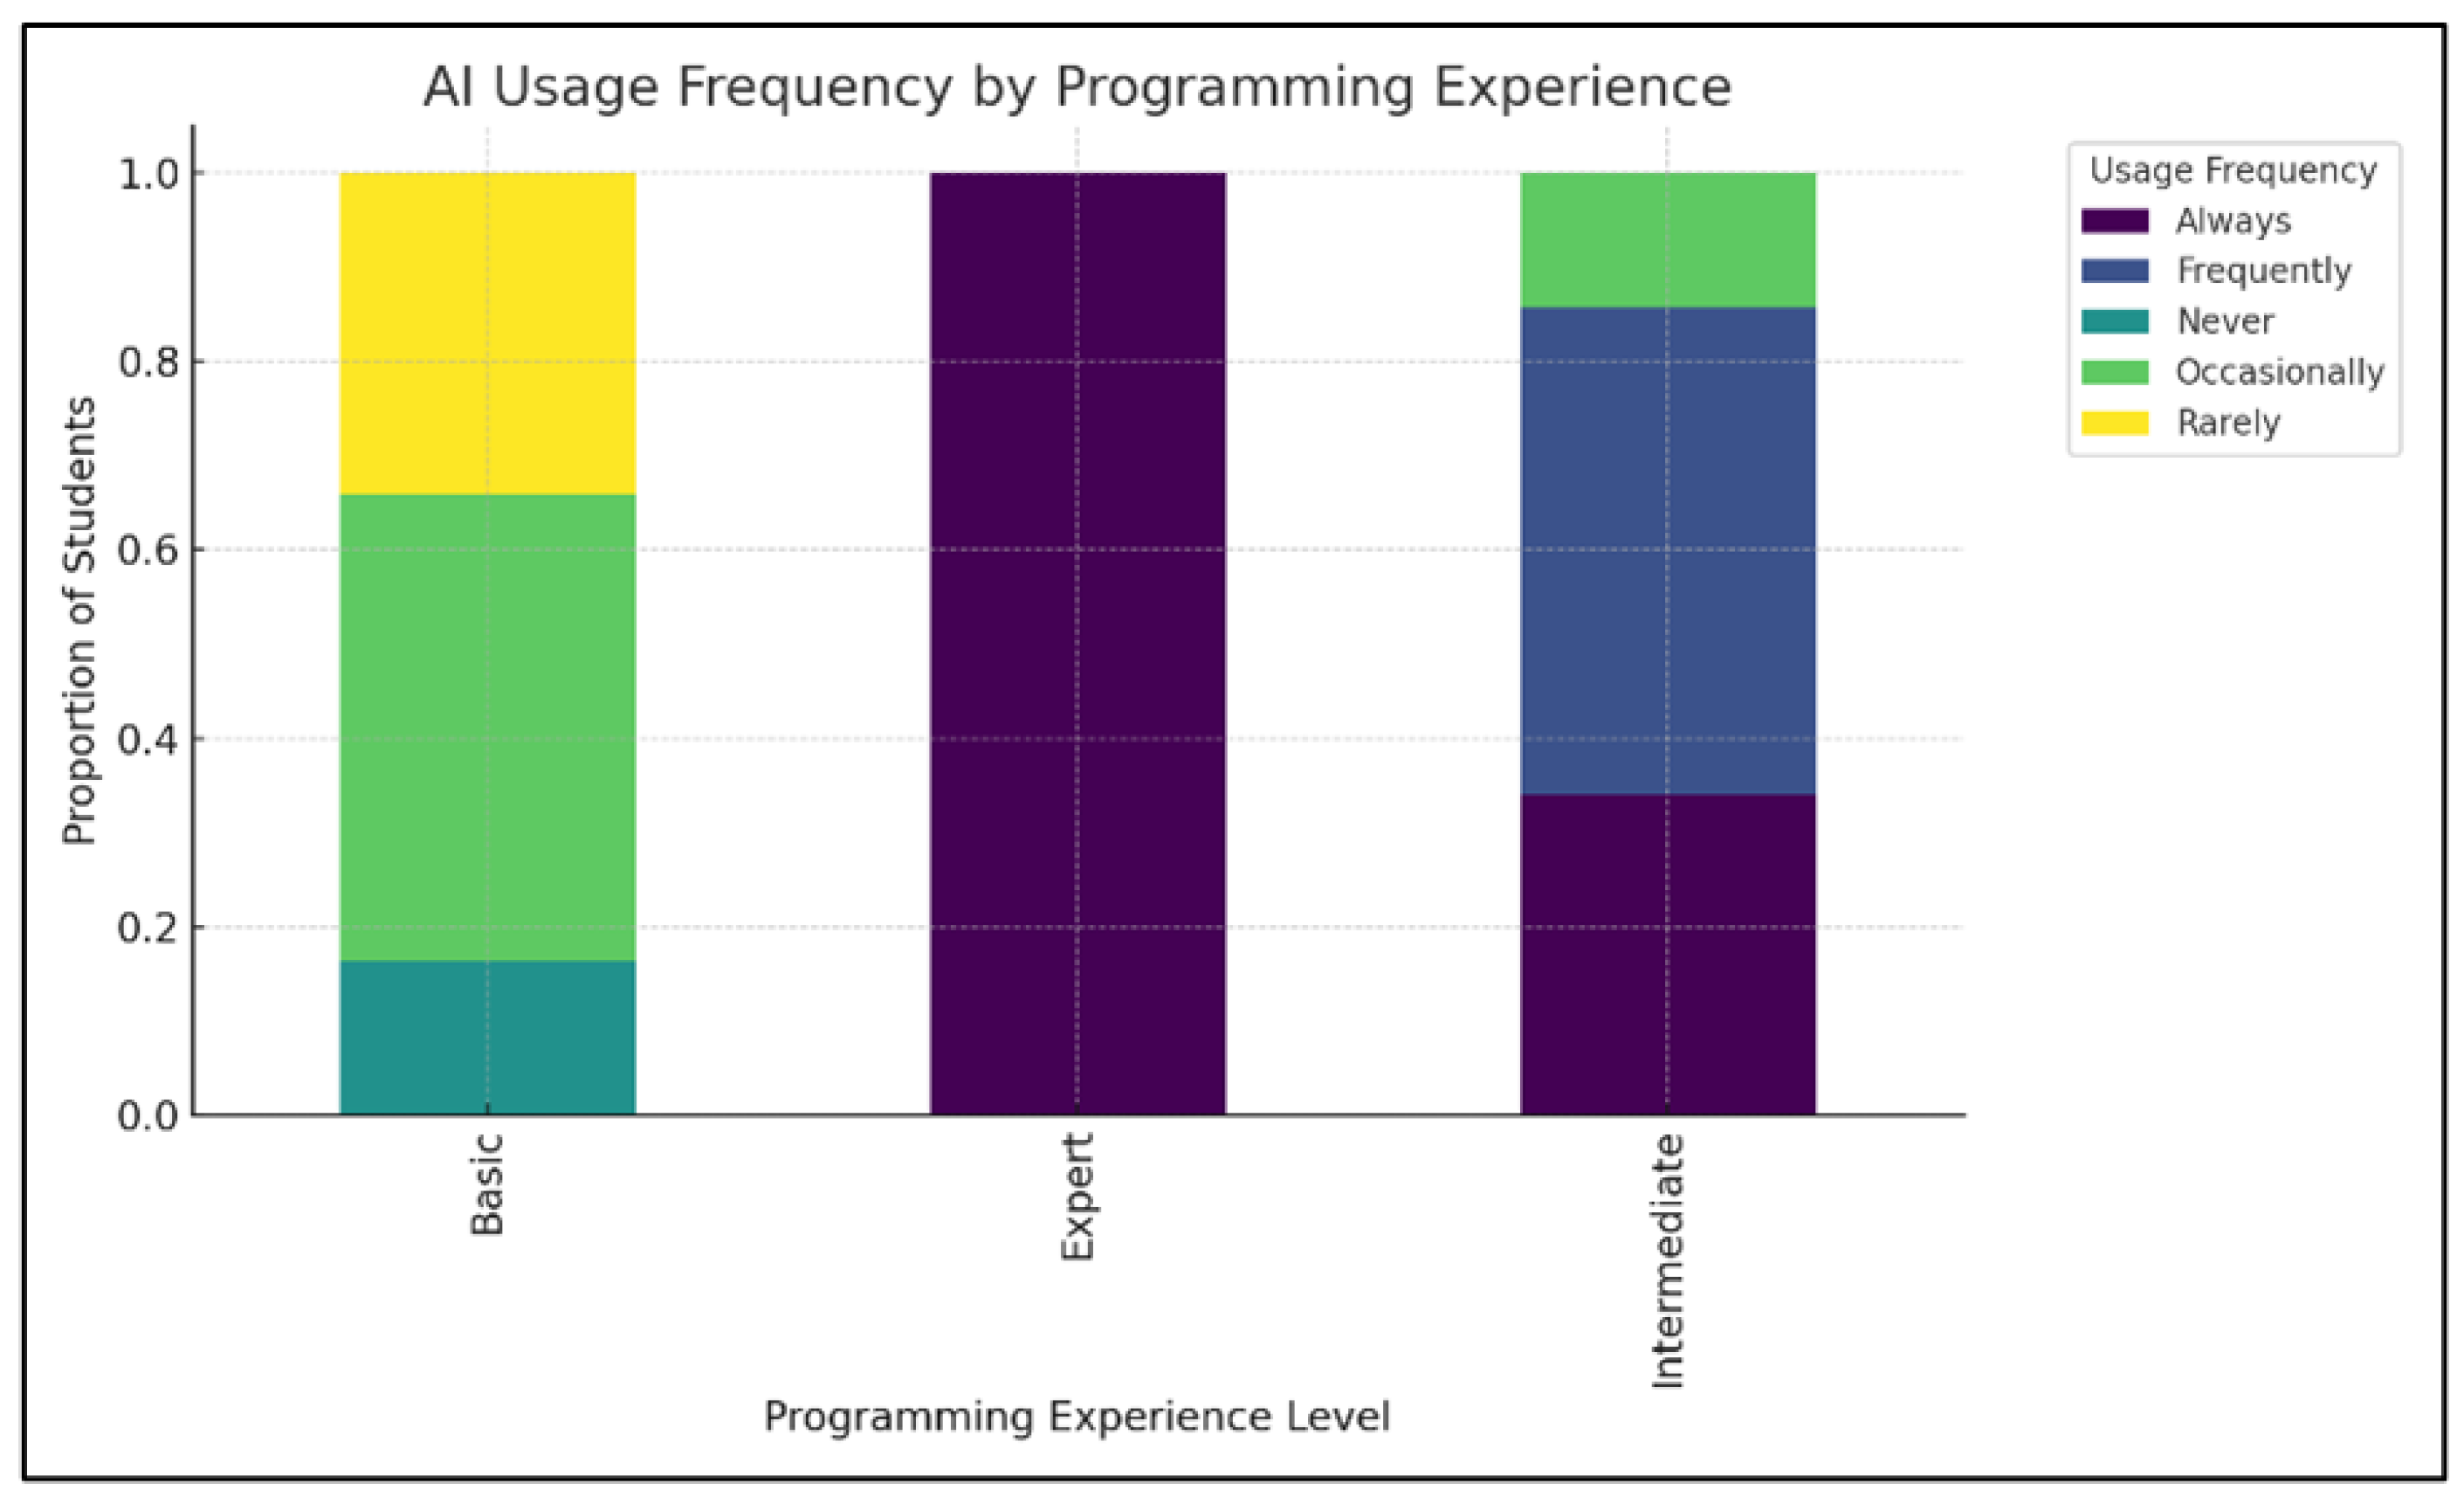
Numerical distribution of AI usage frequencies by programming experience.
Figure 9.
Numerical distribution of AI usage frequencies by programming experience.
Figure 10.
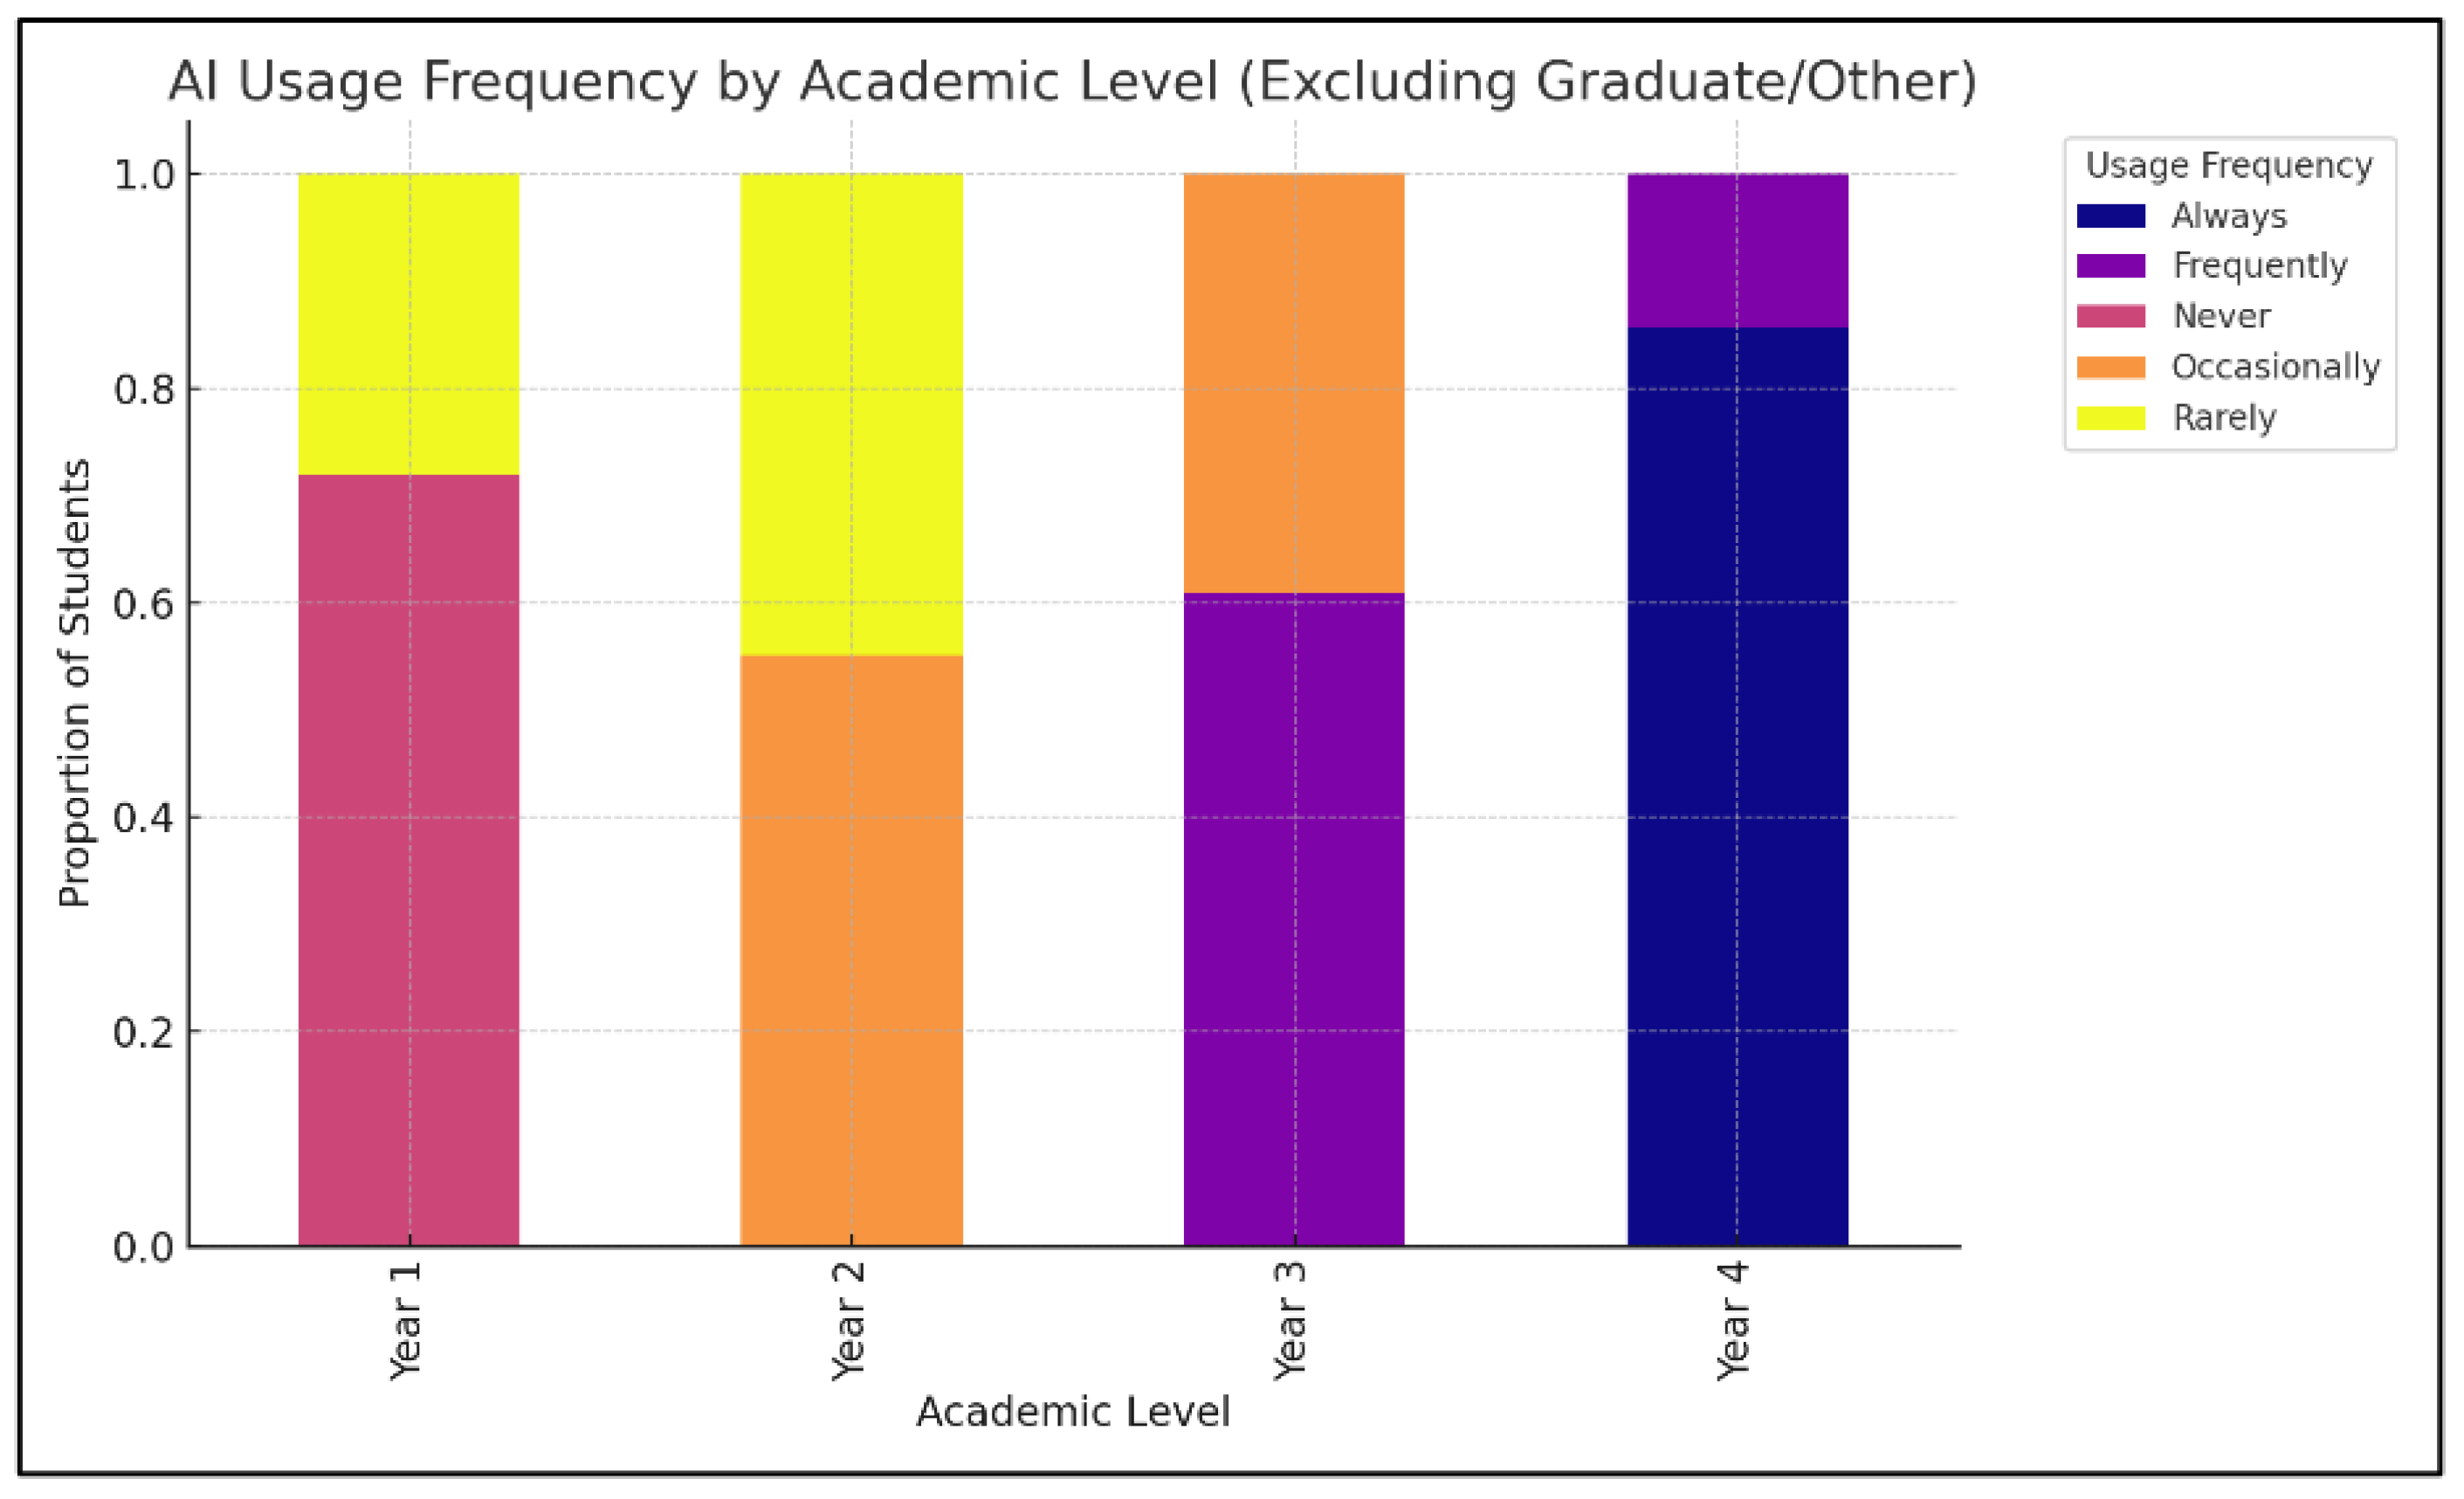
Numerical distribution of AI usage frequencies by academic level.
Figure 10.
Numerical distribution of AI usage frequencies by academic level.
Figure 11.
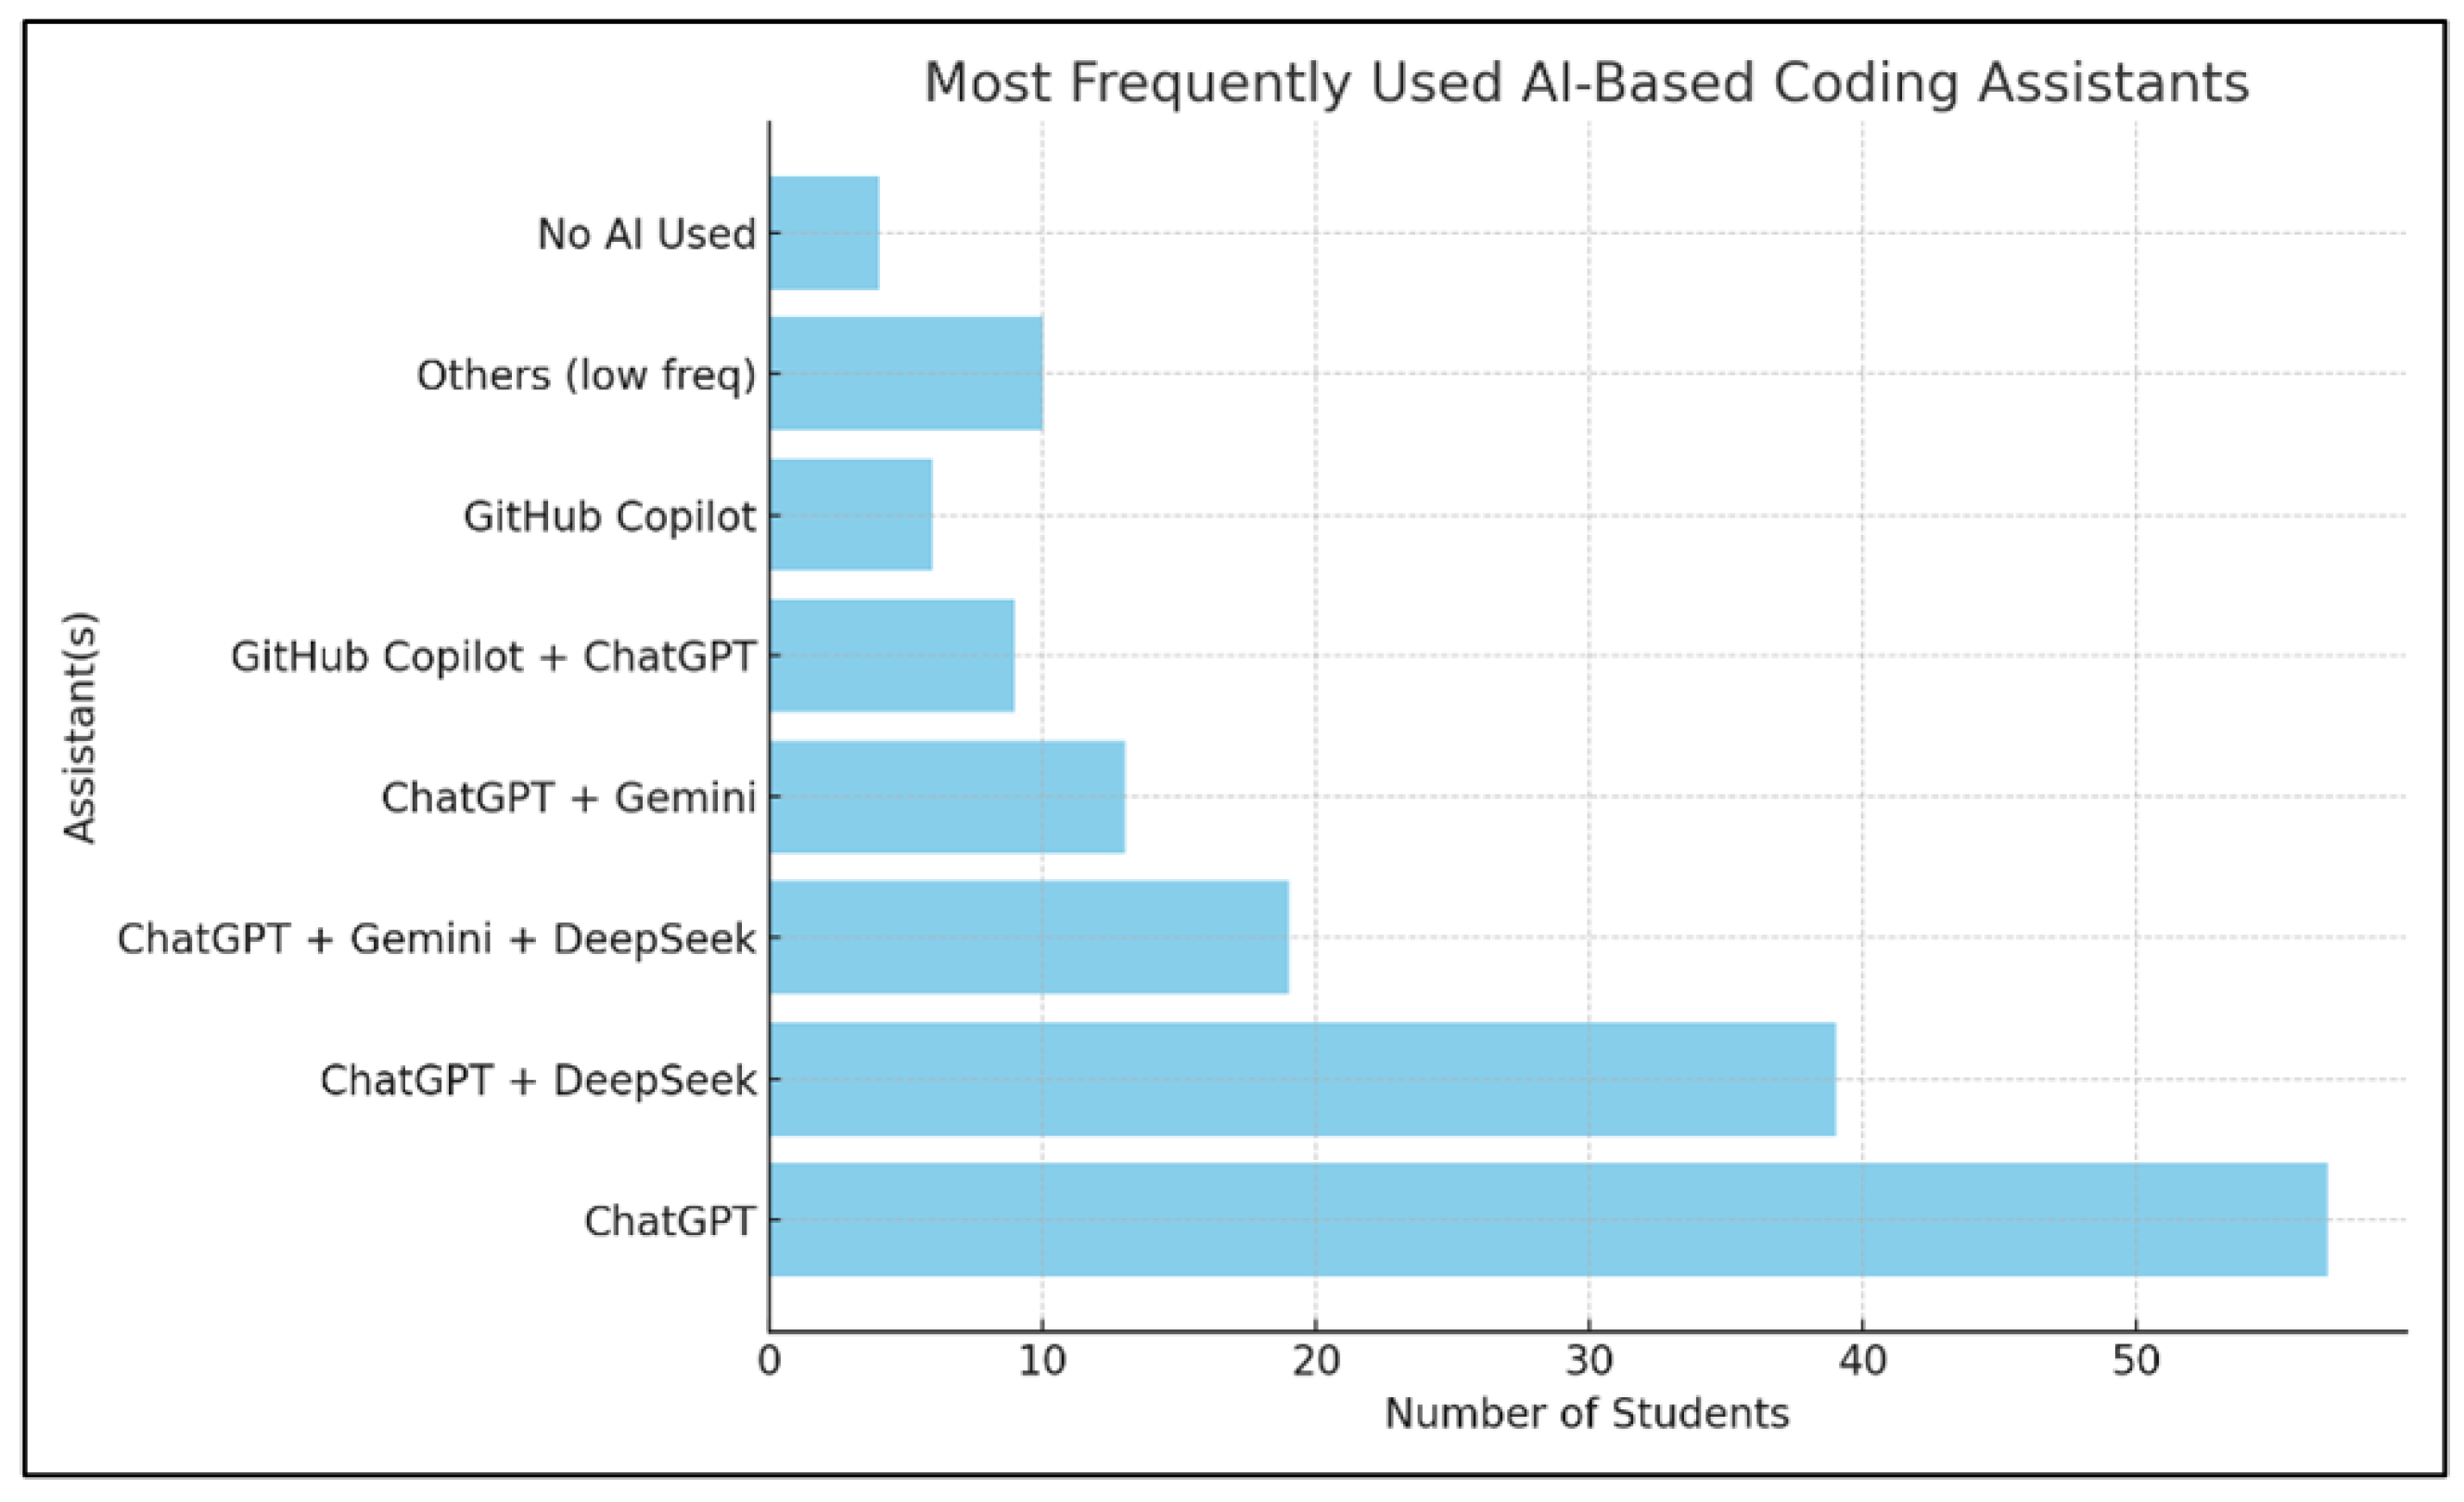
Most frequently used AI coding assistants.
Figure 11.
Most frequently used AI coding assistants.
Figure 12.
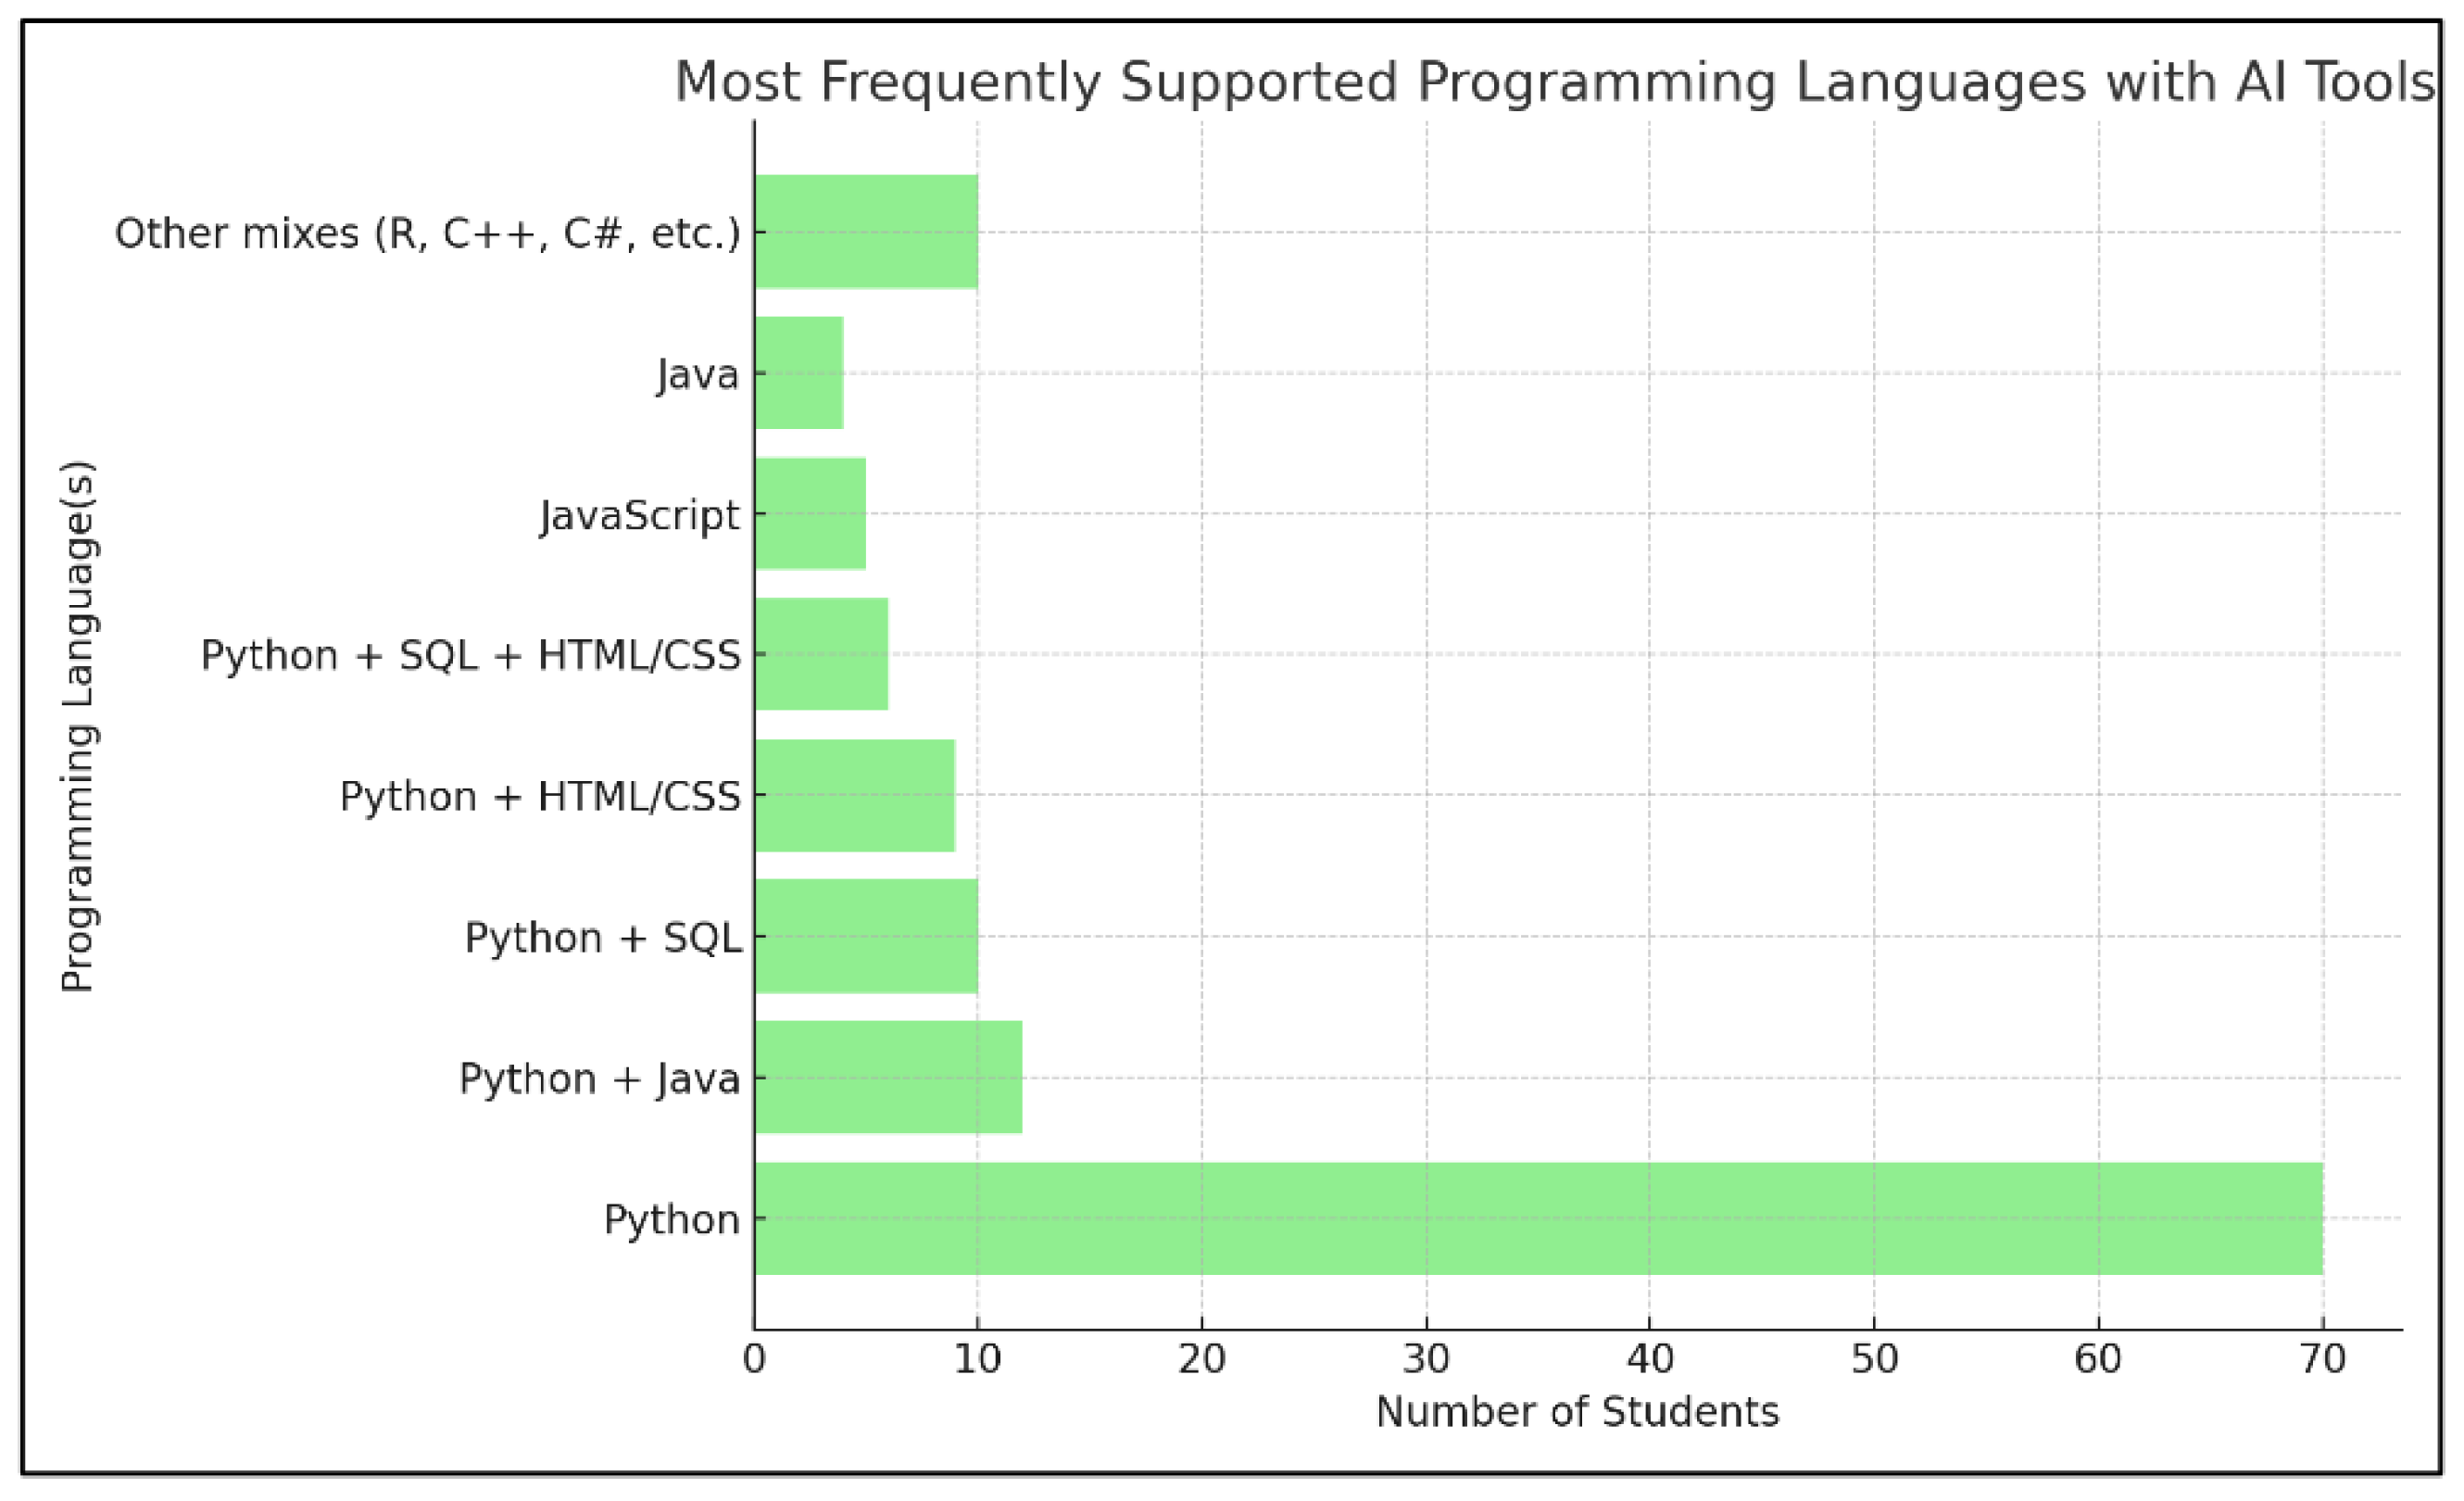
Most frequently used programming languages supported by AI tools, with Python emerging as the most common.
Figure 12.
Most frequently used programming languages supported by AI tools, with Python emerging as the most common.
Figure 13.
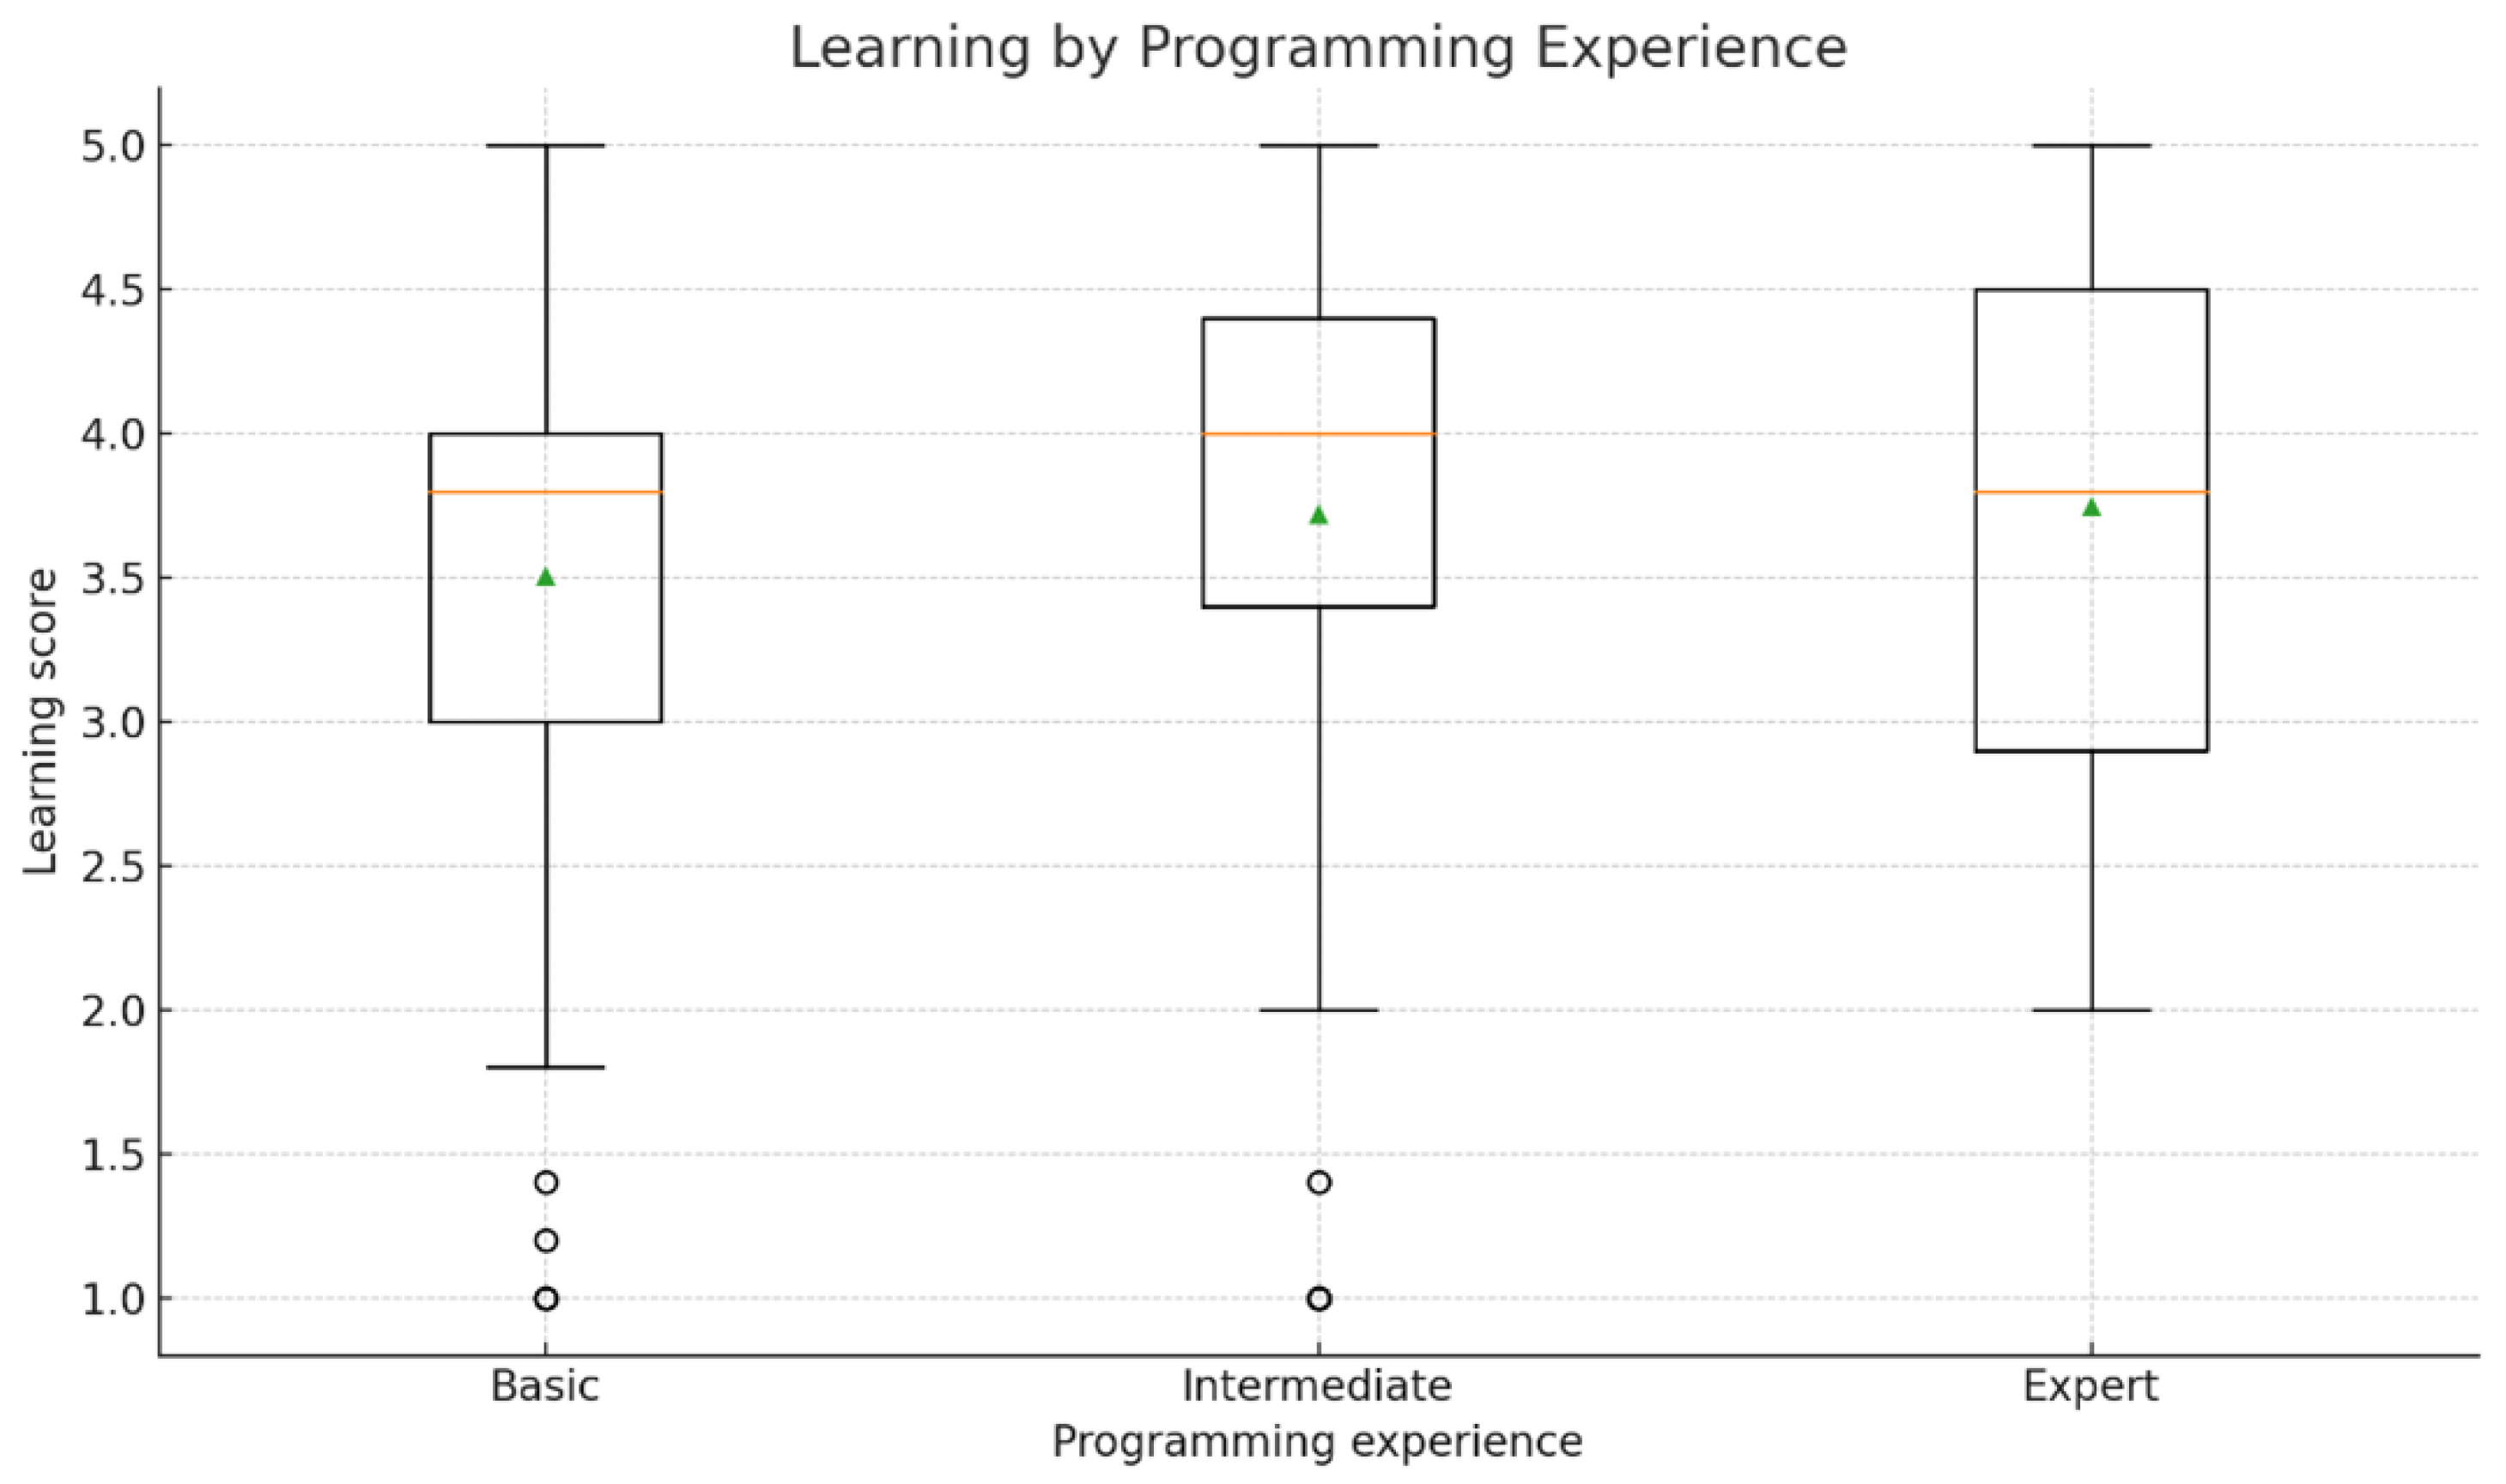
Boxplot of Learning scores by programming experience level, showing consistently high medians across all groups, with Experts and Intermediates slightly higher than Basics.
Figure 13.
Boxplot of Learning scores by programming experience level, showing consistently high medians across all groups, with Experts and Intermediates slightly higher than Basics.
Figure 14.
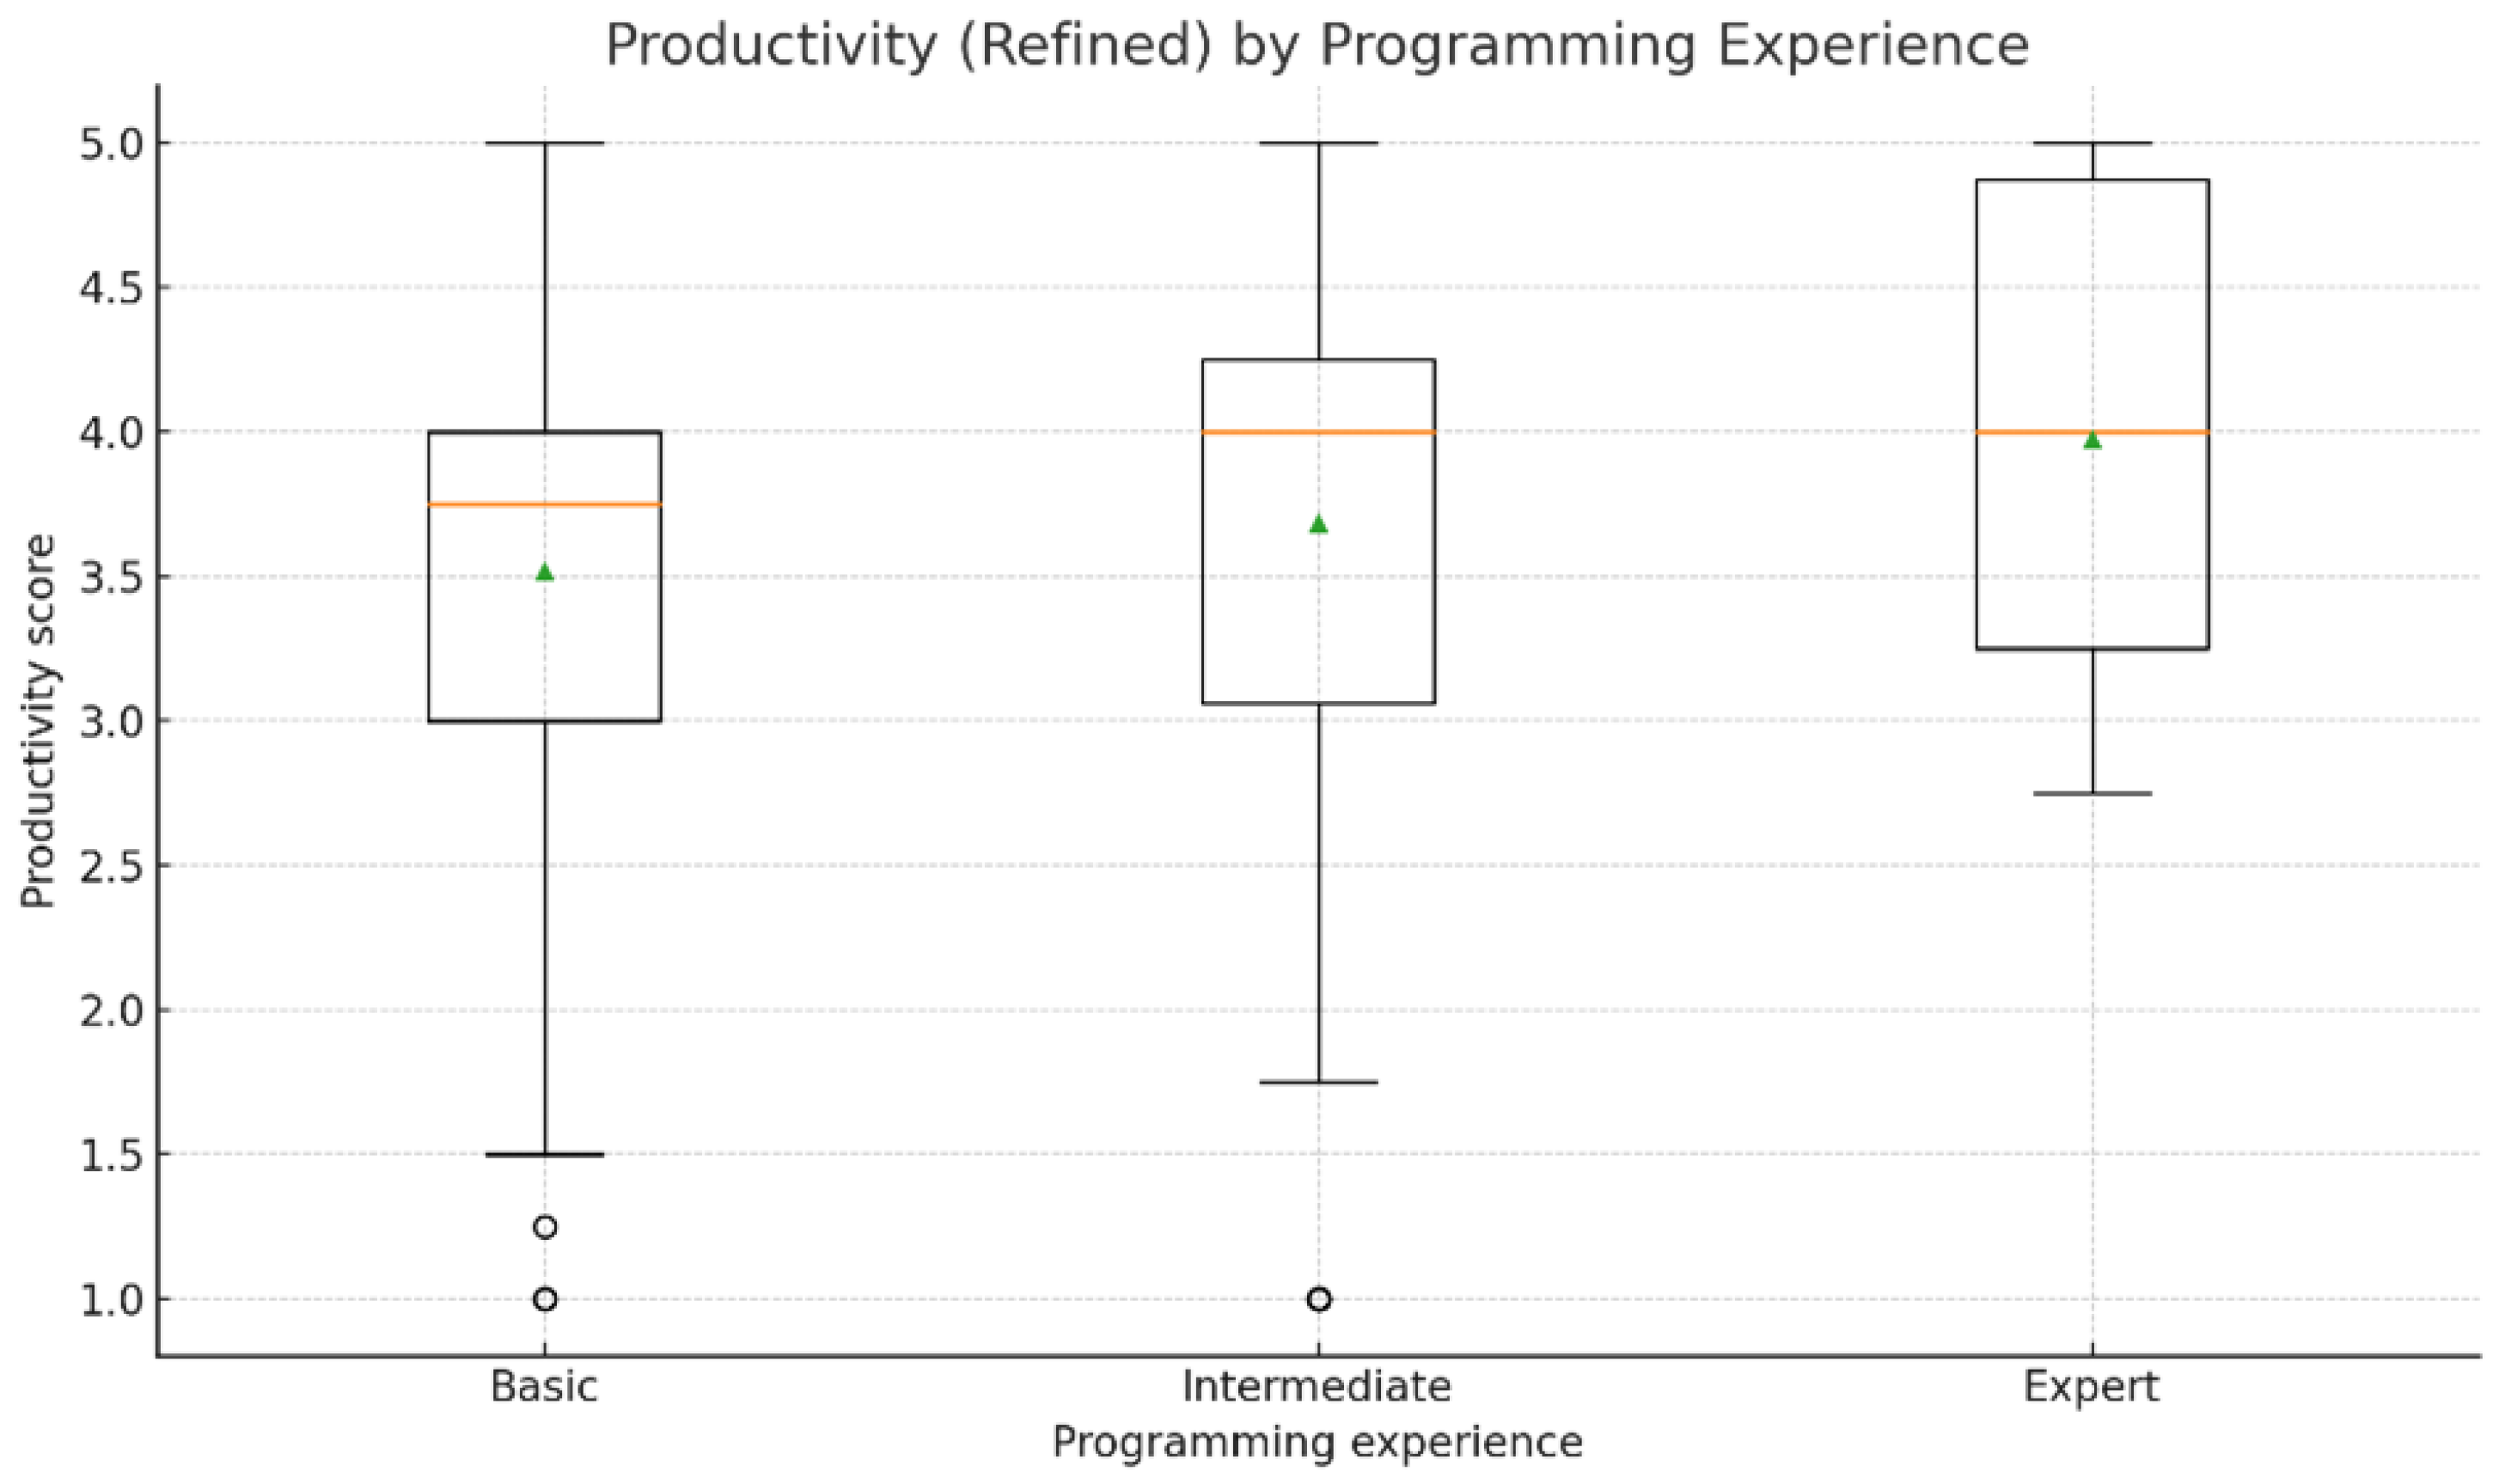
Boxplot of Productivity (refined) scores by programming experience, with Experts reporting the highest median gains and Basics showing the widest spread.
Figure 14.
Boxplot of Productivity (refined) scores by programming experience, with Experts reporting the highest median gains and Basics showing the widest spread.
Figure 15.
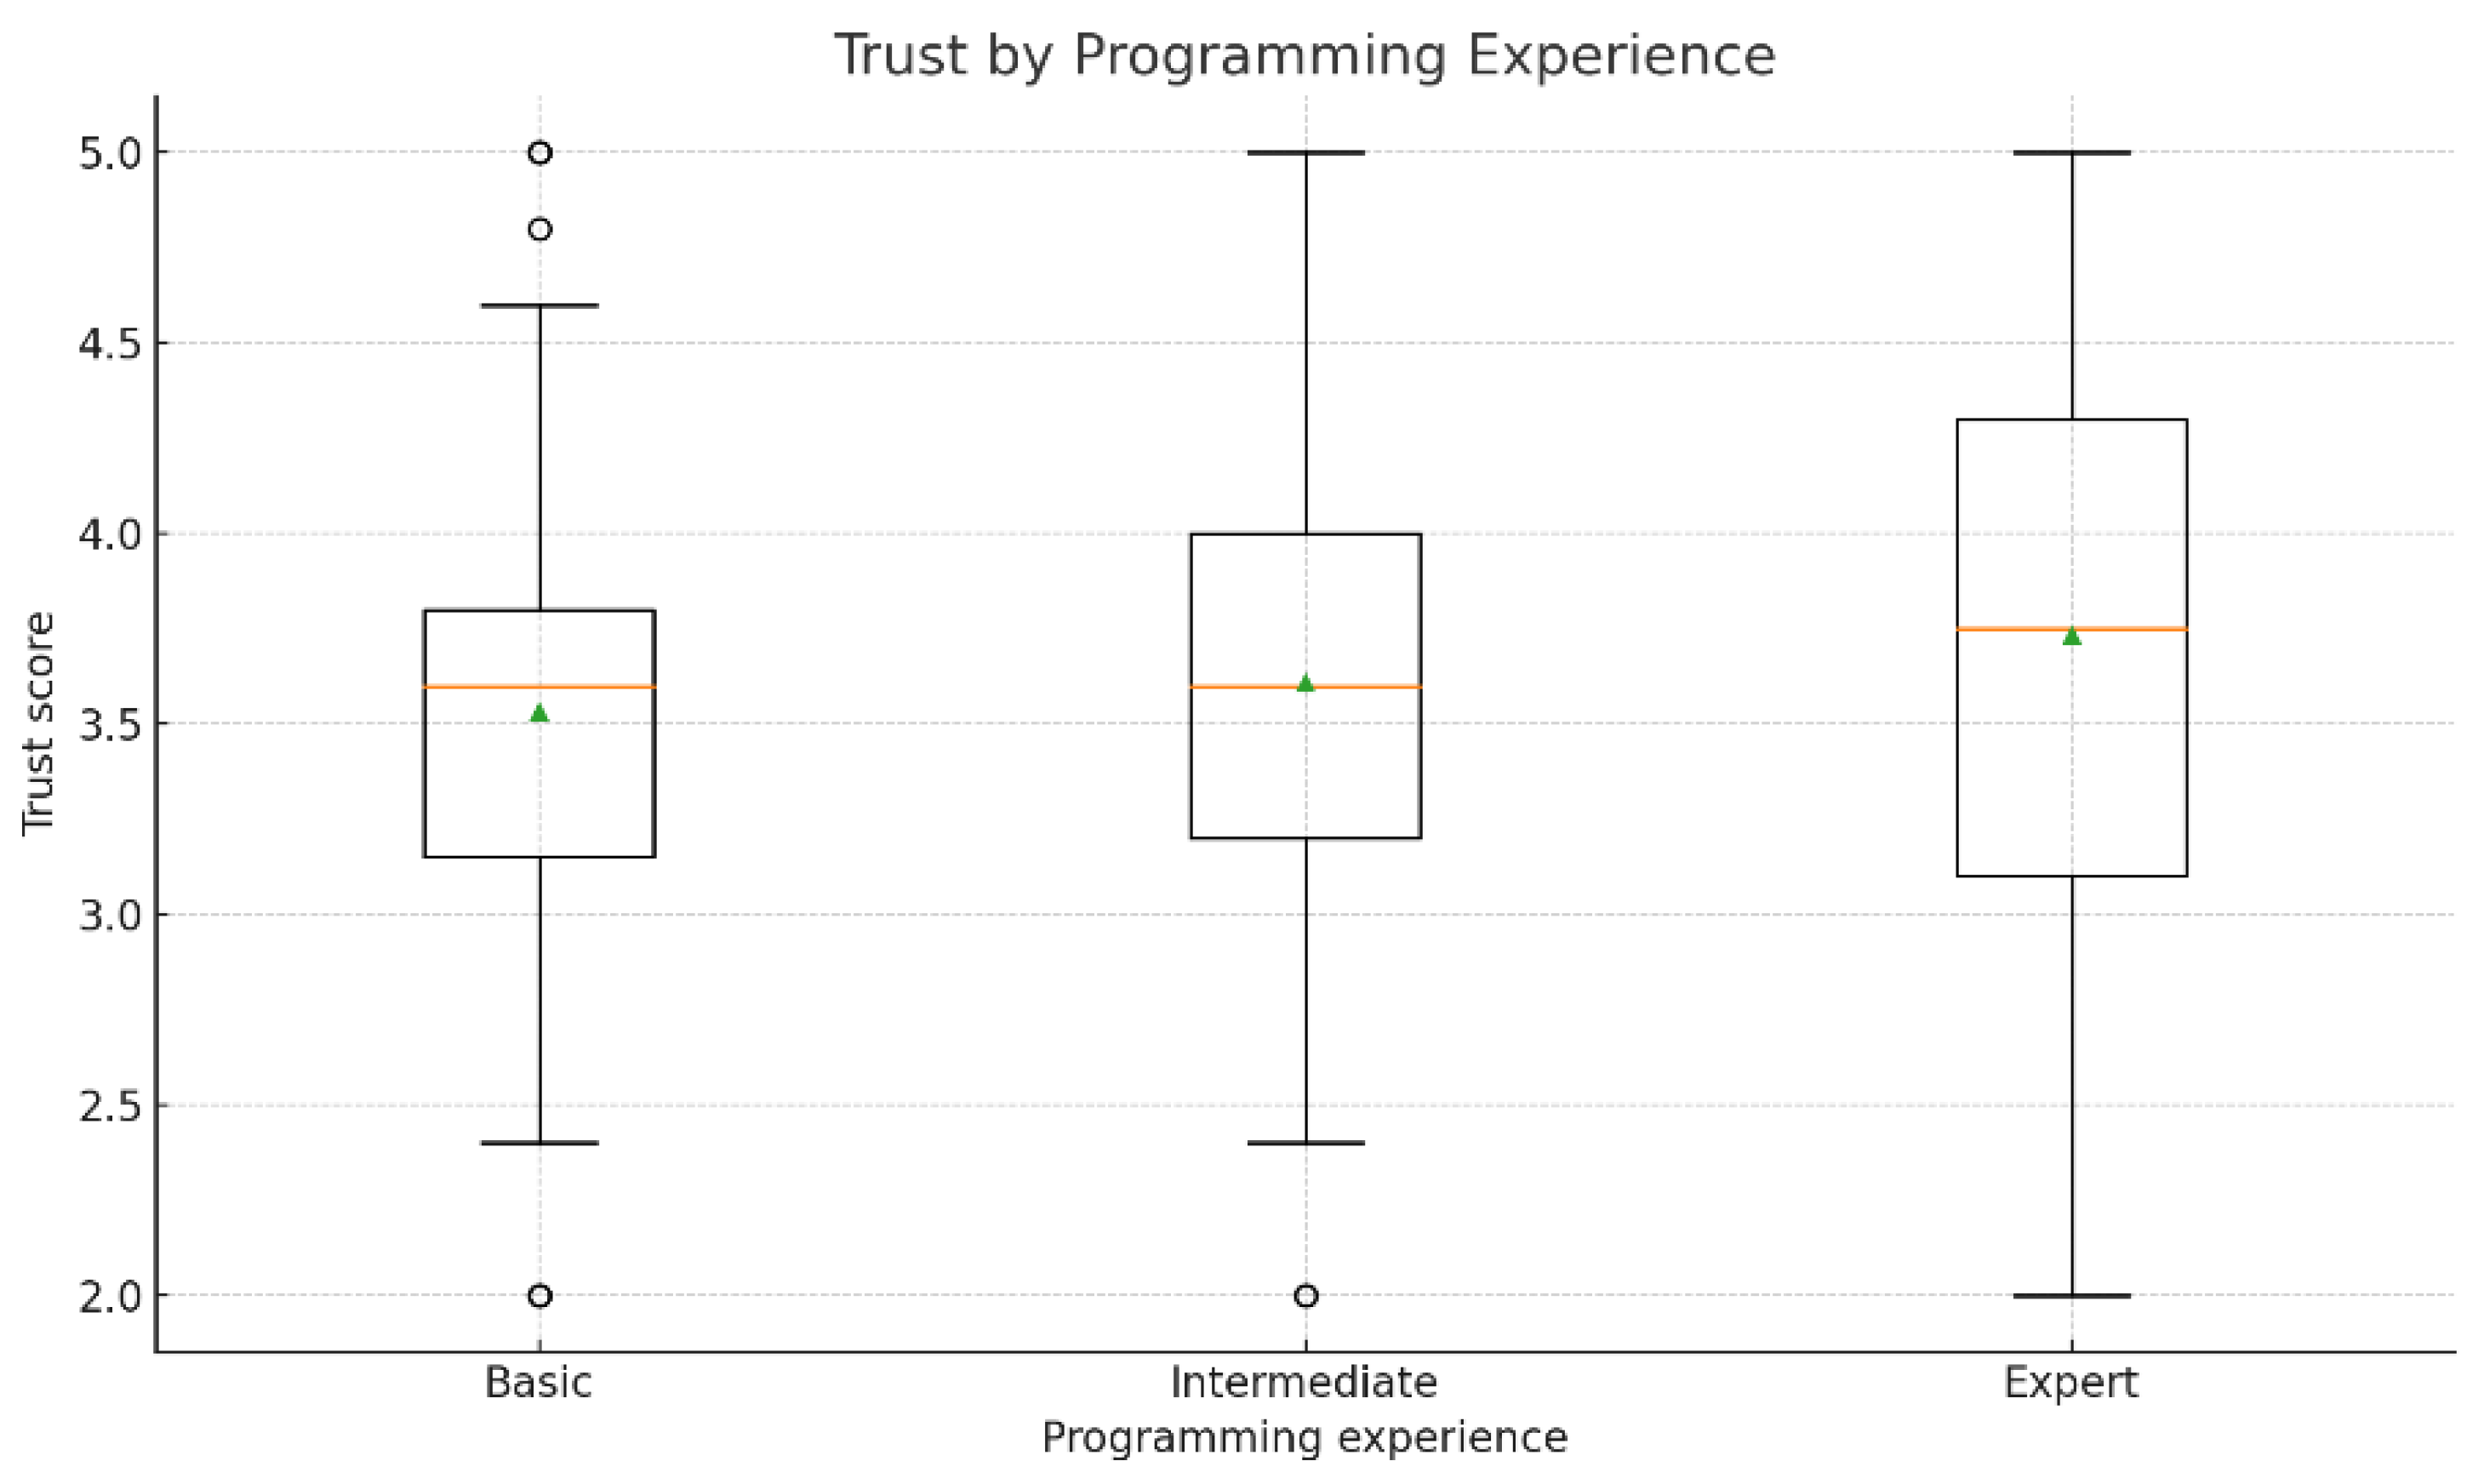
Boxplot of Trust scores by programming experience, highlighting the largest variation between groups, with Experts generally more trusting and Basics showing more dispersed trust levels.
Figure 15.
Boxplot of Trust scores by programming experience, highlighting the largest variation between groups, with Experts generally more trusting and Basics showing more dispersed trust levels.
Figure 16.
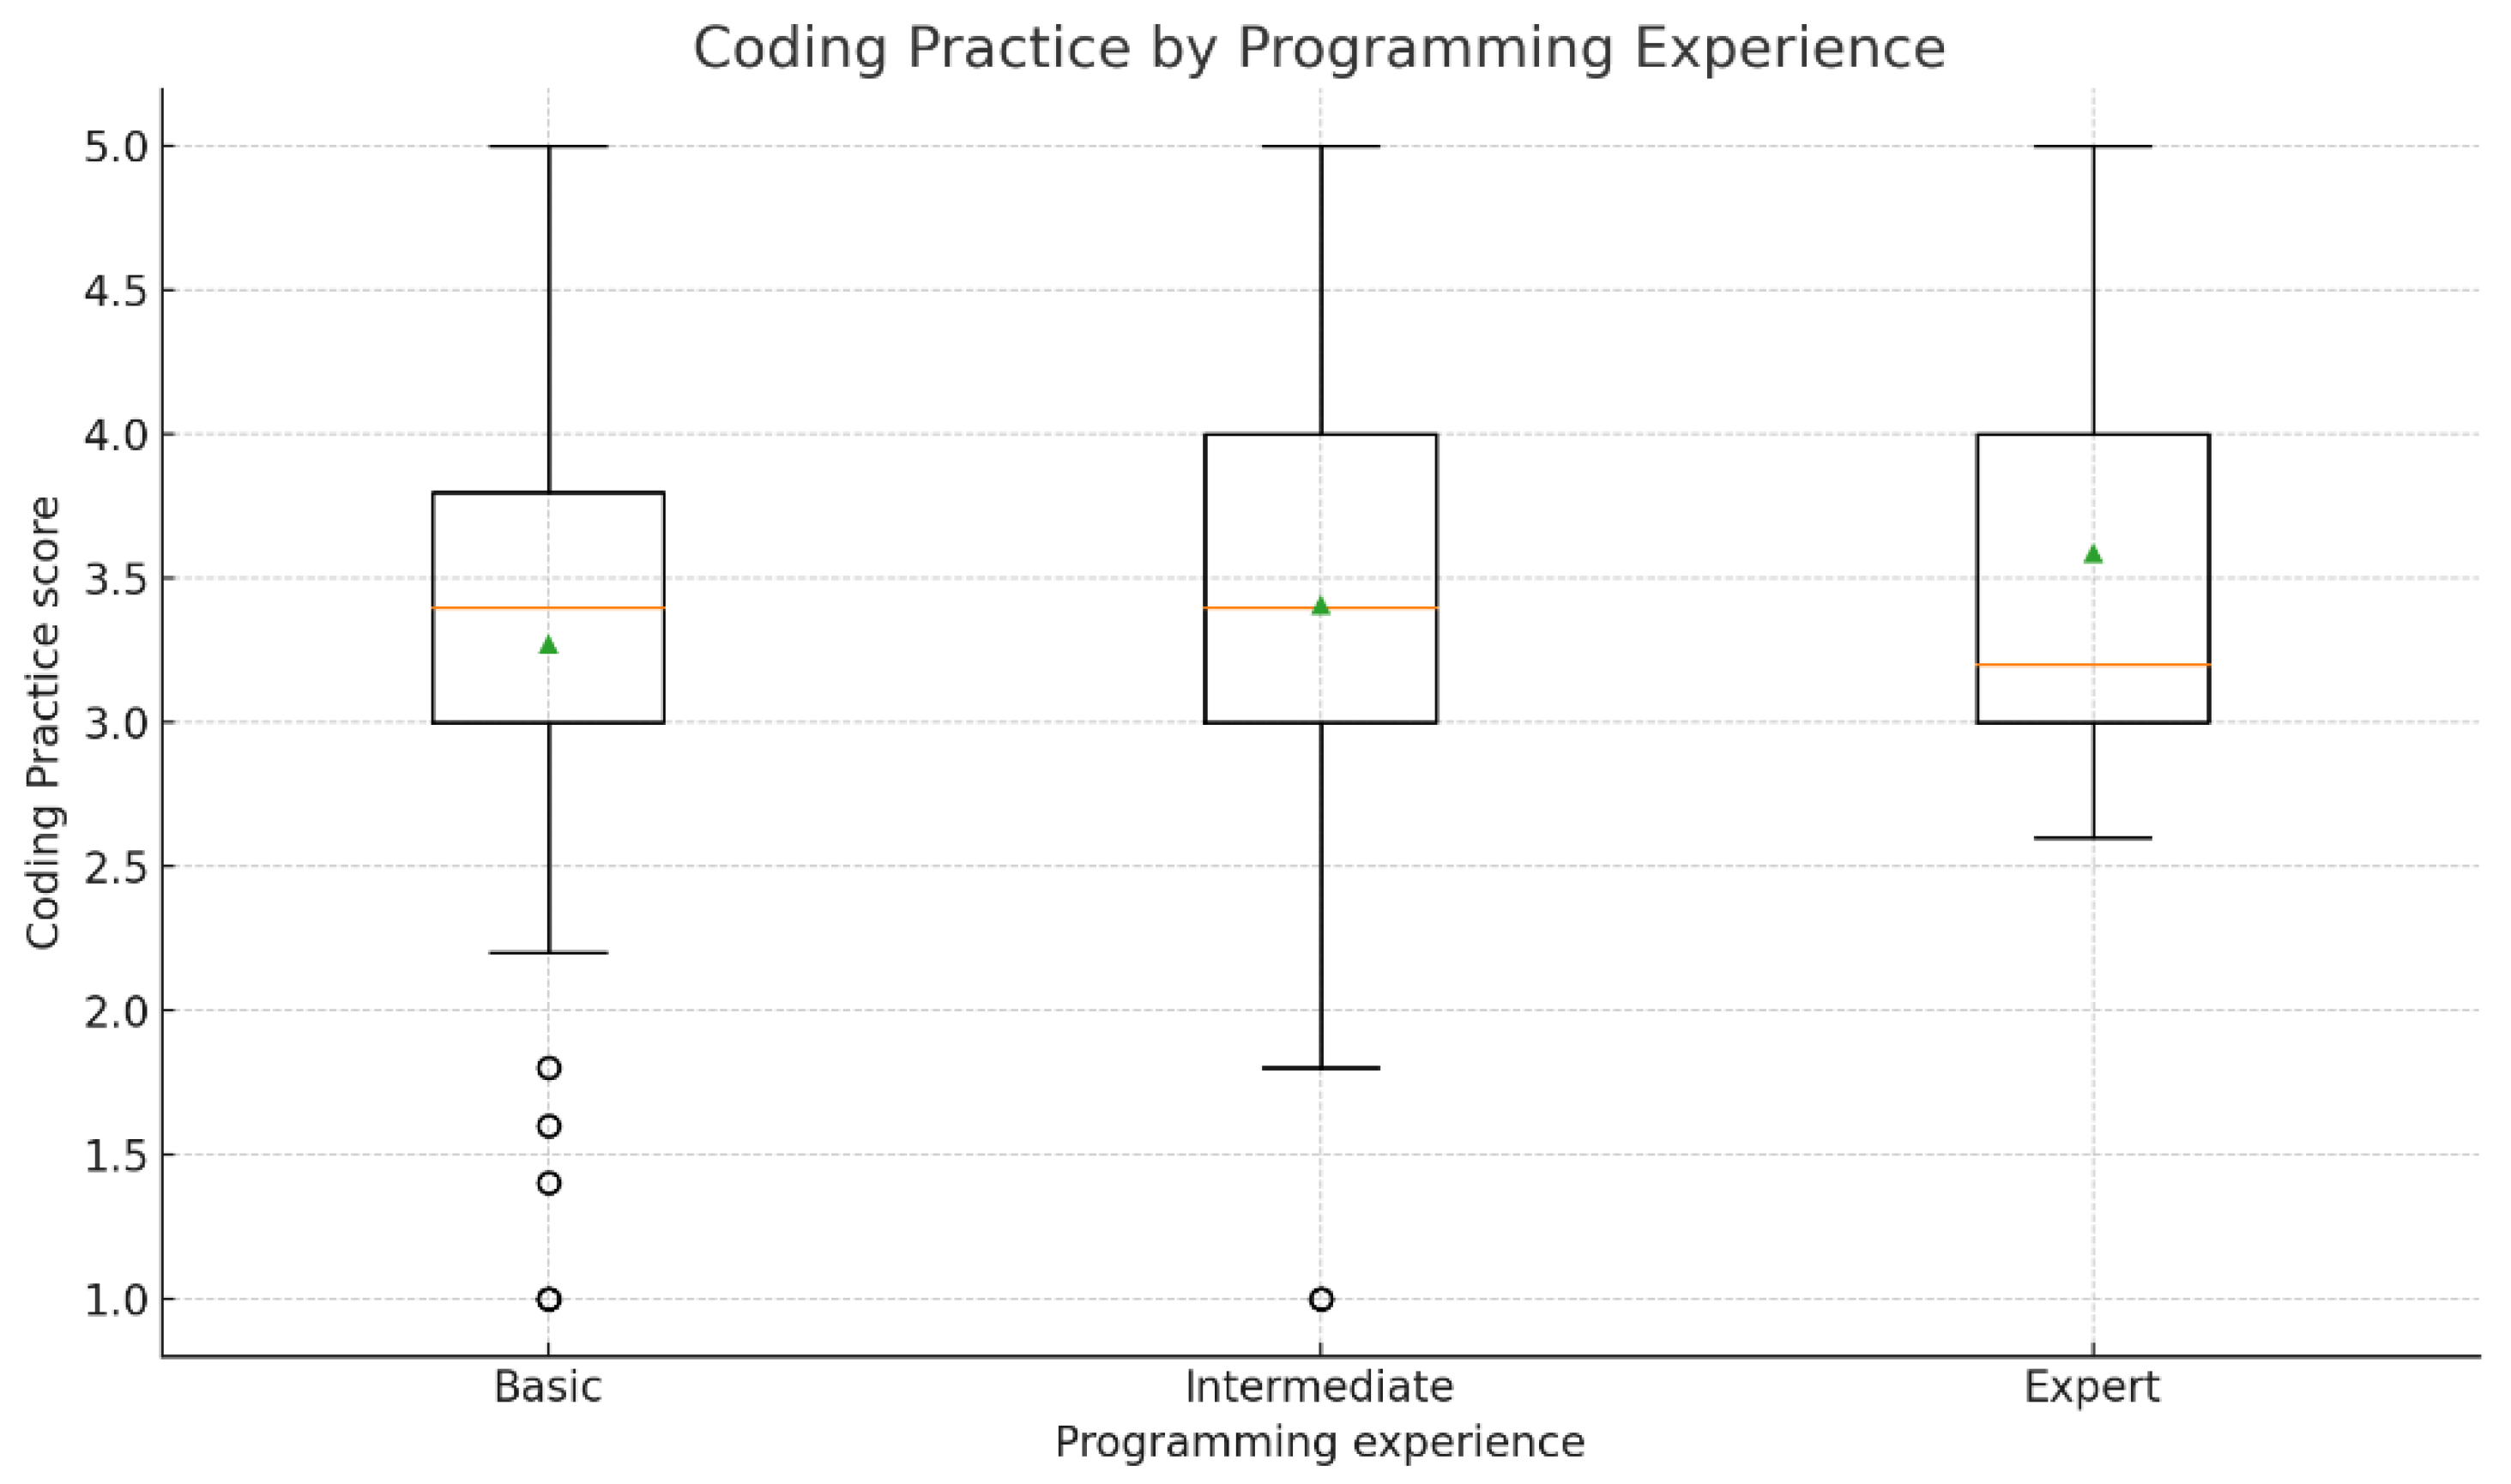
Boxplot of Coding Practice scores by programming experience, with Experts exhibiting tighter clustering and greater consensus on AI’s influence than Basics or Intermediates.
Figure 16.
Boxplot of Coding Practice scores by programming experience, with Experts exhibiting tighter clustering and greater consensus on AI’s influence than Basics or Intermediates.
Table 1.
Survey instrument items.
Table 1.
Survey instrument items.
| Construct | Code | Statement |
|---|
| Learning | L1 | The AI assistant helped me understand programming concepts more clearly. |
| L2 | I retain programming knowledge better when using an AI assistant. |
| L3 | Working with an AI assistant has improved my problem-solving approach. |
| L4 | The AI tool encourages me to explore new coding techniques or strategies. |
| L5 | I feel that my overall understanding of programming has improved with AI support. |
| Productivity | P1 | Using AI tools helped me complete programming tasks faster. |
| P2 | AI assistance reduces the time I spend debugging or fixing errors. |
| P3 | AI tools sometimes distract me or slow me down when coding (reverse-coded). |
| P4 | The AI assistant helps me stay on track and manage my coding workload better. |
| P5 | The use of AI tools allows me to focus more on high-level design and logic rather than syntax. |
| Trust | T1 | I trust the output generated by the AI assistant. |
| T2 | I believe the AI tool provides reliable solutions in most cases. |
| T3 | I find the AI-generated code difficult to trust without extensive verification (reverse-coded). |
| T4 | I double-check the AI-generated code before using it in my work (reverse-coded). |
| T5 | I believe the AI assistant improves over time as I use it more frequently. |
| Code of Practice | CP1 | I actively try to solve problems on my own before turning to the AI assistant. |
| CP2 | I am concerned that relying on AI tools may reduce my long-term coding skills. |
| CP3 | I have become more efficient, but I fear I might be missing out on deeper learning. |
| CP4 | I am worried about plagiarism or ethical issues when using AI-generated code. |
| CP5 | Using AI tools has changed the way I approach and write code. |
Table 2.
Tests of normality for construct scores (N = 214).
Table 2.
Tests of normality for construct scores (N = 214).
| Construct | Kolmogorov–Smirnov a | Shapiro–Wilk |
|---|
| Statistic | df | Sig. | Statistic | df | Sig. |
|---|
| Learning | 0.125 | 214 | <0.001 | 0.945 | 214 | <0.001 |
| Productivity | 0.120 | 214 | <0.001 | 0.950 | 214 | <0.001 |
| Trust | 0.105 | 214 | <0.001 | 0.956 | 214 | <0.001 |
| Code of Practice | 0.112 | 214 | <0.001 | 0.970 | 214 | <0.001 |
Table 3.
Kaiser–Meyer–Olkin (KMO) measure and Bartlett’s test of sphericity.
Table 3.
Kaiser–Meyer–Olkin (KMO) measure and Bartlett’s test of sphericity.
| Measure | Value |
|---|
| KMO measure of sampling adequacy | 0.879 |
| Bartlett’s test of sphericity: Approx. | 1918.857 |
| Bartlett’s test of sphericity: df | 190 |
| Bartlett’s test of sphericity: p-value | <0.001 |
Table 4.
Rotated component matrix from PCA (Varimax rotation).
Table 4.
Rotated component matrix from PCA (Varimax rotation).
| Item/Construct | C1 | C2 | C3 | C4 | C5 |
|---|
| Learning1 | 0.718 | 0.093 | 0.323 | 0.181 | 0.021 |
| Learning2 | 0.823 | 0.114 | 0.159 | −0.028 | −0.089 |
| Learning3 | 0.608 | 0.265 | 0.125 | −0.112 | −0.163 |
| Learning4 | 0.728 | −0.016 | 0.133 | 0.179 | −0.090 |
| Learning5 | 0.815 | 0.105 | 0.006 | 0.155 | −0.025 |
| Productivity1 | 0.717 | 0.206 | 0.170 | 0.218 | 0.376 |
| Productivity2 | 0.642 | 0.125 | 0.170 | 0.281 | 0.324 |
| Productivity3 | 0.133 | 0.146 | 0.133 | 0.409 | −0.743 |
| Productivity4 | 0.637 | 0.382 | 0.157 | 0.110 | 0.119 |
| Productivity5 | 0.607 | 0.371 | 0.075 | 0.271 | 0.000 |
| Trust1 | 0.151 | 0.870 | 0.002 | 0.129 | −0.156 |
| Trust2 | 0.215 | 0.839 | 0.175 | 0.055 | 0.022 |
| Trust3 | 0.068 | 0.060 | 0.792 | 0.051 | −0.254 |
| Trust4 | 0.328 | 0.088 | 0.742 | 0.129 | 0.020 |
| Trust5 | 0.459 | 0.421 | 0.160 | 0.210 | 0.330 |
| CodingPractices1 | 0.243 | 0.021 | 0.492 | 0.386 | 0.178 |
| CodingPractices2 | 0.056 | 0.159 | 0.572 | 0.440 | 0.201 |
| CodingPractices3 | 0.191 | 0.185 | 0.112 | 0.754 | −0.049 |
| CodingPractices4 | −0.042 | 0.034 | 0.197 | 0.696 | −0.208 |
| CodingPractices5 | 0.388 | 0.385 | 0.088 | 0.333 | 0.231 |
Table 5.
Pattern matrix from exploratory factor analysis (principal axis factoring, Promax rotation).
Table 5.
Pattern matrix from exploratory factor analysis (principal axis factoring, Promax rotation).
| Item/Construct | Factor 1 | Factor 2 | Factor 3 | Factor 4 | Factor 5 |
|---|
| Learning1 | 0.682 | | | | |
| Learning2 | 0.858 | | | | |
| Learning3 | 0.538 | | | | |
| Learning4 | 0.614 | | | | |
| Learning5 | 0.766 | | | | |
| Productivity1 | 0.379 | | | 0.699 | |
| Productivity2 | 0.329 | | | 0.589 | |
| Productivity3 | | | | | 0.660 |
| Productivity4 | 0.447 | | | | |
| Productivity5 | 0.453 | | | | |
| Trust1 | | 0.856 | | | |
| Trust2 | | 0.791 | | | |
| Trust3 | | | 0.633 | | |
| Trust4 | | | 0.665 | | |
| Trust5 | | | | 0.484 | |
| Code of Practice1 | | | 0.357 | | |
| Code of Practice2 | | | 0.432 | | |
| Code of Practice3 | | | | 0.369 | 0.534 |
| Code of Practice4 | | | | 0.475 | |
| Code of Practice5 | | | | 0.347 | |
Table 6.
Alignment of research questions, variables, and analysis choices.
Table 6.
Alignment of research questions, variables, and analysis choices.
| RQ | Focus | Methodological Justification and Analysis |
|---|
| RQ1 | Correlations among Learning, Productivity, Trust, Code of Practice | Spearman’s : monotonic associations; appropriate for non-normal Likert composites. |
| RQ2 | Usage patterns by experience/level | Descriptives and distribution plots; aligns with descriptive aim. |
| RQ3 | Most used tools/languages | Frequencies; aligns with descriptive aim. |
| RQ4 | Basic vs. Intermediate vs. Expert (Learning) | Kruskal–Wallis: Three independent groups; robust to non-normality. |
| RQ5 | Academic levels (Code of Practice) | Kruskal–Wallis: independent groups; ordinal/continuous composites. |
| RQ6 | Predictors of Productivity | Multiple regression with diagnostics and bootstrap CIs; tests unique effects and overall explanatory power. |
Table 7.
Programming experience distribution (N = 248).
Table 7.
Programming experience distribution (N = 248).
| Level | Frequency | Percent | Cumulative % |
|---|
| Basic | 111 | 44.8 | 44.8 |
| Expert | 19 | 7.7 | 52.4 |
| Intermediate | 118 | 47.6 | 100.0 |
| Total | 248 | 100.0 | 100.0 |
Table 8.
Distribution of AI coding tool usage frequencies (N = 248).
Table 8.
Distribution of AI coding tool usage frequencies (N = 248).
| Usage Frequency | Frequency | Percent | Cumulative Percent |
|---|
| Always | 59 | 23.8 | 23.8 |
| Frequently | 61 | 24.6 | 48.4 |
| Never | 18 | 7.3 | 55.6 |
| Occasionally | 72 | 29.0 | 84.7 |
| Rarely | 38 | 15.3 | 100.0 |
| Total | 248 | 100.0 | 100.0 |
Table 9.
Distribution of participants by academic level (N = 248).
Table 9.
Distribution of participants by academic level (N = 248).
| Academic Level | Frequency | Percent | Cumulative Percent |
|---|
| Year 1 (Freshman) | 25 | 10.1 | 10.1 |
| Year 2 (Sophomore) | 69 | 27.8 | 37.9 |
| Year 3 (Junior) | 87 | 35.1 | 73.0 |
| Year 4 (Senior) | 56 | 22.6 | 95.6 |
| Graduate (Master’s/PhD) | 6 | 2.4 | 98.0 |
| Other | 4 | 1.6 | 100.0 |
| Total | 248 | 100.0 | 100.0 |
Table 10.
Comparison of Code of Practice scores across academic levels using Kruskal–Wallis test.
Table 10.
Comparison of Code of Practice scores across academic levels using Kruskal–Wallis test.
| Academic Level | N | Mean Rank |
|---|
| Year 1 | 25 | 123.52 |
| Year 2 | 69 | 124.83 |
| Year 3 | 87 | 118.63 |
| Year 4 | 56 | 110.37 |
| Total | 237 | – |
Table 11.
Regression model summary predicting Productivity from Learning, Trust, and Code of Practice.
Table 11.
Regression model summary predicting Productivity from Learning, Trust, and Code of Practice.
| Model | R | | Adjusted | Std. Error of the Estimate |
|---|
| 1 | 0.793 | 0.628 | 0.623 | 0.485 |
Table 12.
ANOVA for the regression model predicting Productivity.
Table 12.
ANOVA for the regression model predicting Productivity.
| Source | Sum of Squares | df | Mean Square | F | Sig. |
|---|
| Regression | 83.473 | 3 | 27.824 | 118.305 | <0.001 |
| Residual | 49.390 | 210 | 0.235 | – | – |
| Total | 132.864 | 213 | – | – | – |
Table 13.
Regression coefficients and effect sizes for predictors of Productivity.
Table 13.
Regression coefficients and effect sizes for predictors of Productivity.
| Predictor | B | Std. Error | Beta | t | Sig. | Tolerance | VIF |
|---|
| (Constant) | 0.040 | 0.036 | – | 1.099 | 0.273 | – | – |
| Learning (Z) | 0.568 | 0.052 | 0.543 | 10.866 | <0.001 | 0.709 | 1.411 |
| Trust (Z) | 0.189 | 0.045 | 0.240 | 4.246 | <0.001 | 0.556 | 1.799 |
| Code of Practice (Z) | 0.165 | 0.052 | 0.163 | 3.171 | 0.002 | 0.669 | 1.495 |
Table 14.
Hypotheses and results.
Table 14.
Hypotheses and results.
| H | Statement | Result (, p-Value, ) | Supported? |
|---|
| Higher Learning scores will be significantly associated with higher Productivity. | , | Supported |
| Greater Trust in AI tools will be significantly associated with higher Productivity. | , | Supported |
| Better Code of Practice will be significantly associated with higher Productivity. | , | Supported |
| The combined model of Learning, Trust, and Code of Practice will significantly explain variance in Productivity. | , , | Supported |