
Individualized Prediction of Breast Cancer Survival Using Flexible Parametric Survival Modeling: Analysis of a Hospital-Based National Clinical Cancer Registry

 , ,
, ,
Abstract
Simple Summary
Abstract
1. Introduction
2. Materials and Methods
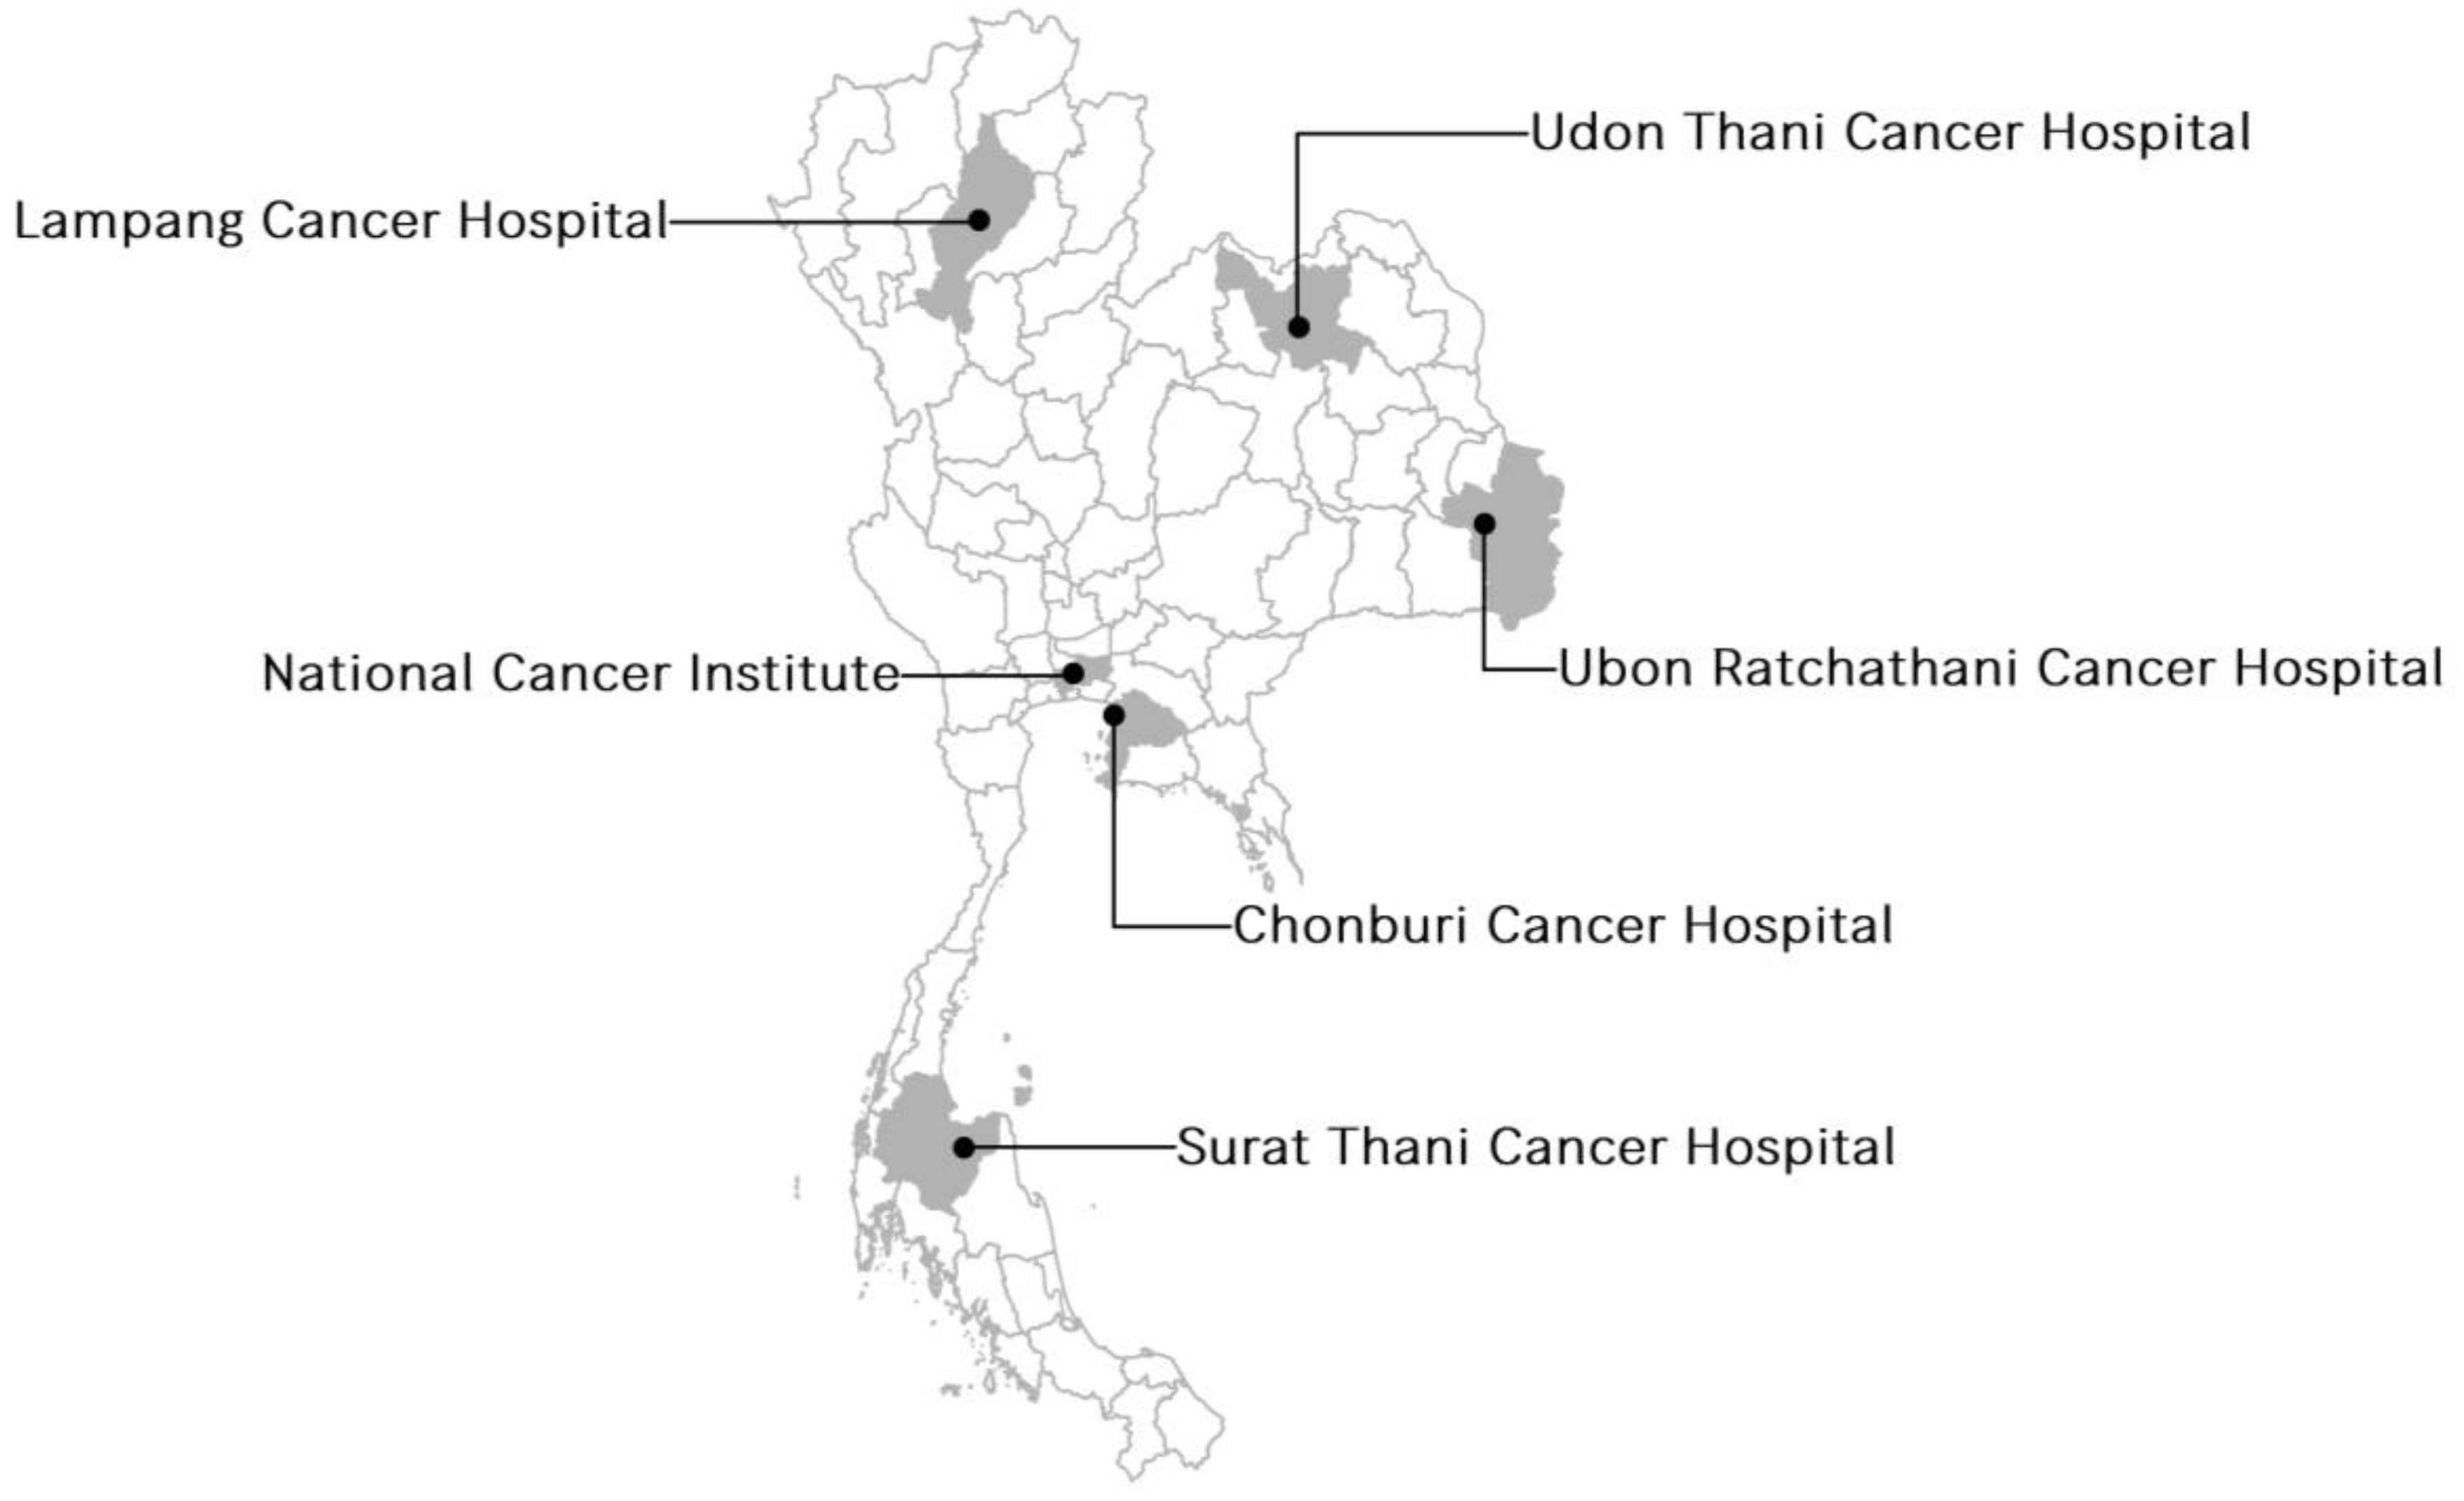
2.1. Patients and Data
2.2. Predictors
2.3. Derivation of the Survival Models
2.3.1. Missing Data
2.3.2. Model Performance
2.3.3. Model Presentation
3. Results
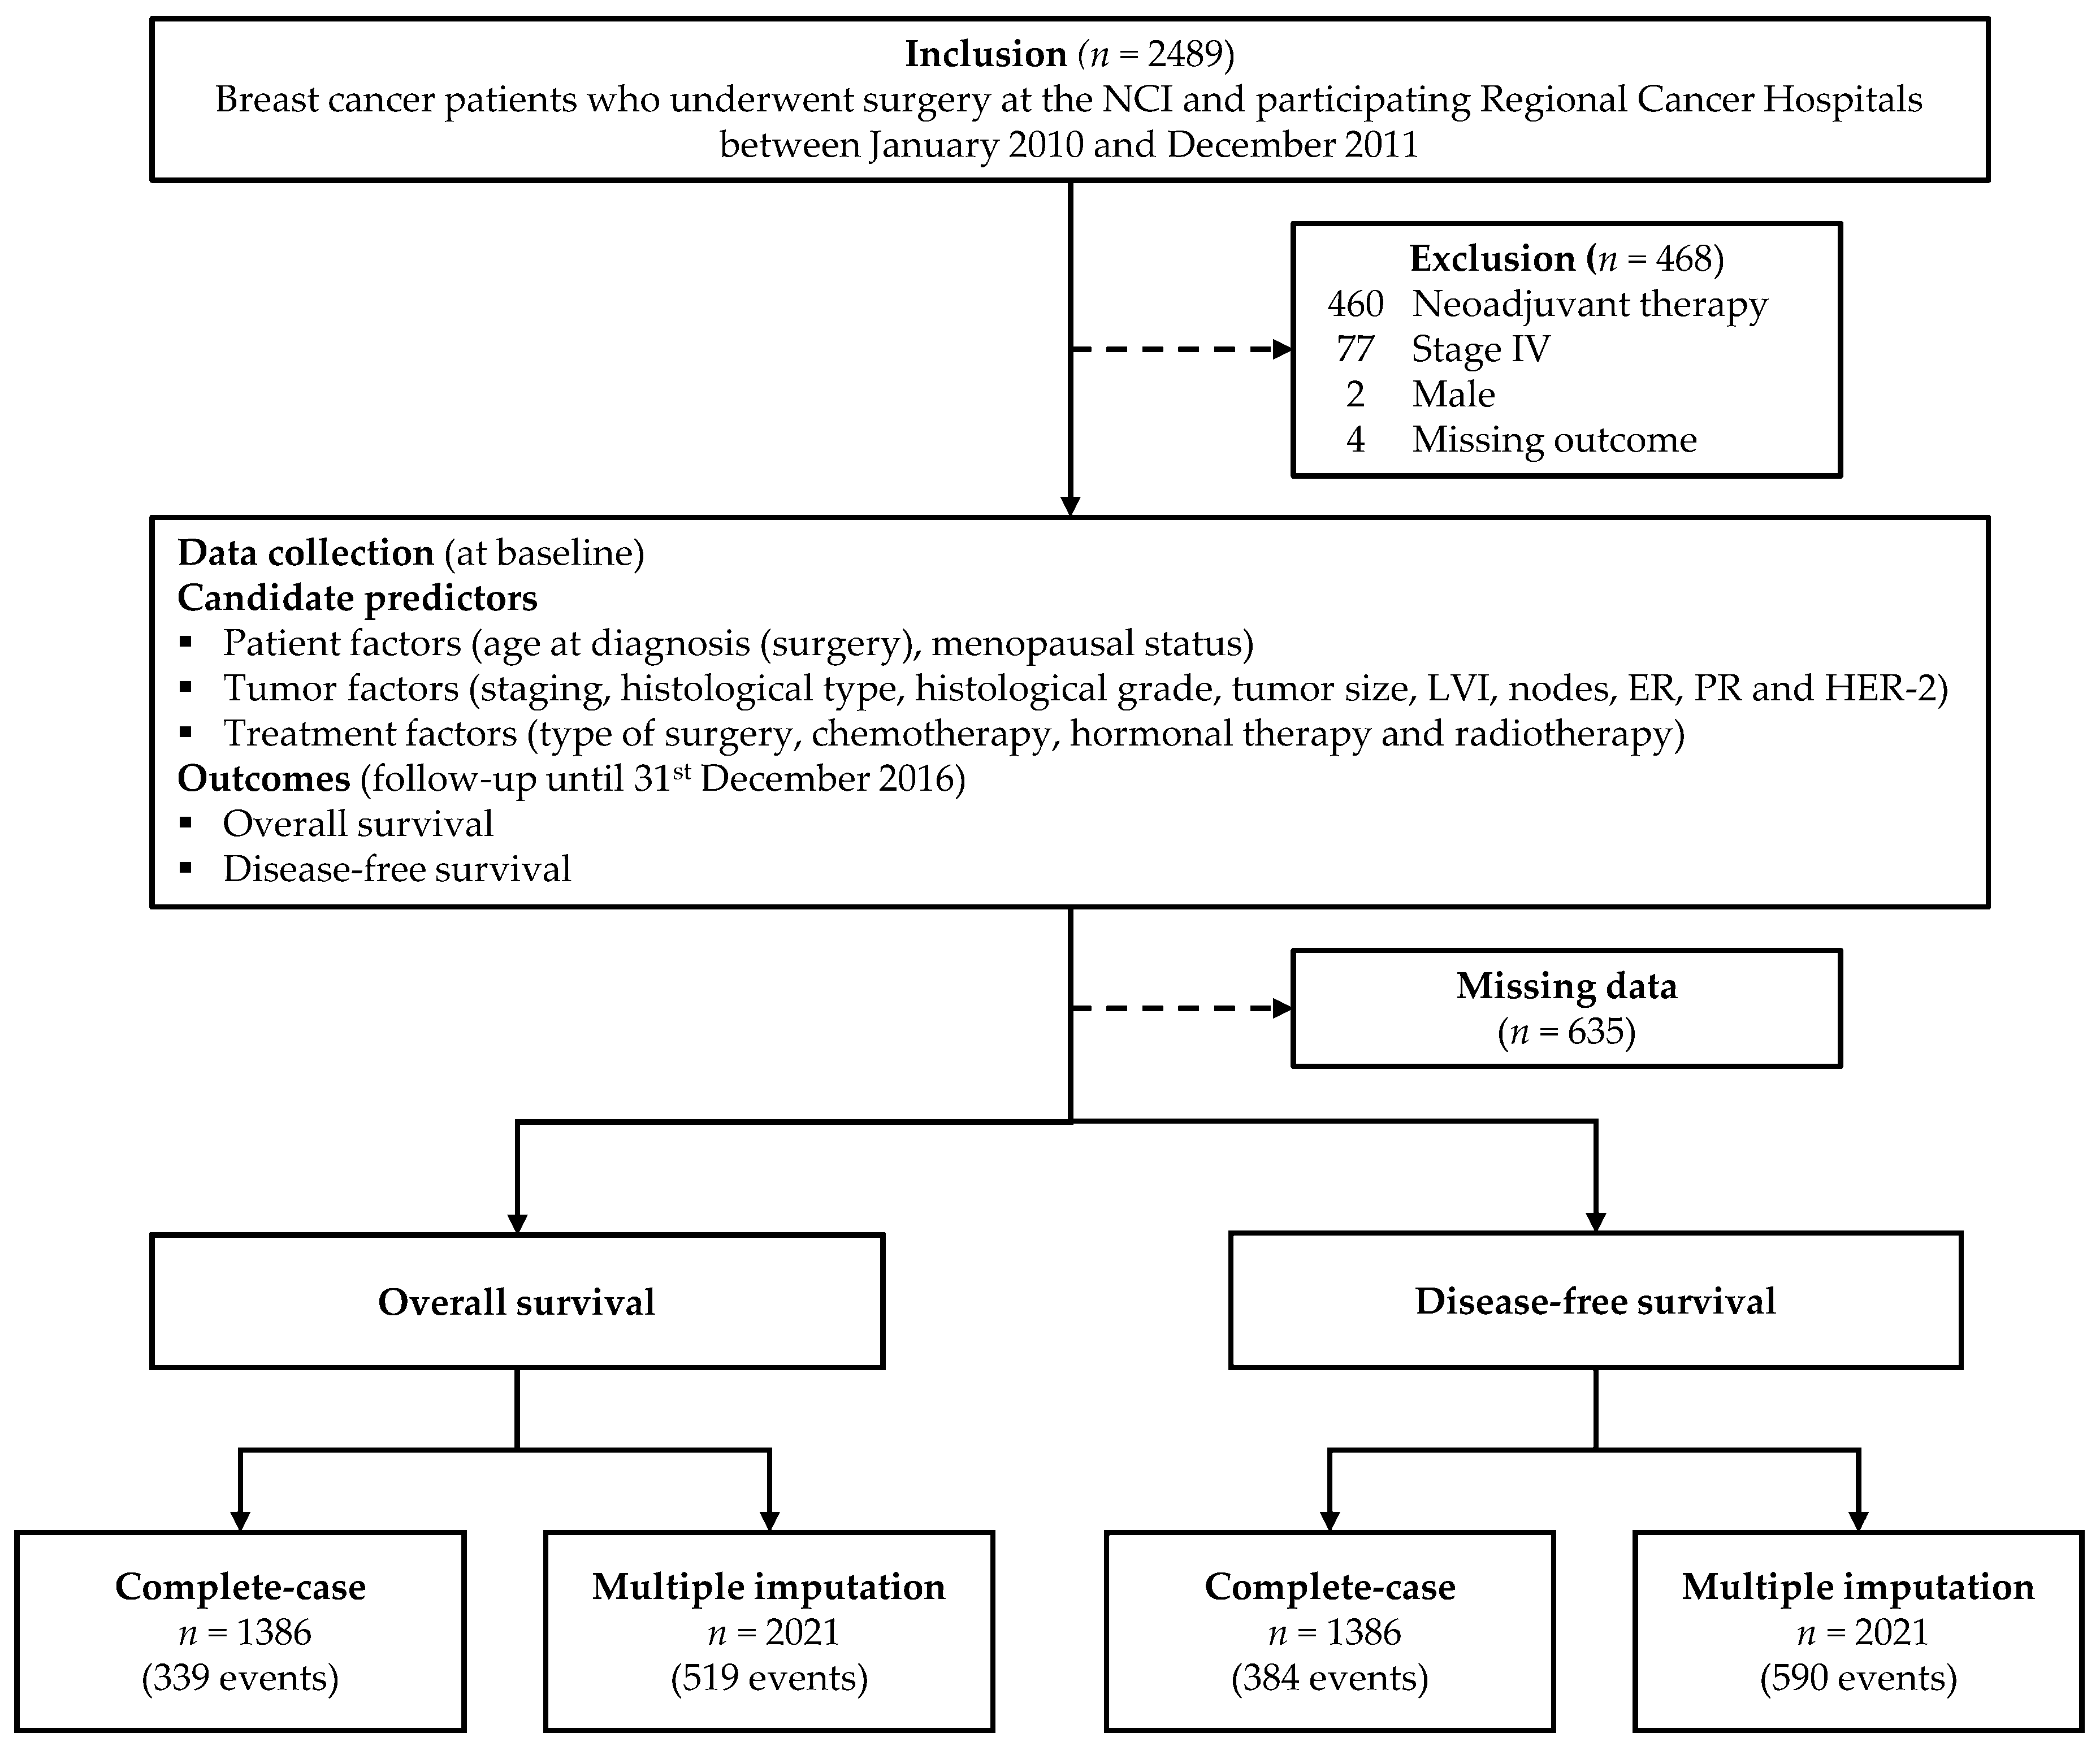
3.1. Study Patients
3.2. Flexible Parametric Survival Models
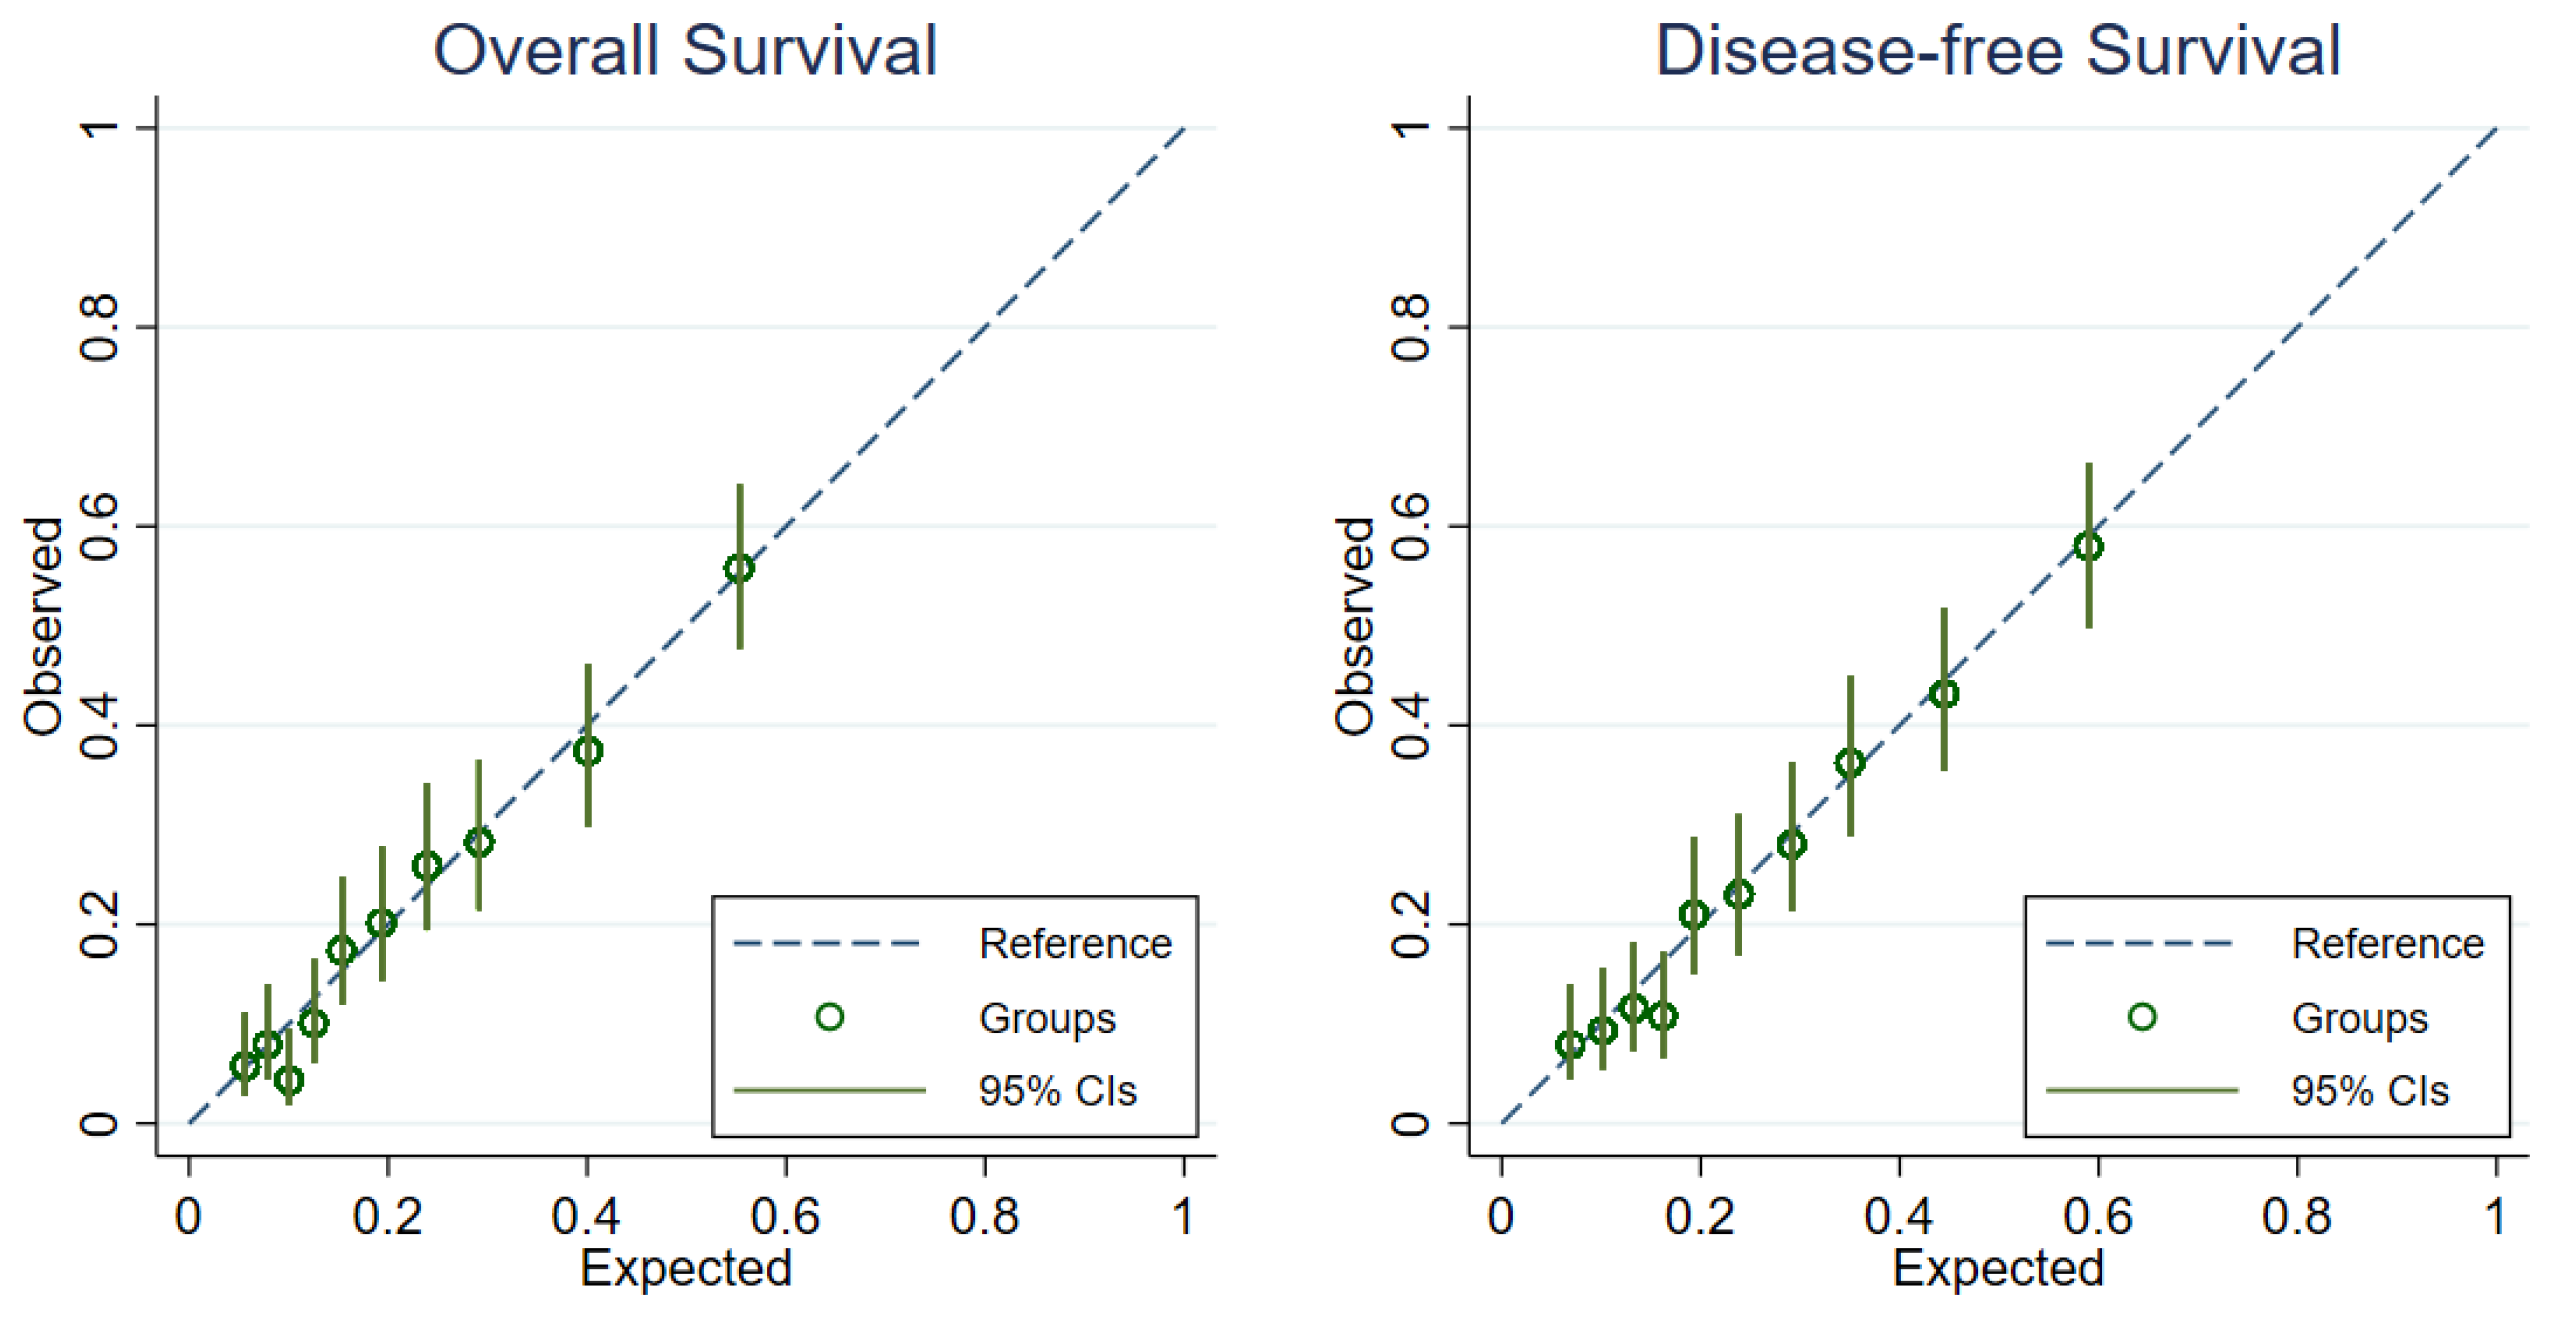
3.2.1. Model Performance
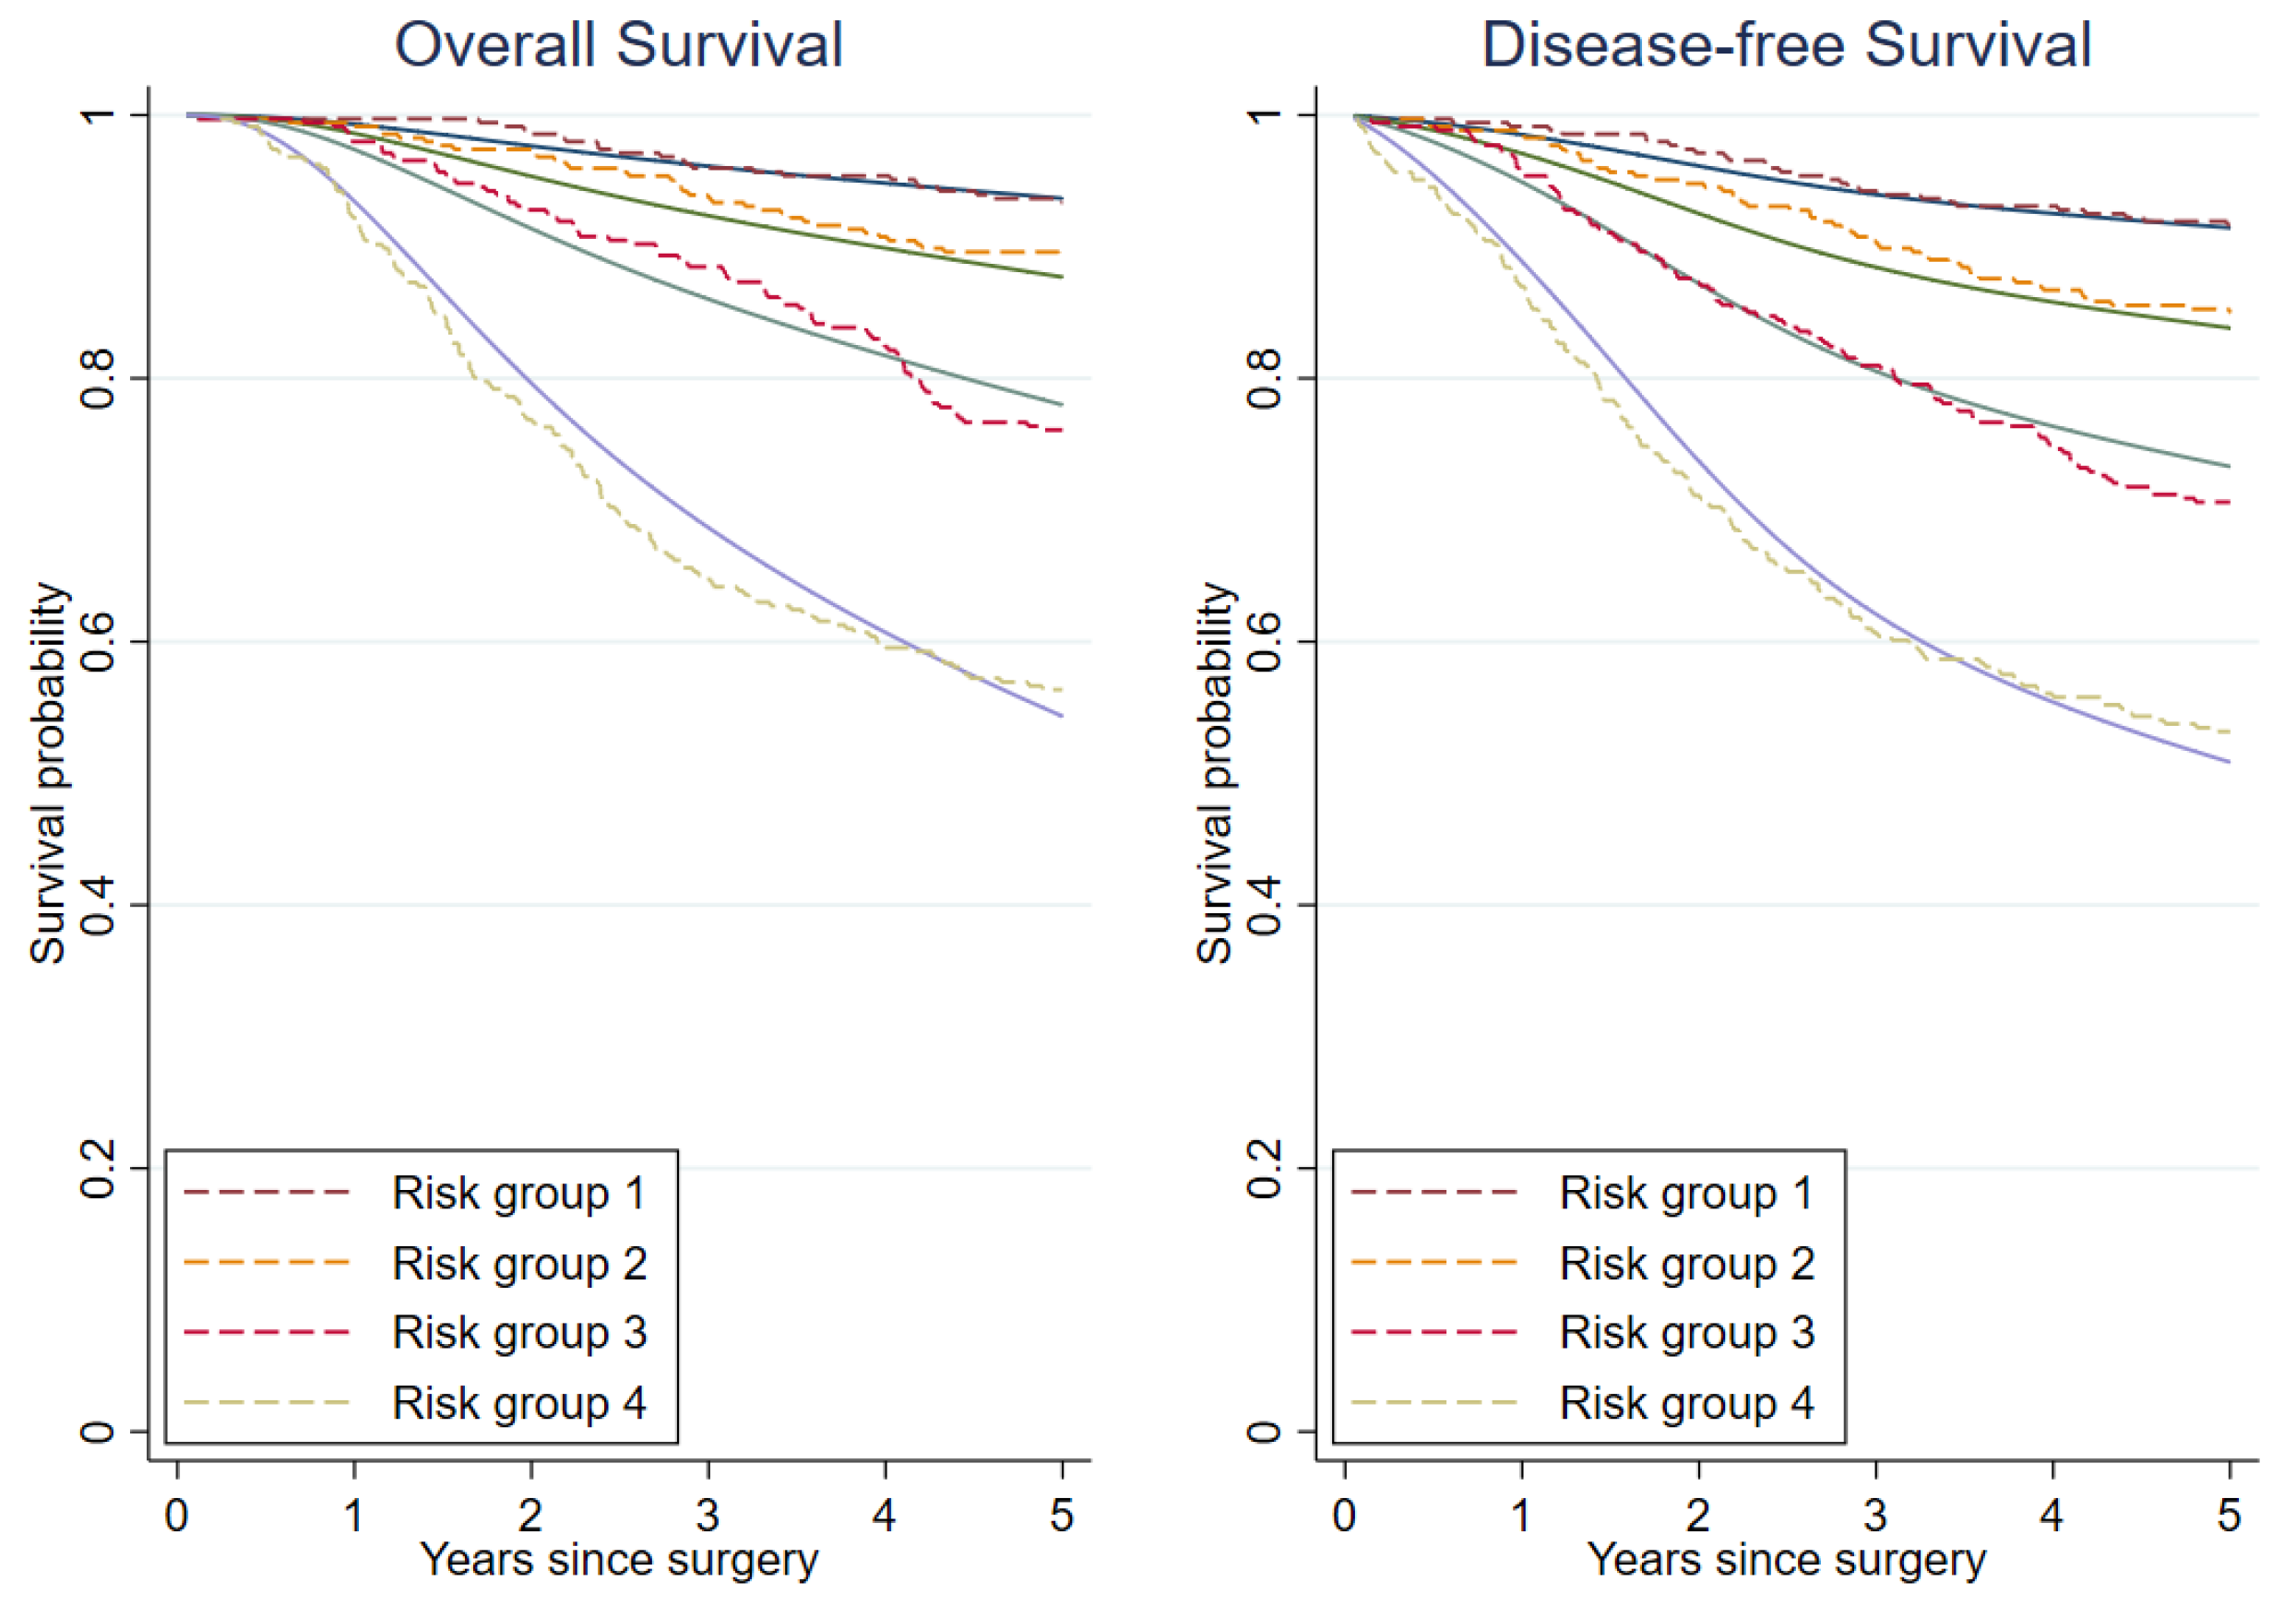
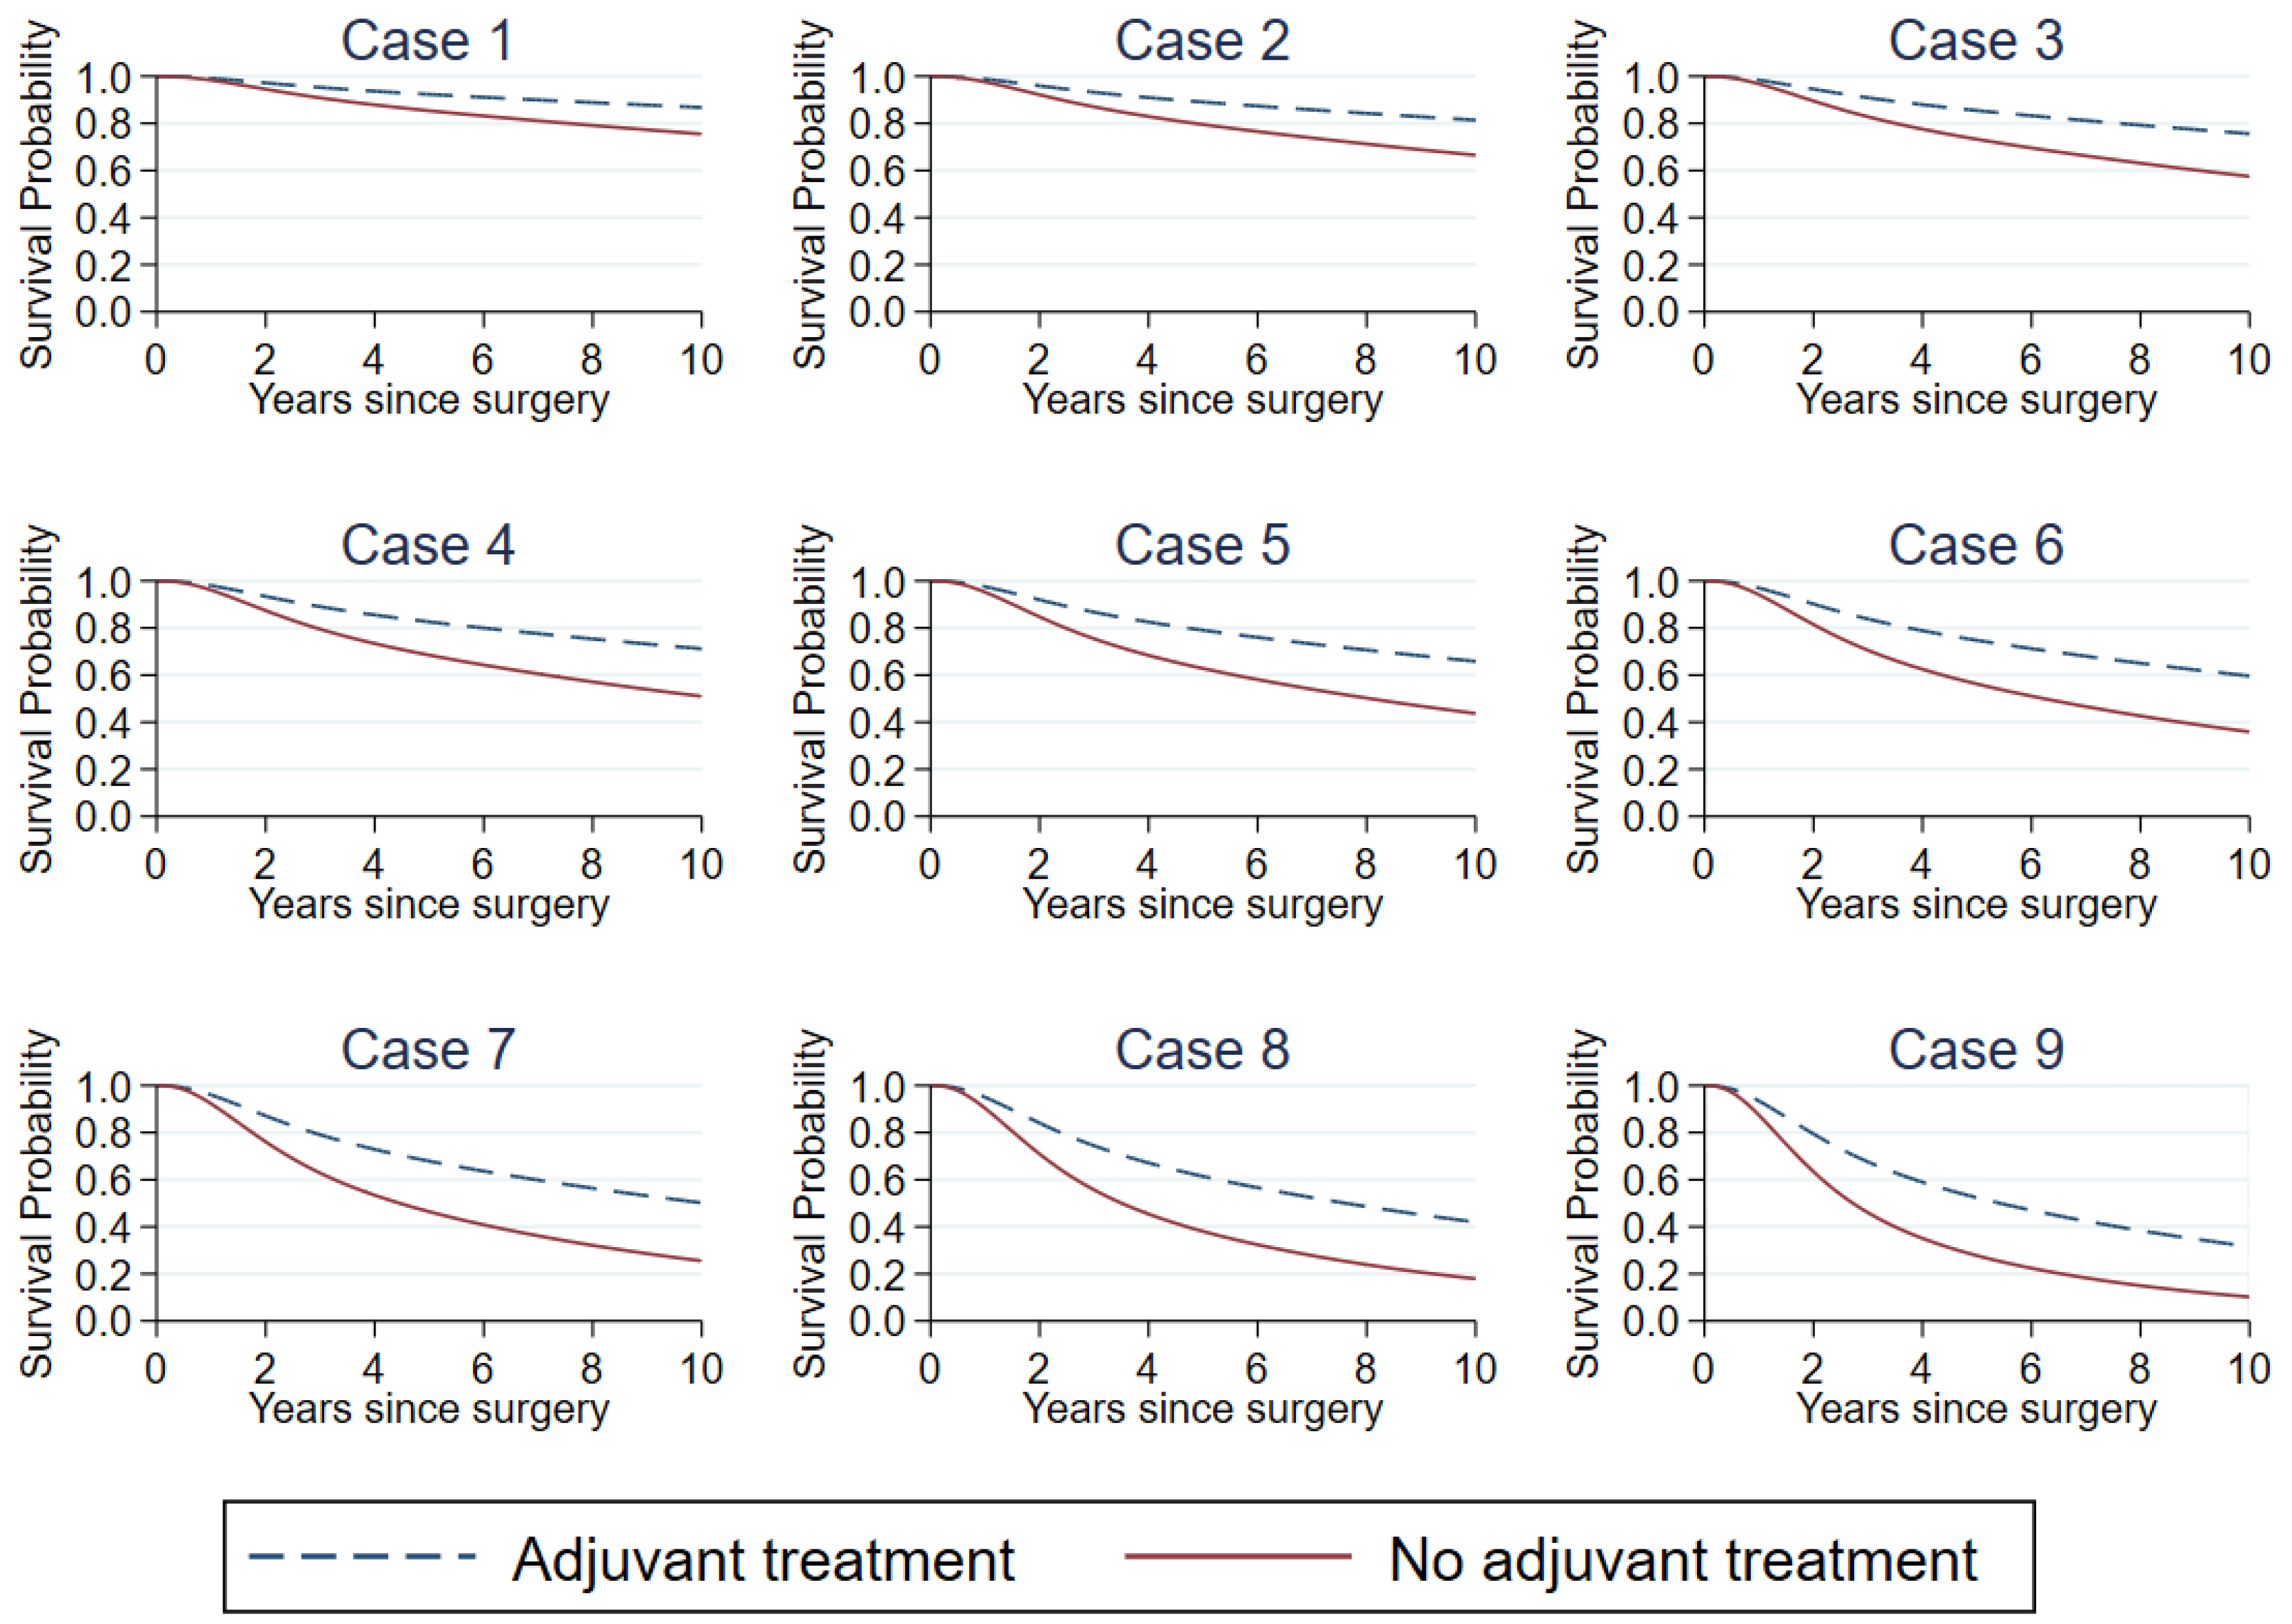
3.2.2. Model Presentation and Demonstration
4. Discussion
5. Conclusions
Supplementary Materials
Author Contributions
Funding
Institutional Review Board Statement
Informed Consent Statement
Data Availability Statement
Acknowledgments
Conflicts of Interest
References
- Ferlay, J.; Colombet, M.; Soerjomataram, I.; Mathers, C.; Parkin, D.M.; Piñeros, M.; Znaor, A.; Bray, F. Estimating the Global Cancer Incidence and Mortality in 2018: GLOBOCAN Sources and Methods. Int. J. Cancer 2019, 144, 1941–1953. [Google Scholar] [CrossRef]
- Cancer in Thailand. Vol.IX, 2013-2015; Imsamran, W., Pattatang, A., Supaattagorn, P., Chiawiriyabunya, I., Namthaisong, K., Wongsana, M., Puttawibul, P., Eds.; National Cancer Institute: Bangkok, Thailand, 2018. [Google Scholar]
- Tassanasunthornwong, S.; Chansaard, W.; Sriplung, H.; Bilheem, S. Breast Cancer in Surat Thani, a Province in Southern Thailand: Analysis of 2004–2012 Incidence and Future Trends. Asian Pac. J. Cancer Prev. 2015, 16, 6735–6740. [Google Scholar] [CrossRef]
- Sangkittipaiboon, S.; Leklob, A.; Sriplung, H.; Bilheem, S. Breast Cancer in Lopburi, a Province in Central Thailand: Analysis of 2001–2010 Incidence and Future Trends. Asian Pac. J. Cancer Prev. 2015, 16, 8359–8364. [Google Scholar] [CrossRef]
- Lalitwongsa, S.; Pongnikorn, D.; Daoprasert, K.; Sriplung, H.; Bilheem, S. Breast Cancer in Lampang, a Province in Northern Thailand: Analysis of 1993–2012 Incidence Data and Future Trends. Asian Pac. J. Cancer Prev. 2015, 16, 8327–8333. [Google Scholar] [CrossRef] [PubMed]
- Sripan, P.; Sriplung, H.; Pongnikorn, D.; Virani, S.; Bilheem, S.; Chaisaengkhaum, U.; Maneesai, P.; Waisri, N.; Hanpragopsuk, C.; Tansiri, P.; et al. Trends in Female Breast Cancer by Age Group in the Chiang Mai Population. Asian Pac. J. Cancer Prev. APJCP 2017, 18, 1411–1416. [Google Scholar] [CrossRef]
- Allemani, C.; Matsuda, T.; Di Carlo, V.; Harewood, R.; Matz, M.; Nikšić, M.; Bonaventure, A.; Valkov, M.; Johnson, C.J.; Estève, J.; et al. Global Surveillance of Trends in Cancer Survival 2000-14 (CONCORD-3): Analysis of Individual Records for 37,513,025 Patients Diagnosed with One of 18 Cancers from 322 Population-Based Registries in 71 Countries. Lancet Lond. Engl. 2018, 391, 1023–1075. [Google Scholar] [CrossRef]
- Polyak, K. Heterogeneity in Breast Cancer. J. Clin. Investig. 2011, 121, 3786–3788. [Google Scholar] [CrossRef]
- Haybittle, J.L.; Blamey, R.W.; Elston, C.W.; Johnson, J.; Doyle, P.J.; Campbell, F.C.; Nicholson, R.I.; Griffiths, K. A Prognostic Index in Primary Breast Cancer. Br. J. Cancer 1982, 45, 361–366. [Google Scholar] [CrossRef]
- Ravdin, P.M.; Siminoff, L.A.; Davis, G.J.; Mercer, M.B.; Hewlett, J.; Gerson, N.; Parker, H.L. Computer Program to Assist in Making Decisions about Adjuvant Therapy for Women with Early Breast Cancer. J. Clin. Oncol. 2001, 19, 980–991. [Google Scholar] [CrossRef] [PubMed]
- Kattan, M.W.; Giri, D.; Panageas, K.S.; Hummer, A.; Cranor, M.; Van Zee, K.J.; Hudis, C.A.; Norton, L.; Borgen, P.I.; Tan, L.K. A Tool for Predicting Breast Carcinoma Mortality in Women Who Do Not Receive Adjuvant Therapy. Cancer 2004, 101, 2509–2515. [Google Scholar] [CrossRef]
- Campbell, H.E.; Gray, A.M.; Harris, A.L.; Briggs, A.H.; Taylor, M.A. Estimation and External Validation of a New Prognostic Model for Predicting Recurrence-Free Survival for Early Breast Cancer Patients in the UK. Br. J. Cancer 2010, 103, 776–786. [Google Scholar] [CrossRef]
- Michaelson, J.S.; Chen, L.L.; Bush, D.; Fong, A.; Smith, B.; Younger, J. Improved Web-Based Calculators for Predicting Breast Carcinoma Outcomes. Breast Cancer Res. Treat. 2011, 128, 827–835. [Google Scholar] [CrossRef]
- Wishart, G.C.; Bajdik, C.D.; Azzato, E.M.; Dicks, E.; Greenberg, D.C.; Rashbass, J.; Caldas, C.; Pharoah, P.D.P. A Population-Based Validation of the Prognostic Model PREDICT for Early Breast Cancer. Eur. J. Surg. Oncol. 2011, 37, 411–417. [Google Scholar] [CrossRef] [PubMed]
- Yao-Lung, K.; Dar-Ren, C.; Tsai-Wang, C. Accuracy Validation of Adjuvant! Online in Taiwanese Breast Cancer Patients--a 10-Year Analysis. BMC Med. Inform. Decis. Mak. 2012, 12, 108. [Google Scholar] [CrossRef] [PubMed]
- Bhoo-Pathy, N.; Yip, C.-H.; Hartman, M.; Saxena, N.; Taib, N.A.; Ho, G.-F.; Looi, L.-M.; Bulgiba, A.M.; van der Graaf, Y.; Verkooijen, H.M. Adjuvant! Online Is Overoptimistic in Predicting Survival of Asian Breast Cancer Patients. Eur. J. Cancer 2012, 48, 982–989. [Google Scholar] [CrossRef]
- Jung, M.; Choi, E.H.; Nam, C.M.; Rha, S.Y.; Jeung, H.C.; Lee, S.H.; Yang, W.I.; Roh, J.K.; Chung, H.C. Application of the Adjuvant! Online Model to Korean Breast Cancer Patients: An Assessment of Prognostic Accuracy and Development of an Alternative Prognostic Tool. Ann. Surg. Oncol. 2013, 20, 2615–2624. [Google Scholar] [CrossRef]
- Wong, H.-S.; Subramaniam, S.; Alias, Z.; Taib, N.A.; Ho, G.-F.; Ng, C.-H.; Yip, C.-H.; Verkooijen, H.M.; Hartman, M.; Bhoo-Pathy, N. The Predictive Accuracy of PREDICT: A Personalized Decision-Making Tool for Southeast Asian Women with Breast Cancer. Medicine 2015, 94, e593. [Google Scholar] [CrossRef]
- Miao, H.; Hartman, M.; Verkooijen, H.M.; Taib, N.A.; Wong, H.-S.; Subramaniam, S.; Yip, C.-H.; Tan, E.-Y.; Chan, P.; Lee, S.-C.; et al. Validation of the CancerMath Prognostic Tool for Breast Cancer in Southeast Asia. BMC Cancer 2016, 16, 820. [Google Scholar] [CrossRef] [PubMed]
- Polchai, N.; Sa-nguanraksa, D.; Numprasit, W.; Thumrongtaradol, T.; O-charoenrat, E.; O-charoenrat, P. A Comparison between the Online Prediction Models CancerMath and PREDICT as Prognostic Tools in Thai Breast Cancer Patients. Cancer Manag. Res. 2020, 12, 5549–5559. [Google Scholar] [CrossRef]
- Steyerberg, E. Clinical Prediction Models: A Practical Approach to Development, Validation, and Updating; Statistics for Biology and Health; Springer: New York, NY, USA, 2009; ISBN 978-0-387-77243-1. [Google Scholar]
- Gourgou-Bourgade, S.; Cameron, D.; Poortmans, P.; Asselain, B.; Azria, D.; Cardoso, F.; A’Hern, R.; Bliss, J.; Bogaerts, J.; Bonnefoi, H.; et al. Guidelines for Time-to-Event End Point Definitions in Breast Cancer Trials: Results of the DATECAN Initiative (Definition for the Assessment of Time-to-Event Endpoints in CANcer Trials). Ann. Oncol. 2015, 26, 873–879. [Google Scholar] [CrossRef]
- Royston, P.; Parmar, M.K.B. Flexible Parametric Proportional-Hazards and Proportional-Odds Models for Censored Survival Data, with Application to Prognostic Modelling and Estimation of Treatment Effects. Stat. Med. 2002, 21, 2175–2197. [Google Scholar] [CrossRef]
- Royston, P.; Lambert, P.C. Flexible Parametric Survival Analysis Using Stata: Beyond the Cox Model, 1st ed.; Stata Press: College Station, TX, USA, 2011; ISBN 978-1-59718-079-5. [Google Scholar]
- Sauerbrei, W.; Royston, P. Building Multivariable Prognostic and Diagnostic Models: Transformation of the Predictors by Using Fractional Polynomials. J. R. Stat. Soc. Ser. A Stat. Soc. 1999, 162, 71–94. [Google Scholar] [CrossRef]
- White, I.R.; Royston, P.; Wood, A.M. Multiple Imputation Using Chained Equations: Issues and Guidance for Practice. Stat. Med. 2011, 30, 377–399. [Google Scholar] [CrossRef] [PubMed]
- Harrell, F.E.; Lee, K.L.; Mark, D.B. Multivariable Prognostic Models: Issues in Developing Models, Evaluating Assumptions and Adequacy, and Measuring and Reducing Errors. Stat. Med. 1996, 15, 361–387. [Google Scholar] [CrossRef]
- Royston, P.; Sauerbrei, W. A New Measure of Prognostic Separation in Survival Data. Stat. Med. 2004, 23, 723–748. [Google Scholar] [CrossRef] [PubMed]
- Tantivatana, T.; Chongthanakorn, M.; Rongsriyam, K.; Katanyoo, K. Treatment Outcomes and Prognostic Factors of Patients with Breast Cancer: A Retrospective Review. J. Med. Assoc. Thai. 2009, 92, 1084. [Google Scholar] [PubMed]
- Chairat, R.; Puttisri, A.; Pamarapa, A.; Wongrach, N.; Tawichasri, C.; Patumanond, J.; Tantraworasin, A.; Charoentum, C. Recurrence and Death from Breast Cancer after Complete Treatments: An Experience from Hospitals in Northern Thailand. J. Med. Assoc. Thai. 2014, 97, 932. [Google Scholar] [PubMed]
- Tubtimhin, S.; Promthet, S.; Suwanrungruang, K.; Supaattagorn, P. Molecular Subtypes and Prognostic Factors among Premenopausal and Postmenopausal Thai Women with Invasive Breast Cancer: 15 Years Follow-up Data. Asian Pac. J. Cancer Prev. 2018, 19, 3167–3174. [Google Scholar] [CrossRef]
- Cao, S.-S.; Lu, C.-T. Recent Perspectives of Breast Cancer Prognosis and Predictive Factors. Oncol. Lett. 2016, 12, 3674–3678. [Google Scholar] [CrossRef]
- Wishart, G.C.; Bajdik, C.D.; Dicks, E.; Provenzano, E.; Schmidt, M.K.; Sherman, M.; Greenberg, D.C.; Green, A.R.; Gelmon, K.A.; Kosma, V.-M.; et al. PREDICT Plus: Development and Validation of a Prognostic Model for Early Breast Cancer That Includes HER2. Br. J. Cancer 2012, 107, 800–807. [Google Scholar] [CrossRef]
- Wishart, G.C.; Rakha, E.; Green, A.; Ellis, I.; Ali, H.R.; Provenzano, E.; Blows, F.M.; Caldas, C.; Pharoah, P.D.P. Inclusion of KI67 Significantly Improves Performance of the PREDICT Prognostication and Prediction Model for Early Breast Cancer. BMC Cancer 2014, 14, 908. [Google Scholar] [CrossRef] [PubMed]
- Phung, M.T.; Tin Tin, S.; Elwood, J.M. Prognostic Models for Breast Cancer: A Systematic Review. BMC Cancer 2019, 19, 230. [Google Scholar] [CrossRef] [PubMed]
- Riley, R.D.; Snell, K.I.; Ensor, J.; Burke, D.L.; Harrell, F.E., Jr.; Moons, K.G.; Collins, G.S. Minimum Sample Size for Developing a Multivariable Prediction Model: PART II—Binary and Time-to-Event Outcomes. Stat. Med. 2019, 38, 1276–1296. [Google Scholar] [CrossRef]
- Pajouheshnia, R.; Schuster, N.A.; Groenwold, R.H.H.; Rutten, F.H.; Moons, K.G.M.; Peelen, L.M. Accounting for Time-Dependent Treatment Use When Developing a Prognostic Model from Observational Data: A Review of Methods. Stat. Neerl. 2020, 74, 38–51. [Google Scholar] [CrossRef]
- Dowsett, M.; Nielsen, T.O.; A’Hern, R.; Bartlett, J.; Coombes, R.C.; Cuzick, J.; Ellis, M.; Henry, N.L.; Hugh, J.C.; Lively, T.; et al. Assessment of Ki67 in Breast Cancer: Recommendations from the International Ki67 in Breast Cancer Working Group. J. Natl. Cancer Inst. 2011, 103, 1656–1664. [Google Scholar] [CrossRef]
- Duffy, M.J.; McGowan, P.M.; Harbeck, N.; Thomssen, C.; Schmitt, M. UPA and PAI-1 as Biomarkers in Breast Cancer: Validated for Clinical Use in Level-of-Evidence-1 Studies. Breast Cancer Res. 2014, 16, 428. [Google Scholar] [CrossRef] [PubMed]
- Zhang, C.; Zhang, M.; Song, S. Cathepsin D Enhances Breast Cancer Invasion and Metastasis through Promoting Hepsin Ubiquitin-Proteasome Degradation. Cancer Lett. 2018, 438, 105–115. [Google Scholar] [CrossRef]


| Characteristics | Total | 5-Year OS | 5-Year DFS | ||
|---|---|---|---|---|---|
| n (%) | (%) | p-Value | (%) | p-Value | |
| Cancer Hospital | |||||
| Lampang | 343 (17.0) | 77.8 | 0.182 | 67.9 | 0.131 |
| Udon Thani | 350 (17.3) | 77.1 | 76.6 | ||
| Ubon Ratchathani | 149 (7.4) | 85.2 | 79.2 | ||
| Surat Thani | 115 (5.7) | 80.9 | 73.9 | ||
| Chonburi | 231 (11.4) | 78.0 | 77.5 | ||
| NCI | 833 (41.2) | 76.5 | 73.6 | ||
| Age at surgery (year, mean ± SD) | 50.4 ± 10.6 | ||||
| <50 | 1020 (50.5) | 80.5 | 0.001 | 77.0 | <0.001 |
| ≥50 | 1001 (49.5) | 75.2 | 71.0 | ||
| Menopausal status | |||||
| Premenopause | 903 (44.7) | 80.2 | 0.012 | 76.6 | 0.005 |
| Postmenopause | 996 (49.3) | 75.4 | 71.2 | ||
| Unknown | 112 (6.0) | ||||
| Pathological stage | |||||
| I | 286 (14.2) | 91.3 | <0.001 | 88.1 | <0.001 |
| II | 979 (48.4) | 84.9 | 80.8 | ||
| III | 744 (36.8) | 63.8 | 60.0 | ||
| Unknown | 12 (0.6) | ||||
| Histological type | |||||
| Ductal | 1915 (94.8) | 77.7 | 0.140 | 73.7 | 0.107 |
| Other types | 106 (5.2) | 82.1 | 79.3 | ||
| Histological grade | |||||
| I | 277 (13.7) | 85.2 | <0.001 | 83.0 | <0.001 |
| II | 955 (47.2) | 80.0 | 75.5 | ||
| III | 652 (32.3) | 72.2 | 68.7 | ||
| Unknown | 137 (6.8) | ||||
| Tumor size (mm, mean ± SD) | 32.7 ± 20.7 | ||||
| <30 | 1014 (50.2) | 82.6 | <0.001 | 79.1 | <0.001 |
| ≥30 | 954 (47.2) | 73.6 | 69.2 | ||
| Unknown | 53 (2.6) | ||||
| LVI | |||||
| Yes | 684 (33.9) | 70.0 | <0.001 | 65.2 | <0.001 |
| No | 1205 (59.6) | 82.0 | 79.0 | ||
| Unknown | 132 (6.5) | ||||
| Node | |||||
| 0 | 838 (41.5) | 88.5 | <0.001 | 85.7 | <0.001 |
| 1–3 | 524 (25.9) | 80.3 | 74.6 | ||
| ≥4 | 659 (32.6) | 62.4 | 58.7 | ||
| ER | |||||
| Positive | 1237 (61.2) | 82.7 | <0.001 | 78.6 | <0.001 |
| Negative | 718 (35.5) | 69.6 | 66.3 | ||
| Unknown | 66 (3.3) | ||||
| PR | |||||
| Positive | 1026 (50.8) | 84.1 | <0.001 | 80.4 | <0.001 |
| Negative | 925 (45.8) | 71.1 | 67.2 | ||
| Unknown | 70 (3.4) | ||||
| HER-2 status | |||||
| Positive | 687 (34.0) | 74.5 | 0.001 | 69.6 | 0.001 |
| Negative | 1110 (54.9) | 80.6 | 77.7 | ||
| Unknown | 224 (11.1) | ||||
| Type of surgery | |||||
| Mastectomy | 1758 (87.0) | 76.3 | <0.001 | 72.6 | <0.001 |
| BCS | 263 (13.0) | 88.2 | 83.3 | ||
| Chemotherapy | |||||
| Yes | 1696 (83.9) | 78.1 | 0.685 | 74.2 | 0.645 |
| No | 325 (16.1) | 76.9 | 72.9 | ||
| Hormonal therapy | |||||
| Yes | 1053 (52.1) | 85.5 | <0.001 | 81.2 | <0.001 |
| No | 900 (44.5) | 69.8 | 66.2 | ||
| Unknown | 68 (3.4) | ||||
| RT | |||||
| Yes | 1126 (55.7) | 75.1 | <0.001 | 70.3 | <0.001 |
| No | 819 (40.5) | 82.3 | 79.6 | ||
| Unknown | 76 (3.8) | ||||
| Predictors | OS | DFS | ||||||
|---|---|---|---|---|---|---|---|---|
| Complete-Case | Multiple Imputation | Complete-Case | Multiple Imputation | |||||
| HR (95% CI) | p-Value | HR (95% CI) | p-Value | HR (95% CI) | p-Value | HR (95% CI) | p-Value | |
| Age at surgery (year) | 1.00 (0.99, 1.01) | 0.985 | 1.00 (0.99, 1.01) | 0.829 | 1.00 (0.99, 1.01) | 0.784 | 1.00 (0.99, 1.01) | 0.563 |
| Menopausal status | ||||||||
| Premenopause | 1 | 1 | 1 | 1 | ||||
| Postmenopause | 1.18 (0.89, 1.57) | 0.241 | 1.17 (0.92, 1.49) | 0.204 | 1.16 (0.89, 1.52) | 0.265 | 1.17 (0.93, 1.46) | 0.174 |
| Pathological stage | ||||||||
| I | 1 | 1 | 1 | 1 | ||||
| II | 1.04 (0.62, 1.74) | 0.880 | 1.38 (0.91, 2.10) | 0.132 | 1.22 (0.75, 1.99) | 0.417 | 1.35 (0.92, 1.98) | 0.126 |
| III | 1.82 (0.97, 3.41) | 0.064 | 2.02 (1.20, 3.38) | 0.008 | 1.97 (1.08, 3.58) | 0.026 | 1.97 (1.22, 3.18) | 0.006 |
| Histological type | ||||||||
| Other types | 1 | 1 | 1 | 1 | ||||
| Ductal | 1.49 (0.66, 3.37) | 0.335 | 0.99 (0.63, 1.56) | 0.980 | 1.41 (0.66, 2.99) | 0.374 | 1.02 (0.67,1.56) | 0.920 |
| Histological grade | ||||||||
| I | 1 | 1 | 1 | 1 | ||||
| II | 1.19 (0.82, 1.73) | 0.360 | 1.25 (0.92, 1.70) | 0.159 | 1.41 (0.98, 2.02) | 0.064 | 1.30 (0.97, 1.74) | 0.078 |
| III | 1.37 (0.93, 2.01) | 0.112 | 1.38 (1.00, 1.89) | 0.048 | 1.53 (1.05, 2.23) | 0.028 | 1.38 (1.02, 1.86) | 0.038 |
| Tumor size (mm) | 1.00 (0.99, 1.01) | 0.368 | 1.00 (0.99, 1.01) | 0.565 | 1.00 (0.99, 1.01) | 0.458 | 1.00 (0.99, 1.01) | 0.696 |
| LVI | ||||||||
| No | 1 | 1 | 1 | 1 | ||||
| Yes | 1.23 (0.98, 1.54) | 0.072 | 1.38 (1.14, 1.66) | 0.001 | 1.28 (1.03, 1.58) | 0.024 | 1.39 (1.17, 1.65) | <0.001 |
| Node | ||||||||
| 0 | 1 | 1 | 1 | 1 | ||||
| 1–3 | 1.59 (1.11, 2.30) | 0.013 | 1.51 (1.14, 2.00) | 0.004 | 1.72 (1.23, 2.39) | 0.001 | 1.60 (1.23, 2.07) | <0.001 |
| ≥4 | 2.24 (1.40, 3.59) | 0.001 | 2.20 (1.51, 3.20) | <0.001 | 2.13 (1.38, 3.30) | 0.001 | 1.99 (1.41, 2.82) | <0.001 |
| ER | ||||||||
| Negative | 1 | 1 | 1 | 1 | ||||
| Positive | 0.89 (0.62, 1.29) | 0.545 | 1.04 (0.77, 1.40) | 0.792 | 0.90 (0.64, 1.27) | 0.542 | 1.05 (0.78, 1.40) | 0.753 |
| PR | ||||||||
| Negative | 1 | 1 | 1 | 1 | ||||
| Positive | 0.90 (0.65, 1.25) | 0.537 | 0.75 (0.58, 0.97) | 0.028 | 0.96 (0.71, 1.31) | 0.819 | 0.79 (0.62, 1.00) | 0.054 |
| HER-2 status | ||||||||
| Negative | 1 | 1 | 1 | 1 | ||||
| Positive | 1.07 (0.86, 1.34) | 0.532 | 1.11 (0.91, 1.35) | 0.307 | 1.10 (0.89, 1.36) | 0.363 | 1.10 (0.91, 1.33) | 0.332 |
| Type of surgery | ||||||||
| Mastectomy | 1 | 1 | 1 | 1 | ||||
| BCS | 0.78 (0.52, 1.17) | 0.237 | 0.72 (0.51, 1.02) | 0.061 | 0.82 (0.57, 1.19) | 0.295 | 0.79 (0.59, 1.08) | 0.140 |
| Chemotherapy | ||||||||
| No | 1 | 1 | 1 | |||||
| Yes | 0.64 (0.45, 0.93) | 0.018 | 0.63 (0.49, 0.82) | 0.001 | 0.56 (0.40, 0.79) | 0.001 | 0.62 (0.48, 0.79) | <0.001 |
| Hormonal therapy | ||||||||
| No | 1 | 1 | 1 | 1 | ||||
| Yes | 0.57 (0.42, 0.78) | <0.001 | 0.62 (0.48, 0.80) | <0.001 | 0.62 (0.46, 0.82) | 0.001 | 0.63 (0.50, 0.81) | <0.001 |
| RT | ||||||||
| No | 1 | 1 | 1 | 1 | ||||
| Yes | 0.98 (0.75, 1.27) | 0.857 | 0.89 (0.72, 1.10) | 0.277 | 1.01 (0.78, 1.29) | 0.968 | 0.96 (0.79, 1.18) | 0.717 |
| 5-year baseline | OS = 89.3% | DFS = 88.9% | ||||||
| 10-year baseline | OS = 81.8% | DFS = 83.8% | ||||||
| Case | Age | Menopause | Stage | Pathology | Grade | Size | LVI | Node | ER | PR | HER-2 | Surgery | 5-year OS (%) | |||
|---|---|---|---|---|---|---|---|---|---|---|---|---|---|---|---|---|
| CC | MI | PREDICT | NPI | |||||||||||||
| 1 | 29 | Pre- | 1 | Ductal | 2 | 20 | No | 0 | Pos | Pos | Neg | Mastectomy | 85.4 | 87.2 | 93.0 | 82.0 |
| 2 | 54 | Pre- | 2 | Ductal | 2 | 40 | No | 0 | Neg | Neg | Neg | Mastectomy | 79.5 | 75.2 | 75.0 | 82.0 |
| 3 | 36 | Pre- | 2 | Ductal | 1 | 35 | No | 18 | Neg | Neg | Neg | BCS | 73.3 | 72.9 | 65.0 | 82.0 |
| 4 | 47 | Pre- | 2 | Ductal | 3 | 30 | Yes | 2 | Pos | Pos | Neg | Mastectomy | 68.5 | 63.9 | 79.0 | 37.0 |
| 5 | 56 | Post- | 2 | Ductal | 3 | 48 | Yes | 2 | Pos | Pos | Neg | Mastectomy | 62.8 | 58.2 | 70.0 | 37.0 |
| 6 | 51 | Pre- | 3 | Ductal | 1 | 50 | No | 8 | Pos | Pos | Neg | Mastectomy | 56.2 | 59.6 | 84.0 | 82.0 |
| 7 | 76 | Post- | 3 | Ductal | 2 | 22 | No | 34 | Pos | Pos | Neg | Mastectomy | 46.4 | 47.0 | 48.0 | 72.0 |
| 8 | 49 | Pre- | 3 | Ductal | 3 | 45 | No | 11 | Neg | Neg | Neg | Mastectomy | 38.1 | 40.3 | 26.0 | 37.0 |
| 9 | 33 | Pre- | 3 | Ductal | 2 | 150 | Yes | 17 | Neg | Neg | Neg | Mastectomy | 27.8 | 28.4 | 1.0 | 37.0 |
| Case | Age | Menopause | Stage | Pathology | Grade | Size | LVI | Node | ER | PR | HER-2 | Surgery | 5-year OS (%) | 10-year OS (%) | ||
|---|---|---|---|---|---|---|---|---|---|---|---|---|---|---|---|---|
| No Rx | Rx | No Rx | Rx | |||||||||||||
| 1 | 29 | Pre- | 1 | Ductal | 2 | 20 | No | 0 | Pos | Pos | Neg | Mastectomy | 85.4 | 92.3 | 75.5 | 86.8 |
| 2 | 54 | Pre- | 2 | Ductal | 2 | 40 | No | 0 | Neg | Neg | Neg | Mastectomy | 79.5 | 89.1 | 66.5 | 81.4 |
| 3 | 36 | Pre- | 2 | Ductal | 1 | 35 | No | 18 | Neg | Neg | Neg | BCS | 73.3 | 85.5 | 57.5 | 75.6 |
| 4 | 47 | Pre- | 2 | Ductal | 3 | 30 | Yes | 2 | Pos | Pos | Neg | Mastectomy | 68.5 | 82.6 | 51.0 | 71.2 |
| 5 | 56 | Post- | 2 | Ductal | 3 | 48 | Yes | 2 | Pos | Pos | Neg | Mastectomy | 62.8 | 79.1 | 43.7 | 65.8 |
| 6 | 51 | Pre- | 3 | Ductal | 1 | 50 | No | 8 | Pos | Pos | Neg | Mastectomy | 56.2 | 74.8 | 35.9 | 59.6 |
| 7 | 76 | Post- | 3 | Ductal | 2 | 22 | No | 34 | Pos | Pos | Neg | Mastectomy | 46.4 | 67.9 | 25.5 | 50.2 |
| 8 | 49 | Pre- | 3 | Ductal | 3 | 45 | No | 11 | Neg | Neg | Neg | Mastectomy | 38.1 | 61.4 | 17.9 | 42.0 |
| 9 | 33 | Pre- | 3 | Ductal | 2 | 150 | Yes | 17 | Neg | Neg | Neg | Mastectomy | 27.8 | 52.4 | 10.2 | 31.6 |
Publisher’s Note: MDPI stays neutral with regard to jurisdictional claims in published maps and institutional affiliations. |
© 2021 by the authors. Licensee MDPI, Basel, Switzerland. This article is an open access article distributed under the terms and conditions of the Creative Commons Attribution (CC BY) license (http://creativecommons.org/licenses/by/4.0/).
Share and Cite
Pongnikorn, D.; Phinyo, P.; Patumanond, J.; Daoprasert, K.; Phothong, P.; Siribumrungwong, B. Individualized Prediction of Breast Cancer Survival Using Flexible Parametric Survival Modeling: Analysis of a Hospital-Based National Clinical Cancer Registry. Cancers 2021, 13, 1567. https://doi.org/10.3390/cancers13071567
Pongnikorn D, Phinyo P, Patumanond J, Daoprasert K, Phothong P, Siribumrungwong B. Individualized Prediction of Breast Cancer Survival Using Flexible Parametric Survival Modeling: Analysis of a Hospital-Based National Clinical Cancer Registry. Cancers. 2021; 13(7):1567. https://doi.org/10.3390/cancers13071567
Chicago/Turabian StylePongnikorn, Donsuk, Phichayut Phinyo, Jayanton Patumanond, Karnchana Daoprasert, Pachaya Phothong, and Boonying Siribumrungwong. 2021. "Individualized Prediction of Breast Cancer Survival Using Flexible Parametric Survival Modeling: Analysis of a Hospital-Based National Clinical Cancer Registry" Cancers 13, no. 7: 1567. https://doi.org/10.3390/cancers13071567
APA StylePongnikorn, D., Phinyo, P., Patumanond, J., Daoprasert, K., Phothong, P., & Siribumrungwong, B. (2021). Individualized Prediction of Breast Cancer Survival Using Flexible Parametric Survival Modeling: Analysis of a Hospital-Based National Clinical Cancer Registry. Cancers, 13(7), 1567. https://doi.org/10.3390/cancers13071567