Article

Single-Cell NGS-Based Analysis of Copy Number Alterations Reveals New Insights in Circulating Tumor Cells Persistence in Early-Stage Breast Cancer

1
Biosciences Laboratory, Istituto Scientifico Romagnolo per lo Studio e la Cura dei Tumori (IRST) IRCCS, 47014 Meldola, Italy
2
Unit of Biostatistics and Clinical Trials, Istituto Scientifico Romagnolo per lo Studio e la Cura dei Tumori (IRST) IRCCS, 47014 Meldola, Italy
3
Pathology Unit, AUSL Romagna, Morgagni-Pierantoni Hospital, 47121 Forlì, Italy
4
Scientific Directorate, Istituto Scientifico Romagnolo per lo Studio e la Cura dei Tumori (IRST) IRCCS, 47014 Meldola, Italy
5
Department of Medical Oncology, Istituto Scientifico Romagnolo per lo Studio e la Cura dei Tumori (IRST) IRCCS, 47014 Meldola, Italy
*
Author to whom correspondence should be addressed.
The authors contributed equally as co-first authors.
Cancers 2020, 12(9), 2490; https://doi.org/10.3390/cancers12092490
Submission received: 23 July 2020 / Revised: 28 August 2020 / Accepted: 31 August 2020 / Published: 2 September 2020
(This article belongs to the Special Issue Prognostic Factors Research in Breast Cancer Patients)

Abstract

:

Simple Summary

Circulating tumor cells (CTCs) are crucial for the identification of patients with a higher risk of relapse, including those diagnosed with breast cancer (BC). The aim of this study was to explore their molecular aspects in 11 early-stage BC patients during patient management, focusing on copy number alterations (CNAs) and exploiting a single-CTC next-generation sequencing approach. CTCs showed different degrees of aberration based on access time. Moreover, CTCs, in particular those persisting even months after tumor resection, shared CNAs with matched tumor tissue. Enrichment analyses of CNAs on CTCs highlighted peculiar aberrations, especially associated with interferon (IFN)-associated terms. The study of CTCs CNAs can provide information about the molecular mechanisms involving CTC-related processes and their survival ability in occult niches, supporting the goal of exploiting their application in patients’ surveillance and follow-up.

Abstract

Circulating tumor cells (CTCs) are a rare population of cells representing a key player in the metastatic cascade. They are recognized as a validated tool for the identification of patients with a higher risk of relapse, including those diagnosed with breast cancer (BC). However, CTCs are characterized by high levels of heterogeneity that also involve copy number alterations (CNAs), structural variations associated with gene dosage changes. In this study, single CTCs were isolated from the peripheral blood of 11 early-stage BC patients at different time points. A label-free enrichment of CTCs was performed using OncoQuick, and single CTCs were isolated using DEPArray. Libraries were prepared from single CTCs and DNA extracted from matched tumor tissues for a whole-genome low-coverage next-generation sequencing (NGS) analysis using the Ion Torrent S5 System. The analysis of the CNA burden highlighted that CTCs had different degrees of aberration based on the time point and subtype. CTCs were found even six months after surgery and shared CNAs with matched tumor tissue. Tumor-associated CNAs that were recurrent in CTCs were patient-specific, and some alterations involved regions associated with BC and survival (i.e., gains at 1q21-23 and 5p15.33). The enrichment analysis emphasized the involvement of aberrations of terms, associated in particular with interferon (IFN) signaling. Collectively, our findings reveal that these aberrations may contribute to understanding the molecular mechanisms involving CTC-related processes and their survival ability in occult niches, supporting the goal of exploiting their application in patients’ surveillance and follow-up.

1. Introduction

Circulating tumor cells (CTCs) constitute the leukemic phase of a solid tumor. They have the potential to give rise to detectable metastasis [1] and to date the major cause of death in cancer patients [2]. Their identification and subsequent molecular analysis, in particular at a single-cell level, provide information about the prognosis and could be useful for a selective choice for targeted therapies and therapy monitoring [3,4,5,6], enforcing the rationale of using CTCs in the clinical application of liquid biopsy approaches.
The only Food and Drug Administration (FDA)-approved CTC assay applied in a clinical setting with a prognostic purpose for several advanced tumors in BC consists in the detection and enumeration of CTCs using the CellSearch system [7]. To date, BC is estimated to be, among the various types of cancer, the most susceptible one to develop recurrences at both the loco-regional and systemic levels, even after decades. Besides mammography and other instrumental tests based on symptom occurrence, there are no recommended tests in the follow-up of operated asymptomatic patients [8,9,10,11]. CTC detection in both early-stage and metastatic BC patients was proven to discriminate cases with a high risk of relapse [6,12,13,14], representing an innovative non-invasive tool to improve BC disease progression monitoring. However, the blunt CTC enumeration does not provide any information about their molecular features.
High levels of intra- and inter-patient heterogeneity at the genetic and transcriptional levels were described in CTCs isolated from both metastatic and early-stage BC patients [15,16]. In addition to the great genomic heterogeneity derived from somatic variants in cancer-associated genes, a high variability was found in relation to the spectrum of CTCs’ somatic copy number aberrations (CNAs), i.e., structural variations associated with changes in gene expression [16,17]. Few studies have explored the role of CNAs in the CTCs of non-metastatic and metastatic BC patients [18,19,20], but their evolution steps during patients’ clinical management are still not fully elucidated.
In this pilot study, by exploiting a whole-genome low-coverage next-generation sequencing (NGS) approach, we evaluated the CNA profiles of single CTCs isolated from early-stage BC patients at different time points. Analyses of the CNA burden highlighted that CTCs showed different degrees of aberration based on time access and subtype. Moreover, our results revealed that CTCs, in particular those persisting even months after tumor resection, shared CNAs with matched tumor tissue. Enrichment analyses of CNAs on CTCs highlighted peculiar aberrations, especially associated with interferon (IFN)-associated terms. Our work paves the way for new directions with more in-depth studies of the mechanisms related to the field of CTCs and their biology. Our results can lay the groundwork for reinforcing the hypothesis of a pivotal prognostic role of CTCs, useful for applications in long-term surveillance and patient follow-up, bringing out CTCs as an innovative alternative to more conventional and studied approaches.

2. Results

2.1. Isolation of CTCs

Blood sampling was performed at three time points: one day before surgery (A), one month after surgery (B) and after adjuvant therapy/six months after surgery (C). After enrichment, all the identified CTCs were sorted by the DEPArray platform. We performed downstream analyses on all of the 49 identified single CTCs, as described in Table 1.
We observed that all the patients but one (90.9%) had CTCs at diagnosis, whereas 8 (72.7%) and 7 out of 11 (63.3%) had CTCs at time points B and C, respectively. Interestingly, we observed a 45.8% decrease in the CTC number between time points A (n = 24) and B (n = 13). We did not notice a significant decrease in the CTC number between time points B (n = 13) and C (n = 12). In particular, CTCs were persistent six months after surgery (time point C), and we decided to consider them as long-persisting cells without a short-term metastatic potential, since none of the seven patients displaying CTCs at this time point gave any evidence of a disease to date, more than five years after surgery.

2.2. Single-Cell CNA Analysis of CTCs with Whole-Genome NGS

We performed single-cell molecular analyses to characterize the CNA profile of each single cell. Furthermore, to obtain information regarding the CNA burden, intended as a measure of the degree of genomic alteration at the whole genome level [20], we calculated the Jaccard Index (JI). JI is a measure of similarity, which we computed as the ratio of shared-to-all aberrations between single CTCs and lymphocytes, which we considered as a reference normal chromosomal set.
We observed that almost all CTCs had a JI below 0.4, meaning that the analyzed cells had less than 40% genomic similarity when compared to the reference. The CNA burden of single CTCs of TNBC (n = 26) and non-TNBC (n = 23) patients did not differ significantly (p = 0.18), although the violin plots showed a trend of heterogeneity in terms of the CNA burden (Figure 1).
The non-TNBC cohort displayed a higher dispersion of JI values of CTCs, suggesting an almost bimodal trend of the violin plot. Conversely, the violin plot of the TNBC group showed that the JIs of CTCs were concentrated at a lower JI median value, implying the presence of CTCs with a less heterogeneous, but greater, CNA burden.
By comparing the CNA profiles of CTCs and the correspondent tumor tissues (Figure 2), JIs ranged between 0.02 and 0.52, implying a similarity between CTCs and matched tumor tissues in terms of CNAs between 2% and 52%.
The violin plot of the non-TNBC cohort maintained a bimodal trend, with the CTCs’ CNA profile being heterogeneously different from the primary tumor. Conversely, all of the CTCs of the TNBC cohort differed from the tumor mass in the same manner, since the JIs were located in a concentrated peak. We did not observe any statistical significance between the two cohorts.
Concerning the CNA burden of single CTCs isolated at each different time point, Figure 3A (n = 24), Figure 3B (n = 13), and Figure 3C (n = 12), we found that the JIs of cells from times A and B differed significantly (p = 3.2 × 10⁻⁶ with Mann–Whitney U test). Cells from time B showed a median JI that was slightly higher than that observed at time A, suggesting that surgery (primary tumor excision) and time may select CTCs with a higher and more heterogeneous CNA burden.
Interestingly, the difference between the median JIs pre- and post-surgery was also shown to be significant by comparing the CNA profile of CTCs and matched tumor tissues (Figure 4). These data suggest that, besides the selection of CTCs with a higher CNA burden, at time point B we observed CTCs that were more similar to the matched primary tumor.
Moreover, although the JIs of CTCs from time point C did not significantly differ when compared to other groups, in both Figure 3 and Figure 4 one can see that the presence of CTCs with more dispersed CNA burdens appeared after adjuvant therapy. In particular, Figure 4 shows that, within the cohort of CTCs of time C, there were cells with a CNA profile similar to the original tumor, which was resected six months before.
Generally, the reported violin plots illustrate that the CNA burden of CTCs became more dispersed during the disease.

2.3. Identification of Aberrations Shared Between CTCs and Matched Tumor Tissue

We wanted to verify the presence of CNAs shared between CTCs and matched tumor tissue, and to understand if shared regions were recurrent along the course of the patients’ disease, in particular in CTCs from time C.
To accomplish this task, besides single CTC sequencing, we improved the protocol of the Ampli1 LowPass for Ion Torrent (Menarini Silicon Biosystems) to obtain CNA profiles of the tissue starting from FFPE specimens, and we searched for altered common regions at the intra-patient level for 10 patients.
For five out of six patients who had detectable CTCs at time C, CNA profiling of the FFPE specimen was possible. Interestingly, despite the high CNA burden of CTCs, we detected CNA regions that were shared among tumor tissue and CTCs from times A, B and C. In Table 2, we report the tumor-associated CNA found in at least two CTCs of the same patient and recurrent in cells from time C. Each CTC was codified as follows: PXX (patient code) A/B/C (timepoint)_Cell ID.
All the reported CNAs were chromosomal gains. Six regions were shown to be altered at all time points, eight between the CTCs of time points B and C, while thirteen were shared between those of A and C. Only four regions were altered in the tissue and at the access time C only. Interestingly, TNBC Patient 04 had the highest number of regions in common between matched tissue and CTCs, whereas the CTCs of TNBC Patient 02 only displayed two regions in common with the tissue. Patients 02 and 04 were diagnosed with grade 3 and Ki-67 85% and 80% BC, respectively, but only patient 04 showed vascular invasion. Concerning non-TNBC patients, we observed only one region in the CTCs that was in common with the tissue for each patient.
Generally, we observed that, beyond persisting after surgery and adjuvant therapy, CTCs from timepoint C had certain aberrations similar to the tumor tissue. All the aberrations were patient-specific. Importantly, among all the alterations, we found some chromosomal regions that have been described in the literature as being involved with BC, as reported in Table 2.
In Table S1, we reported the CNAs shared between CTCs and matched tumor tissue in the whole case series, including for patients who did not display CTCs at time C.

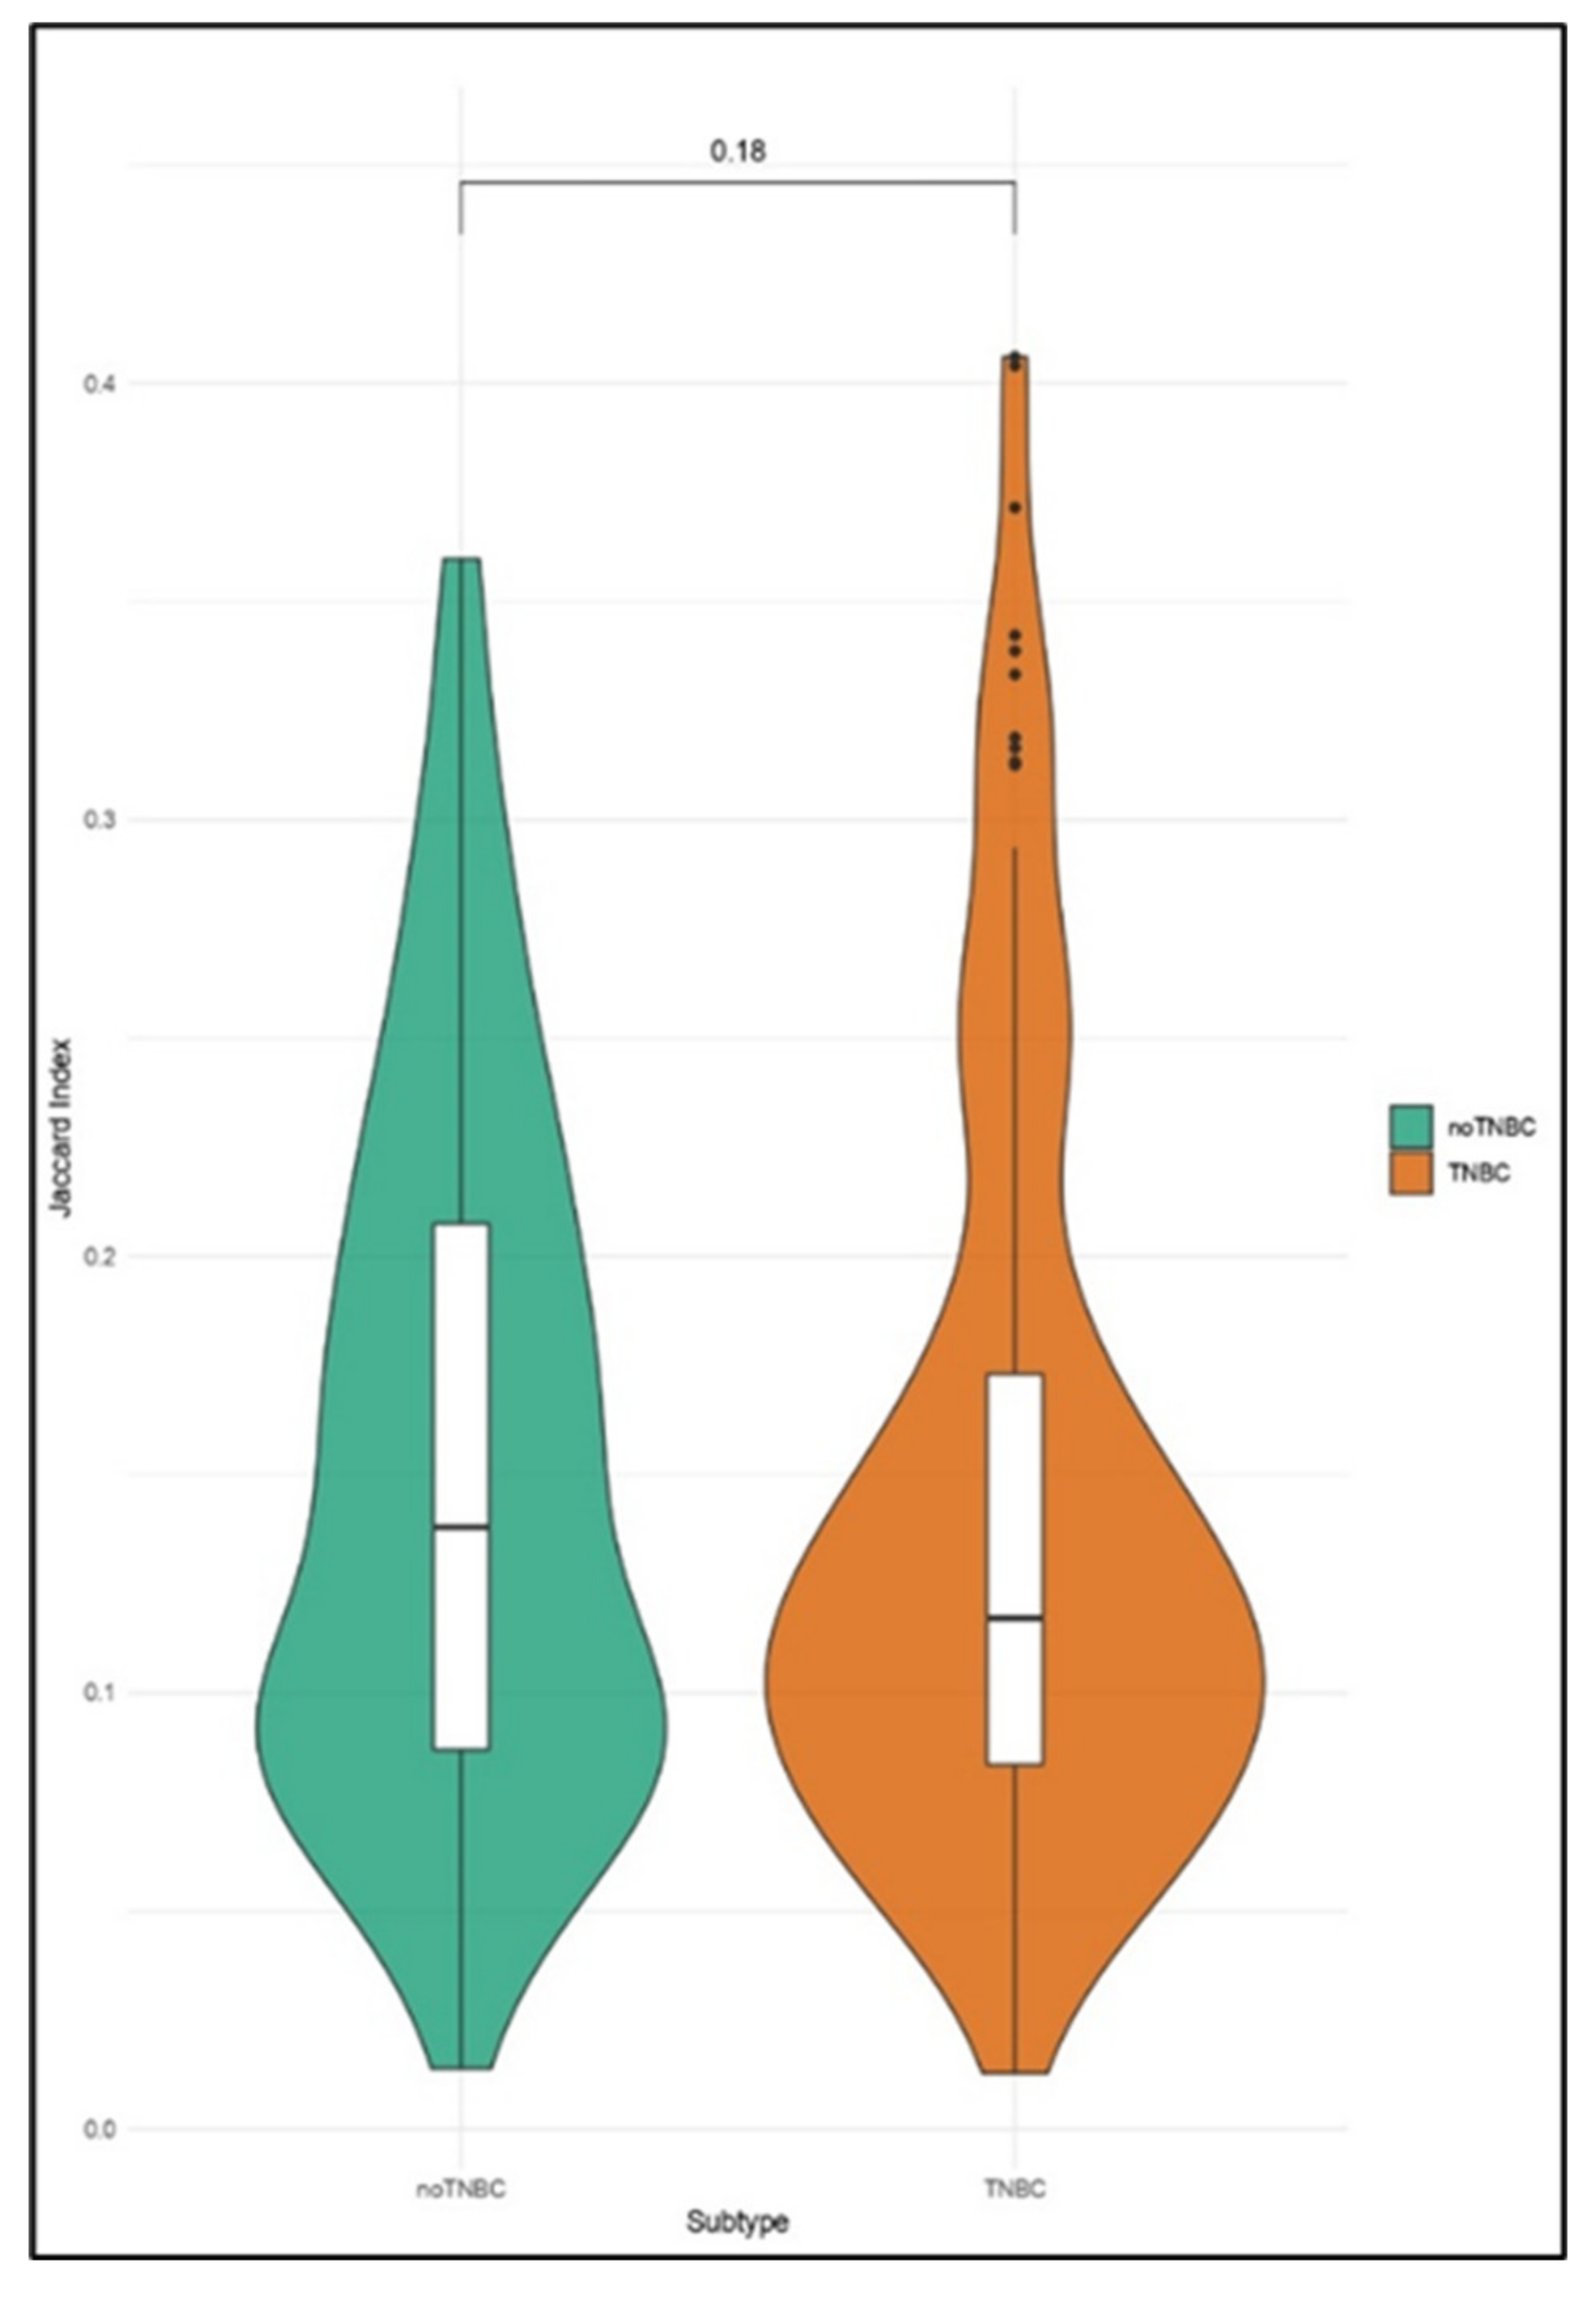
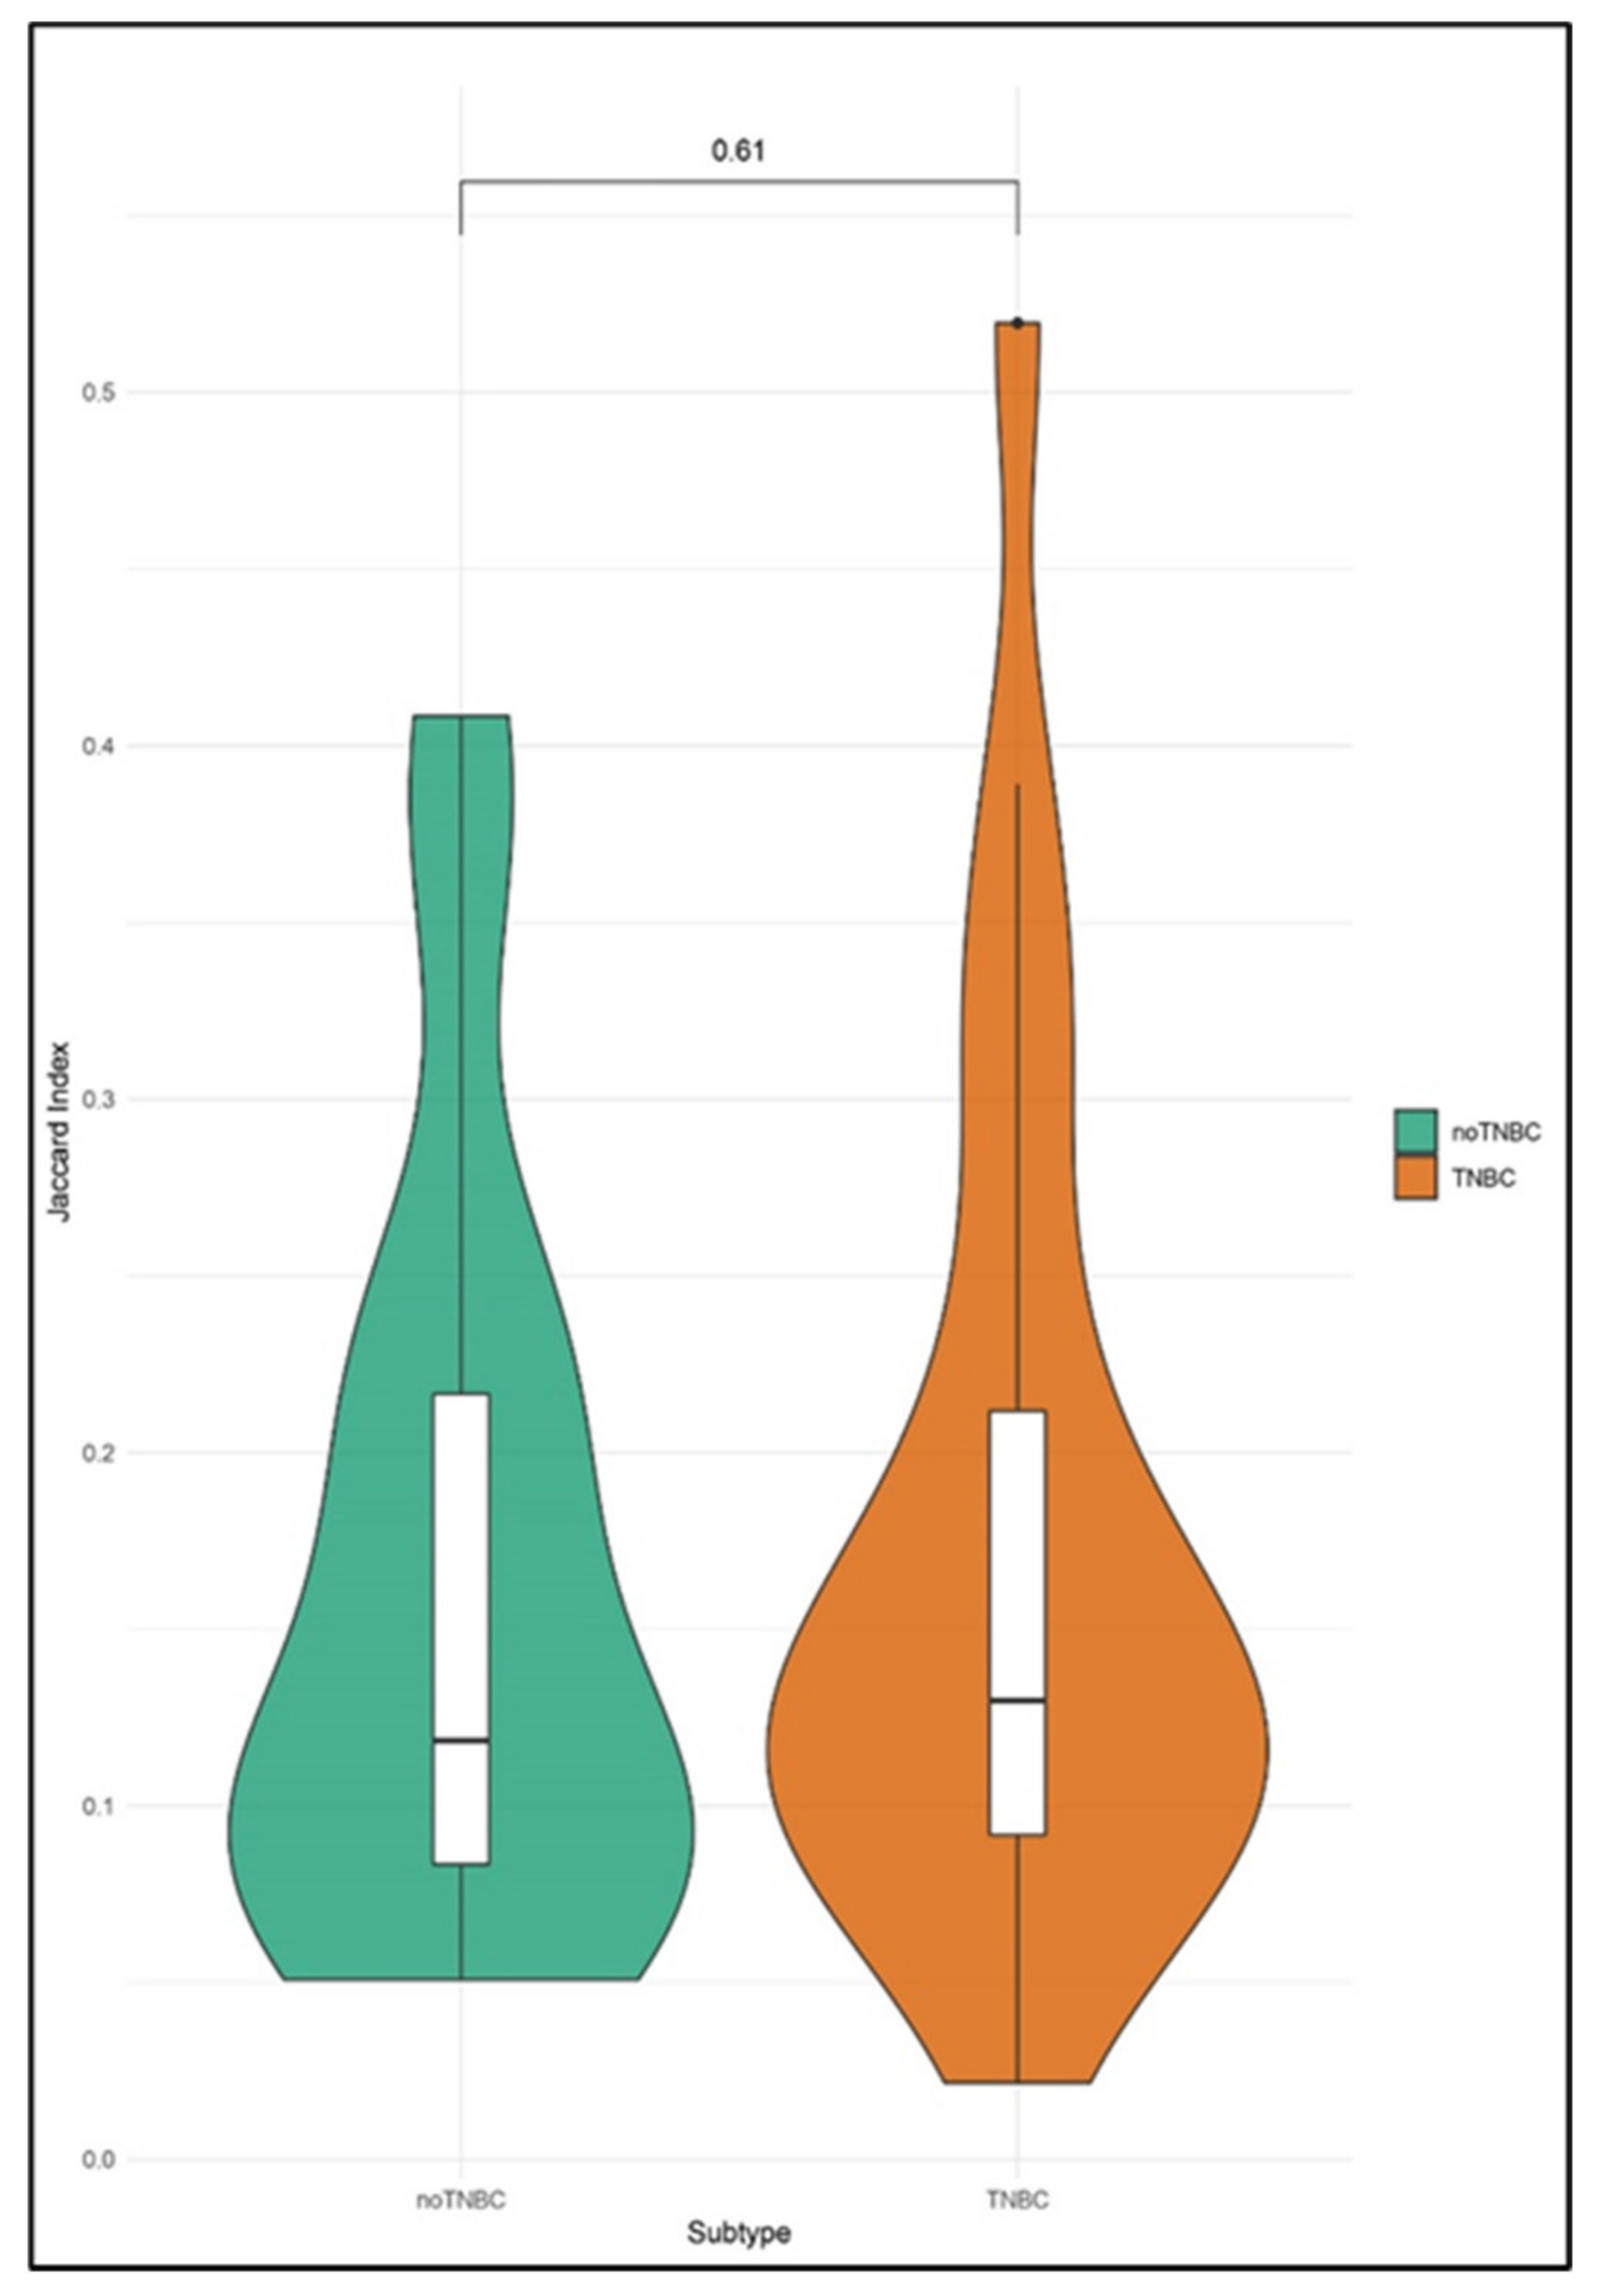
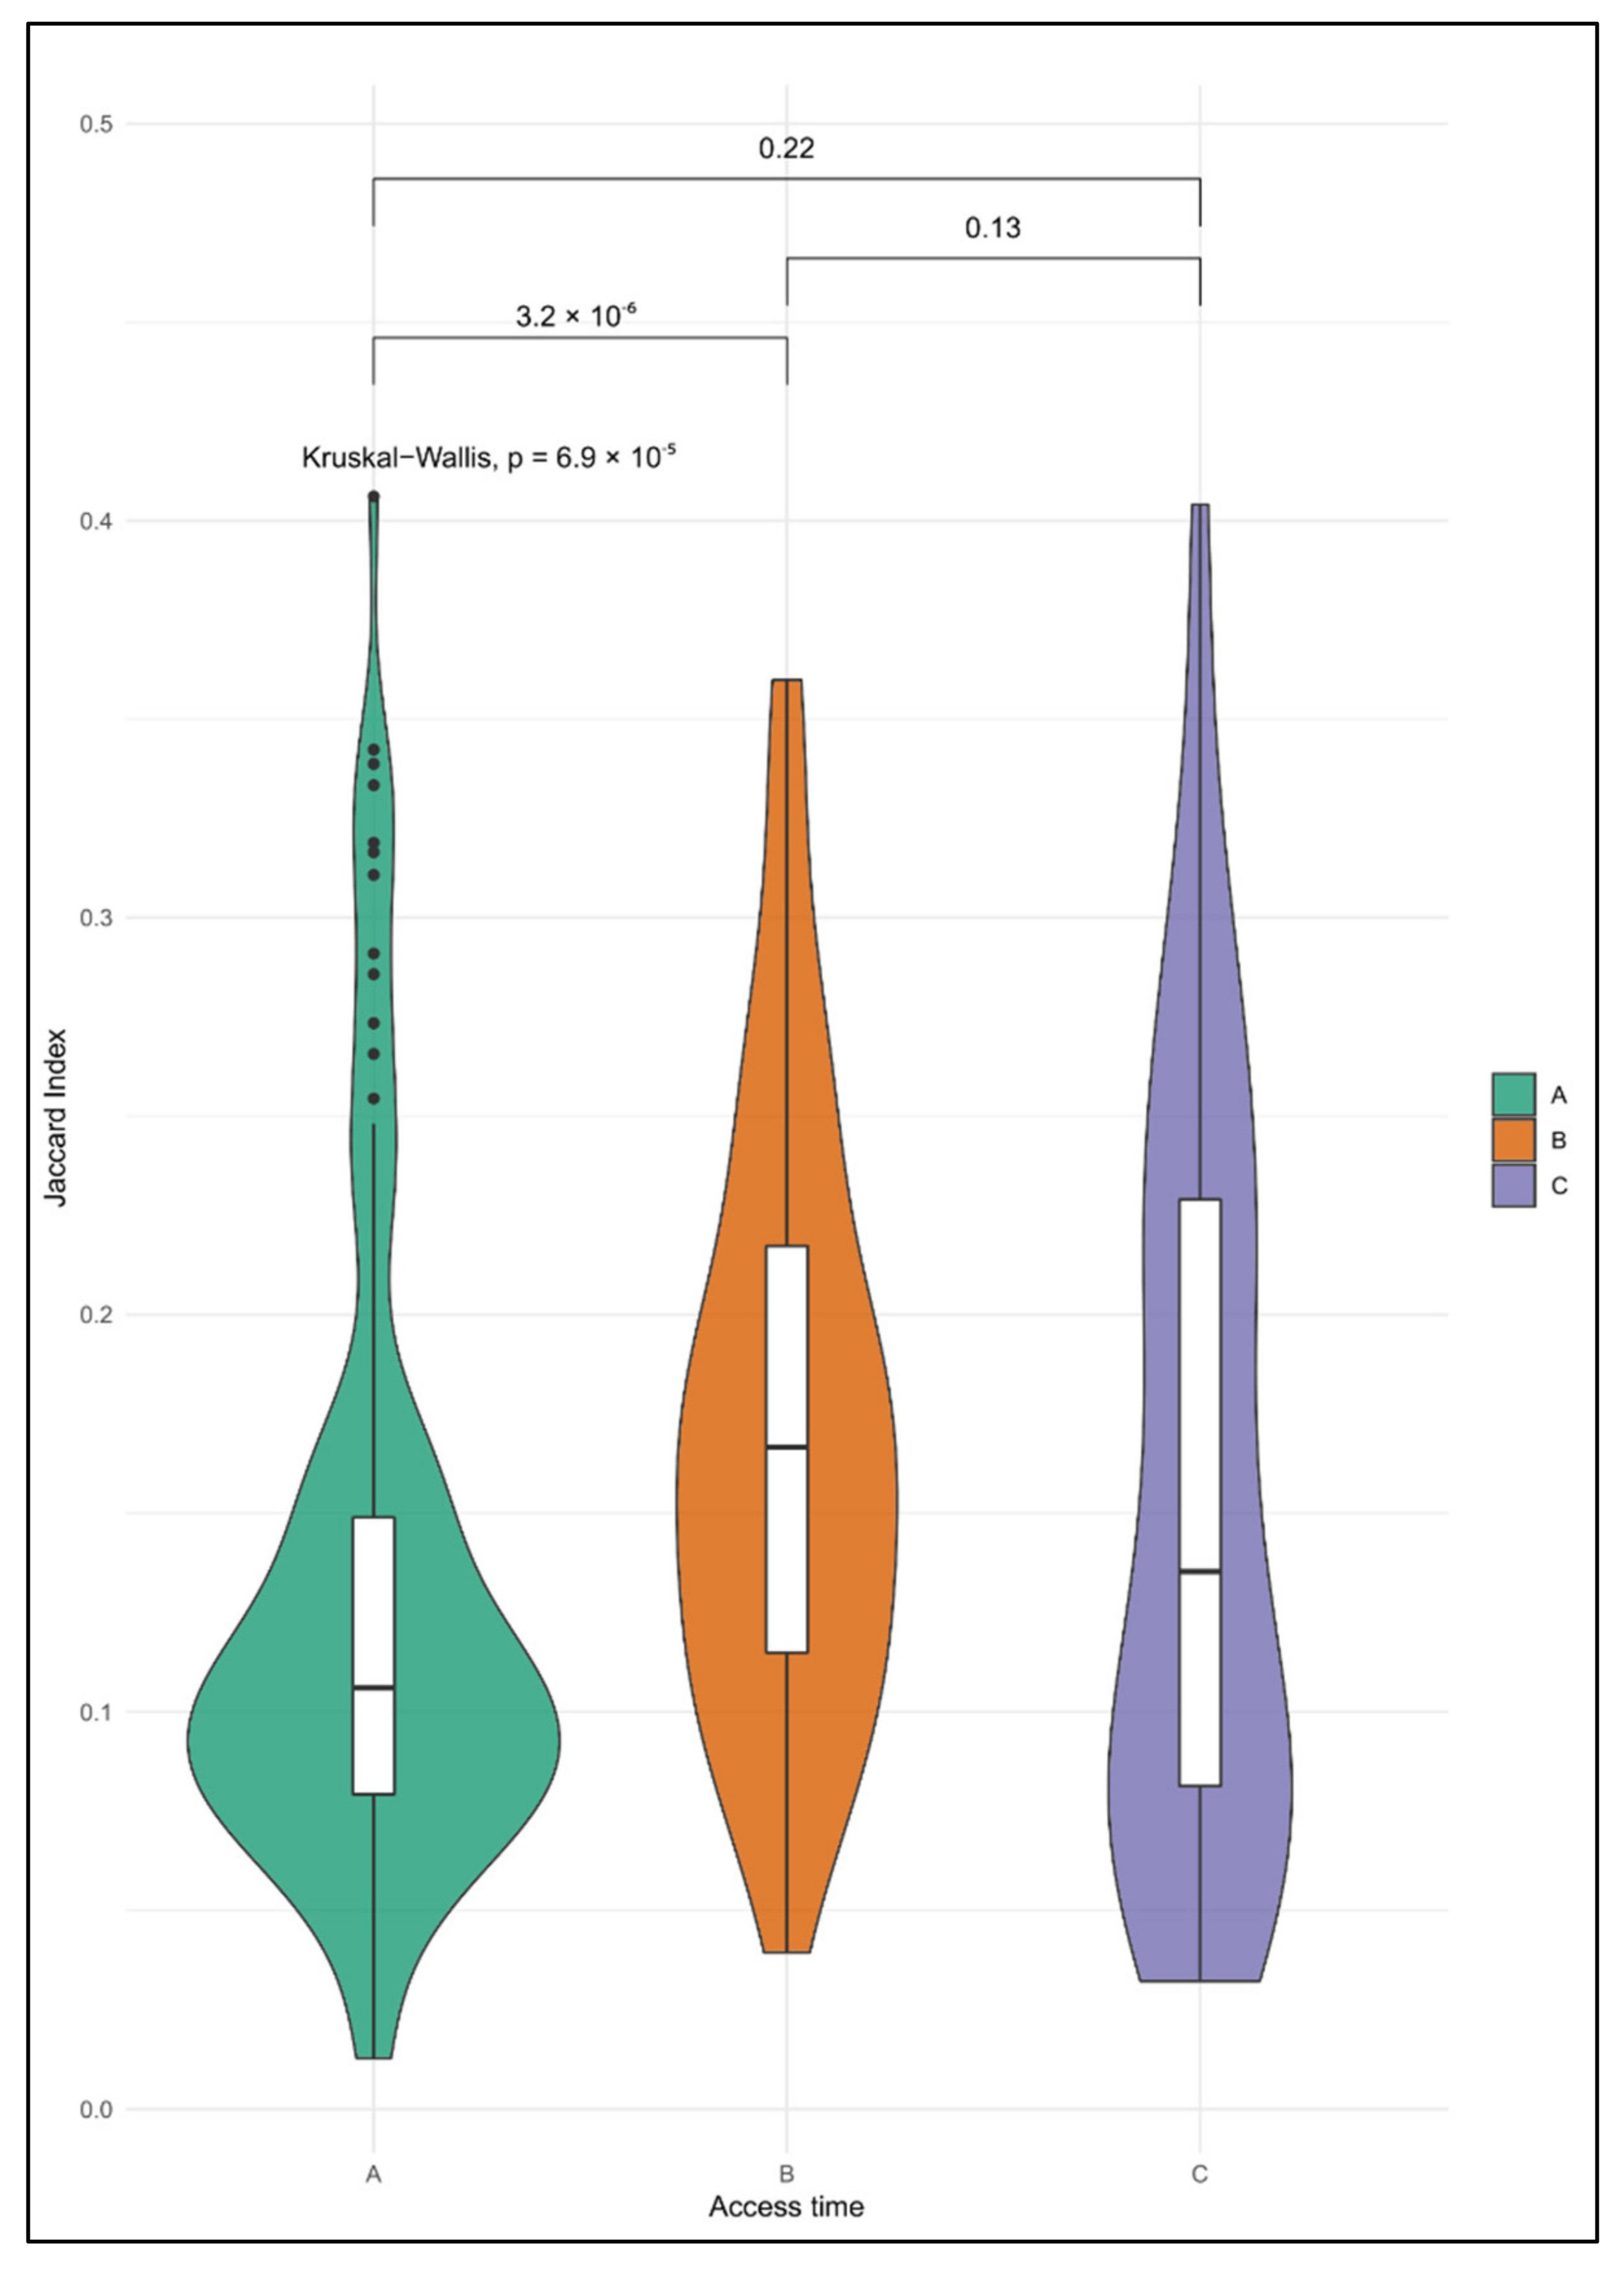
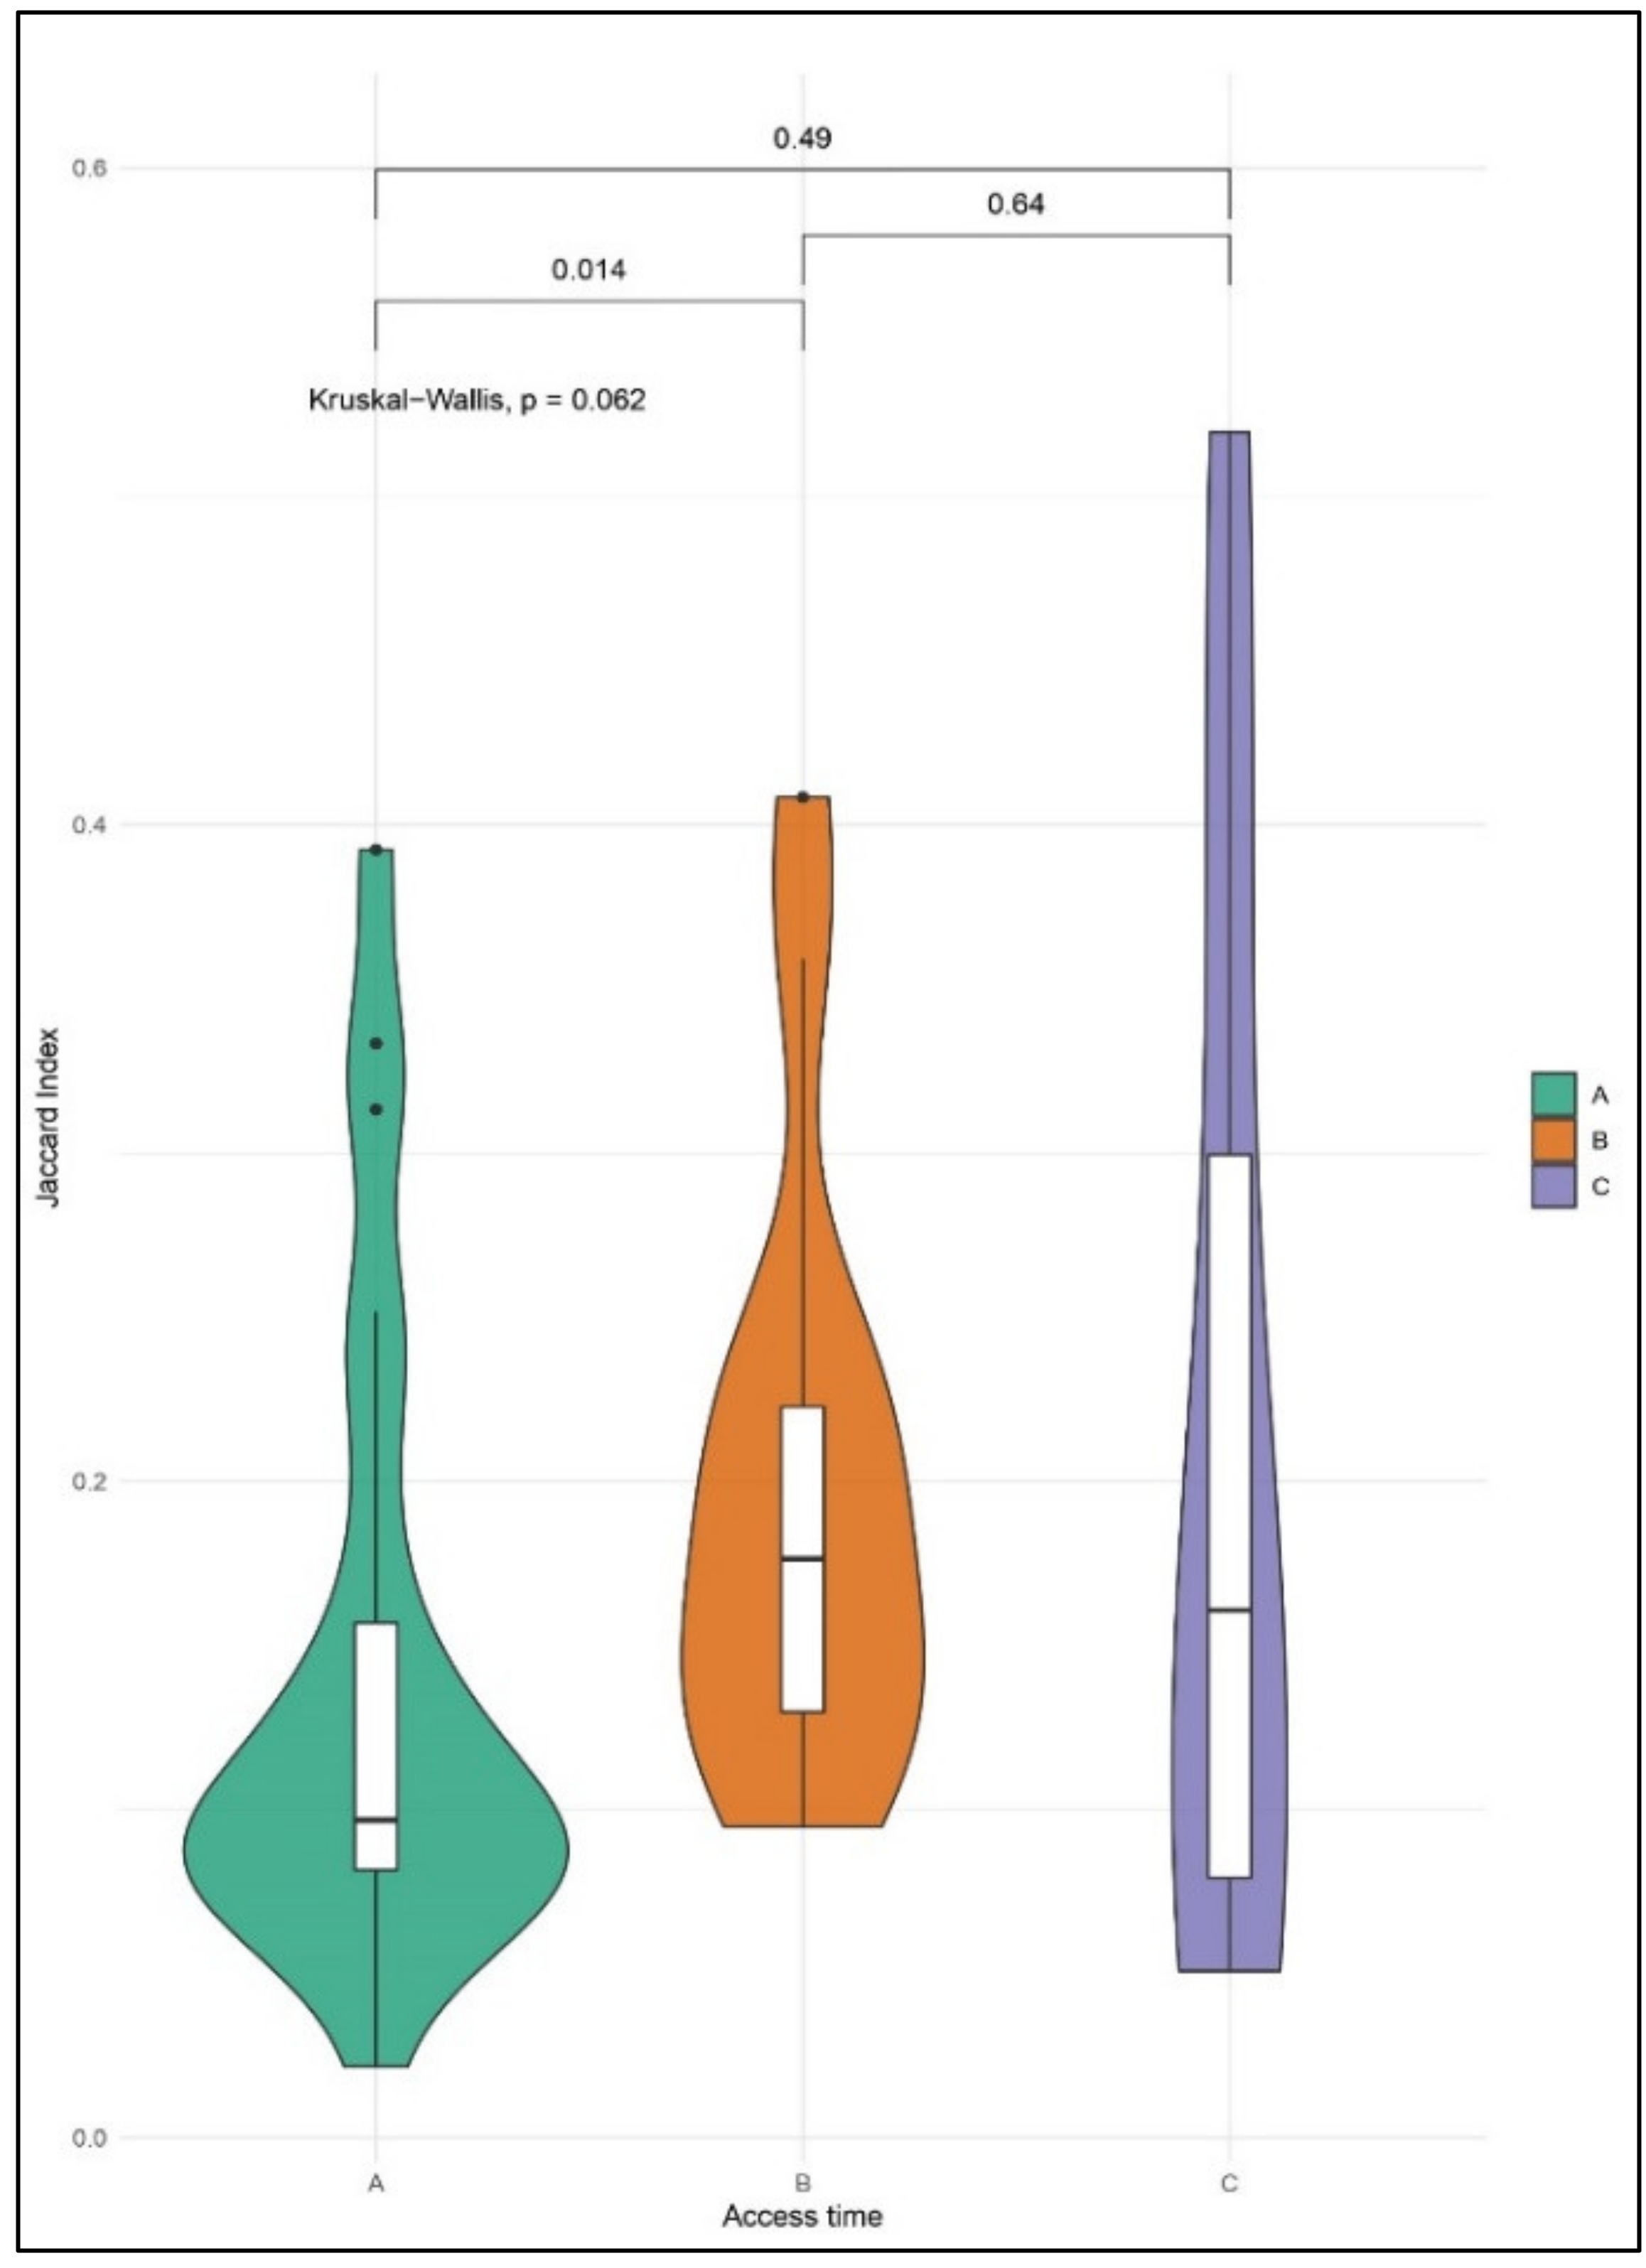
2.4. Enrichment Analyses of CNA in Single CTCs

To gain further insights into the function of identified CNAs in single CTCs, we performed enrichment analyses. The results of the enrichment analyses and CTCs are reported in Table S2. Table 3 reports the list of the significantly enriched terms (adjusted p < 0.05) of the GO-Molecular Function database.
The most enriched term, found in 10 single CTCs out of 49 (20.4%), was associated with the activation of natural killer (NK) cells in the immune response (GO:0002323). However, the major part of the enriched terms was linked to the activation and proliferation of immune cells (B-cells, NK, lymphocyte), as well as to the response to double-strand RNA (dsRNA) and the phosphorylation of the Signal Transducer and Activator of Transcription (STAT) protein. Interestingly, genes associated with IFN were reported in nearly all of the enriched terms, suggesting a possible involvement in CTC biology.
Collectively, these data indicate that the observed chromosomal aberrations in CTCs seem to occur in regions where genes codify for proteins associated with an immune response.

3. Discussion

In this pilot study, we explored the molecular aspects of CTCs in early-stage BC patients during the disease and after treatments, focusing on the CNAs.
The analysis of the CNA burden showed that CTCs had different degrees of aberrations based on the time point. In particular, we observed that surgery and time may play a role in a sort of selection for almost half of CTCs, targeting those with a higher CNA burden. Indeed, at time B, cells showed a lower CNA burden when compared to time-A CTCs. At the same time, the CNA degree of time C-CTCs, recovered six months after surgery, gets even more heterogeneous, with cells showing a lower median CNA burden than for other time points. Our data might suggest that CTCs with higher levels of aberrations can be more susceptible to adjuvant therapy. The chromosomal status in BC has already been reported in the literature as potentially predicting the response to distinct therapeutic agents, such as anthracyclines [26]. Furthermore, similarity analyses revealed that, among time C-CTCs, some cells resembled the matched tumor more than those from other timepoints, suggesting the presence of a reservoir pouring cells into the blood stream. Although it was not possible to discern where these CTCs came from, it would be interesting to explore if these cells persist in a dormant status within a niche, e.g., the bone marrow [1,27]. Accordingly, CTCs were shown to be present in the peripheral blood of patients with non-Tetastatic BC even after two to five years after surgery, as reported by Trapp et al. and Sparano et al. [28,29]. Moreover, the meta-analysis published by the Early Breast Cancer Trialists’ Collaborative Group (EBCTCG) highlighted that relapse may occur at a constant rate from five to 20 years, also in patients with small tumors (T1) and with negative axillary lymph nodes (N0) [30,31]. These recent data, in addition to our results, may suggest that late recurrence is due to micrometastases that spread CTCs genomically similar to the primary tumor. Hence, the detection and, in particular, molecular characterization of CTCs in early-stage BC may contribute to the decision-making of clinicians in the selection of patients to strictly follow up and to evaluate for secondary adjuvant treatments [32].
Consistent with this, we found out that several aberrations were commonly present in primary tumor tissue and CTCs from time C, suggesting the presence of regions potentially associated with their persistence. It would be interesting to understand if these CNAs could act as a marker or cause of tumor cell persistence. Remarkably, some regions have been reported to be typically present in BC. For instance, gains in 1q have been characterized in BC as being complex and discontinuous alterations, with the major part of the amplifications involving the regions 1q21–q22, 1q23–q24, 1q32 and 1q42–q44 [23,24]. Furthermore, among the recurrent gains in CTCs of BC patients, Kanwar et al. reported the amplification of two regions in 1q21-23 (154′963’903-155’224’815; 155’247’948-156’217’829) with tumorigenic functions associated with various mechanisms, including invasion and metastasis [27]. Importantly, the 1q21-23 region is nearly comparable to the gain we observed in the cancer tissue and CTCs of Patient 4 involving regions 1q23.1, 1q23.2 and 1q23.3. At the same time, another aberration, observed to be recurrent in the CTCs and matched tumor tissue of Patient P04, overlaps the region 5p15.33. This region, which harbors the telomerase reverse transcriptase (TERT) gene, was described as a chromosomal gain and found to be associated with a negative outcome in BC [21]. TERT is involved in avoiding telomere loss, hence preventing apoptosis and senescence of malignant cells, and it has been associated with a higher risk of disease recurrence or death in BC patients [33]. Thus, alterations in these regions may be involved in and may contribute to the persistence of CTCs, maintaining a tumor-associated CNA. Notably, these aberrations are patient-specific, as we did not observe any recurrent tumor-associated-CNA at the interpatient level. These data suggest the presence of a multitude of pathways behind molecular mechanisms associated with CTC persistence, confirming the heterogeneity of this cell population.
Despite this study being conducted on a limited case series, our findings highlight the contribution of CTCs’ CNAs in the elucidation of molecular mechanisms of CTC biology, focusing on their ability to survive in an occult reservoir.
Although we observed a great CNA heterogeneity, enrichment analyses revealed that type I interferon (IFN)-associated genes were thoroughly altered in CTCs, suggesting an involvement of their pathway in tumor spreading and metastatic cascade. IFN has been shown to have an elusive role. Indeed, although a major activation of the IFN pathway was reported to have an apoptosis- and senescence-promoting capability, this actor was shown to also be implied in migratory and therapy-resistance abilities in primary inflammatory BC [34,35,36]. Hence, it might be of interest to deepen whether IFN-associated genes are involved in mechanisms of CTC survival.

4. Materials and Methods

4.1. Patients

Eleven patients diagnosed with early-stage BC were enrolled between 2013 and 2014. The clinical-pathological characteristics are listed in Table S3. Peripheral whole blood was collected at three time points: one day before surgery (A), one month after surgery (B) and after adjuvant therapy/six months after surgery (C). None of the patients underwent neoadjuvant therapy or had detectable metastasis at diagnosis. Patients’ follow-up was conducted following the international guidelines, which recommend mammography and instrumental tests based on symptoms’ occurrence. Tumor tissues were formalin-fixed paraffin-embedded (FFPE), obtained from the U.O. Anatomia Patologica, G.B. Morgagni-L. Pierantoni hospital in Forlì. The FFPE specimens were available for 10 patients. All subjects gave written informed consent to the conservation and use of the samples for research purposes. The study was conducted in accordance with the Declaration of Helsinki, and the protocol was approved on 24 October 2012 by the Romagna Ethics Committee (CEROM) of Meldola (IRSTB008).

4.2. CTC Enrichment and Isolation at The Single-Cell Level From Peripheral Whole Blood

CTCs were enriched from approximately 20 mL of whole blood by using OncoQuick (Greiner Bio-One GmbH, Frickenhausen, Germany), following the manufacturer’s instructions. Enriched CTCs were then fixed with 4% paraformaldehyde and incubated with anti-EpCAM and anti-pan-cytokeratin (CK) antibodies (CTC markers), anti-CD45 (leukocyte marker) and 4′,6-diamidino-2-phenylindole (DAPI) for nucleus staining. Samples were resuspended and loaded with SB115 manipulation buffer (Menarini Silicon Biosystems, Castel Maggiore, Italy) into A300K cartridges, and the analyses and isolation were carried out with DEPArray v1 (Menarini Silicon Biosystems). CTCs (DAPI+/EpCAM+/CK+/CD45) and control lymphocytes (DAPI+/CD45+) were collected as pure single cells in 0.2 µL tubes. Following a phosphate-buffered saline (PBS) wash and volume reduction, single cells were subjected to whole genome amplification (WGA) by using the Ampli1™ WGA Kit (Menarini Silicon Biosystems), with a lysis step performed overnight in the thermal cycler and the others steps following the protocol provided by the manufacturer. The presence of amplified DNA was assessed by employing the Ampli1™ QC Kit (Menarini Silicon Biosystems). The products of PCR were then run on a 2% agarose gel and visualized using Chemidoc (BioRad, Hercules, CA, USA).

4.3. DNA Extraction From FFPE Specimens

Tumoral areas were scraped from 10 µm slides, and the AllPrep FFPE DNA/RNA kit (Qiagen, Hilden, Germany) was used, following the protocol provided by the manufacturer. For the CNA analyses, extracted DNA was subjected to WGA with the Ampli1™ WGA Kit (Menarini Silicon Biosystems) like for the single cells in order to align the downstream analyses, but avoiding the cell lysis step.

4.4. Library Preparation and Whole-Genome Low-Coverage Sequencing

The presence of CNA was investigated with a whole-genome low-coverage NGS approach by using the Ampli1™ LowPass Kit for the Ion Torrent (Menarini Silicon Biosystems) workflow described by Ferrarini et al. [37]. The size selection of the pooled libraries was performed using E-Gel™ SizeSelect™ II Agarose Gels, 2% (Invitrogen, Carlsbad, CA, USA) on E-Gel™ iBase™ and E-Gel™ Safe Imager™ (Invitrogen). The concentration and length of the pool were assessed using the Qubit™ 3.0 Fluorometer (Invitrogen) and Bioanalyzer High Sensitivity DNA Kit (Agilent Technologies, Waldbronn, Germany), respectively. The pooled libraries were loaded on an Ion 520™ Chip (Thermo Fisher Scientific, Waltham, MA, USA). Template preparation on Ion Chef and sequencing on the GeneStudio™ S5 System (Thermo Fisher Scientific) were performed, setting the run as described in the Ampli1 LowPass protocol.

4.5. Bioinformatic Analyses and Statistical Analyses

Starting from the raw data (BAM files) of the samples derived by Ion GeneStudio™ S5 runs, we developed a customized pipeline that included different steps. At first, we called CNAs using Control-FREEC [38]. Two different non-parametric tests (Mann–Whitney and Kolmogorov–Smirnov) were used on the Control-FREEC results to assess the statistical significance of each CNA call. CNAs where at least one of the two p-values was greater than 0.05 were filtered out.
We computed the Jaccard index (JI), a measure of similarity in terms of CNAs, comparing each CTC against two reference sets: a set of CNAs derived by different lymphocytes and a set of CNAs derived by 10 matched tissue samples. JI is computed as the size of the intersection of CNAs among the compared samples divided by their union:
J A , B = A B A B
where A is the set of CNAs of the CTC sample, and B is the set of CNAs of a reference sample (a lymphocyte or the matched tumor tissue). Then, we built violin plots, grouping CTCs based on two different features: timepoint and BC subtype (TNBC or non-TNBC).
For each group, we evaluated the statistical differences against the other groups using two non-parametric tests. For access time separations in which more than two CTC groups were present, we applied the Kruskal–Wallis test in order to assess the equableness of the group medians. Finally, for each group pair in each condition, we applied the Mann–Whitney U test.
We performed enrichment analyses of the CNAs observed in single CTCs to discover significantly enriched terms based on the alterations found at the level of genes included in terms listed in different databases. For each significant CNA, we extracted at least 50% of the length of all the genes located inside it. On the basis of this gene list, for each sample, we performed an enrichment analysis on Gene Ontology (GO) datasets (Biological Process, Cellular Component and Molecular Function) [39], Kyoto Encyclopedia of Genes and Genomes (KEGG) [40] and Reactome [41] using enrichR [42], and we filtered out all the terms with an adjusted p-value lower than 0.05.

5. Conclusions

Taken together, our data suggest that the presence of tumor-associated CNAs in CTCs isolated in patients six months after surgery may provide new insights into understanding the molecular mechanisms associated with persistence and disease relapse. The study of the pathways associated with IFN may unravel the processes of migration and immune-escape of CTCs. Finally, these results may pave the way for innovative patient surveillance approaches, aiming at individuating those at risk of earlier metastasis.

Supplementary Materials

The following are available online at https://www.mdpi.com/2072-6694/12/9/2490/s1, Table S1: CNAs shared between CTCs and matched tumor tissue in the whole case series, Table S2: Enrichment analyses results, Table S3: Clinical-pathological characteristics of patients enrolled in this study.

Author Contributions

Conceptualization, T.R., G.G., C.C., P.F., G.M. and R.M.; Data curation T.R. and G.G.; Formal analysis, D.A.; Methodology, T.R., G.G., C.C., E.B., P.F. and F.F.; Project administration, R.M. and F.F.; Resources, M.G., G.M., A.R. and R.M.; Supervision, F.F.; Writing—original draft, T.R. and G.G.; Writing—review & editing, T.R., G.G., D.A., C.C., E.B., P.F., G.M., R.M. and F.F. All authors have read and agreed to the published version of the manuscript.

Funding

T.R. and C.C. were supported as Fellows by the Associazione Annastaccatolisa ONLUS (Montecatini Terme, Pistoia, Italy) research scholar funds. This study was supported in part by 5X1000 funds of the Italian Ministry of Health.

Acknowledgments

The authors would like to thank the Annastaccatolisa Onlus association for the support.

Conflicts of Interest

The authors declare no conflict of interest.

References

  1. Pantel, K.; Speicher, M.R. The biology of circulating tumor cells. Oncogene 2016, 35, 1216–1224. [Google Scholar] [CrossRef] [PubMed]
  2. Fares, J.; Fares, M.Y.; Khachfe, H.H.; Salhab, H.A.; Fares, Y. Molecular principles of metastasis: A hallmark of cancer revisited. Signal Transduct. Target. Ther. 2020, 5, 28. [Google Scholar] [CrossRef] [PubMed]
  3. Sarangi, S.; Mosalpuria, K.; Higgins, M.J.; Bardia, A. The Evolving Role of Circulating Tumor Cells in the Personalized Management of Breast Cancer: From Enumeration to Molecular Characterization. Curr. Breast Cancer Rep. 2014, 6, 146–153. [Google Scholar] [CrossRef] [PubMed]
  4. Mocellin, S.; Keilholz, U.; Rossi, C.R.; Nitti, D. Circulating tumor cells: The ‘leukemic phase’ of solid cancers. Trends Mol. Med. 2006, 12, 130–139. [Google Scholar] [CrossRef] [PubMed]
  5. Rossi, E.; Zamarchi, R. Single-Cell Analysis of Circulating Tumor Cells: How Far Have We Come in the -Omics Era? Front. Genet. 2019, 10. [Google Scholar] [CrossRef] [Green Version]
  6. Maltoni, R.; Fici, P.; Amadori, D.; Gallerani, G.; Cocchi, C.; Zoli, M.; Rocca, A.; Cecconetto, L.; Folli, S.; Scarpi, E.; et al. Circulating tumor cells in early breast cancer: A connection with vascular invasion. Cancer Lett. 2015, 367, 43–48. [Google Scholar] [CrossRef]
  7. Riethdorf, S.; O’Flaherty, L.; Hille, C.; Pantel, K. Clinical applications of the CellSearch platform in cancer patients. Adv. Drug Deliv. Rev. 2018, 125, 102–121. [Google Scholar] [CrossRef] [PubMed]
  8. Turashvili, G.; Brogi, E. Tumor Heterogeneity in Breast Cancer. Front. Med. 2017, 4. [Google Scholar] [CrossRef] [PubMed] [Green Version]
  9. Early Breast Cancer Trialists’ Collaborative Group (EBCTCG). Effects of chemotherapy and hormonal therapy for early breast cancer on recurrence and 15-year survival: An overview of the randomised trials. Lancet 2005, 365, 1687–1717. [Google Scholar] [CrossRef]
  10. Sestak, I.; Cuzick, J. Markers for the identification of late breast cancer recurrence. Breast Cancer Res. 2015, 17, 10. [Google Scholar] [CrossRef] [PubMed]
  11. Khatcheressian, J.L.; Hurley, P.; Bantug, E.; Esserman, L.J.; Grunfeld, E.; Halberg, F.; Hantel, A.; Henry, N.L.; Muss, H.B.; Smith, T.J.; et al. Breast Cancer Follow-up and Management after Primary Treatment: American Society of Clinical Oncology Clinical Practice Guideline Update. J. Clin. Oncol. 2013, 31, 961–965. [Google Scholar] [CrossRef] [PubMed]
  12. Franken, B.; de Groot, M.R.; Mastboom, W.J.; Vermes, I.; van der Palen, J.; Tibbe, A.G.; Terstappen, L.W. Circulating tumor cells, disease recurrence and survival in newly diagnosed breast cancer. Breast Cancer Res. 2012, 14, R133. [Google Scholar] [CrossRef] [PubMed] [Green Version]
  13. Cristofanilli, M.; Budd, G.T.; Ellis, M.J.; Stopeck, A.; Matera, J.; Miller, M.C.; Reuben, J.M.; Doyle, G.V.; Allard, W.J.; Terstappen, L.W.M.M.; et al. Circulating Tumor Cells, Disease Progression, and Survival in Metastatic Breast Cancer. N. Engl. J. Med. 2004, 351, 781–791. [Google Scholar] [CrossRef] [Green Version]
  14. Rack, B.; Schindlbeck, C.; Jückstock, J.; Andergassen, U.; Hepp, P.; Zwingers, T.; Friedl, T.W.P.; Lorenz, R.; Tesch, H.; Fasching, P.A.; et al. Circulating Tumor Cells Predict Survival in Early Average-to-High Risk Breast Cancer Patients. JNCI J. Natl. Cancer Inst. 2014, 106. [Google Scholar] [CrossRef] [PubMed]
  15. Menyailo, M.E.; Tretyakova, M.S.; Denisov, E.V. Heterogeneity of Circulating Tumor Cells in Breast Cancer: Identifying Metastatic Seeds. Int. J. Mol. Sci. 2020, 21, 1696. [Google Scholar] [CrossRef] [PubMed] [Green Version]
  16. Paoletti, C.; Cani, A.K.; Larios, J.M.; Hovelson, D.H.; Aung, K.; Darga, E.P.; Cannell, E.M.; Baratta, P.J.; Liu, C.-J.; Chu, D.; et al. Comprehensive Mutation and Copy Number Profiling in Archived Circulating Breast Cancer Tumor Cells Documents Heterogeneous Resistance Mechanisms. Cancer Res. 2018, 78, 1110–1122. [Google Scholar] [CrossRef] [Green Version]
  17. Shao, X.; Lv, N.; Liao, J.; Long, J.; Xue, R.; Ai, N.; Xu, D.; Fan, X. Copy number variation is highly correlated with differential gene expression: A pan-cancer study. BMC Med. Genet. 2019, 20, 175. [Google Scholar] [CrossRef]
  18. Riebensahm, C.; Joosse, S.A.; Mohme, M.; Hanssen, A.; Matschke, J.; Goy, Y.; Witzel, I.; Lamszus, K.; Kropidlowski, J.; Petersen, C.; et al. Clonality of circulating tumor cells in breast cancer brain metastasis patients. Breast Cancer Res. 2019, 21, 101. [Google Scholar] [CrossRef] [Green Version]
  19. Kanwar, N.; Hu, P.; Bedard, P.; Clemons, M.; McCready, D.; Done, S.J. Identification of genomic signatures in circulating tumor cells from breast cancer. Int. J. Cancer 2015, 137, 332–344. [Google Scholar] [CrossRef]
  20. Hieronymus, H.; Murali, R.; Tin, A.; Yadav, K.; Abida, W.; Moller, H.; Berney, D.; Scher, H.; Carver, B.; Scardino, P.; et al. Tumor copy number alteration burden is a pan-cancer prognostic factor associated with recurrence and death. Elife 2018, 7, e37294. [Google Scholar] [CrossRef]
  21. Hwang, K.T.; Han, W.; Cho, J.; Jong, W.L.; Ko, E.; Eun, K.K.; Jung, S.Y.; Jeong, E.M.; Bae, J.Y.; Kang, J.J.; et al. Genomic copy number alterations as predictive markers of systemic recurrence in breast cancer. Int. J. Cancer 2008, 123, 1807–1815. [Google Scholar] [CrossRef] [PubMed]
  22. Goh, J.Y.; Feng, M.; Wang, W.; Oguz, G.; Yatim, S.M.J.M.; Lee, P.L.; Bao, Y.; Lim, T.H.; Wang, P.; Tam, W.L.; et al. Chromosome 1q21.3 amplification is a trackable biomarker and actionable target for breast cancer recurrence. Nat. Med. 2017, 23, 1319–1330. [Google Scholar] [CrossRef] [PubMed]
  23. Milioli, H.H.; Tishchenko, I.; Riveros, C.; Berretta, R.; Moscato, P. Basal-like breast cancer: Molecular profiles, clinical features and survival outcomes. BMC Med. Genom. 2017, 10, 19. [Google Scholar] [CrossRef] [PubMed] [Green Version]
  24. Orsetti, B.; Nugoli, M.; Cervera, N.; Lasorsa, L.; Chuchana, P.; Rougé, C.; Ursule, L.; Nguyen, C.; Bibeau, F.; Rodriguez, C.; et al. Genetic profiling of chromosome 1 in breast cancer: Mapping of regions of gains and losses and identification of candidate genes on 1q. Br. J. Cancer 2006, 95, 1439–1447. [Google Scholar] [CrossRef]
  25. Thompson, P.A.; Brewster, A.M.; Kim-Anh, D.; Baladandayuthapani, V.; Broom, B.M.; Edgerton, M.E.; Hahn, K.M.; Murray, J.L.; Sahin, A.; Tsavachidis, S.; et al. Selective genomic copy number imbalances and probability of recurrence in early-stage breast cancer. PLoS ONE 2011, 6, e23543. [Google Scholar] [CrossRef]
  26. Munro, A.F.; Twelves, C.; Thomas, J.S.; Cameron, D.A.; Bartlett, J.M.S. Chromosome instability and benefit from adjuvant anthracyclines in breast cancer. Br. J. Cancer 2012, 107, 71–74. [Google Scholar] [CrossRef] [Green Version]
  27. Wikman, H.; Vessella, R.; Pantel, K. Cancer micrometastasis and tumour dormancy. APMIS 2008, 116, 754–770. [Google Scholar] [CrossRef]
  28. Trapp, E.; Janni, W.; Schindlbeck, C.; Jückstock, J.; Andergassen, U.; de Gregorio, A.; Alunni-Fabbroni, M.; Tzschaschel, M.; Polasik, A.; Koch, J.G.; et al. Presence of Circulating Tumor Cells in High-Risk Early Breast Cancer During Follow-Up and Prognosis. J. Natl. Cancer Inst. 2019, 111, 380–387. [Google Scholar] [CrossRef]
  29. Sparano, J.; O’Neill, A.; Alpaugh, K.; Wolff, A.C.; Northfelt, D.W.; Dang, C.T.; Sledge, G.W.; Miller, K.D. Association of Circulating Tumor Cells With Late Recurrence of Estrogen Receptor–Positive Breast Cancer. JAMA Oncol. 2018, 4, 1700. [Google Scholar] [CrossRef]
  30. Pan, H.; Gray, R.; Braybrooke, J.; Davies, C.; Taylor, C.; McGale, P.; Peto, R.; Pritchard, K.I.; Bergh, J.; Dowsett, M.; et al. 20-Year Risks of Breast-Cancer Recurrence after Stopping Endocrine Therapy at 5 Years. N. Engl. J. Med. 2017, 377, 1836–1846. [Google Scholar] [CrossRef] [Green Version]
  31. Burstein, H.J.; Curigliano, G.; Loibl, S.; Dubsky, P.; Gnant, M.; Poortmans, P.; Colleoni, M.; Denkert, C.; Piccart-Gebhart, M.; Regan, M.; et al. Estimating the benefits of therapy for early-stage breast cancer: The St. Gallen International Consensus Guidelines for the primary therapy of early breast cancer 2019. Ann. Oncol. 2019, 30, 1541–1557. [Google Scholar] [CrossRef] [PubMed] [Green Version]
  32. Ignatiadis, M.; Reinholz, M. Minimal residual disease and circulating tumor cells in breast cancer. Breast Cancer Res. 2011, 13, 222. [Google Scholar] [CrossRef] [PubMed]
  33. Gay-Bellile, M.; Véronèse, L.; Combes, P.; Eymard-Pierre, E.; Kwiatkowski, F.; Dauplat, M.-M.; Cayre, A.; Privat, M.; Abrial, C.; Bignon, Y.-J.; et al. TERT promoter status and gene copy number gains: Effect on TERT expression and association with prognosis in breast cancer. Oncotarget 2017, 8, 77540–77551. [Google Scholar] [CrossRef] [PubMed]
  34. Provance, O.K.; Lewis-wambi, J. Deciphering the role of interferon alpha signaling and microenvironment crosstalk in inflammatory breast cancer. Breast Cancer Res. 2019, 1, 1–10. [Google Scholar] [CrossRef] [PubMed] [Green Version]
  35. Medrano, R.F.V.; Hunger, A.; Mendonça, S.A.; Barbuto, J.A.M.; Strauss, B.E. Immunomodulatory and antitumor effects of type I interferons and their application in cancer therapy. Oncotarget 2017, 8, 71249–71284. [Google Scholar] [CrossRef] [PubMed] [Green Version]
  36. Leplina, O.Y.; Tyrinova, T.V.; Tikhonova, M.A.; Ostanin, A.A.; Chernykh, E.R. Interferon alpha induces generation of semi-mature dendritic cells with high pro-inflammatory and cytotoxic potential. Cytokine 2015, 71, 1–7. [Google Scholar] [CrossRef] [PubMed]
  37. Ferrarini, A.; Forcato, C.; Buson, G.; Tononi, P.; del Monaco, V.; Terracciano, M.; Bolognesi, C.; Fontana, F.; Medoro, G.; Neves, R.; et al. A streamlined workflow for single-cells genome-wide copy-number profiling by low-pass sequencing of LM-PCR whole-genome amplification products. PLoS ONE 2018, 13, e0193689. [Google Scholar] [CrossRef]
  38. Boeva, V.; Popova, T.; Bleakley, K.; Chiche, P.; Cappo, J.; Schleiermacher, G.; Janoueix-Lerosey, I.; Delattre, O.; Barillot, E. Control-FREEC: A tool for assessing copy number and allelic content using next-generation sequencing data. Bioinformatics 2012, 28, 423–425. [Google Scholar] [CrossRef]
  39. Ashburner, M.; Ball, C.A.; Blake, J.A.; Botstein, D.; Butler, H.; Cherry, J.M.; Davis, A.P.; Dolinski, K.; Dwight, S.S.; Eppig, J.T.; et al. Gene Ontology: Tool for the unification of biology. Nat. Genet. 2000, 25, 25–29. [Google Scholar] [CrossRef] [Green Version]
  40. Kanehisa, M.; Goto, S. KEGG: Kyoto encyclopedia of genes and genomes—Release 72.1, 1 December 2014. Nucleic Acids Res. 2000, 28, 27–30. [Google Scholar] [CrossRef]
  41. Jassal, B.; Matthews, L.; Viteri, G.; Gong, C.; Lorente, P.; Fabregat, A.; Sidiropoulos, K.; Cook, J.; Gillespie, M.; Haw, R.; et al. The reactome pathway knowledgebase. Nucleic Acids Res. 2018, 46, D649–D655. [Google Scholar] [CrossRef] [PubMed]
  42. Kuleshov, M.V.; Jones, M.R.; Rouillard, A.D.; Fernandez, N.F.; Duan, Q.; Wang, Z.; Koplev, S.; Jenkins, S.L.; Jagodnik, K.M.; Lachmann, A.; et al. Enrichr: A comprehensive gene set enrichment analysis web server 2016 update. Nucleic Acids Res. 2016, 44, W90–W97. [Google Scholar] [CrossRef] [PubMed] [Green Version]
Figure 1. Violin plots showing the distribution of the Jaccard Indexes (JIs) computed by comparing the copy number alteration (CNA) profile of single circulating tumor cells (CTCs) and controls in non-triple negative breast cancer (TNBC) against TNBC.
Cancers 12 02490 g001
Figure 2. Violin plots showing the distribution of the Jaccard Indexes (JIs) computed by comparing the copy number alteration (can) profile of single circulating tumor cells (CTCs) and matched tumor tissue in non-triple negative breast cancer (TNBC) against TNBC.
Cancers 12 02490 g002
Figure 3. Violin plots showing the distribution of the Jaccard Indexes (JIs) computed by comparing the copy number alteration (can) profile of single circulating tumor cells (CTCs) and control at the access times (A) (n = 24), (B) (n = 13) and (C) (n = 12).
Cancers 12 02490 g003
Figure 4. Violin plots showing the distribution of the Jaccard Indexes (JIs) computed by comparing the copy number alteration (CNA) profile of single circulating tumor cells (CTCs) and matched tumor tissue at the access times (A) (n = 24), (B) (n = 13) and (C) (n = 12).
Cancers 12 02490 g004
Table 1. Number of CTCs isolated for each patient at each access time A, B and C.
Patient CodeBC SubtypeAccess TimeTotal
ABC
1TNBC6006
2TNBC1214
3TNBC0134
4TNBC63312
TNBC total136726
6HER2+1113
7Luminal A1113
8Luminal A2305
9Luminal A1113
10Luminal A1023
11Luminal A3003
12Luminal A2103
Non-TNBC total117523
Total 24131249
BC: breast cancer; TNBC: triple-negative BC; HER2: H uman Epidermal Growth Factor Receptor 2.
Table 2. List of the altered regions in tumor tissue and in at least two CTCs of the same patient isolated at all access times.
Chromosome:Start–End (bp)Region/sCTC ID Timepoint ACTC ID Timepoint B CTC ID Timepoint C Reference
Patient P02
16:81368788–8240313716q23.3P02A__2P02B_1P02C_1, P02C_2
21:40355250–4344265821q22.2, 21q22.3-P02B_1P02C_1[21]
Patient 04
1:33248192–589292801p35.1, 1p34.3, 1p34.2, 1p34.1, 1p33, 1p32.3, 1p32.2P04A_5-P04C_3
1:156891657–1622396741q23.1, 1q23.2, 1q23.3P04A_2, P04A_5P04B_2P04C_1, P04C_3[19,22,23,24]
1:162239674–1671639921q23.3, 1q24.1-P04B_1P04C_1[19,22,23,24]
1:231729524–2346121961q42.2--P04C_1, P04C_3[22,23,24]
2:36278338–546937382p22.2, 2p22.1, 2p21, 2p16.3, 2p16.2P04A_6-P04C_1, P04C_3
3:72930104–742140623p13--P04C_1, P04C_3
5:0–20256945p15.33P04A_7, P04A_9-P04C_3[21,25]
6:19336170–211777106p22.3--P04C_1, P04C_3
7:36023910–366466467p14.204C458_7-P04C_3
7:151606990–1567150547q36.1, 7q36.2, 7q36.3-P04B_2P04C_1
8:92927068–942868488q21.2P04A_8-P04C_1, P04C_3
8:121094607–1235673348q24.12, 8q24.13P04A_9-P04C_3
9:109019168–1097556819q31.204A459_9-P04C_1
10:124680720–12927610810q26.13P04A_6-P04C_3
11:17862938–2007278611p15.1P04A_2-P04C_1
11:112838832–11970010011q23.2, 11q23.3P04A_2, P04A_5 P04C_1
13:24308328–2486079013q12.12--P04C_1, P04C_3
14:75318986–7587144814q24.3P04A_9-P04C_1
14:94448360–9612838814q32.13-P04B_2P04C_1, P04C_3
15:80279738–8599991815q25.1, 15q25.2, 15q25.3P04A_2, P04A_5-P04C_3
16:84526686–8728899616q24.1 P04A_5P04B_1, P04B_2, P04B_3P04C_1
17:17494630–1952032417p11.2-P04B_3P04C_3
17:70159110–7071513617q24.3-P04B_1P04C_3
18:77160526–7807724818q23-P04B_1P04C_1, P04C_3[21]
20:42723728–4705168020q13.12, 20q13.13P04A_9P04B_3P04C_1
22:34700614–3572587622q12.3P04A_5, P04A_7, P04A_9P04B_1P04C_1
X:13627396–13995704Xp22.2 P04A_5-P04C_1, P04C_3
Patient 07
22:25992468–2599246822q12.1, 22q12.2, 22q12.3P07A__1P07B_3P07C_2
Patient 09
15:60636100–6419063015q22.2-P09B__1P09C_2
Patient 10
16:82480932–8569918516q23.3, 16q24.1P10A_1P10B__1P10C_1
Bp: base pair; CTC: circulating tumor cell; ID: identification code; q: long arm; p: short arm.
Table 3. List of the enriched terms in CTCs.
Enriched TermsTerm IDCTCsSamplesGenes
Natural killer cell activation involved in immune response GO:000232310P02A__2; P03C_1; P07A__1; P09B__2; P08A__1; P09B__3; P09B__1; P10B_1; P11A_1; P12A_2CD244; CORO1A; IFNA1; IFNA10; IFNA14; IFNA16; IFNA17; IFNA2; IFNA21; IFNA4; IFNA5; IFNA6; IFNA7; IFNA8; IFNB1; IFNE; IFNK; IFNW1; KLRF2; VAMP7
Response to dsRNA GO:00433319P01A_6; P02A_2; P07A_1; P08A_1; P09B_2; P09B_1; P10B_1; P11A_1; P12A_2 IFNA1; IFNA10; IFNA14; IFNA16; IFNA17; IFNA2; IFNA21; IFNA4; IFNA5; IFNA6; IFNA7; IFNA8; IFNB1; IFNE; IFNK; IFNW1; IRAK3; PDE12; PMAIP1; RFTN1; RIOK3; SLC3A2; TICAM1; TLR3
Regulation of peptidyl-serine phosphorylation of STAT protein GO:00331399P01A_6; P02A_2; P07A_1; P08A_1; P09B_2; P09B_1; P10B_1; P11A_1; P12A_2IFNA1; IFNA10; IFNA14; IFNA16; IFNA17; IFNA2; IFNA21; IFNA4; IFNA5; IFNA6; IFNA7; IFNA8; IFNB1; IFNE; IFNG; IFNK; IFNW1; LIF
Positive regulation of peptidyl-serine phosphorylation of STAT protein GO:00331419P01A_6; P02A_2; P07A_1; P08A_1; P09B_2; P09B_1; P10B_1; P11A_1; P12A_2IFNA1; IFNA10; IFNA14; IFNA16; IFNA17; IFNA2; IFNA21; IFNA4; IFNA5; IFNA6; IFNA7; IFNA8; IFNB1; IFNE; IFNG; IFNK; IFNW1; LIF
Lymphocyte activation involved in immune response GO:00022859P01A_6; P02A_2; P07A_1; P08A_1; P09B_2; P09B_1; P10B_1; P11A_1; P12A_2CD1C; CD244; EIF2AK4; F2RL1; IFNA1; IFNA10; IFNA14; IFNA16; IFNA17; IFNA2; IFNA21; IFNA4; IFNA5; IFNA6; IFNA7; IFNA8; IFNB1; IFNE; IFNK; IFNW1; LCP1
Natural killer cell activation GO:00301018P02A_2; P07A_1; P08A_1; P09B_2; P09B_3; P09B_1; P11A_1; P12A_2BAG6; CASP8; CD2; CD244; ELF4; HNF1A; IFNA1; IFNA10; IFNA14; IFNA16; IFNA17; IFNA2; IFNA21; IFNA4; IFNA5; IFNA6; IFNA7; IFNA8; IFNB1; IFNE; IFNK; IFNW1; IL12B; IL2; IL21R; KLRK1; NCR1; NCR3; PRDX1; SLAMF7; SNX27; ULBP1; ULBP2; ULBP3
B cell proliferation GO:00421008P01A_6; P02A_2; P07A_1; P08A_1; P09B_2; P09B_1; P11A_1; P12A_2BCL2; CD40; CD40LG; CD79A; CR2; CTPS1; GAPT; HSPD1; IFNA1; IFNA10; IFNA14; IFNA16; IFNA17; IFNA2; IFNA21; IFNA4; IFNA5; IFNA6; IFNA7; IFNA8; IFNB1; IFNE; IFNK; IFNW1; IL10; LEF1; MEF2C; MS4A1
Cytidine to uridine editing GO:00165547P01A_5; P04A9; P07A_1; P07C2; P08A_1; P09B_3; P11A_1A1CF; AICDA; APOBEC1; APOBEC2; APOBEC3A; APOBEC3B; APOBEC3C; APOBEC3D; APOBEC3F; APOBEC3G; APOBEC3H
T cell activation involved in immune response GO:00022867P01A_6; P07A_1; P08A_1; P09B_2; P09B_1; P11A_1; P12A_2CD1C; EIF2AK4; F2RL1; FCER1G; ICAM1; IFNA1; IFNA10; IFNA14; IFNA16; IFNA17; IFNA2; IFNA21; IFNA4; IFNA5; IFNA6; IFNA7; IFNA8; IFNB1; IFNE; IFNK; IFNW1; ITGAL; LCP1; LILRB1; SLC11A1; TNFSF18
Lymphocyte proliferation GO:00466517P02A_2; P07A_1; P08A_1; P09B_2; P09B_1; P11A_1; P12A_2BCL2; CD40; CD40LG; CD79A; CR2; CTPS1; ELF4; HELLS; HSPD1; IFNA1; IFNA10; IFNA14; IFNA16; IFNA17; IFNA2; IFNA21; IFNA4; IFNA5; IFNA6; IFNA7; IFNA8; IFNB1; IFNE; IFNK; IFNW1; IL10; MEF2C; MS4A1; MSN; PIK3CG; PPP3CB; TNFRSF4; TNFSF14
Response to exogenous dsRNA GO:00433307P01A_6; P07A_1; P08A_1; P09B_2; P09B_1; P11A_1; P12A_2CAV1; COLEC12; DDX58; DHX9; FLOT1; IFIH1; IFIT1; IFNA1; IFNA10; IFNA14; IFNA16; IFNA17; IFNA2; IFNA21; IFNA4; IFNA5; IFNA6; IFNA7; IFNA8; IFNB1; IFNE; IFNK; IFNW1; IRAK3; MUL1; PQBP1; RALB; RFTN1; SLC3A2; TICAM1; TLR3; TMEM173
DNA cytosine deamination GO:00703836P01A_5; P04A9; P07A_1; P07C2 P08A_1; P11A_1APOBEC3A; APOBEC3C; APOBEC3D; APOBEC3F; APOBEC3G; APOBEC3H
B cell differentiation GO:00301836P01A_6; P07A_1; P08A_1; P09B_1; P11A_1; P12A_2ADAM17; AICDA; BLNK; CD79A; CEBPG; CLCF1; DNAJB9; HDAC5; HDAC9; HHEX; IFNA1; IFNA10; IFNA14; IFNA16; IFNA17; IFNA2; IFNA21; IFNA4; IFNA5; IFNA6; IFNA7; IFNA8; IFNB1; IFNE; IFNK; IFNW1; IL11; ITGA4; JAK3; KIT; KLF6; LYL1; MSH2; NFAM1; NHEJ1; PLCG2; RAG1; RAG2; TCF3; TPD52; VCAM1
Regulation of type I interferon-mediated signaling pathway GO:00603386P07A_1; P08A_1; P09B_2; P09B_1; P11A_1; P12A_2CACTIN; CDC37; FADD; HSP90AB1; IFNA1; IFNA10; IFNA14; IFNA16; IFNA17; IFNA2; IFNA21; IFNA4; IFNA5; IFNA6; IFNA7; IFNA8; IFNAR1; IFNAR2; IFNB1; JAK1; NLRC5; PTPN1; PTPN11; PTPN6; TYK2; WNT5A; ZBP1
ID: identification code of the term; CTC: circulating tumor cell; GO: gene onthology; dsRNA: double strand RNA; STAT: Signal Transducer and Activator of Transcription.

