3.1. Morphological, Structural and Compositional Properties of Ni Nanoparticles
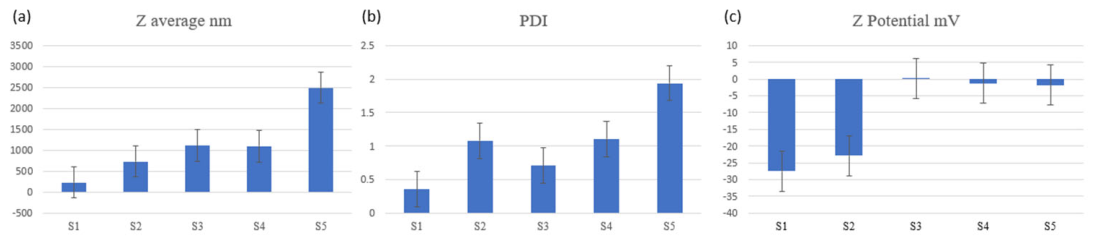
Colloidal solutions and nanoparticles are characterized using DLS (
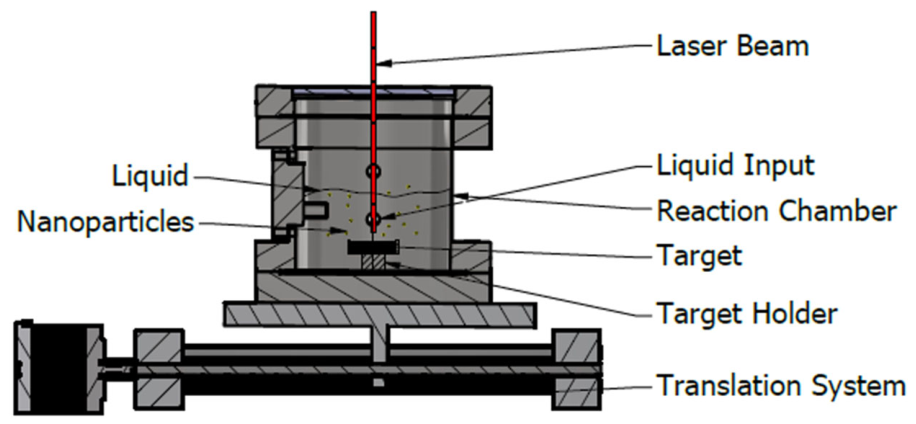
Figure 2). In this technique, a laser beam passes through the colloidal solution, and the scattered light is measured. By analyzing the fluctuations in the intensity of the scattered light over time, the particle size can be determined. The Z-average represents the average hydrodynamic diameter of the nanoparticles measured by DLS. The polydispersity index (PDI) ranges from 0 to 1, with 0 indicating a completely homogeneous population and 1 signifying a highly heterogeneous one [
30,
31,
32]. The magnitude of the zeta potential reflects particle stability, a higher absolute value indicates greater stability because of stronger electrostatic repulsion between particles [
30,
31,
32].
In the graphs presented below, you can see the values obtained through DLS characterization of the samples studied.
A significant variation in nanoparticle size is observed between samples. The S1 probe has the smallest particles (~350 nm), and S5 the largest (>2500 nm). This indicates that samples made using higher energy and lower liquid volume (670 mJ, 400 mL UPW) have a narrower size distribution than samples made using lower energy and higher liquid volume (440 mJ, 800 mL UPW).
The PDI ranges from 0.4 (S1/mL probe) to over 2.0 (S5). Values greater than 0.7 indicate a broad particle size distribution, so samples S2 and S5 are the most heterogeneous. The S1 probe has the most uniform particle population.
Only samples with S1 and S2 show significant negative zeta potential (below −20 mV), indicating increased colloidal stability. The rest of the samples have values close to zero, which may lead to rapid aggregation.
The HR-TEM techniques were employed to investigate the morphological characteristics and size distribution of the synthesized nanoparticles. Representative TEM images and the corresponding particle size distribution histograms for various samples are presented in
Table 3. The particle size distribution histogram was generated by manually measuring the diameters of 20 representative nanoparticles from the HAADF-STEM images using ImageJ software 1.54p.
The TEM images reveal notable differences in particle morphology and aggregation behavior among the analyzed samples. The sample S1 TEM image displays a relatively dense aggregation of nanoparticles with varied shapes and sizes with an average length of 7.14 nm, suggesting a heterogeneous population. The corresponding histogram supports this observation, showing a broad distribution with a standard deviation (SD) of 0.24, indicating considerable polydispersity.
Similarly, the image of probe S2 exhibits partially dispersed nanoparticles, with average size of 7.34 nm and with more spherical morphology. However, the particle size distribution remains broad (SD = 0.25), further confirming significant variation in particle dimensions.
In contrast, the samples S3 and S5 display improved dispersion and more uniform particle morphologies. The sample S3 image, for instance, shows moderately well-dispersed particles with a standard deviation of 0.22 and an average size of 7.70 nm, while the S4 sample exhibits a slightly better uniformity (SD = 0.22) with an average length of 11.30 nm. Notably, the image of probe S5 shows highly monodisperse nanoparticles with minimal aggregation. This is corroborated by the narrowest size distribution observed among all samples, with a standard deviation of only 0.15 and an average length of 4.70 nm.
The particle size distributions were plotted based on measurements of the nanoparticle lengths (in nm) obtained from multiple TEM fields, and each histogram includes a Lognormal distribution curve to highlight the spread of particle sizes. These results suggest that the synthesis conditions used for the bottom-right sample were optimal in producing uniform, well-dispersed nanoparticles with reduced polydispersity.
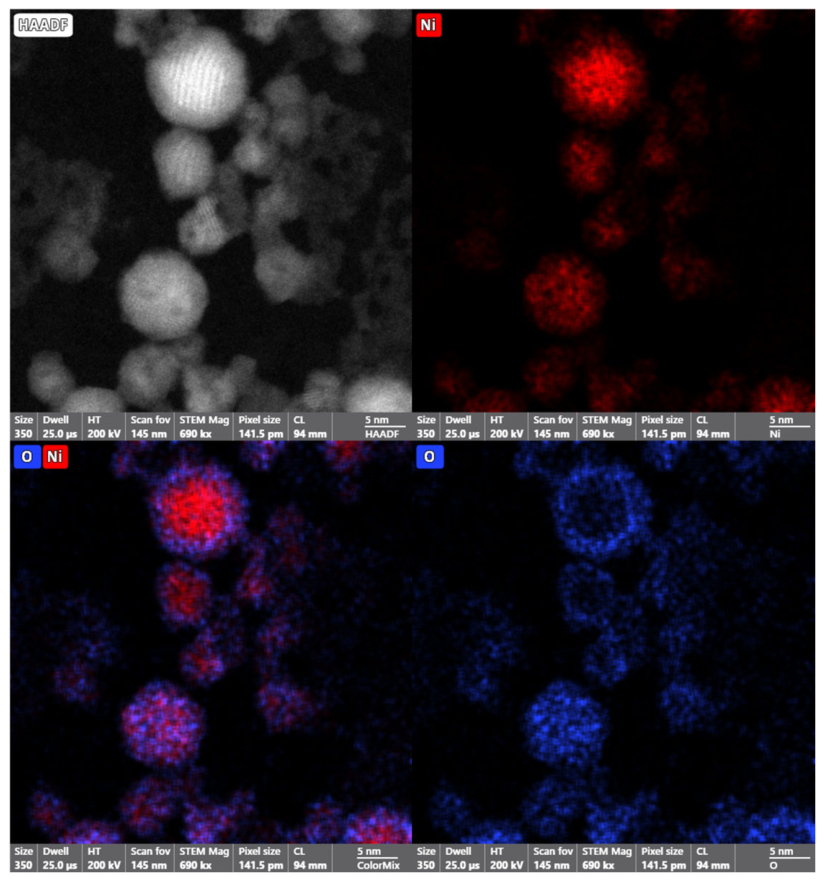
High-resolution TEM analysis confirms that the sample consists of nickel-based nanoparticles exhibiting a core–shell morphology. The HAADF imaging reveals well-defined spherical particles with strong contrast. Elemental mapping shows a distinct distribution: nickel (Ni) is predominantly localized in the cores of the particles, while oxygen (O) is concentrated at or near the particle surfaces. This spatial arrangement suggests the formation of a nickel oxide (NiO) shell surrounding a metallic nickel core. The observed structure likely results from surface oxidation of the nanoparticles and may offer advantageous properties for applications in catalysis, energy storage, and related nanomaterial technologies.
In
Figure 3, the STEM image, together with the corresponding EDS elemental maps, confirm the presence of both Ni and O within the synthesized nanoparticles. The simultaneous detection of oxygen suggests partial surface oxidation of the nanoparticles, resulting in Ni-based nanoparticles with a thin NiO surface layer. Such partial oxidation is commonly reported for Ni nanoparticles synthesized by pulsed laser ablation in water due to their high surface reactivity and exposure to dissolved oxygen immediately after synthesis [
31,
33].
Calculated interplanar spacing and lattice constants are shown in
Table 4. The d-spacing and lattice constants were very close to values obtained by [
34].
In
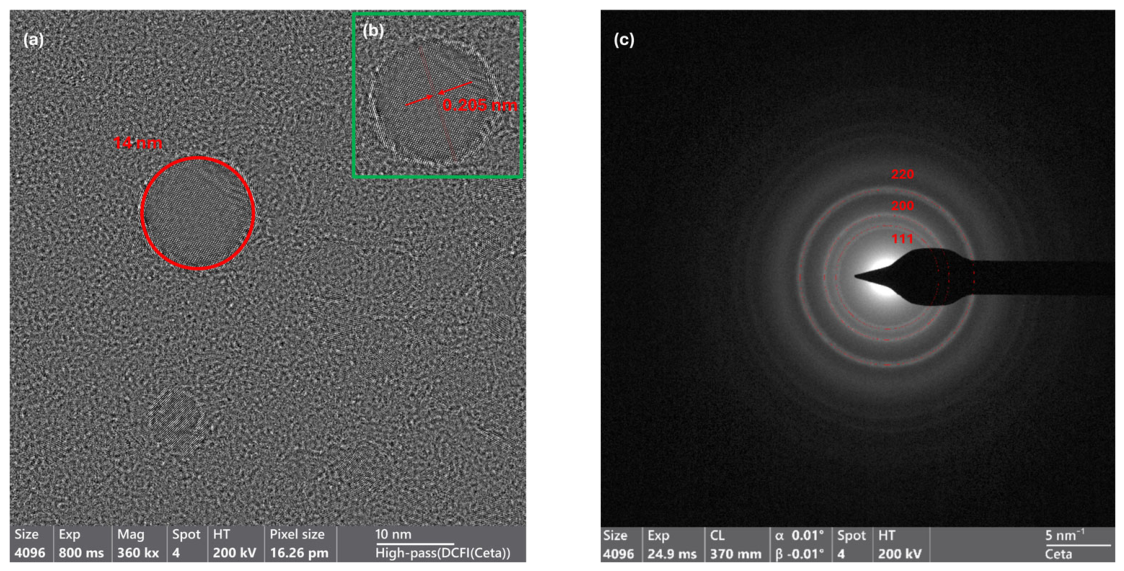
Figure 4, the high-resolution transmission electron microscopy (HRTEM) analysis is presented to study the structural and crystallographic properties of synthesized Ni-based nanoparticles.
Figure 4a is a high-resolution TEM image showing a nearly spherical nanoparticle. The red circle highlights a single nanoparticle with a measured area of 187.723 nm
2 and a diameter of approximately 15.5 nm, indicating relatively large nanoparticle size for high-resolution imaging. The lattice fringes visible suggest good crystallinity.
Figure 4b shows the measured interplanar spacing of 0.205 nm, which is in good agreement with the reported value of approximately 0.209 nm for the (200) plane of face-centered cubic (FCC) NiO, indicating the presence of surface-oxidized Ni-based nanoparticles [
34].
In
Figure 4c, the diffraction rings are clearly indexed as (111), (200), and (220), which match the standard FCC structure of nickel oxide [
34].
3.2. Thermal Conductivity and Dynamic Viscosity of Ni Nanoparticles-Based Nanofluids
This study investigates the thermal properties (thermal conductivity and viscosity) of base fluid and nanofluids using advanced measurement techniques. For the evaluation of thermal properties of the Ni samples, several measurements were performed at various temperatures to evaluate the effects of temperature on both thermal conductivity and viscosity. The arithmetic mean of these measurements was calculated and used for analysis to ensure reliability and consistency in the results.
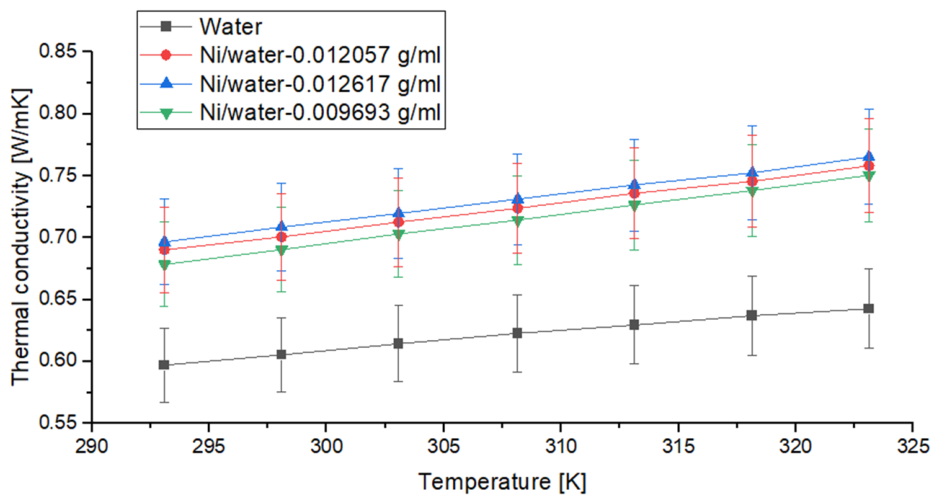
Figure 5 illustrates the variation in thermal conductivity with temperature for water and nickel (Ni) nanoparticle-based nanofluids at different concentrations (of S1, S3, and S3). As temperature increases, the thermal conductivity of all samples follows an upward trend, indicating improved thermal conductivity at higher temperatures.
The base fluid exhibits the lowest thermal conductivity across the examined temperature range. In contrast, the Ni/water nanofluids show an improvement in thermal conductivity. Furthermore, the results indicate a positive correlation between nanoparticle concentration and thermal conductivity, the higher concentrations yielding superior thermal performance. The most significant enhancement is observed in the Ni/water nanofluid with the highest concentration (S1), which consistently outperforms the lower concentrations and pure water. This behavior can be attributed to the enhanced thermal transport mechanisms facilitated by suspended nanoparticles, including increased Brownian motion and improved thermal interactions within the fluid matrix. Also, this trend highlights the potential of Ni/water nanofluids as an effective medium for improving thermal performance in heat transfer applications.
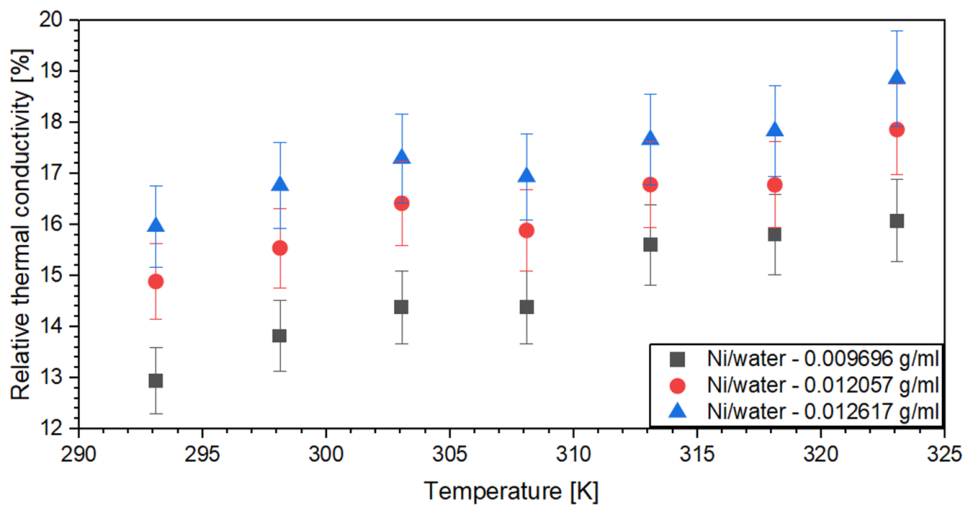
Figure 6 presents the relative thermal conductivity, defined as:
where k
nf represents thermal conductivity of the fluid with nanoparticles and k
bf represents the thermal conductivity of the base fluid. The calculated value represents the percentage enhancement in thermal conductivity of the nanoparticles suspension relative to the base fluid.
With temperature for Ni/water nanofluids at different nickel nanoparticle concentrations, the results demonstrate a clear trend in which the relative thermal conductivity increases with rising temperature, indicating an improvement in the heat transfer capability of the nanofluid.
Among the tested concentrations, the nanofluid with the highest Ni content (S1) exhibits the most significant enhancement in thermal conductivity. This is followed by the nanofluid containing S3, while the lowest concentration (S2) results in the least improvement. At lower temperatures (293 K), the relative thermal conductivity enhancement ranges from approximately 12% to 16%, depending on the nanoparticle concentration. As the temperature increases (323 K), the enhancement further rises, reaching values between 15% and 19%. This trend indicates that the effectiveness of Ni nanoparticles in augmenting thermal conductivity becomes more pronounced at elevated temperatures, which may be attributed to increased nanoparticle mobility and enhanced heat transfer mechanisms.
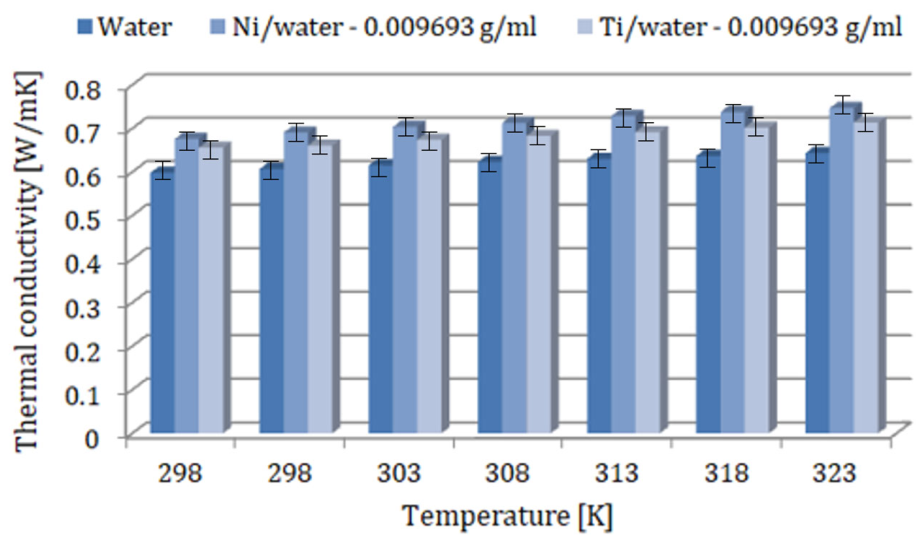
Only for comparison purposes, Ti nanoparticles were also prepared in the same PLAL conditions as the Ni nanoparticles and were tested for their thermal properties. The thermal conductivity for varying temperatures of pure water, nickel-based nanofluid (Ni/water), and titanium-based nanofluid (Ti/water), each at a concentration of S3, is depicted in
Figure 7. The results reveal a clear trend where the thermal conductivity of all three fluids increases with temperature, suggesting an improvement in thermal conductivity at higher temperatures.
Moreover, both nanofluids demonstrate improved thermal conductivity compared to pure water, but Ni/water consistently exhibits higher thermal conductivity than Ti/water at every temperature. As temperature increases from 298 K to 323 K, the thermal conductivity of both nanofluids rises, indicating that their heat transfer efficiency improves with temperature. However, the Ni/water nanofluid exhibited a higher thermal conductivity than the TiO
2/water nanofluid throughout the investigated temperature range. Compared with pure water, the thermal conductivity enhancement was approximately 15–18% for the Ni/water nanofluid, whereas the TiO
2/water nanofluid showed an enhancement of approximately 10–13%, suggesting that nickel nanoparticles contribute more effectively to thermal enhancement at the same concentration. Several factors could explain this performance difference. Ni nanoparticles have a higher intrinsic thermal conductivity than Ti nanoparticles, allowing for more efficient heat transfer within the fluid. Additionally, Ni nanoparticles may disperse more effectively in water, promoting better particle–fluid interactions and enhancing heat transfer mechanisms such as nano-convection of fluid around the particles due to their motion [
16,
35]. This improved dispersion likely contributes to the greater thermal conductivity observed in Ni-based nanofluid compared to Ti-based nanofluid.
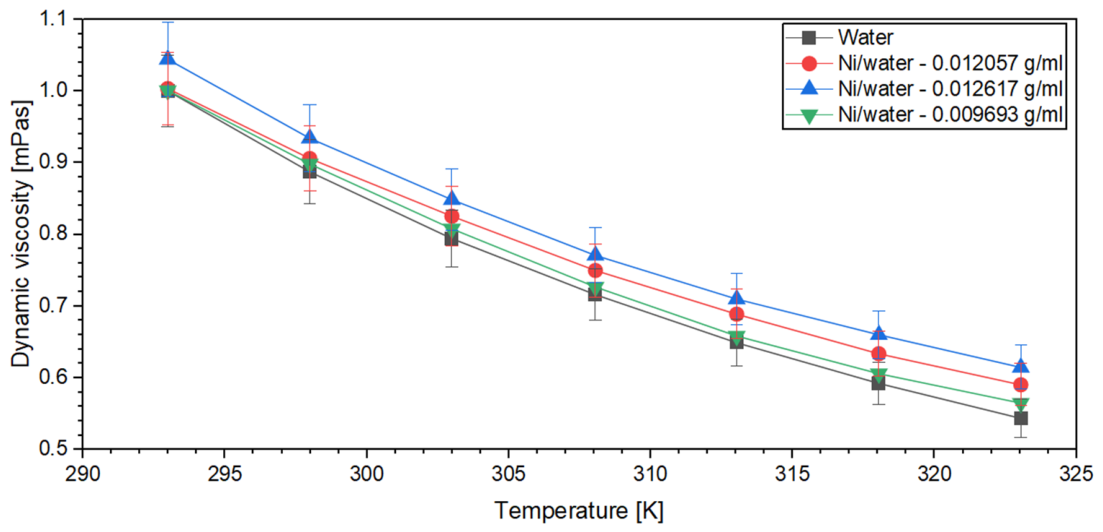
Figure 8 illustrates the variation in dynamic viscosity as a function of temperature for both water and nickel (Ni) nanoparticle-based nanofluids at different concentrations. The viscosity measurements show that the Ni/water nanofluid exhibited an increase in viscosity compared to the base fluid (pure water). This increase in viscosity became more pronounced with higher nanoparticle concentrations, indicating that the addition of nanoparticles introduces resistance to flow. The increase in viscosity is likely due to the interaction between the nanoparticles and the base fluid molecules, which may lead to the formation of nanoparticle clusters or a more complex network structure within the fluid [
36,
37]. Interestingly, the viscosity did not exhibit a strictly proportional increase with nanoparticle concentration under the investigated conditions, which may be associated with nanoparticle–fluid interactions. This non-linear behavior could be attributed to factors such as nanoparticle agglomeration [
36], changes in the microstructure of the nanofluid, or alterations in the rheological behavior at higher concentrations. As observed in
Figure 8, viscosity decreases with increasing temperature, which is consistent with the general behavior of most fluids. The thermal energy from the rising temperature reduces the internal friction between the fluid molecules, allowing them to flow more easily [
38].
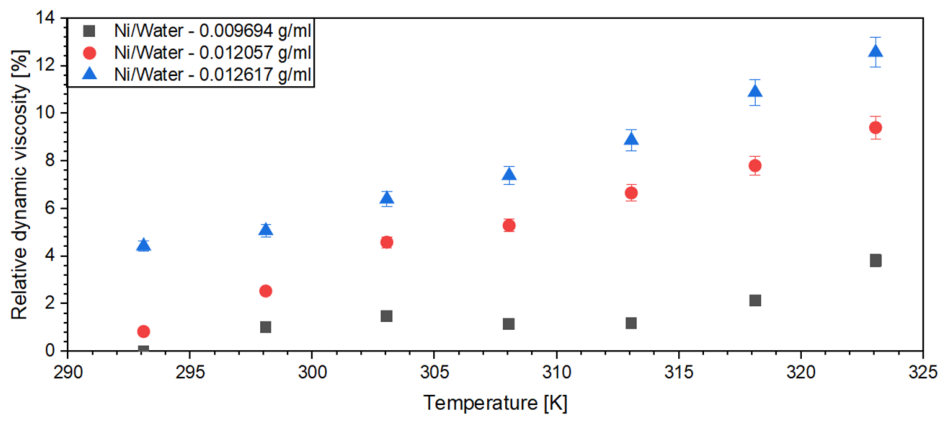
Figure 9 presents the relative dynamic viscosity, defined as:
where
μnf is the dynamic viscosity of the nanofluid and
μbf is the dynamic viscosity of the base fluid. The calculated value represents the percentage change in the dynamic viscosity of the nanofluid relative to the base fluid.
As a function of temperature for Ni/water nanofluids at different nanoparticle concentrations, the results demonstrate a clear trend in which the relative dynamic viscosity increases with both rising temperature and nanoparticle concentration. Among the tested concentrations, the nanofluid with the highest Ni content (S1) exhibits the greatest increase in viscosity, followed by the nanofluid containing S3. The lowest concentration (S2) results in the smallest increase in viscosity. At lower temperatures (293 K), the relative dynamic viscosity increases range from approximately 0.05% to 4.48%, depending on the nanoparticle concentration. As the temperature increases (323 K), the viscosity increases more significantly, with values ranging between 3.8% and 12.6%. This temperature-dependent increase in viscosity highlights the complex interactions between the nanoparticles and the base fluid at different concentrations and temperatures.
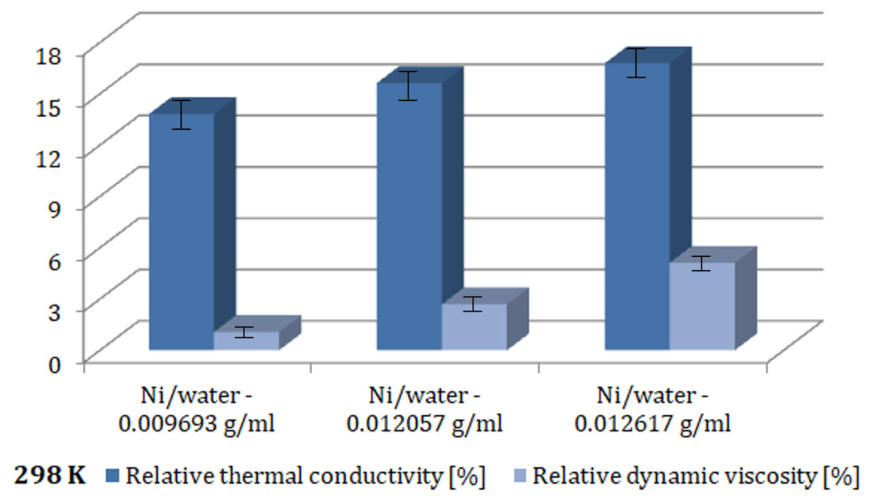
Figure 10 shows the comparative analysis of the relative increase in thermal conductivity and dynamic viscosity at a temperature of 298 K for Ni/water nanofluid at different nanoparticle concentrations. As can be seen, as nanoparticle concentration increases, both thermal conductivity and dynamic viscosity increase. At all the concentrations studied, the increase in thermal conductivity was more significant compared to the increase in dynamic viscosity. The higher increase in thermal conductivity relative to viscosity at higher nanoparticle concentrations suggests that the addition of nanoparticles is enhancing the heat transfer properties of the fluid much more than the increase in viscosity. At the highest concentration (S1), thermal conductivity increases by 16.78%, whereas dynamic viscosity increases by only 5.12%. The results presented in
Figure 10 suggest that the S3 sample offers a compromise between maximizing thermal conductivity and maintaining acceptable viscosity levels. These properties make the Ni/water nanofluid a promising candidate for advanced thermal management applications, including electronic cooling systems and automotive cooling circuits.
3.3. Photoelectrochemical Characterization of the Ni Nanoparticles
Potentiostatic PEC measurements under chopped illumination highlight the influence of Ni nanoparticle loading on the photoelectrocatalytic behavior of TiO2 thin films. The TiO2 thin films were produced by Pulsed Laser Deposition just to act as photoactive material support. The TiO2 thin films were deposited on Pt/SiO2/Si (100) substrates, with the 100 nm thick Pt film acting as bottom electrode for the three-electrode configuration PEC measurements. While both Ni-modified electrodes exhibit more negative photo potentials than bare TiO2, consistent with improved electron extraction and enhanced hydrogen-evolution kinetics, the magnitude of this improvement depends strongly on the amount of deposited Ni nanoparticles of the S5 probe on top of the TiO2 thin films.
Table 5 summarizes the samples used in PEC experiments:
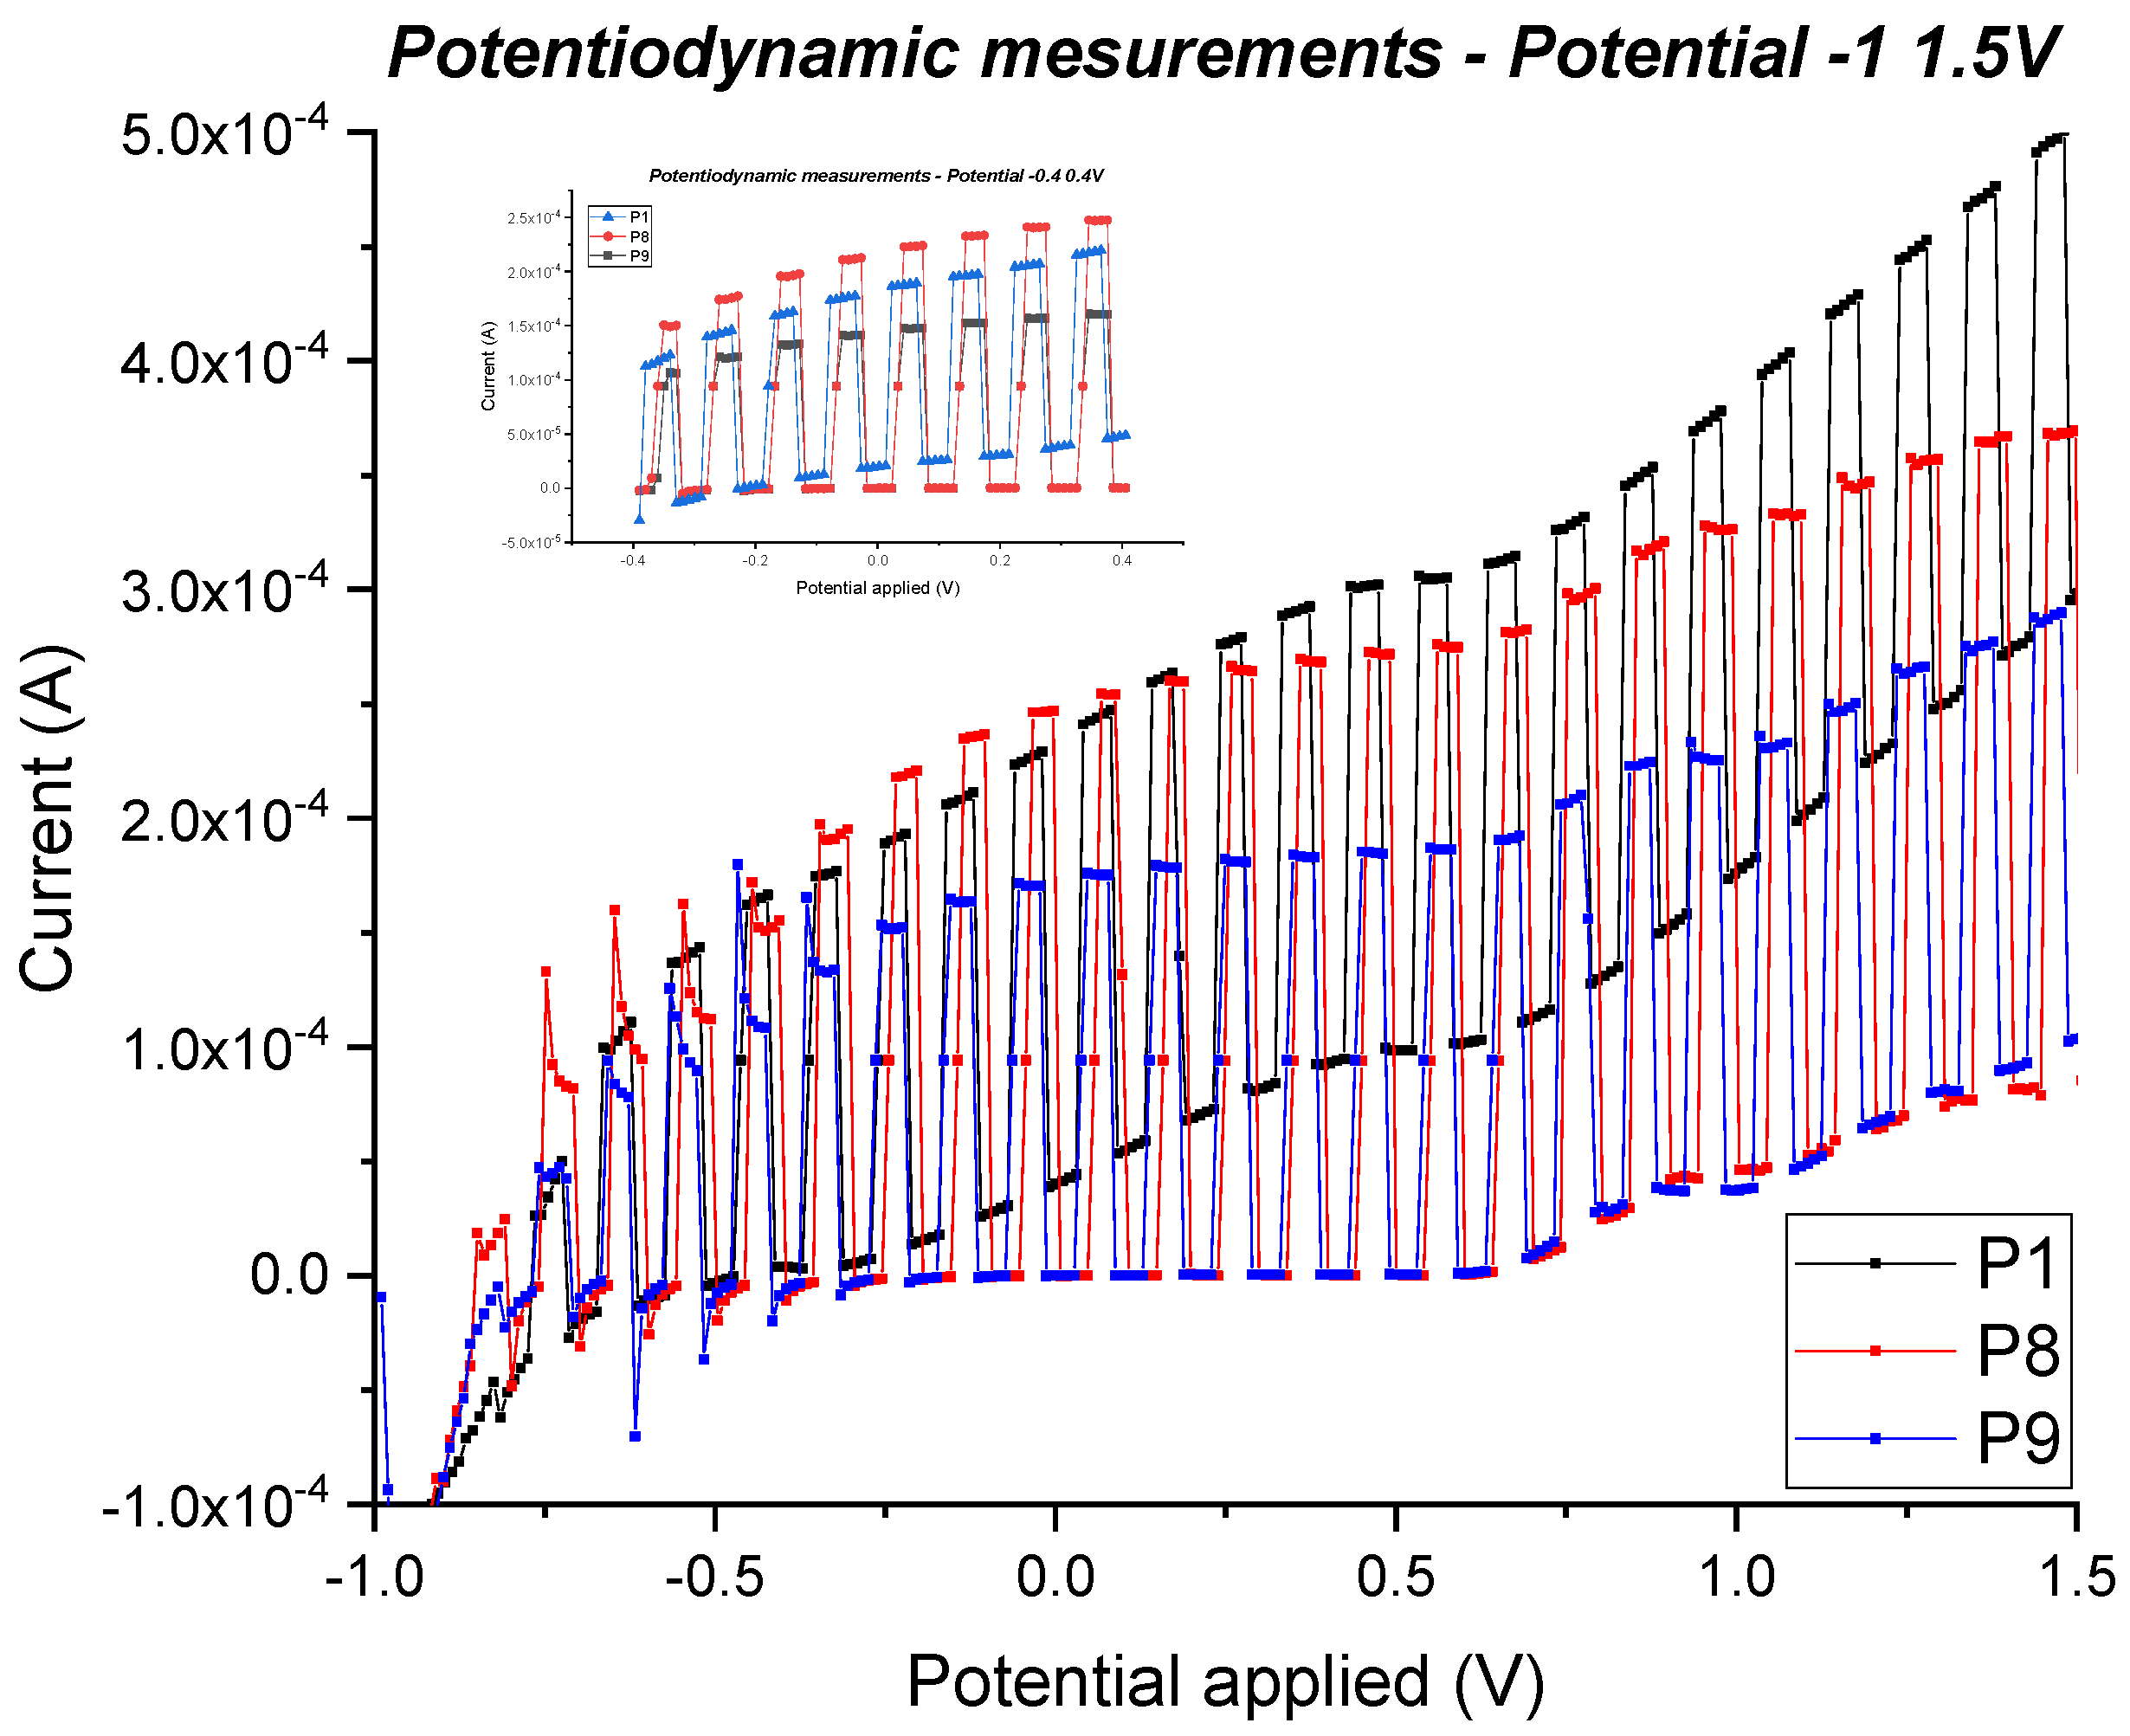
Sample P8 shows the most pronounced photo potential shift, indicating an optimal balance between catalytic site density and efficient charge transfer at the TiO2/Ni interface. In contrast, the P9 sample displays a reduced enhancement, likely due to excessive surface coverage that partially blocks light absorption or introduces additional charge-transfer resistance. This behavior suggests that Ni loading follows a non-linear trend, where moderate nanoparticle coverage maximizes catalytic performance, while overloading can suppress photocatalytic efficiency. Thus, the data reveal that controlled Ni deposition is essential for achieving the optimal synergy between TiO2 photoactivity and Ni-mediated hydrogen-generation catalysis.
Potentiodynamic and potentiostatic PEC measurements (
Figure 11 and
Figure 12) under chopped illumination were recorded in 0.5 M NaOH electrolyte solution (pH = 13.7) to evaluate the PEC response of the heterostructures.
Potentiodynamic measurements performed on the same TiO2 electrodes further confirms the Ni-loading-dependent trend observed in the potentiostatic PEC measurements. The bare TiO2 sample requires the most negative applied potentials to drive small values of photocathodic current, demonstrating intrinsically slow proton-reduction kinetics and significant charge-transfer limitations at the semiconductor–electrolyte interface.
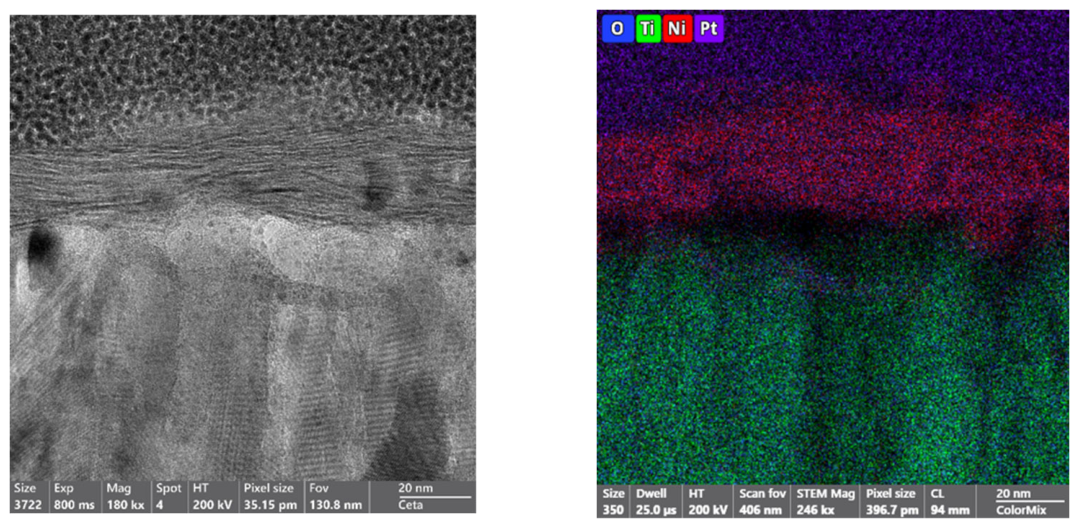
Upon deposition of Ni nanoparticles, the onset potential shifts positively and the photocurrent becomes more pronounced, indicating facilitated electron transfer and improved catalytic activity for hydrogen evolution. However, the magnitude of this enhancement again depends on the Ni loading: the coated electrode (P8 sample) precursor exhibits the most favorable response, showing both a more positive onset potential and higher photocurrent density compared to the P9 sample. The reduced improvement at higher Ni coverage suggests that excessive Ni deposition can lead to partial shielding of the TiO
2 surface or increased interfacial resistance, thereby limiting light absorption and hindering electron mobility, as can be seen from
Figure 13 of the cross-section TEM image and STEM-EDX elemental mapping images of the high-concentration Ni-loaded TiO
2 thin film surface.
To further study the PEC properties of the TiO2/Pt structures functionalized with different amounts of nickel nanoparticles, potentiostatic PEC measurements and potentiodynamic measurements were performed under chopped illumination. The results obtained from the measurements highlight the influence of the applied potential (negative or positive) on the photoanodic and photocathodic behavior of the studied samples.
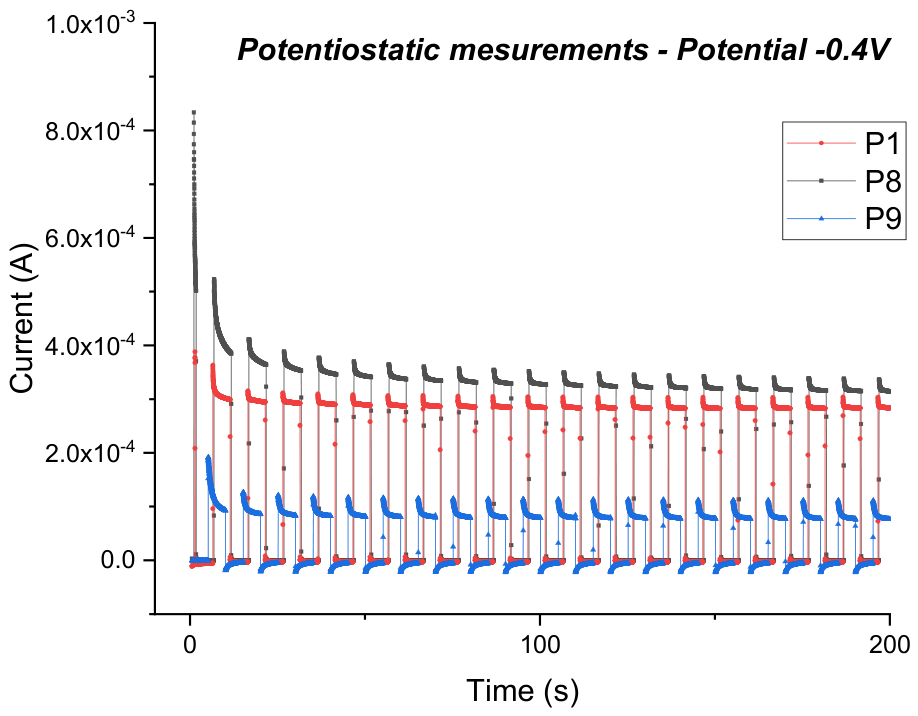
The potentiostatic PEC measurement at an applied potential of −0.4 V clearly highlights the influence of Ni nanoparticles on the photocathodic response of the TiO2/Pt structure. All the studied samples show characteristics of photoelectrochemical processes, with periodic variations in the current associated with the illumination/dark cycles, which confirms the photocatalytic activity of the studied samples.
As can be seen in the graph in
Figure 14, the reference sample (TiO
2/Pt without Ni nanoparticles) shows the highest generated current response, at negative −0.4 V applied potential. The signal shows stable pulses throughout the duration of the experiment, which denotes the electrochemical stability of the system. After the deposition of Ni nanoparticles, a modification of the recorded photoelectrocatalytic response is observed. A gradual decrease in the recorded response is observed, with samples with low amounts of nickel nanoparticles (P2–P4) having a relatively high response (~2 × 10
−4 A) compared to the reference sample P1 (3.5 × 10
−4 A). The signals of all samples remain stable throughout the experiment, however the reduction in current indicates that the Ni nanoparticles negatively influence the transport of charge carriers or the absorption of light at negative applied potential.
At higher amounts of nickel nanoparticle suspension (P6, P7), the electrophotocatalytic response decreases significantly, reaching values below 1 × 10⁻⁴ A and the recorded amplitude of the oscillations becomes visibly smaller, and the negative components of the recorded signal are more pronounced. A tendency of slow decrease in the current overtime can also be observed for all samples, a phenomenon probably associated with the polarization of the electrodes, the accumulation of reaction intermediates or the progressive recombination of charge carriers. However, the general stability of the periodic response indicates a good resistance of the system during the measurements.
The results suggest the existence of an optimal concentration of Ni nanoparticles for enhancing the photoanodic behavior of TiO2 thin film. At low concentrations, Ni can facilitate charge separation and electron transfer. From an application point of view, the results confirm that the TiO2/Pt architecture exhibits high photoanodic PEC activity, and the modification with Ni nanoparticles must be carefully optimized to avoid the degradation of the PEC performance at negative potential.
In
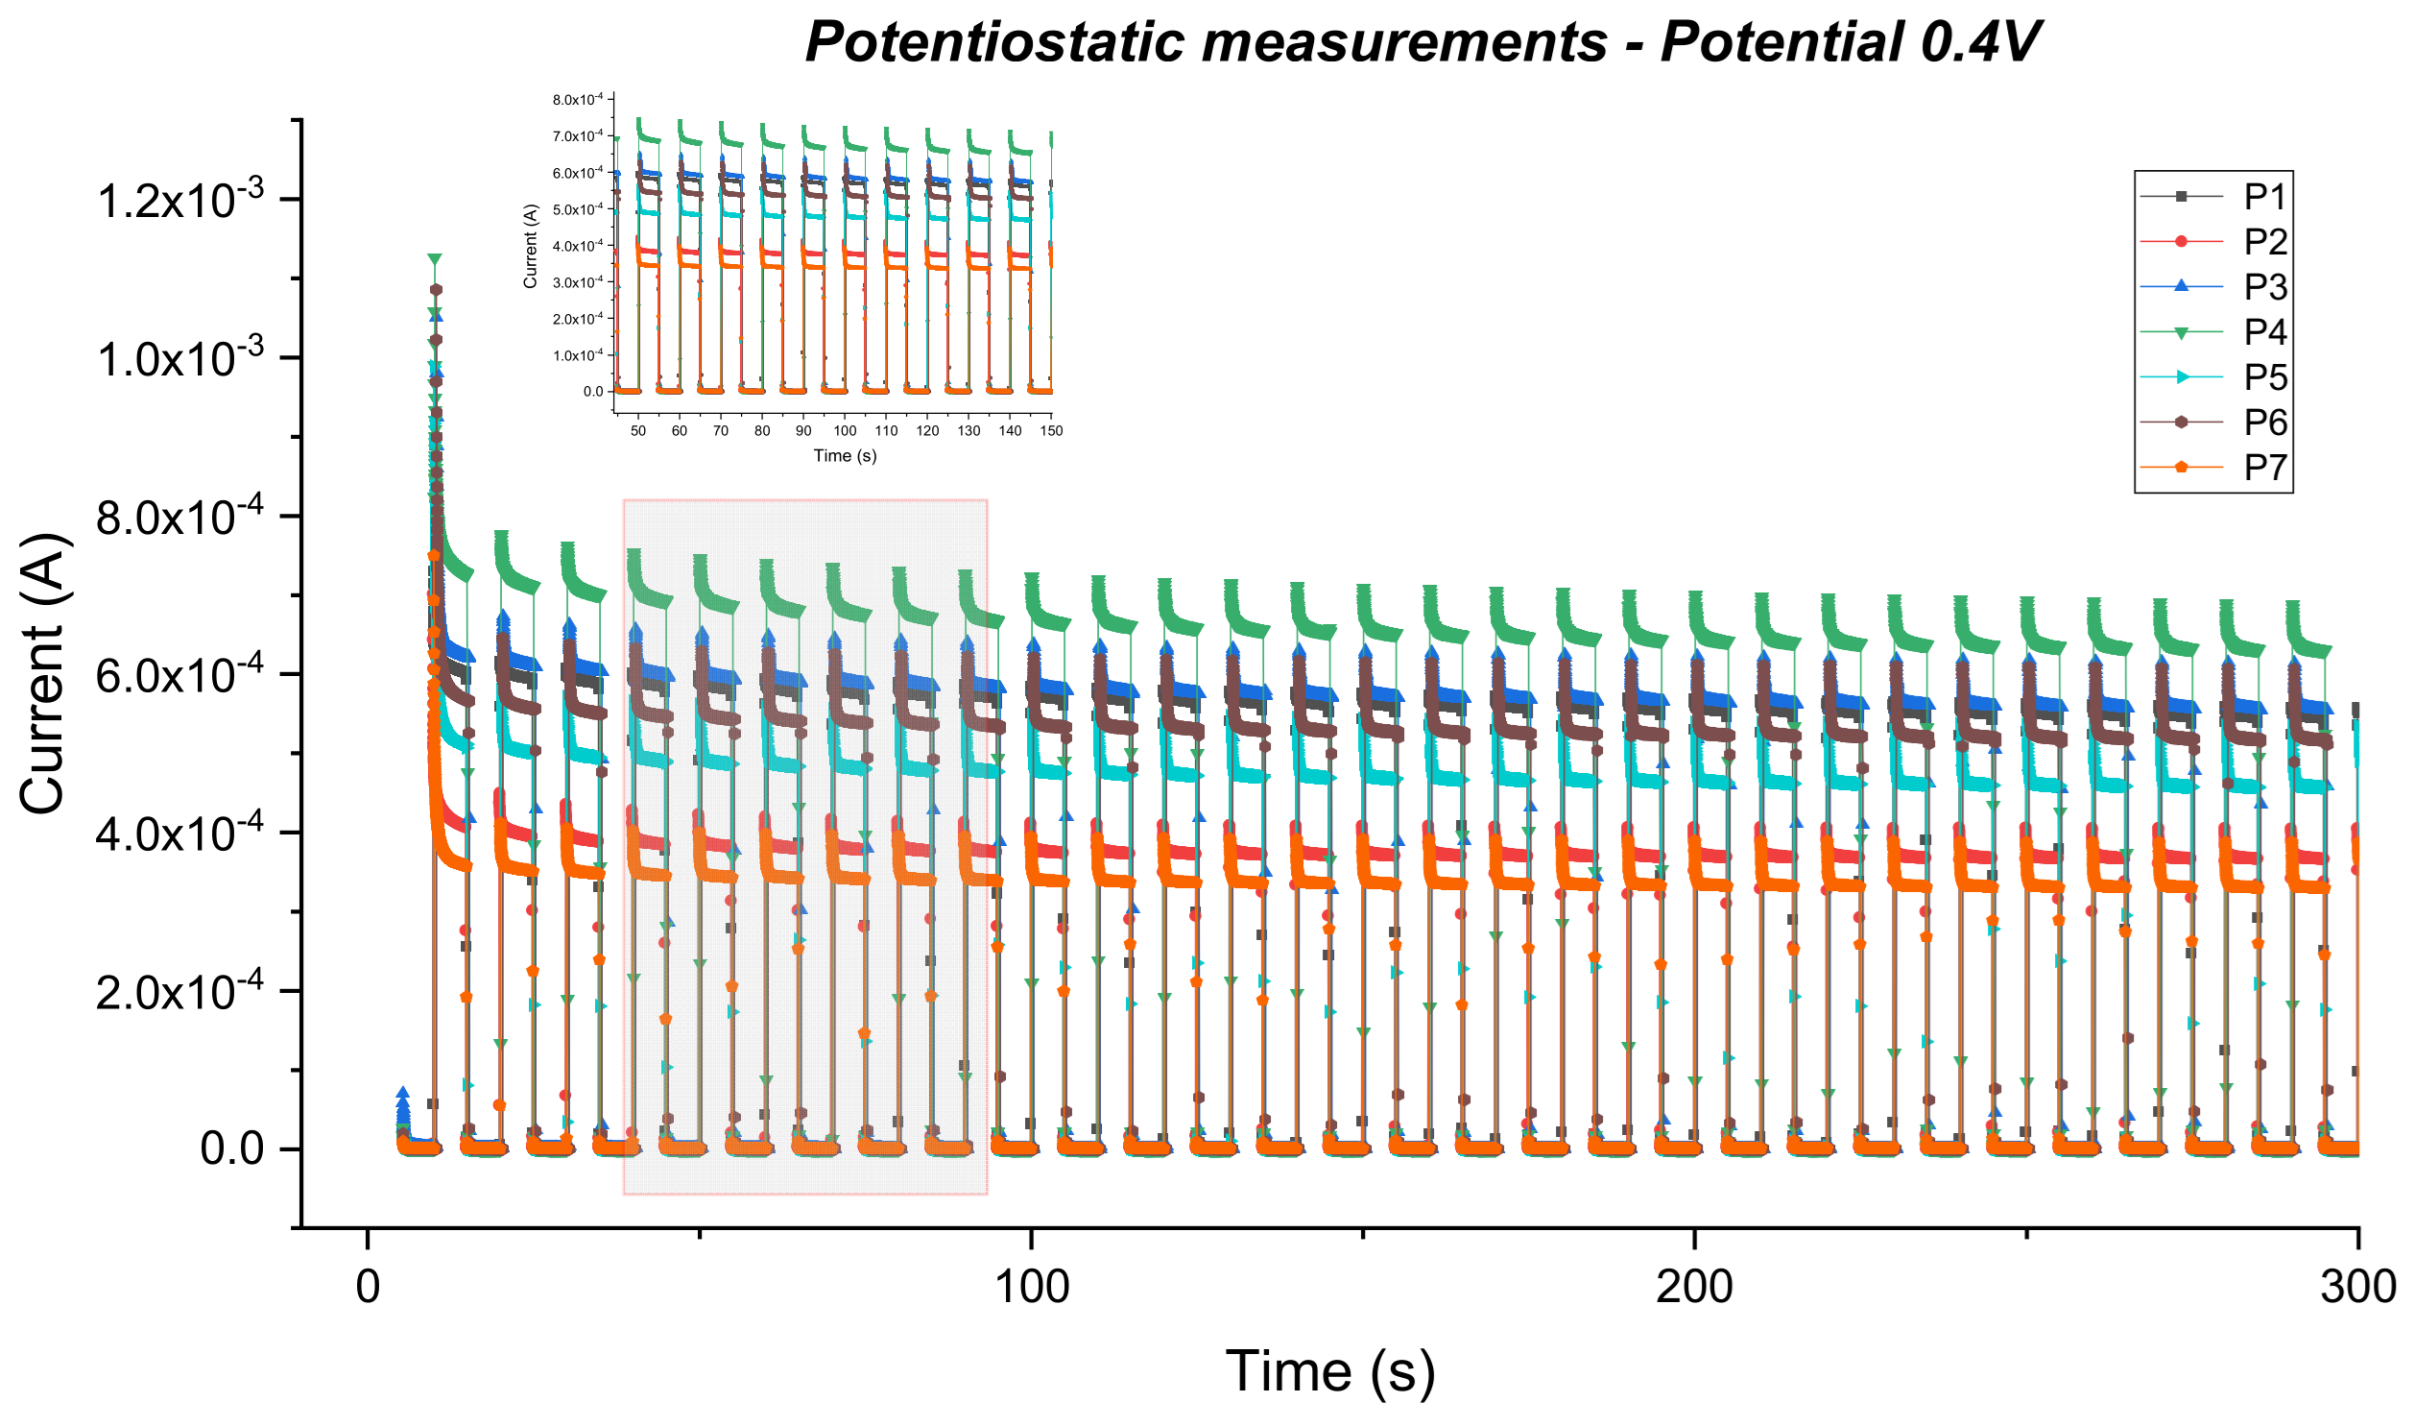
Figure 15, all samples show regular oscillations of the current associated with successive cycles of illumination and darkness, which confirms the maintenance of the photocatalytic activity of the TiO
2 layer. Compared to the measurements at negative potential, the current values are significantly higher, reaching the range of 10
−4–10
−3 A, which indicates that the anodic polarization favors the charge transfer processes and the separation of photogenerated carriers. Unlike the graph where the results of the photocatalytic activity at negative potentials of −0.4 V are presented where the reference sample has the best electrophotocatalytic response, in the case of the graph shown in
Figure 16, the best performances are recorded by the sample P4 of nickel nanoparticle suspension, which reach currents of approximately 6–7 × 10
−4 A. These results indicate that under positive polarization conditions, nickel nanoparticles contribute favorably to the electron transfer processes, having a cocatalytic effect for electron capture.
For samples with a low amount of nanoparticle suspension, namely P2 and P3, the photoelectrocatalytic response is moderate and improved compared to the reference sample, but the maximum effect appears for intermediate concentrations. This phenomenon indicates the existence of an optimal quantity of nanoparticles suspension for the cocatalytic effect to increase the density of the current produced. At high amounts of nanoparticle suspension (P6, P7), the current begins to decrease progressively, although the recorded values generally remain higher than those observed at negative potential, at −0.4 V. The decrease in the recorded performance is due to the agglomeration of nanoparticles on the surface of the TiO2/Pt sample, which reduces light penetration; however, even under these conditions the photocatalytic response of the sample remains stable. Also, the initial current pulses are more intense than in the case of negative polarization, reaching values close to 1.2 × 10⁻³ A.
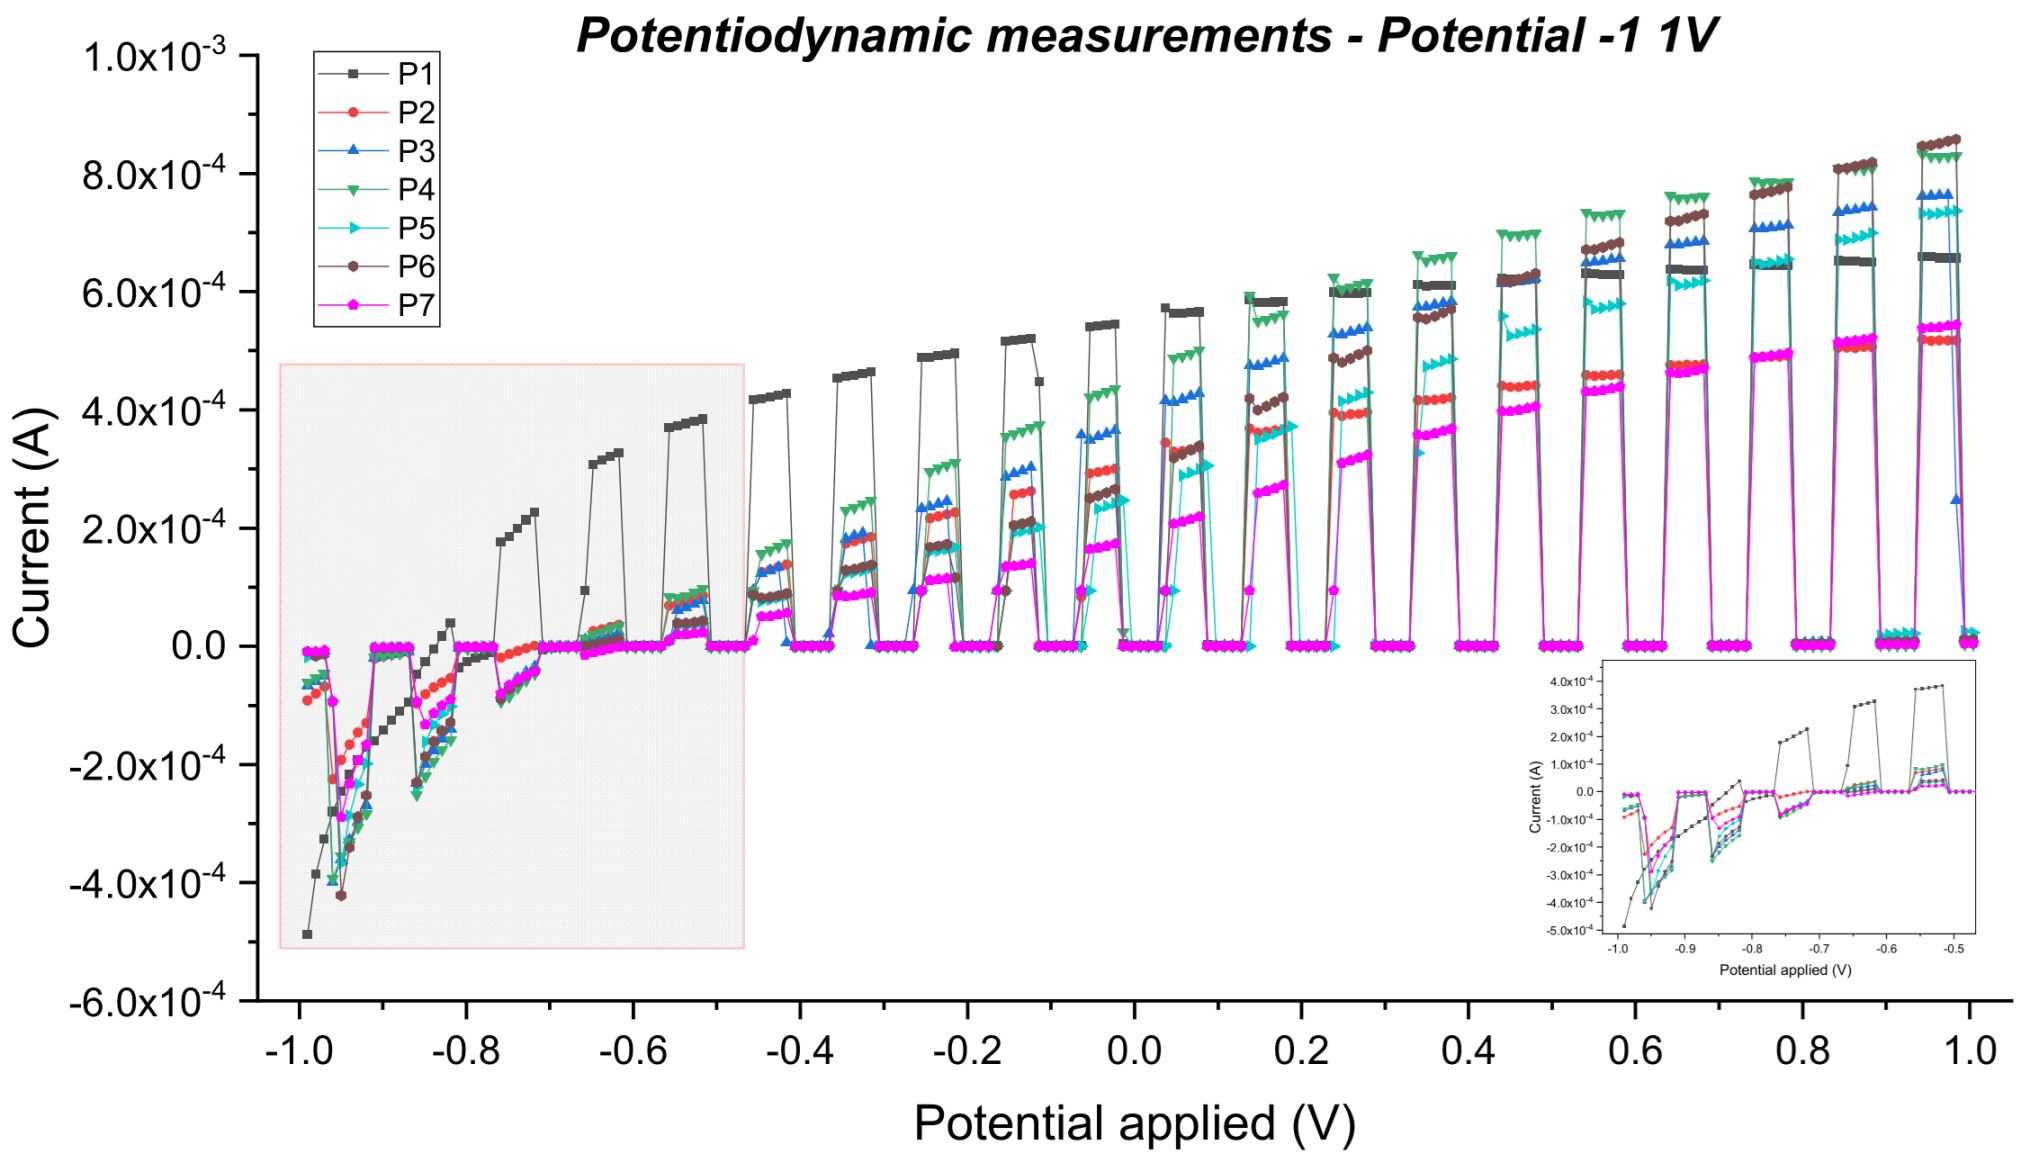
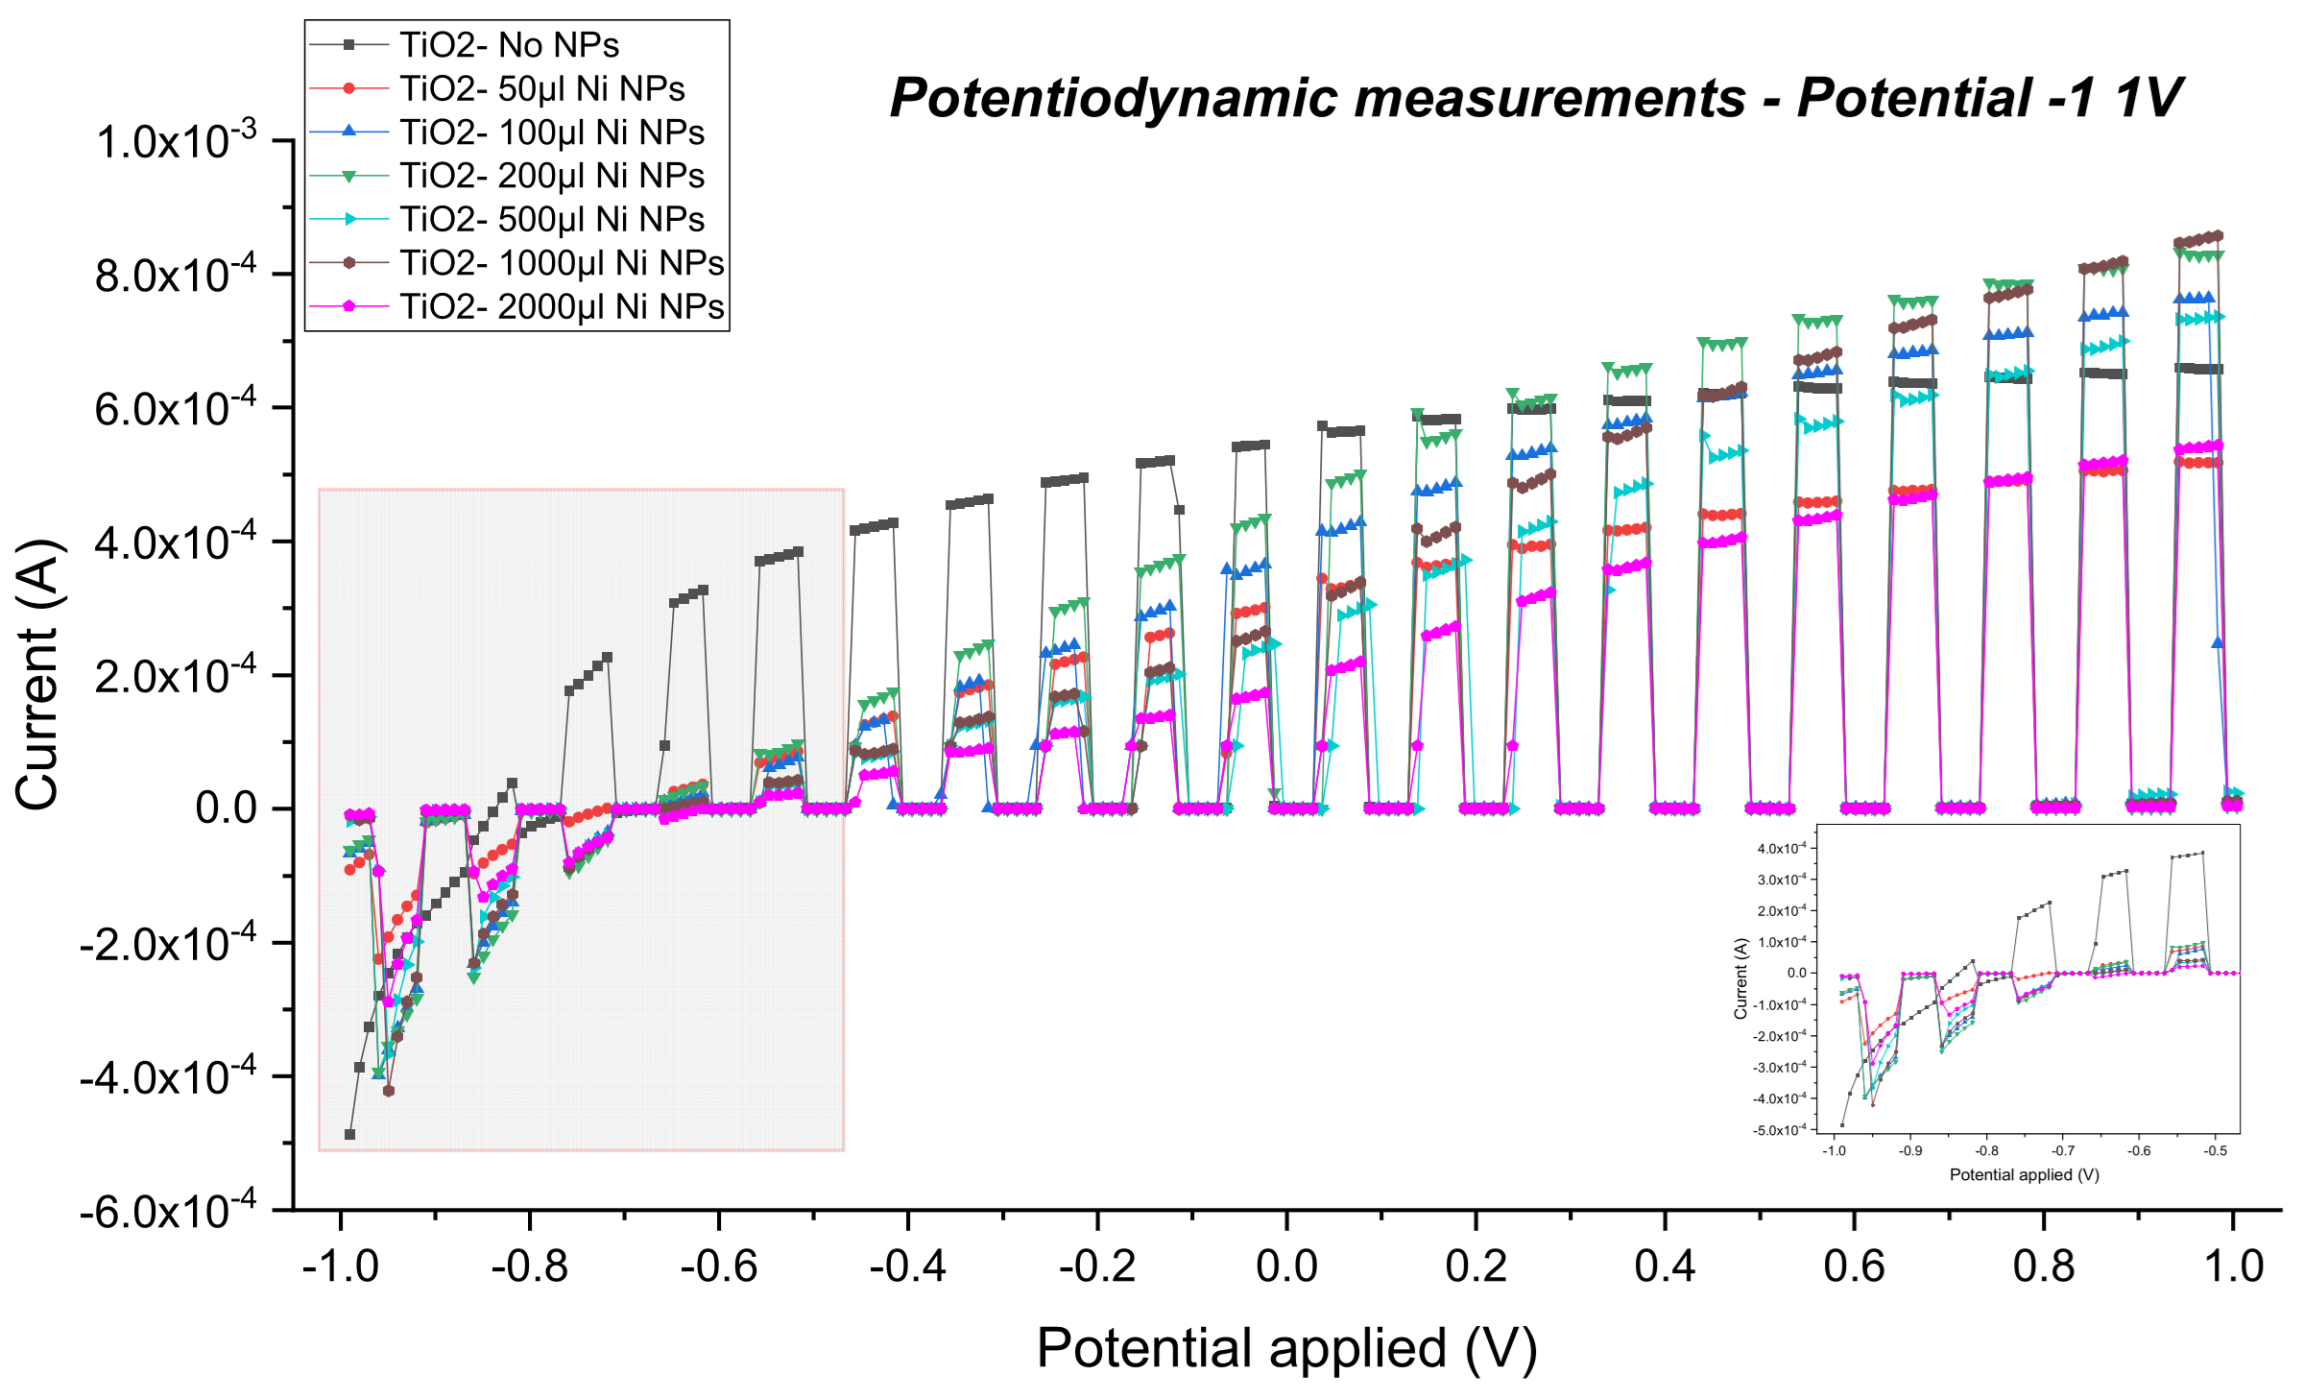
The potentiodynamic PEC measurements performed in the range −1 V to +1 V (
Figure 16) provides important information regarding the photoelectrochemical behavior of the TiO
2/Pt samples enhanced with Ni nanoparticles. It is observed that all samples show a progressive increase in current with the potential shift towards positive values. The periodic shape of the signal indicates the response of the system to successive illumination cycles, which confirms the photoactive nature of the investigated structures. At each potential step, illumination produces a rapid increase in current, followed by its stabilization in a quasi-stationary regime, characteristic of the separation and transport processes of photogenerated carriers. In the negative potential range (approximately −1 V to −0.6 V), all samples show significant cathodic currents. The sample without Ni nanoparticles has the most pronounced negative response, reaching values of approximately −5 × 10
−4 A, which indicates a high activity in electrochemical reduction processes. The introduction of Ni nanoparticles reduces the amplitude of the cathodic current.
As the potential becomes less negative and subsequently positive, all samples show an almost linear increase in the anodic current. In this range, a very clear effect of Ni nanoparticles appears; samples with intermediate Ni concentrations (P4–P6) develop the highest photoinduced current values. In particular, sample P4 shows one of the highest anodic current densities over the entire positive potential range, clearly exceeding the sample without Ni. This result suggests that Ni nanoparticles contribute to photocatalysis, acting as a cocatalyst in the process.
At potentials close to +1 V, the anodic currents reach values of approximately 8–8.5 × 10⁻⁴ A for some Ni-modified samples, while the sample without nanoparticles remains at lower values (~6.5 × 10⁻⁴ A). This behavior demonstrates that Ni has a pronounced positive effect on the anodic processes.
However, at very high Ni concentrations (P7), a decrease in the electrophotocatalytic performance is again observed. The anodic current becomes lower compared to the samples with a lower amount of nanoparticle suspension, which indicates that the excess of nanoparticles leads to the coverage of the active TiO2 surface and the occurrence of agglomeration phenomena on the sample surface.
Comparing these results with potentiostatic PEC measurements at ±0.4 V, a very good agreement between the experimental trends is observed. At negative polarization, Ni nanoparticles reduce the photoelectrochemical activity, while at positive polarization they significantly improve the electrophotocatalytic response, especially for moderate concentrations. LSV measurements thus confirm the existence of an optimal amount of Ni, approximately in the range of 200–500 μL (P4, P5), for which charge transfer and photoelectrocatalytic efficiency are maximal.





 ,
,