Viscosity Estimation of a Suspension with Rigid Spheres in Circular Microchannels Using Particle Tracking Velocimetry


 ,
,
Abstract
:1. Introduction
2. Materials and Methods
2.1. Suspension
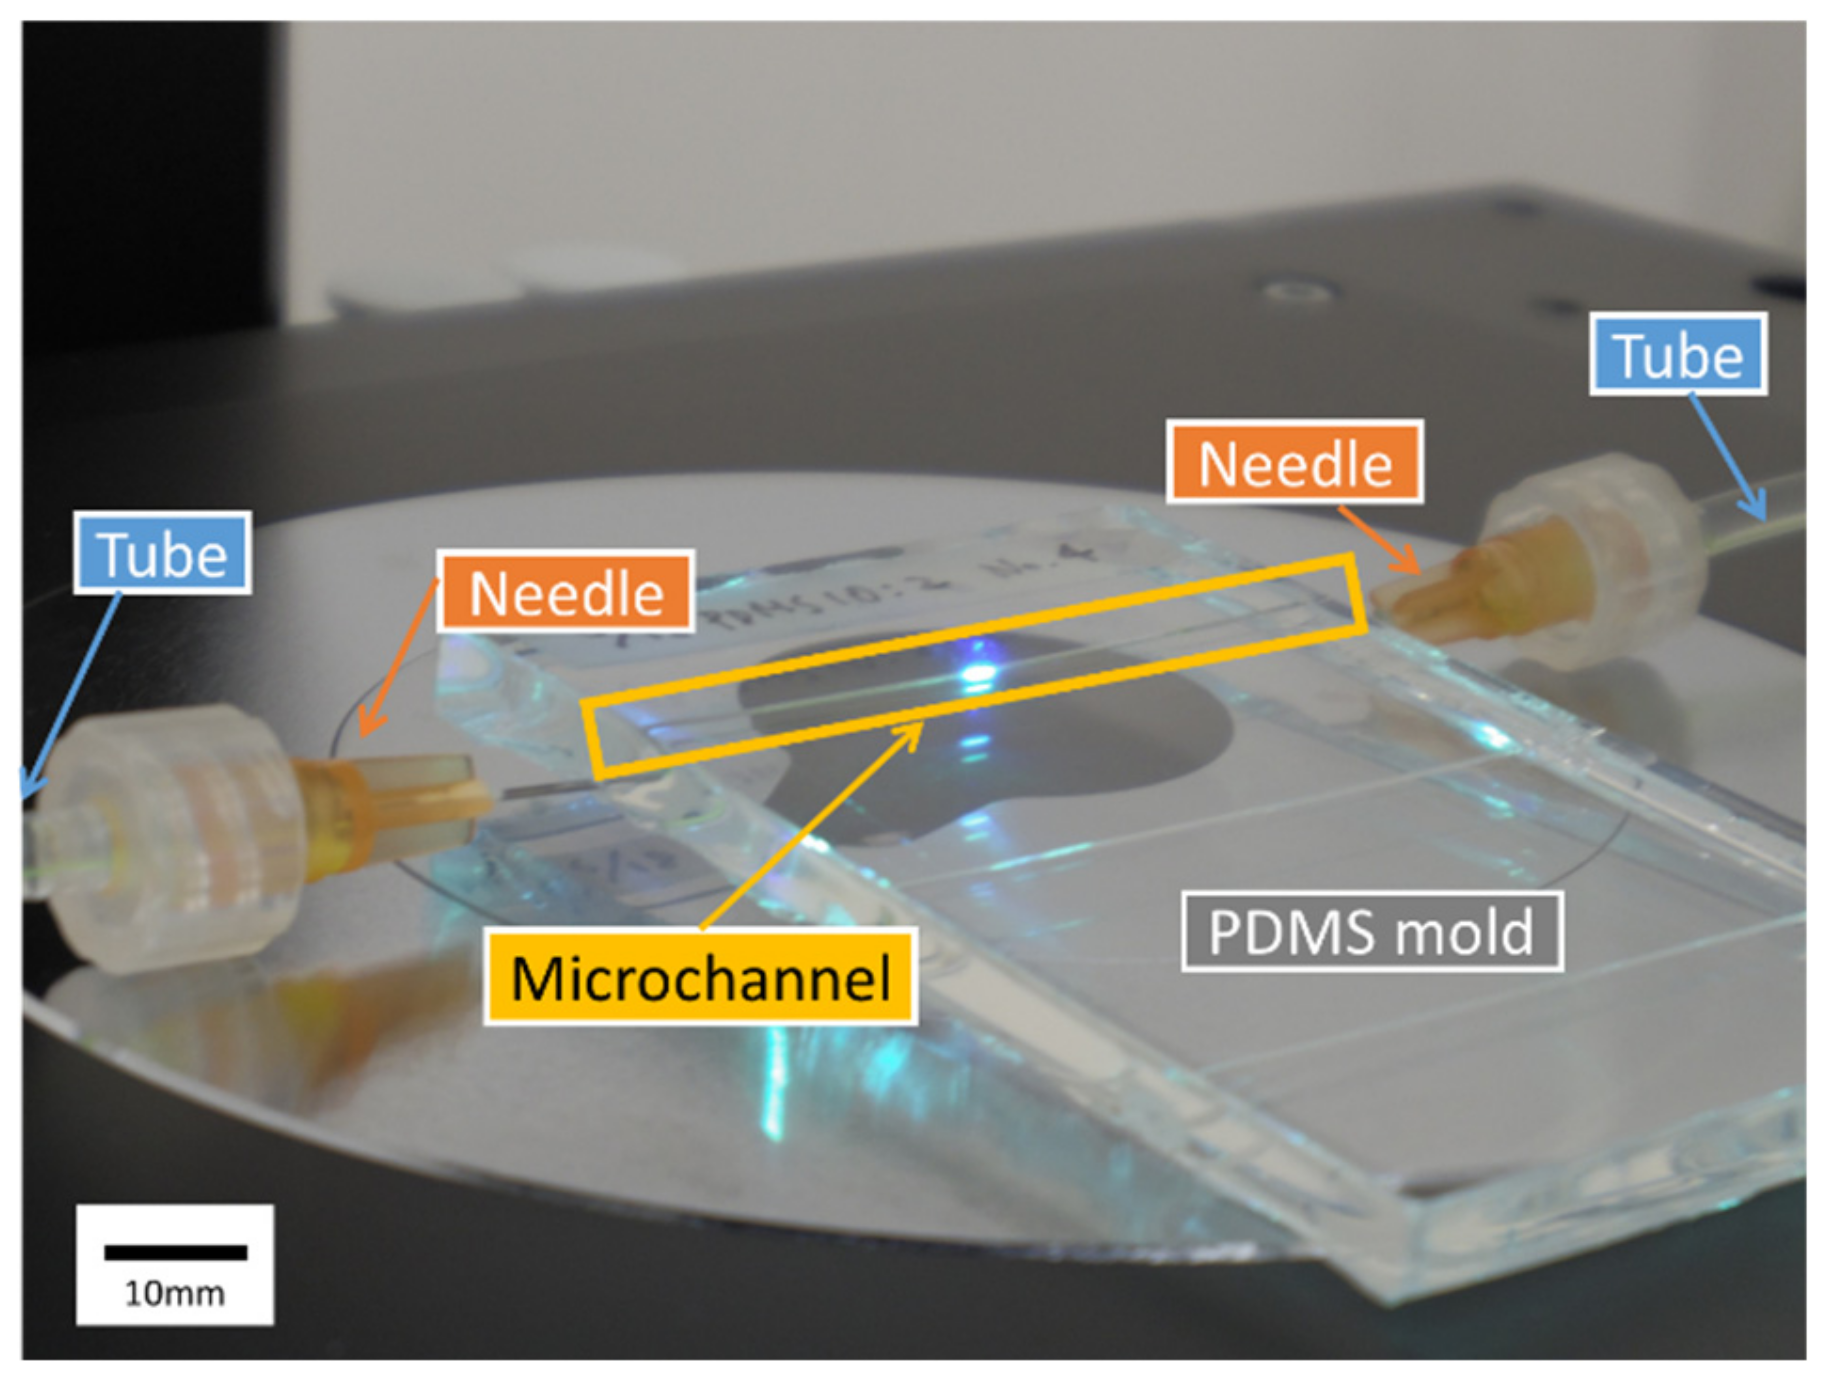
2.2. Microchannel
- (1)
- Holes were drilled in a case (Styrol square case type 3, As One, Osaka, Japan) and a fishing gut with a diameter D = 520 μm (Type 10, Matsuura Industry, Osaka, Japan) was passed through the holes.
- (2)
- PDMS (Silgard 184 Silicone Elastomer Kit, Dow Corning, Midland, MI, USA) was synthesized by mixing the elastomer base with its curing agent in a weight ratio of 10:2. The ratio of the curing agent was increased to twice the recommended value to suppress the effects of PDMS elasticity. Next, PDMS was poured into the case and cured in an oven (75 °C) overnight.
- (3)
- Lastly, the gut was pulled out gently and the PDMS mold with the microchannel was taken out from the case. For the measurement, needles (NN-2516R, TERUMO, Tokyo, Japan) were inserted on both sides of the microchannel and connected by tubes.
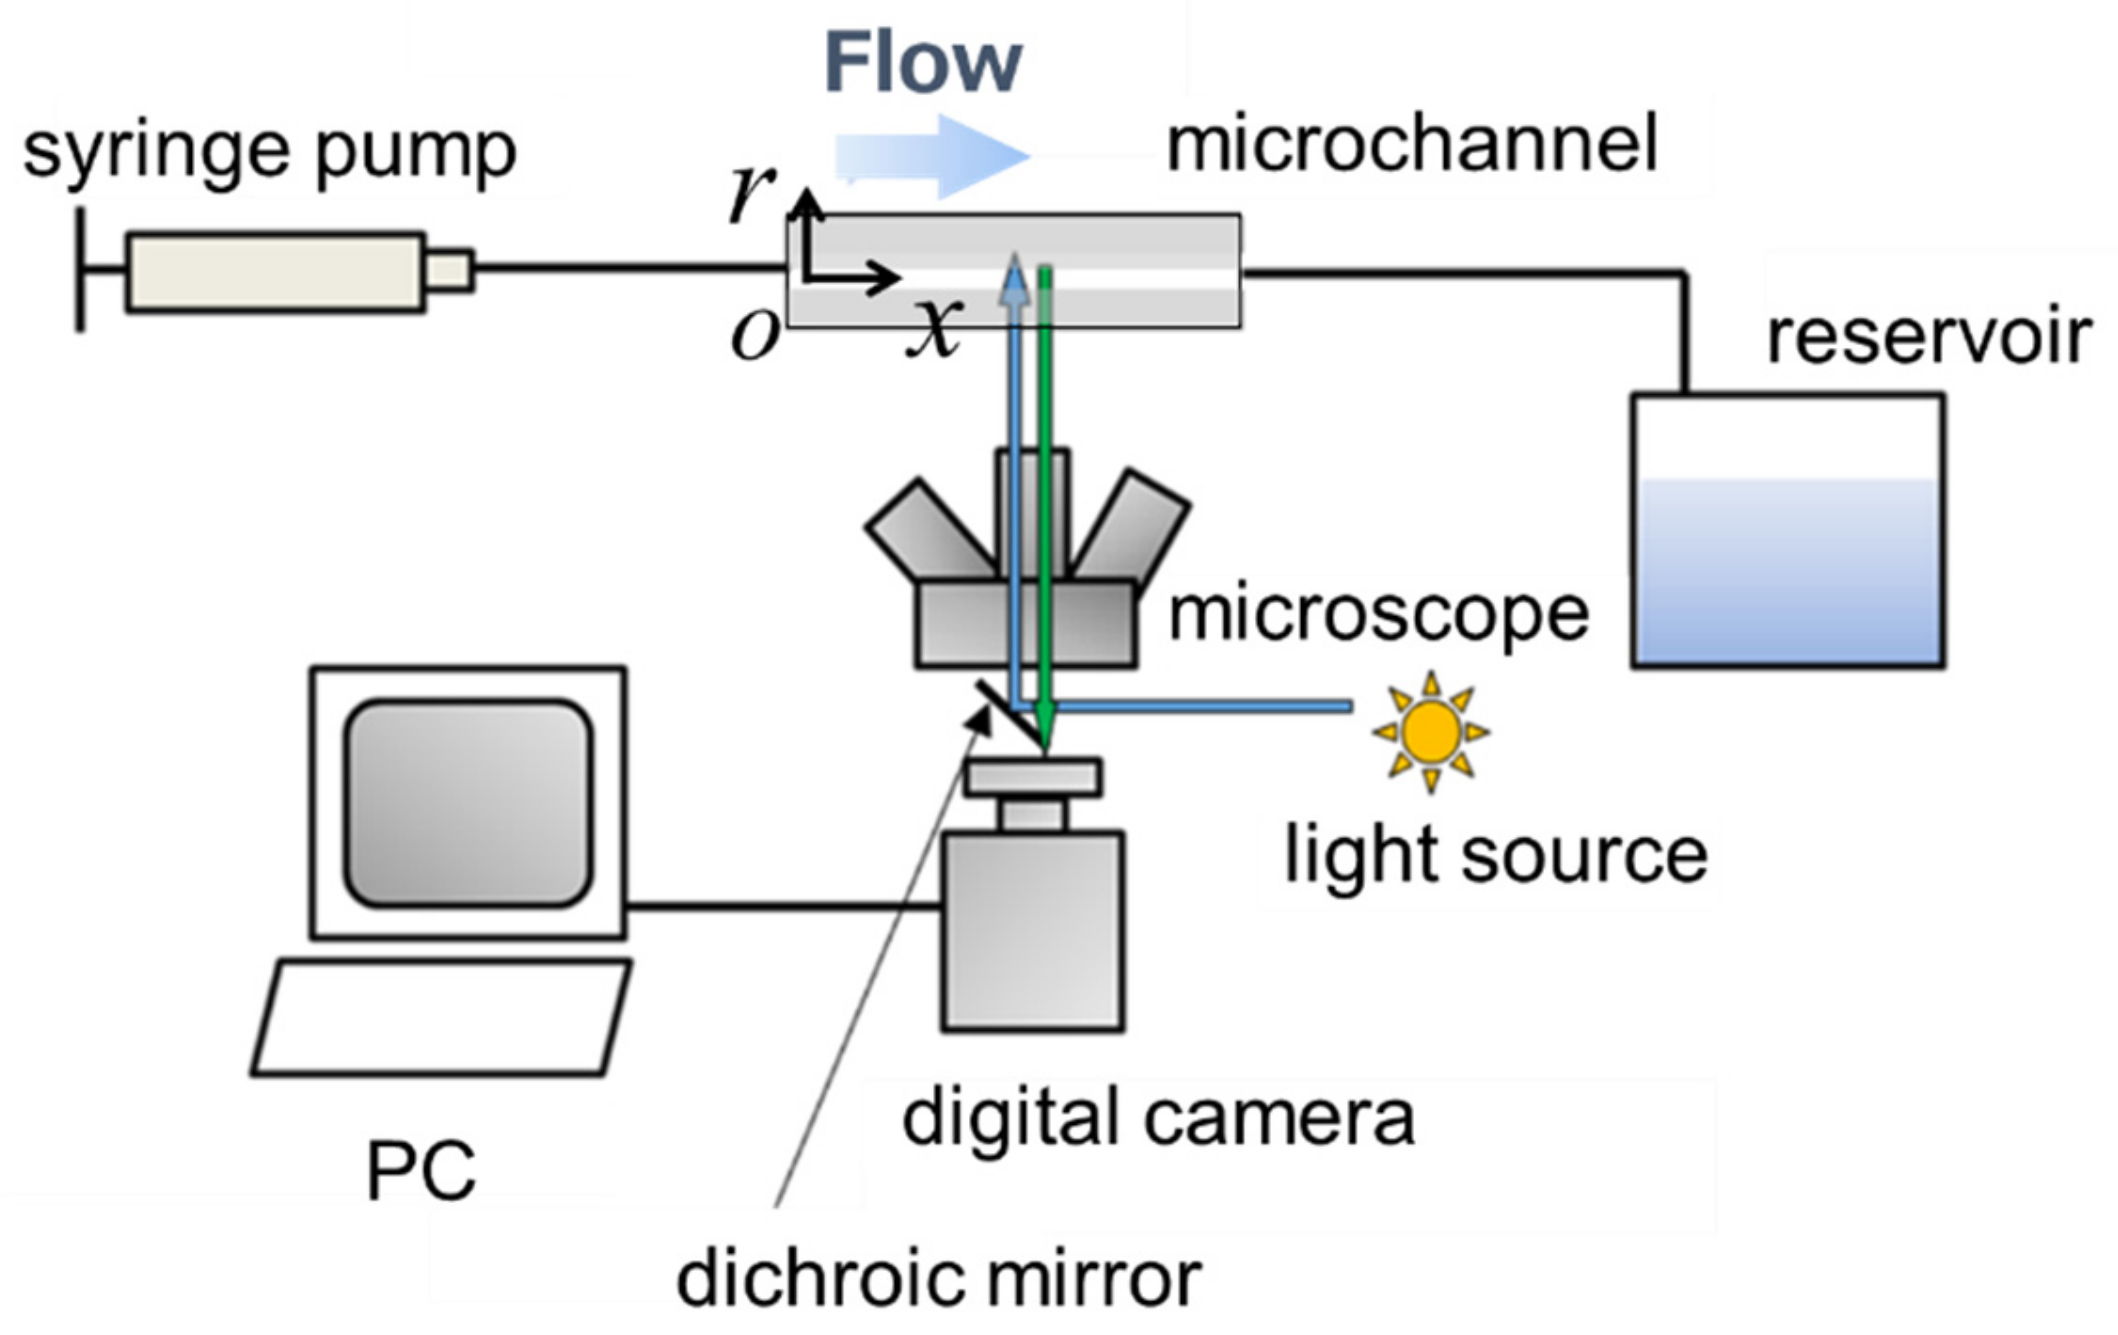
2.3. Experimental Setup
2.4. Image Processing
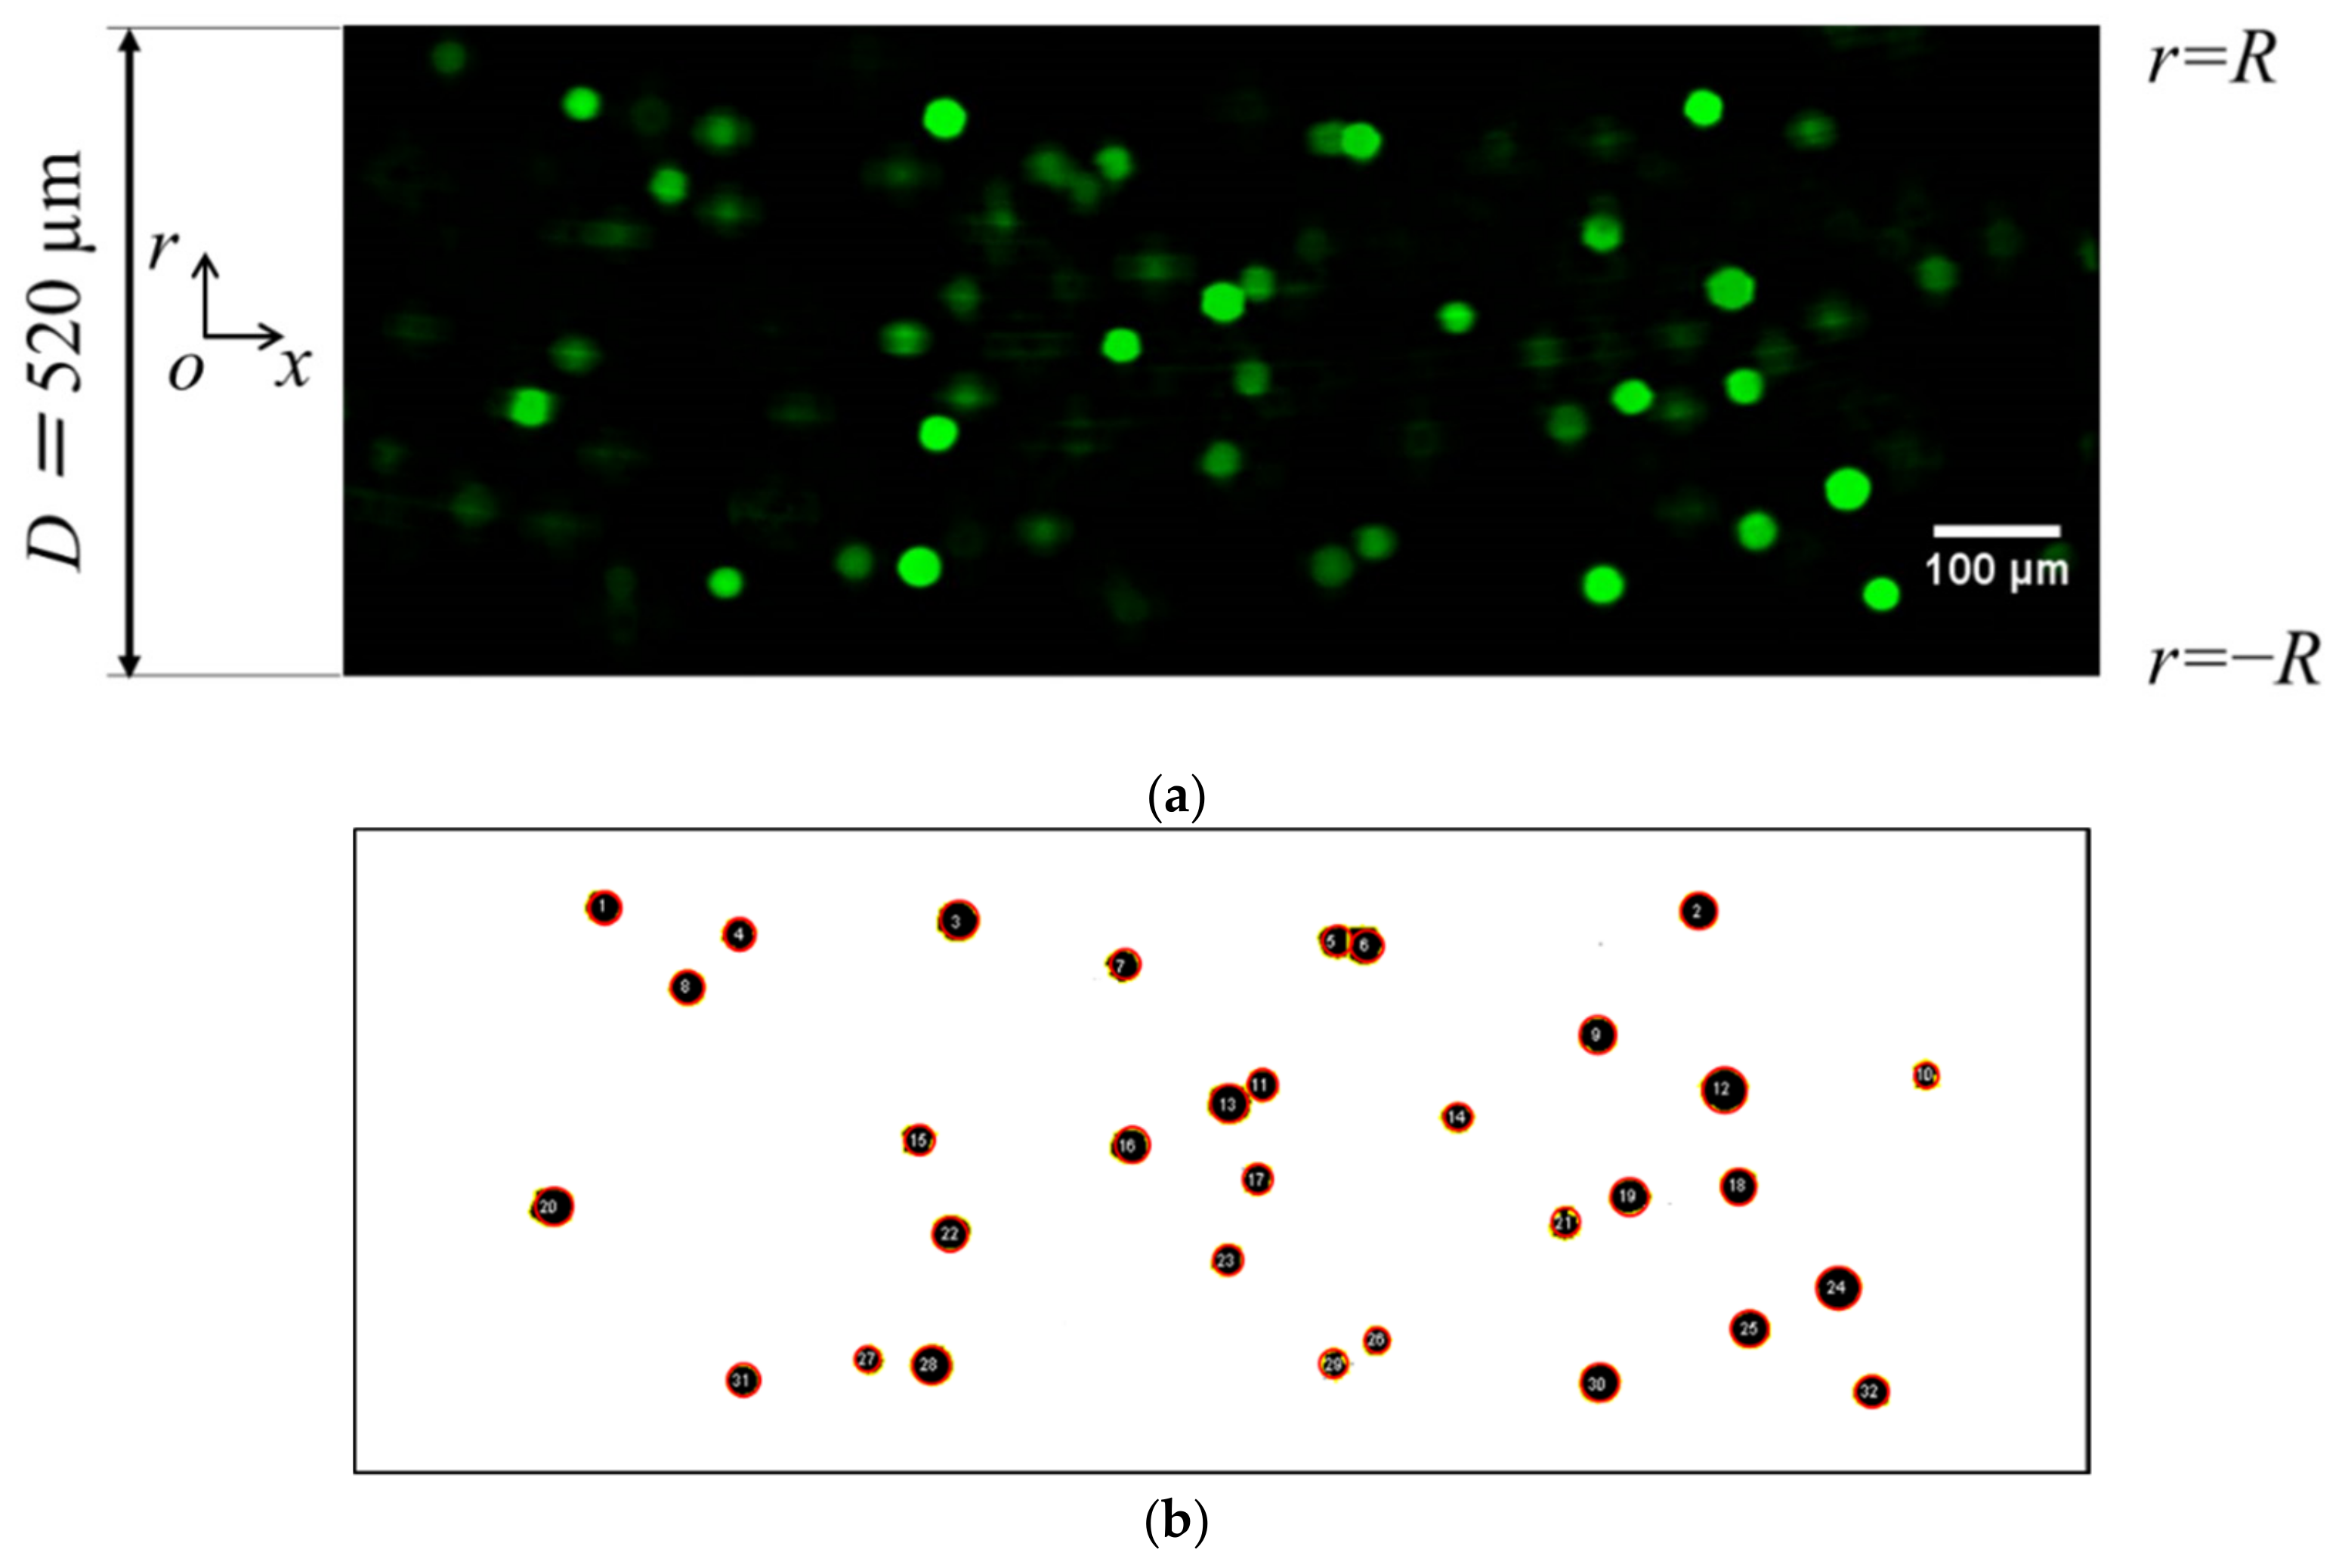
- Fluorescent particle images were converted to binary images using the “subtract background” command given as a preparation, and the binarization was conducted based on the threshold determined using the Otsu method [37].
- Particle size for analysis was set to 200 pixel2, which corresponds to the particle diameter of ~ 22 µm, and the coordinates of the particle center point were extracted using macros. Figure 3b shows a sample of extracted particles obtained from a binary image. The particles are encircled in red in Figure 3b for clarity. In this step, “watershed segmentation” was used for identifying each particle, and the function of automatically separated or cut apart particles were recognized as a single cluster due to overlapping.
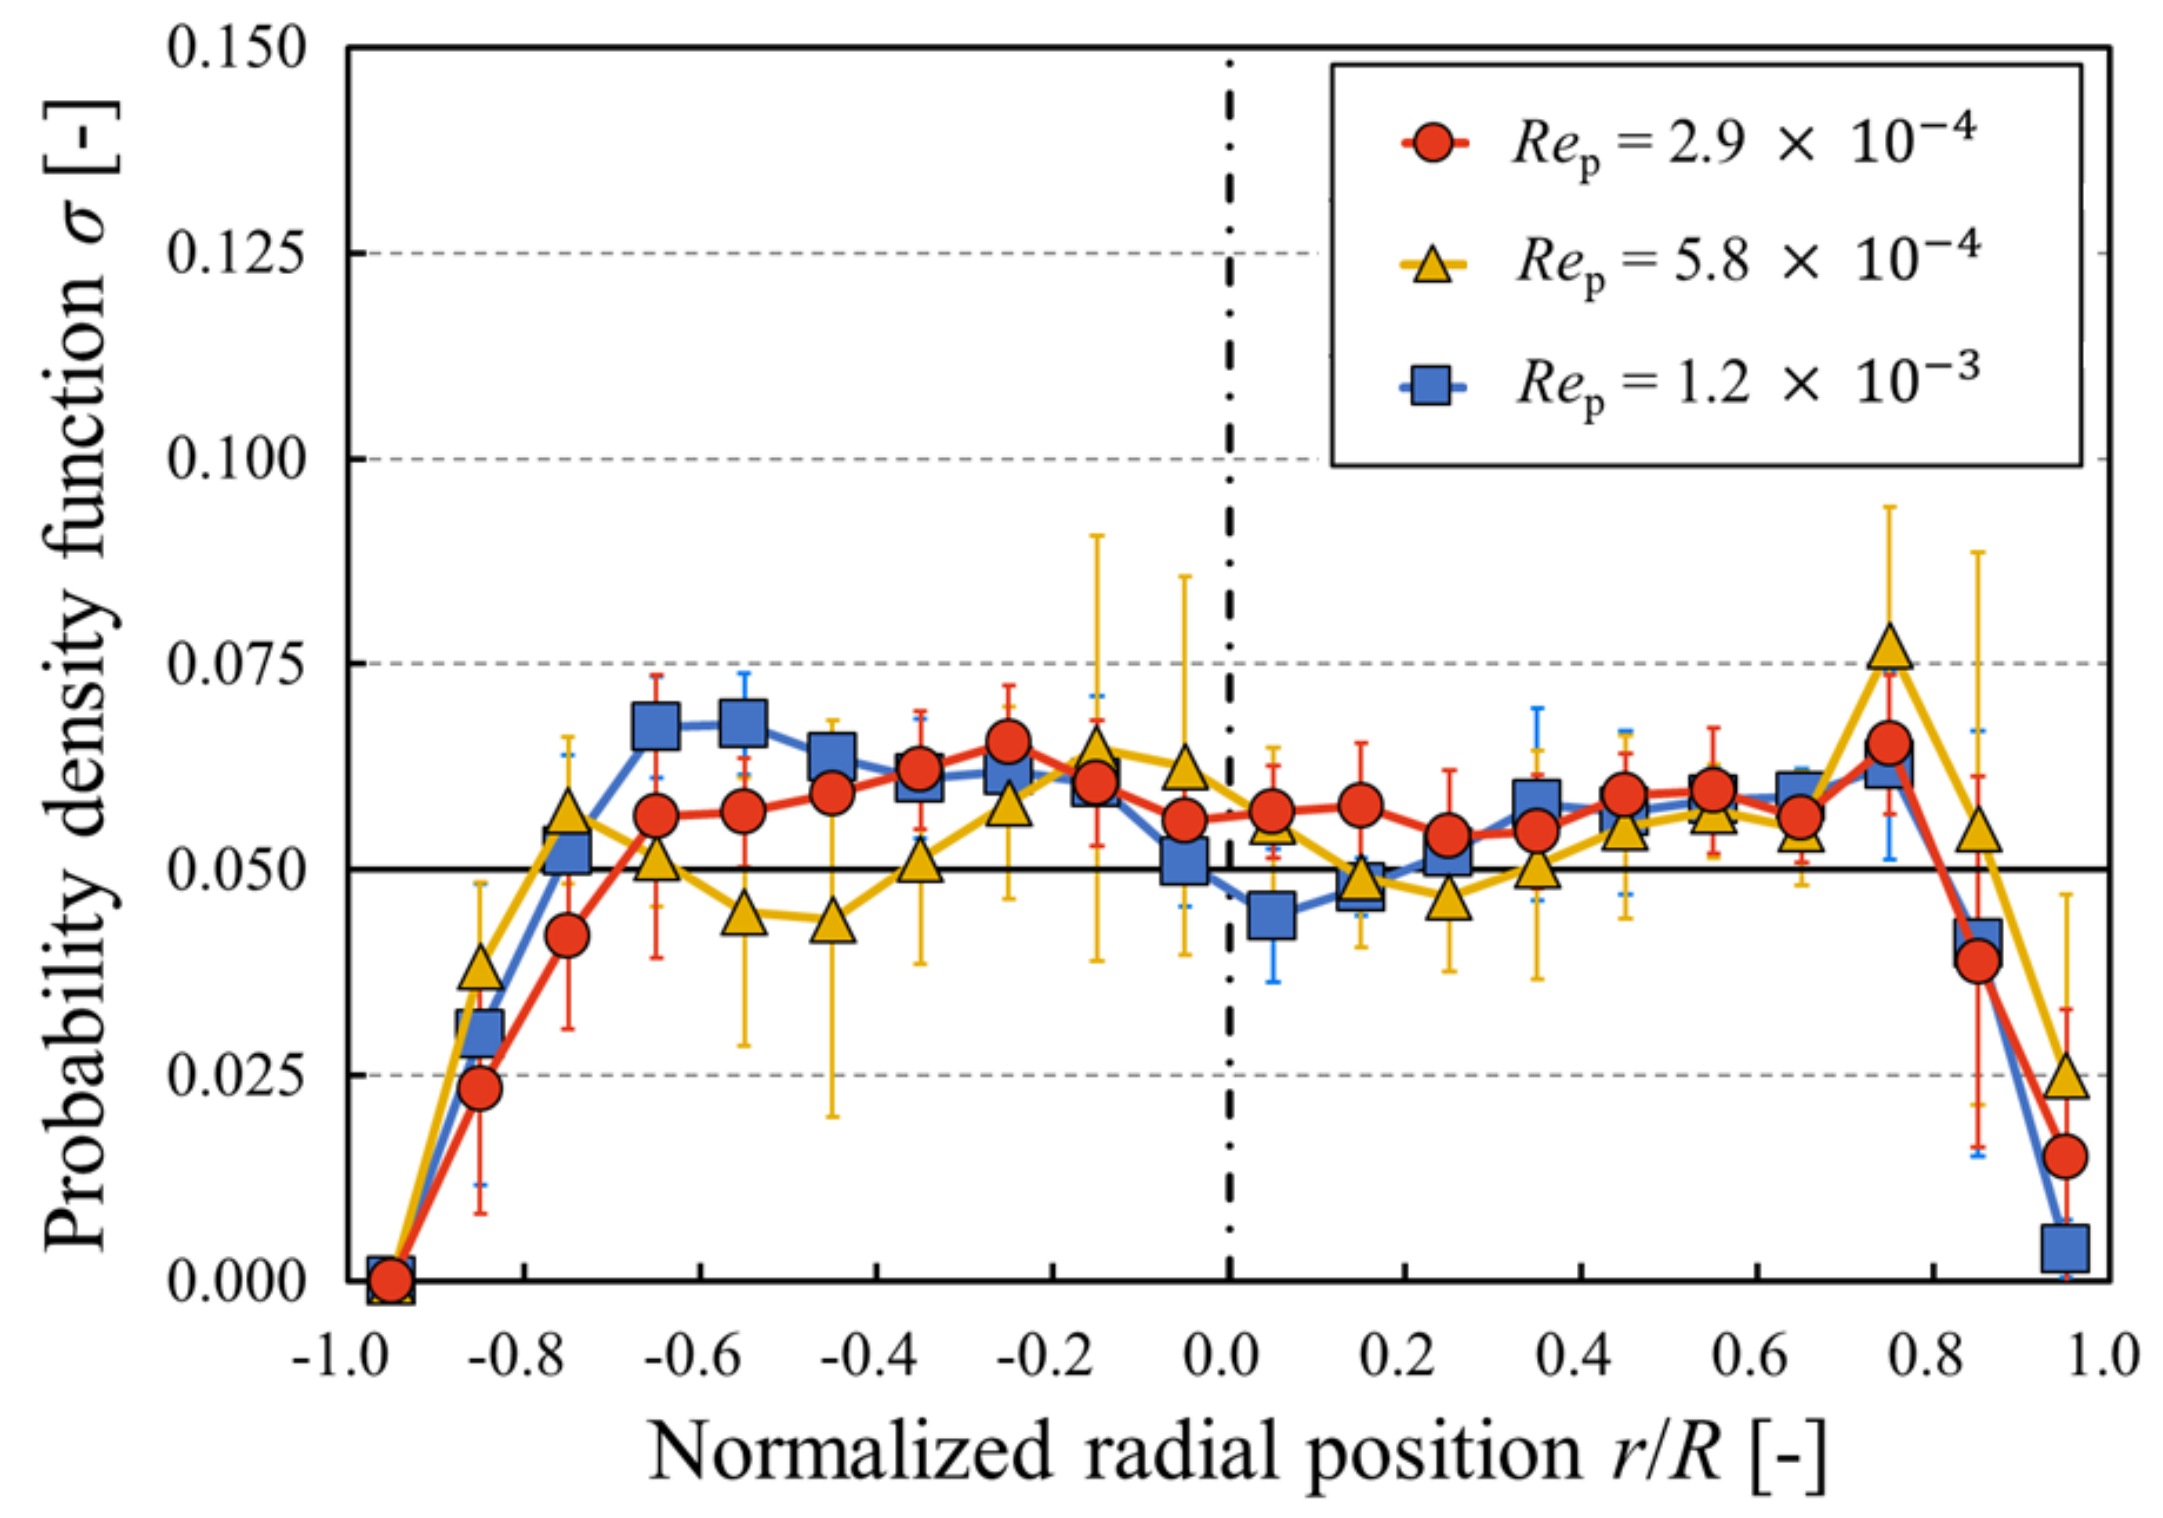
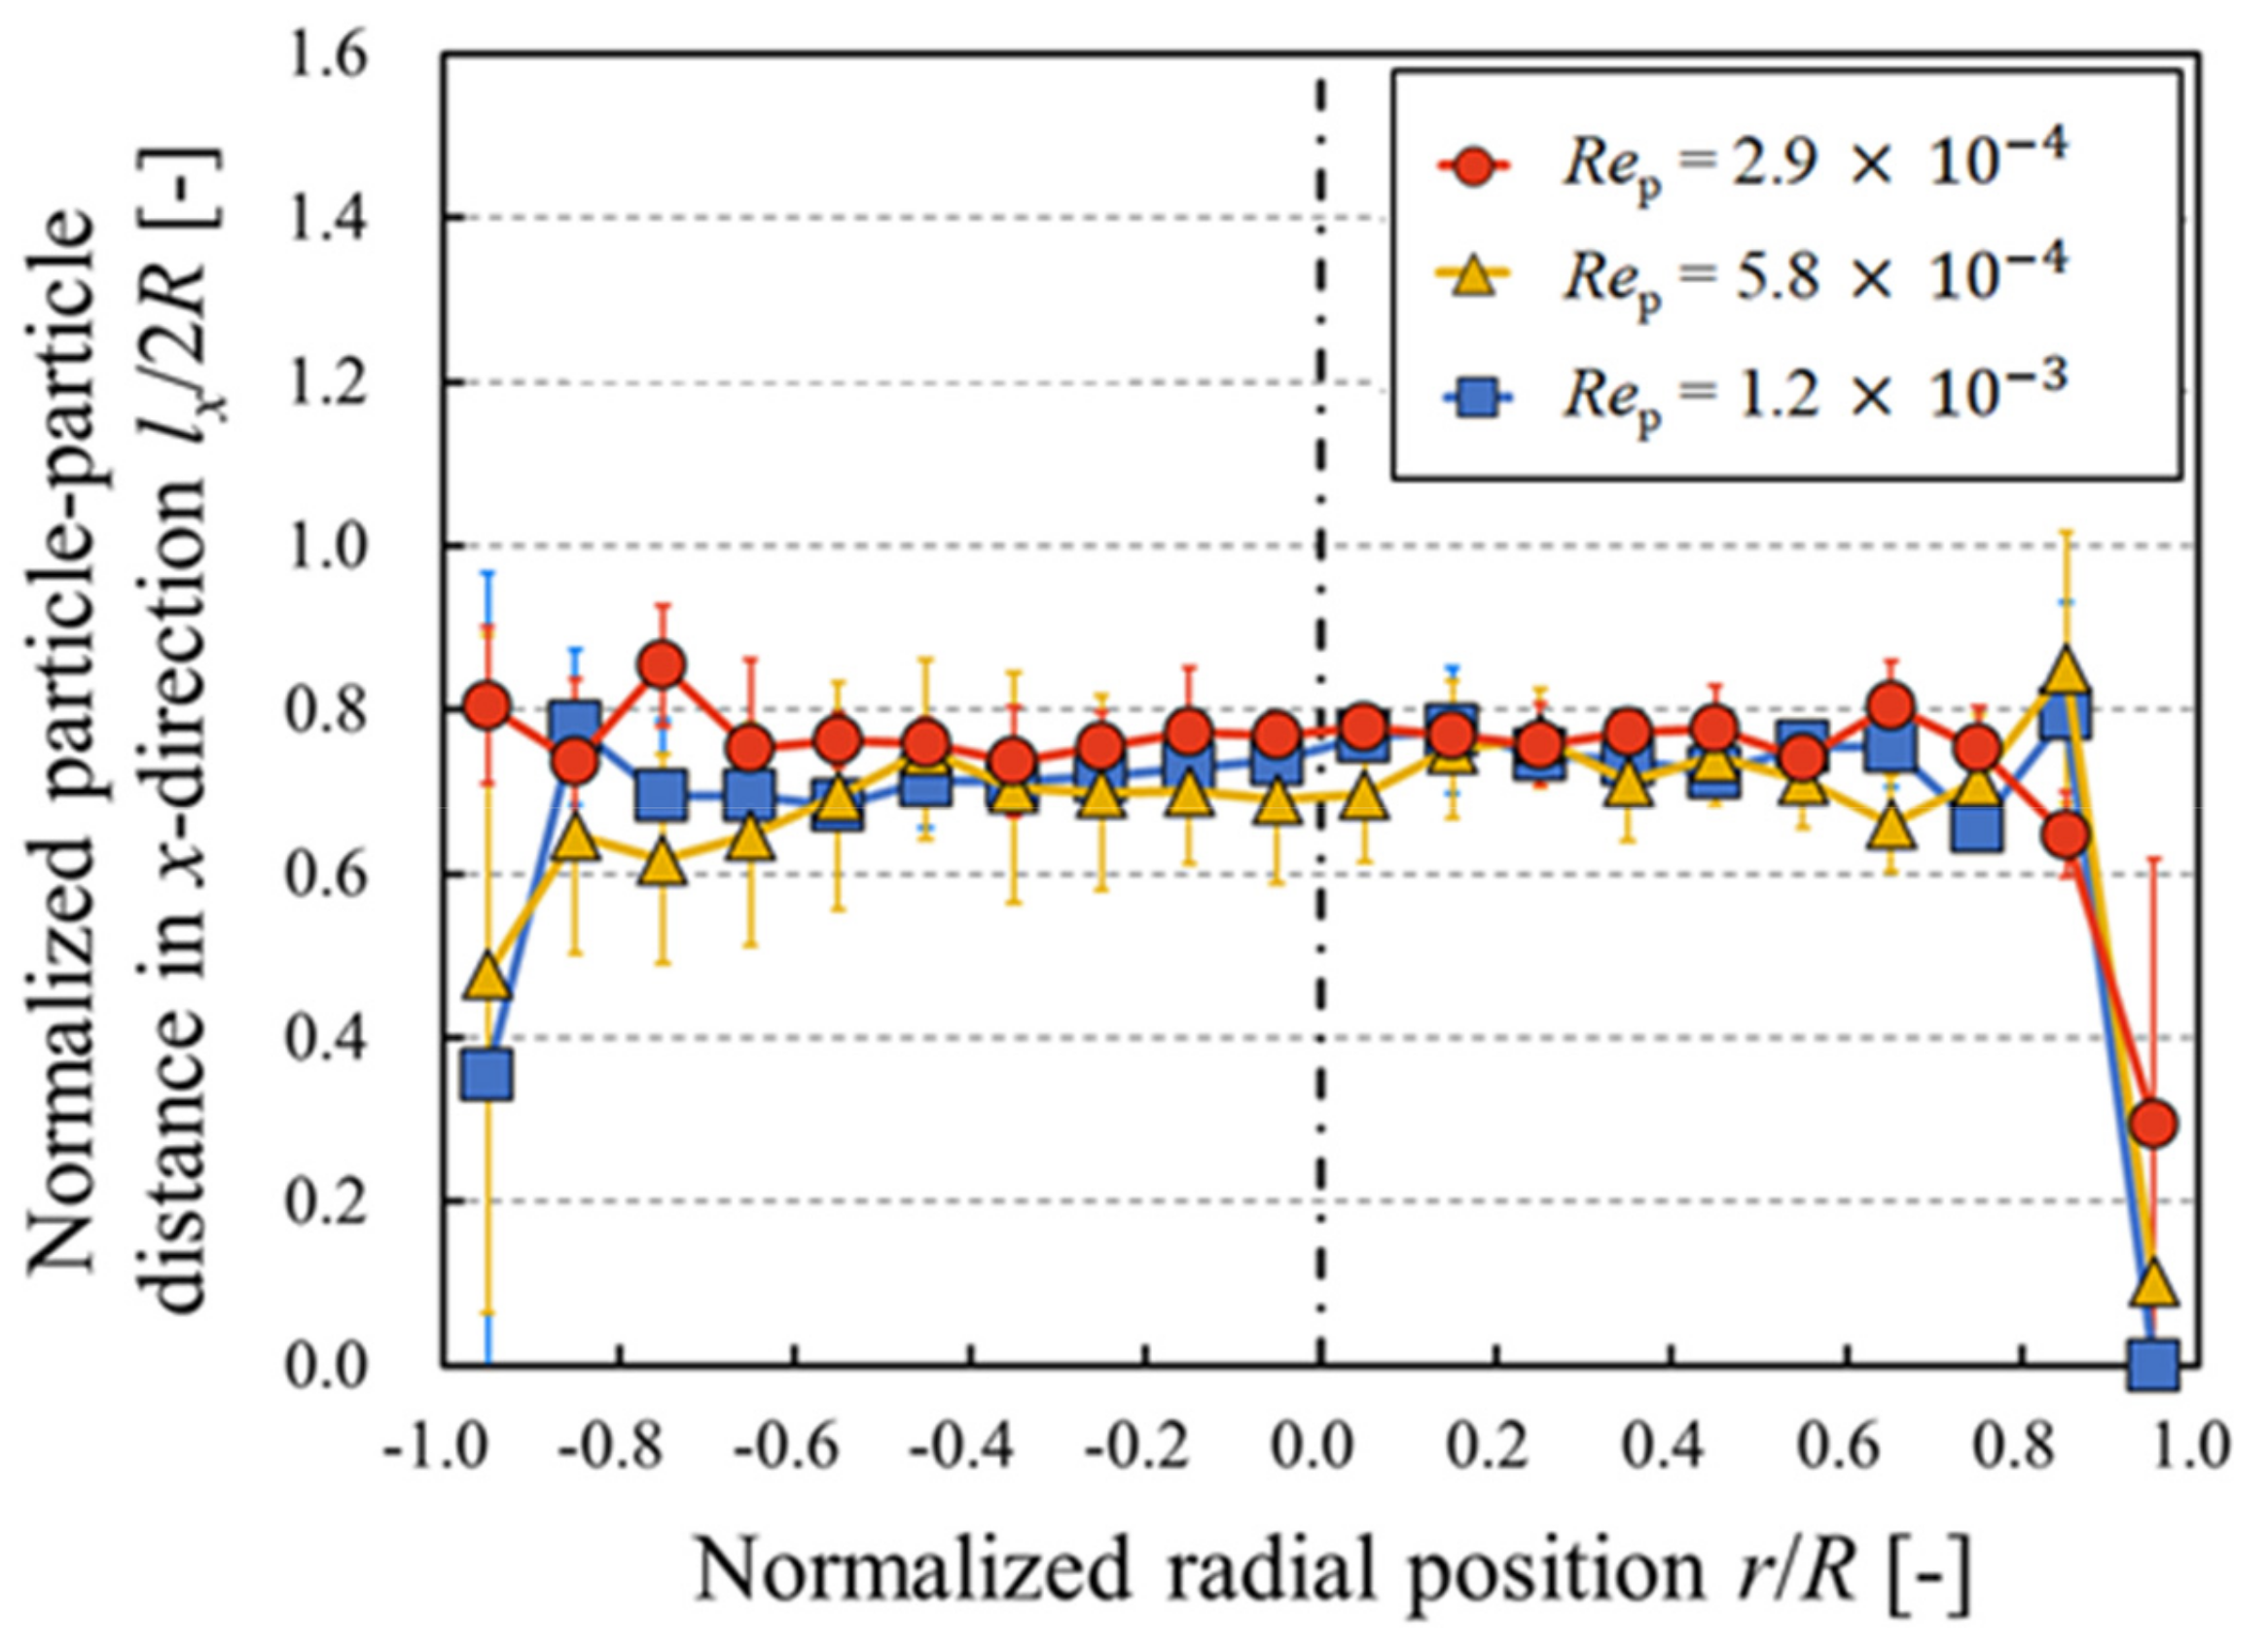
- The measurement region was equally divided in the radial direction, and the number of particles in each section was counted from their radial positions. The existence probability of particles in the radial direction σ was then obtained with respect to the number of particles in the entire image.
- Steps 1–3 were repeated for all images, and these data were analyzed for a time-averaged particle concentration profile.
- PTV was also employed, and time-averaged velocity profiles were obtained. The non-Newtonian properties of the suspension were evaluated by comparing the time-averaged measured velocity profiles with those from a power-law fluid. Details have been provided in Section 2.5.
2.5. Non-Newtonian Properties
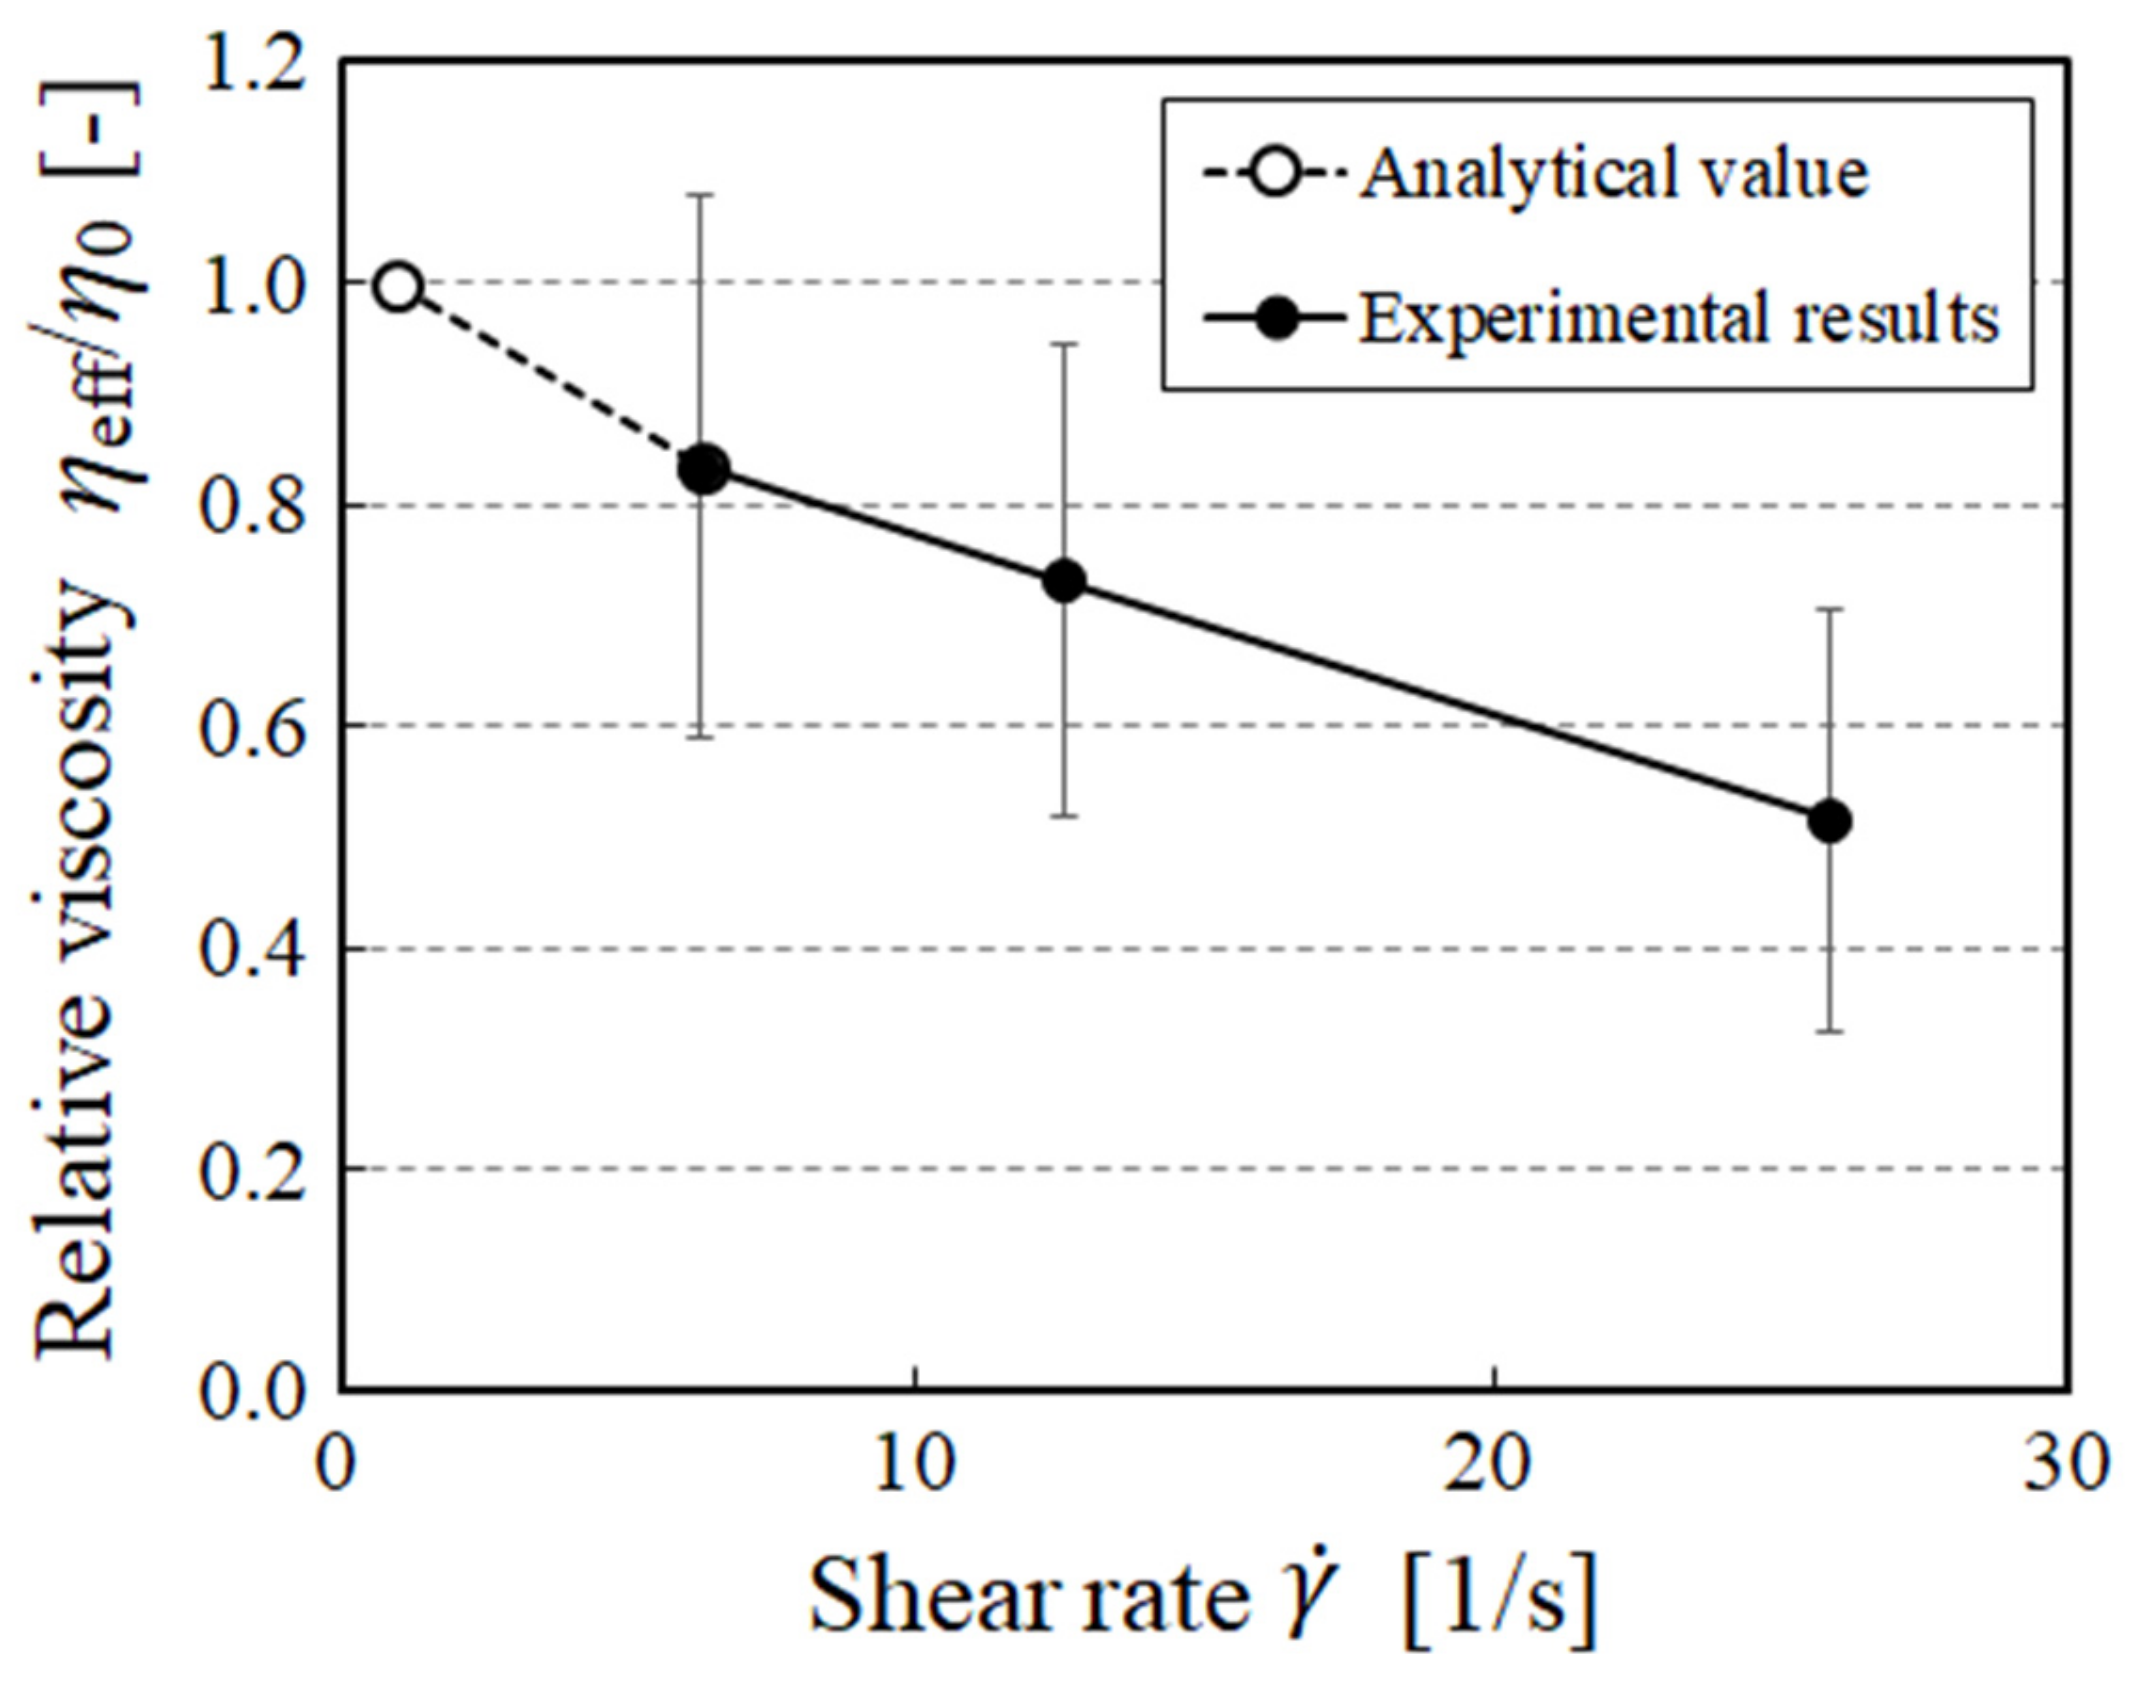
2.6. Relative Viscosity
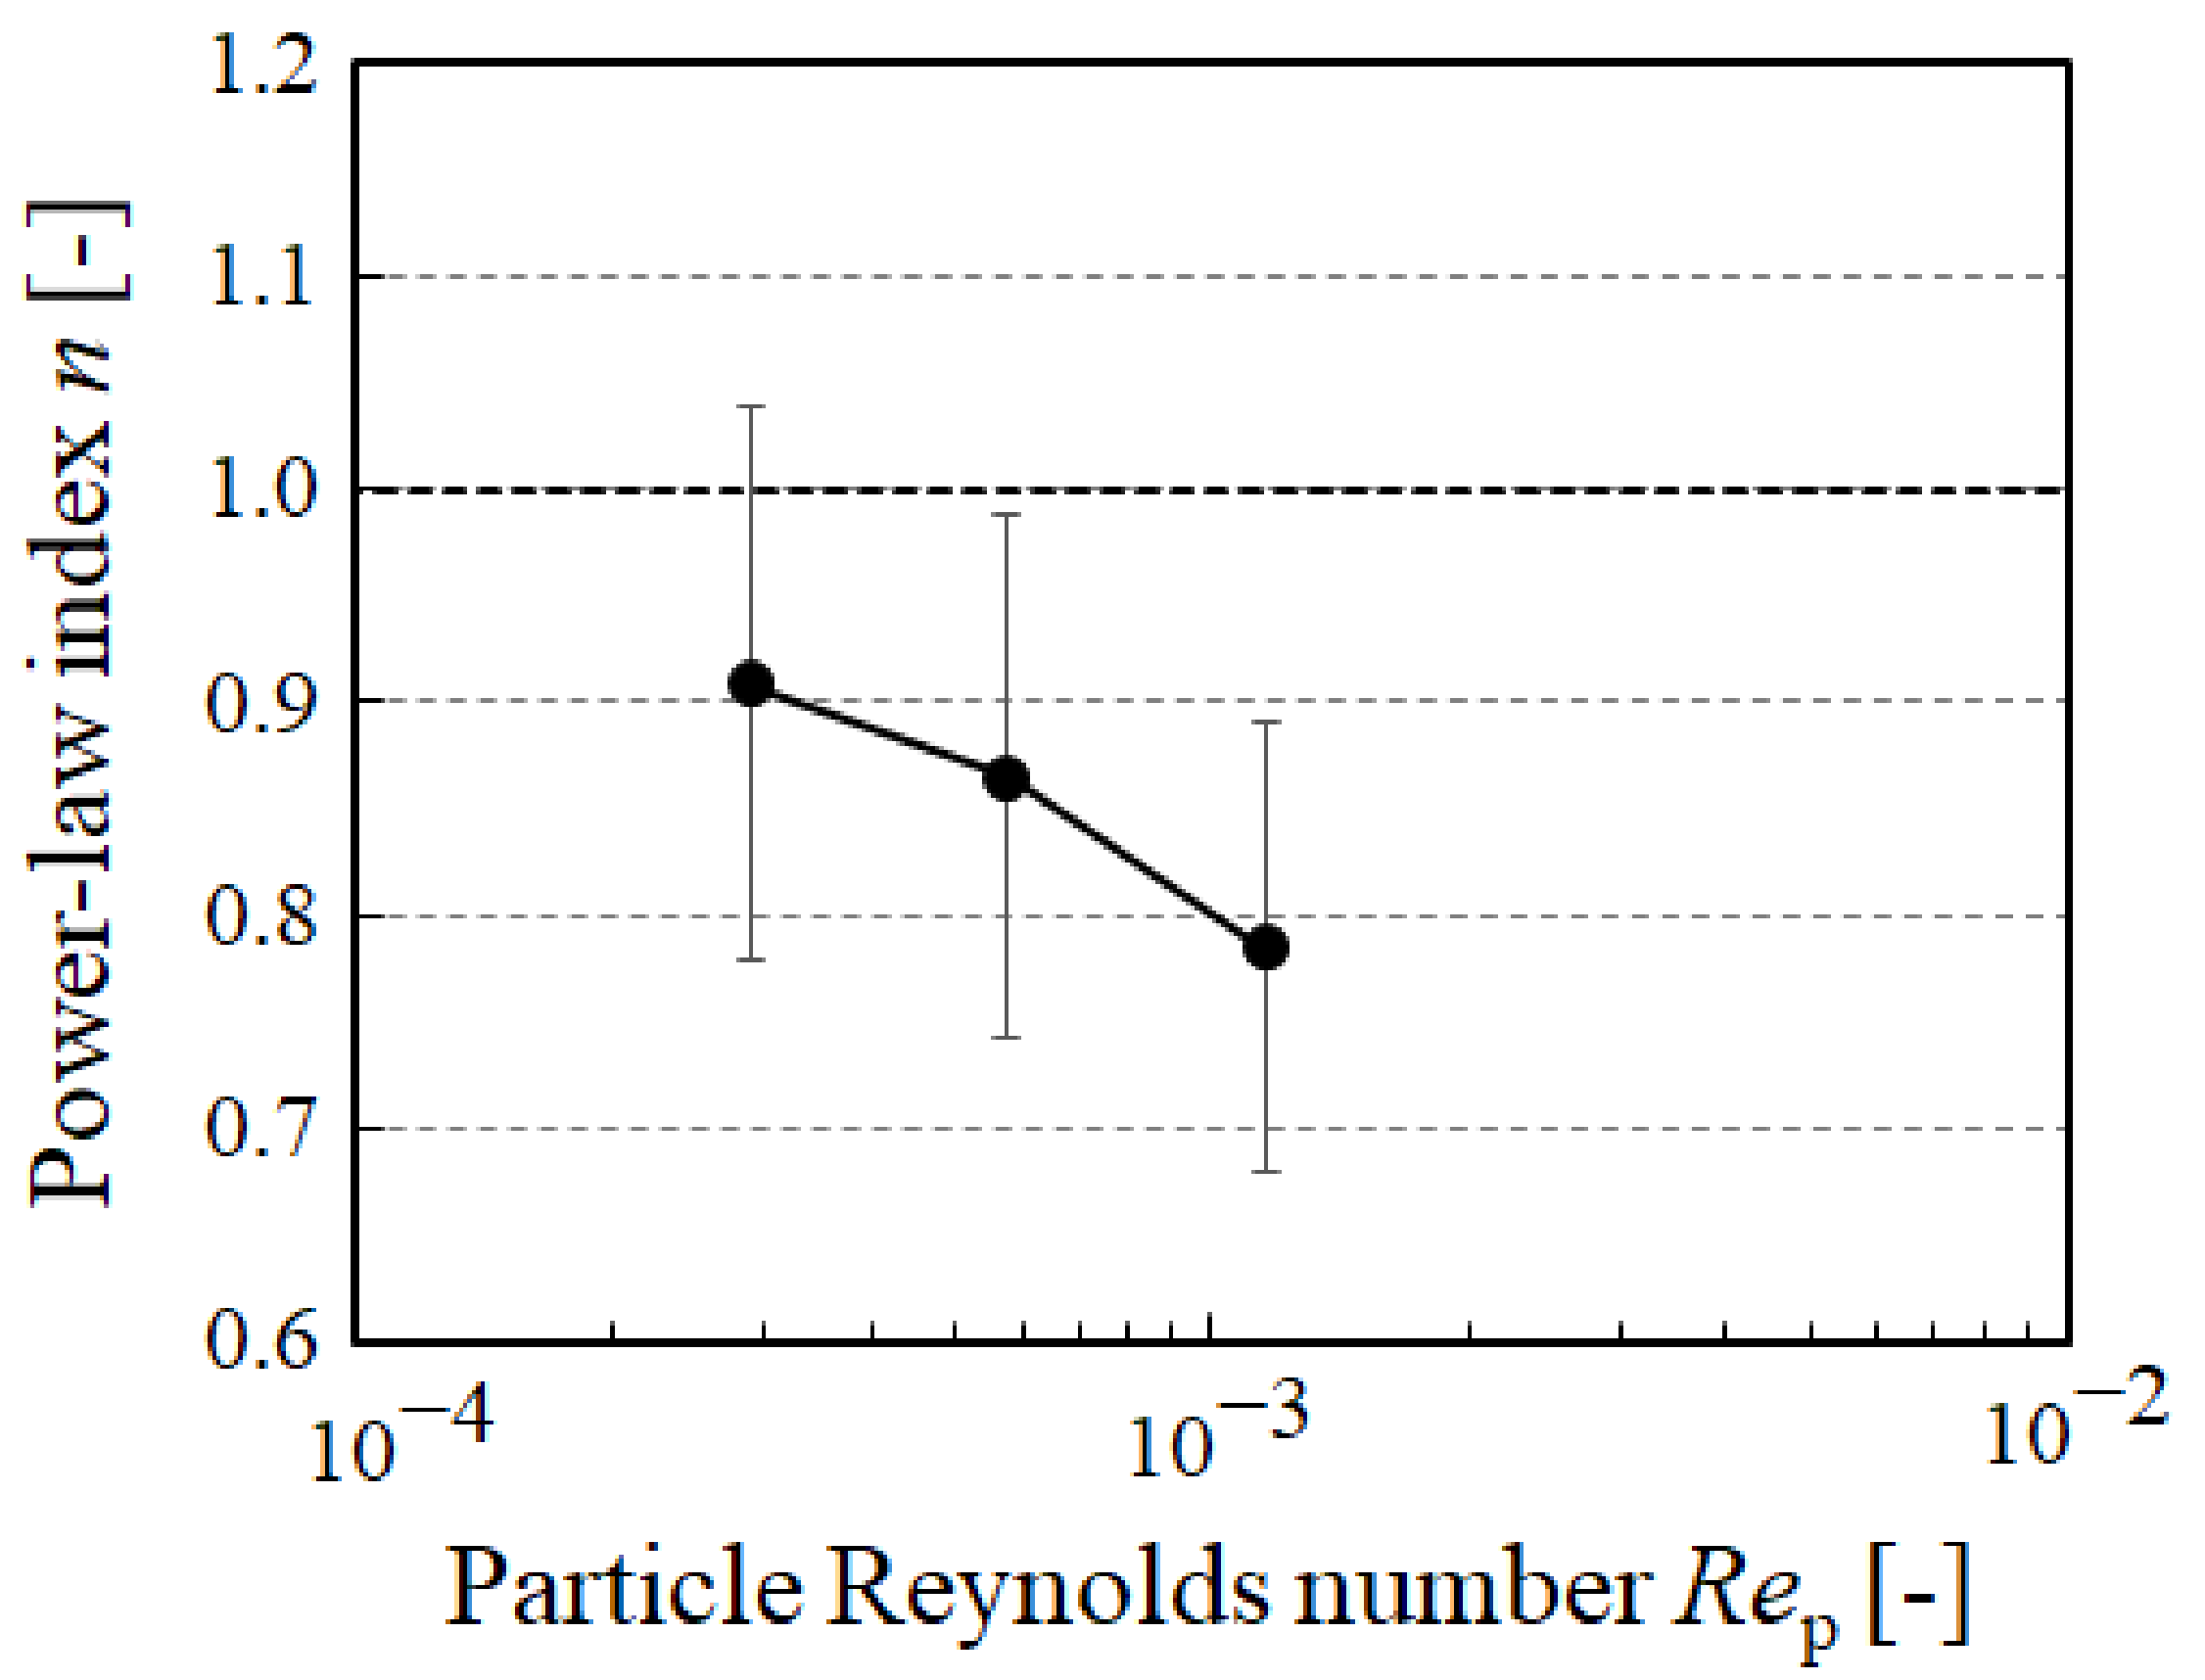
3. Results and Discussion
4. Conclusions
Author Contributions
Funding
Acknowledgments
Conflicts of Interest
References
- Mueller, S.; Llewellin, E.W.; Mader, H.M. The rheology of suspensions of solid particles. Proc. Math. Phys. Eng. Sci. 2010, 466, 1201–1228. [Google Scholar] [CrossRef]
- Chatté, G.; Comtet, J.; Niguès, A.; Bocquet, L.; Siria, A.; Ducouret, G.; Lequeux, F.; Lenoir, N.; Ovarlez, G.; Colin, A. Shear thinning in non-Brownian suspensions. Soft Matter 2018, 14, 879–893. [Google Scholar] [CrossRef] [PubMed]
- Cwalina, C.D.; Wagner, N.J. Material properties of the shear-thickened state in concentrated near hard-sphere colloidal dispersions. J. Rheol. 2014, 58, 949–967. [Google Scholar] [CrossRef]
- Nelson, A.Z.; Ewoldt, R.H. Design of yield-stress fluids: A rheology-to-structure inverse problem. Soft Matter 2017, 13, 7578–7594. [Google Scholar] [CrossRef] [PubMed]
- Yziquel, F.; Carreau, P.J.; Moan, M.; Tanguy, P.A. Rheological modeling of concentrated colloidal suspensions. J. Non-newton. Fluid Mech. 1999, 86, 133–155. [Google Scholar] [CrossRef]
- Dong, K.J.; Zou, R.P.; Yang, R.Y.; Yu, A.B.; Roach, G. DEM simulation of cake formation in sedimentation and filtration. Miner. Eng. 2009, 22, 921–930. [Google Scholar] [CrossRef]
- Shao, X.; Dong, D.; Parkinson, G.; Li, C.-Z. Microstructure control of oxygen permeation membranes with templated microchannels. J. Mater. Chem. A Mater. 2014, 2, 410–417. [Google Scholar] [CrossRef]
- Ness, C.; Ooi, J.Y.; Sun, J.; Marigo, M.; McGuire, P.; Xu, H.; Stitt, H. Linking particle properties to dense suspension extrusion flow characteristics using discrete element simulations. AIChE J. 2017, 63, 3069–3082. [Google Scholar] [CrossRef] [Green Version]
- Omori, T.; Ishikawa, T.; Imai, Y.; Yamaguchi, T. Shear-induced diffusion of red blood cells in a semi-dilute suspension. J. Fluid Mech. 2013, 724, 154–174. [Google Scholar] [CrossRef]
- Macmeccan, R.M.; Clausen, J.R.; Neitzel, G.P.; Aidun, C.K. Simulating deformable particle suspensions using a coupled lattice-Boltzmann and finite-element method. J. Fluid Mech. 2009, 618, 13–39. [Google Scholar] [CrossRef]
- Sangani, A.S.; Acrivos, A.; Peyla, P. Roles of particle-wall and particle-particle interactions in highly confined suspensions of spherical particles being sheared at low Reynolds numbers. Phys. Fluids 2011, 23, 083302. [Google Scholar] [CrossRef] [Green Version]
- Fukui, T.; Kawaguchi, M.; Morinishi, K. A two-way coupling scheme to model the effects of particle rotation on the rheological properties of a semidilute suspension. Comput. Fluids 2018, 173, 6–16. [Google Scholar] [CrossRef]
- Doyeux, V.; Priem, S.; Jibuti, L.; Farutin, A.; Ismail, M.; Peyla, P. Effective viscosity of two-dimensional suspensions: Confinement effects. Phys. Rev. Fluids 2016, 1, 043301. [Google Scholar] [CrossRef]
- Fornari, W.; Brandt, L.; Chaudhuri, P.; Lopez, C.U.; Mitra, D.; Picano, F. Rheology of confined non-Brownian suspensions. Phys. Rev. Lett. 2016, 116, 018301. [Google Scholar] [CrossRef] [PubMed]
- Davit, Y.; Peyla, P. Intriguing viscosity effects in confined suspensions: A numerical study. EPL 2008, 83, 64001. [Google Scholar] [CrossRef]
- Ramaswamy, M.; Lin, N.Y.C.; Leahy, B.D.; Ness, C.; Fiore, A.M.; Swan, J.W.; Cohen, I. How confinement-induced structures alter the contribution of hydrodynamic and short-ranged repulsion forces to the viscosity of colloidal suspensions. Phys. Rev. X 2017, 7, 041005. [Google Scholar] [CrossRef]
- Morris, J.F. A review of microstructure in concentrated suspensions and its implications for rheology and bulk flow. Rheol. Acta 2009, 48, 909–923. [Google Scholar] [CrossRef]
- Stickel, J.J.; Powell, R.L. Fluid mechanics and rheology of dense suspensions. Annu. Rev. Fluid Mech. 2005, 37, 129–149. [Google Scholar] [CrossRef]
- Fukui, T.; Kawaguchi, M.; Morinishi, K. Numerical study on the inertial effects of particles on the rheology of a suspension. Adv. Mech. Eng. 2019, 11, 1–10. [Google Scholar] [CrossRef]
- Yin, X.; Koch, D.L. Hindered settling velocity and microstructure in suspensions of solid spheres with moderate Reynolds numbers. Phys. Fluids 2007, 19, 093302. [Google Scholar] [CrossRef]
- Talini, L.; Leblond, J.; Feuillebois, F. A pulsed field gradient NMR technique for the determination of the structure of suspensions of non-Brownian particles with application to packings of spheres. J. Magn. Reson. 1998, 132, 287–297. [Google Scholar] [CrossRef] [PubMed]
- Gupta, S.; Wang, W.S.; Vanapalli, S.A. Microfluidic viscometers for shear rheology of complex fluids and biofluids. Biomicrofluidics 2016, 10, 043402. [Google Scholar] [CrossRef] [PubMed] [Green Version]
- Goyon, J.; Colin, A.; Ovarlez, G.; Ajdari, A.; Bocquet, L. Spatial cooperativity in soft glassy flows. Nature 2008, 454, 84–87. [Google Scholar] [CrossRef]
- Degré, G.; Joseph, P.; Tabeling, P.; Lerouge, S.; Cloitre, M.; Ajdari, A. Rheology of complex fluids by particle image velocimetry in microchannels. Appl. Phys. Lett. 2006, 89, 024104. [Google Scholar] [CrossRef]
- Nordstrom, K.N.; Verneuil, E.; Arratia, P.E.; Basu, A.; Zhang, Z.; Yodh, A.G.; Gollub, J.P.; Durian, D.J. Microfluidic rheology of soft colloids above and below jamming. Phys. Rev. Lett. 2010, 105, 175701. [Google Scholar] [CrossRef]
- Jesinghausen, S.; Weiffen, R.; Schmid, H.-J. Direct measurement of wall slip and slip layer thickness of non-Brownian hard-sphere suspensions in rectangular channel flows. Exp. Fluids 2016, 57, 153. [Google Scholar] [CrossRef]
- Kawaguchi, M.; Fukui, T.; Funamoto, K.; Miyauchi, S.; Hayase, T. Experimental study on the effects of radial dispersion of spherical particles on the suspension rheology. In Proceedings of the AJK Fluids 2019, San Francisco, CA, USA, 28 July–1 August 2019; Volume 5322, pp. 1–6. [Google Scholar]
- Borenstein, J.T.; Tupper, M.M.; MacK, P.J.; Weinberg, E.J.; Khalil, A.S.; Hsiao, J.; García-Cardeña, G. Functional endothelialized microvascular networks with circular cross-sections in a tissue culture substrate. Biomed. Microdevices 2010, 12, 71–79. [Google Scholar] [CrossRef]
- Jia, Y.; Jiang, J.; Ma, X.; Li, Y.; Huang, H.; Cai, K.; Cai, S.; Wu, Y. PDMS microchannel fabrication technique based on microwire-molding. Chin. Sci. Bull. 2008, 53, 3928–3936. [Google Scholar] [CrossRef] [Green Version]
- Verma, M.K.S.; Majumder, A.; Ghatak, A. Embedded template-assisted fabrication of complex microchannels in PDMS and design of a microfluidic adhesive. Langmuir 2006, 22, 10291–10295. [Google Scholar] [CrossRef]
- Lima, R.; Oliveira, M.S.N.; Ishikawa, T.; Kaji, H.; Tanaka, S.; Nishizawa, M.; Yamaguchi, T. Axisymmetric polydimethysiloxane microchannels for in vitro hemodynamic studies. Biofabrication 2009, 1, 035005. [Google Scholar] [CrossRef] [Green Version]
- Choi, J.S.; Piao, Y.; Seo, T.S. Fabrication of a circular PDMS microchannel for constructing a three-dimensional endothelial cell layer. Bioprocess Biosyst. Eng. 2013, 36, 1871–1878. [Google Scholar] [CrossRef] [PubMed]
- Dolega, M.E.; Wagh, J.; Gerbaud, S.; Kermarrec, F.; Alcaraz, J.-P.; Martin, D.K.; Gidrol, X.; Picollet-D’Hahan, N. Facile bench-top fabrication of enclosed circular microchannels provides 3D confined structure for growth of prostate epithelial cells. PLoS ONE 2014, 9, e99416. [Google Scholar] [CrossRef] [PubMed]
- Miura, K.; Itano, T.; Sugihara-Seki, M. Inertial migration of neutrally buoyant spheres in a pressure-driven flow through square channels. J. Fluid Mech. 2014, 749, 320–330. [Google Scholar] [CrossRef]
- Schneider, C.A.; Rasband, W.S.; Eliceiri, K.W. NIH Image to ImageJ: 25 years of image analysis. Nat. Methods 2012, 9, 671–675. [Google Scholar] [CrossRef] [PubMed]
- Schindelin, J.; Arganda-Carreras, I.; Frise, E.; Kaynig, V.; Longair, M.; Pietzsch, T.; Preibisch, S.; Rueden, C.; Saalfeld, S.; Schmid, B.; et al. Fiji: An open-source platform for biological-image analysis. Nat. Methods 2012, 9, 676–682. [Google Scholar] [CrossRef] [PubMed]
- Otsu, N. Threshhold selection method from gray level histograms. IEEE Trans. Syst. Man Cybern. 1979, 9, 62–66. [Google Scholar] [CrossRef]
- Doutel, E.; Carneiro, J.; Oliveira, M.S.N.; Campos, J.B.L.M.; Miranda, J.M. Fabrication of 3d mili-scale channels for hemodynamic studies. J. Mech. Med. Biol. 2015, 15, 1550004. [Google Scholar] [CrossRef]
- Bird, R.B.; Stewart, W.E.; Lightfoot, E.N. Transport Phenomena, 2nd ed.; Wiley Text Books: New York, NY, USA, 2002; pp. 232–233. [Google Scholar]
- Choi, Y.-S.; Lee, S.-J. Holographic analysis of three-dimensional inertial migration of spherical particles in micro-scale pipe flow. Microfluid. Nanofluidics 2010, 9, 819–829. [Google Scholar] [CrossRef]
- Segré, G.; Silberberg, A. Behaviour of macroscopic rigid spheres in Poiseuille flow: Part 2. Experimental results and interpretation. J. Fluid Mech. 1962, 14, 136–157. [Google Scholar] [CrossRef]
- Fukui, T.; Kawaguchi, M.; Morinishi, K. Relationship between macroscopic rheological properties and microstructure of a dilute suspension by a two-way coupling numerical scheme. In Proceedings of the AJK Fluids 2019, San Francisco, CA, USA, 28 July–1 August 2019; Volume 5449, pp. 1–6. [Google Scholar]
- Yan, Y.; Koplik, J. Transport and sedimentation of suspended particles in inertial pressure-driven flow. Phys. Fluids 2009, 21, 013301. [Google Scholar] [CrossRef]
- Hampton, R.E.; Mammoli, A.A.; Graham, A.L.; Tetlow, N.; Altobelli, S.A. Migration of particles undergoing pressure-driven flow in a circular conduit. J. Rheol. 1997, 41, 621–640. [Google Scholar] [CrossRef]
- Jabeen, Z.; Yu, H.-Y.; Eckmann, D.M.; Ayyaswamy, P.S.; Radhakrishnan, R. Rheology of colloidal suspensions in confined flow: Treatment of hydrodynamic interactions in particle-based simulations inspired by dynamical density functional theory. Phys. Rev. E 2018, 98, 042602. [Google Scholar] [CrossRef] [PubMed] [Green Version]
- Lecampion, B.; Garagash, D.I. Confined flow of suspensions modelled by a frictional rheology. J. Fluid Mech. 2014, 759, 197–235. [Google Scholar] [CrossRef] [Green Version]
- Xiong, W.; Zhang, J. Shear stress variation induced by red blood cell motion in microvessel. Ann. Biomed. Eng. 2010, 38, 2649–2659. [Google Scholar] [CrossRef] [PubMed]
- Freund, J.B.; Vermot, J. The wall-stress footprint of blood cells flowing in microvessels. Biophys. J. 2014, 106, 752–762. [Google Scholar] [CrossRef] [PubMed]
- Tare, M.; Parkington, H.C.; Coleman, H.A.; Neild, T.O.; Dusting, G.J. Hyperpolarization and relaxation of arterial smooth muscle caused by nitric oxide derived from the endothelium. Nature 1990, 346, 69–71. [Google Scholar] [CrossRef] [PubMed]
- Dolan, J.M.; Kolega, J.; Meng, H. High wall shear stress and spatial gradients in vascular pathology: A review. Ann. Biomed. Eng. 2013, 41, 1411–1427. [Google Scholar] [CrossRef]
- Goldsmith, H.L. Red cell motions and wall interactions in tube flow. Fed. Proc. 1971, 30, 1578–1590. [Google Scholar]
- Segré, G.; Silberberg, A. Radial particle displacements in poiseuille flow of suspensions. Nature 1961, 189, 209–210. [Google Scholar] [CrossRef]
- Matas, J.-P.; Morris, J.F.; Guazzelli, É. Inertial migration of rigid spherical particles in Poiseuille flow. J. Fluid Mech. 2004, 515, 171–195. [Google Scholar] [CrossRef] [Green Version]
- Inamuro, T.; Maeba, K.; Ogino, F. Flow between parallel walls containing the lines of neutrally buoyant circular cylinders. Int. J. Multiph. Flow 2000, 26, 1981–2004. [Google Scholar] [CrossRef]


| Re (-) | Rep (-) | Time (s) | Frame Rate (fps) |
|---|---|---|---|
| 0.125 | 2.9 × 10⁻⁴ | 200 | 5 |
| 0.25 | 5.8 × 10⁻⁴ | 100 | 10 |
| 0.5 | 1.2 × 10⁻³ | 50 | 20 |
© 2019 by the authors. Licensee MDPI, Basel, Switzerland. This article is an open access article distributed under the terms and conditions of the Creative Commons Attribution (CC BY) license (http://creativecommons.org/licenses/by/4.0/).
Share and Cite
Kawaguchi, M.; Fukui, T.; Funamoto, K.; Tanaka, M.; Tanaka, M.; Murata, S.; Miyauchi, S.; Hayase, T. Viscosity Estimation of a Suspension with Rigid Spheres in Circular Microchannels Using Particle Tracking Velocimetry. Micromachines 2019, 10, 675. https://doi.org/10.3390/mi10100675
Kawaguchi M, Fukui T, Funamoto K, Tanaka M, Tanaka M, Murata S, Miyauchi S, Hayase T. Viscosity Estimation of a Suspension with Rigid Spheres in Circular Microchannels Using Particle Tracking Velocimetry. Micromachines. 2019; 10(10):675. https://doi.org/10.3390/mi10100675
Chicago/Turabian StyleKawaguchi, Misa, Tomohiro Fukui, Kenichi Funamoto, Miho Tanaka, Mitsuru Tanaka, Shigeru Murata, Suguru Miyauchi, and Toshiyuki Hayase. 2019. "Viscosity Estimation of a Suspension with Rigid Spheres in Circular Microchannels Using Particle Tracking Velocimetry" Micromachines 10, no. 10: 675. https://doi.org/10.3390/mi10100675