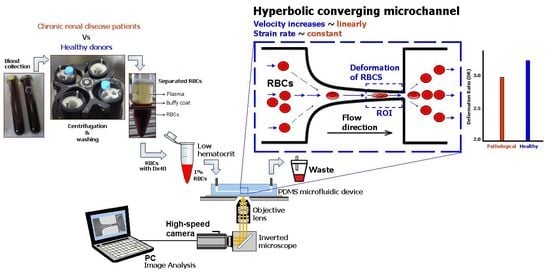
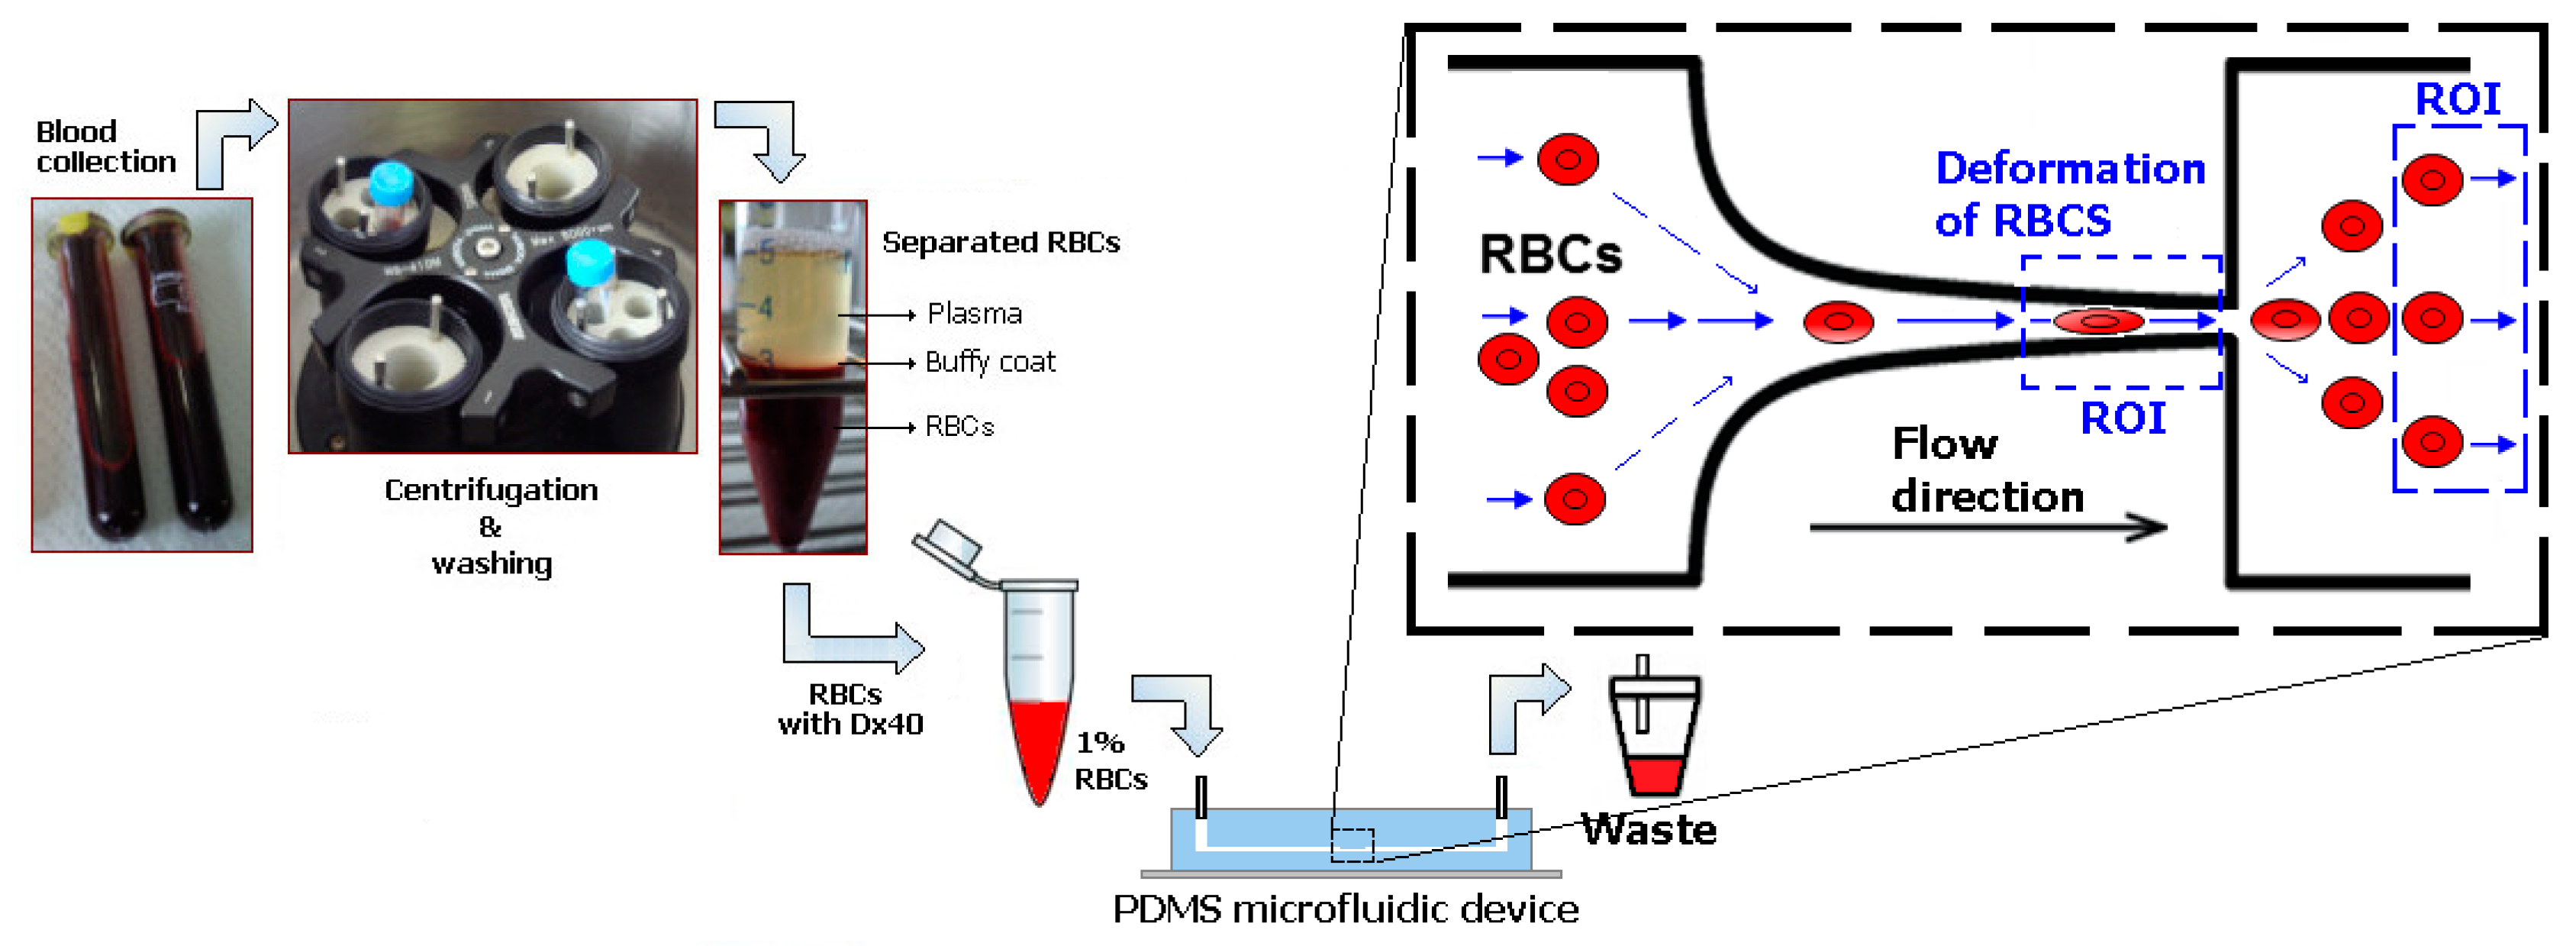
A Microfluidic Deformability Assessment of Pathological Red Blood Cells Flowing in a Hyperbolic Converging Microchannel

 , ,
, ,  ,
, 

 and
and 
Abstract
1. Introduction
2. Materials and Methods
2.1. Patients
2.2. Microfluidic Device, Experimental Setup and Parameters
2.3. Working Fluids
2.4. Statistical Analysis
3. Results and Discussion
4. Limitations and Future Directions
5. Conclusions
Supplementary Materials
Author Contributions
Funding
Acknowledgments
Conflicts of Interest
References
- Lee, G.Y.; Lim, C.T. Biomechanics approaches to studying human diseases. Trends Biotechnol. 2007, 25, 111–118. [Google Scholar] [PubMed]
- Tomaiuolo, G. Biomechanical properties of red blood cells in health and disease towards microfluidics. Biomicrofluidics 2014, 8, 051501. [Google Scholar] [PubMed]
- Siddhartha, T.; Kumar, Y.V.B.V.; Amit, P.; Suhas, S.J.; Amit, A. Passive blood plasma separation at the microscale: A review of design principles and microdevices. J. Micromech. Microeng. 2015, 25, 083001. [Google Scholar]
- Lima, R.; Ishikawa, T.; Imai, Y.; Yamaguchi, T. Blood Flow Behavior in Microchannels: Past, Current and Future Trends. In Single and Two-Phase Flows on Chemical and Biomedical Engineering; Dias, R., Martins, A.A., Lima, R., Mata, T.M., Eds.; Bentham Science: Sharjah, UAE, 2012; pp. 513–547. [Google Scholar]
- Abkarian, M.; Faivre, M.; Horton, R.; Smistrup, K.; Best-Popescu, C.A.; Stone, H.A. Cellular-scale hydrodynamics. Biomed. Mater. 2008, 3, 034011. [Google Scholar] [PubMed]
- Pinho, D.; Yaginuma, T.; Lima, R. A microfluidic device for partial cell separation and deformability assessment. BioChip J. 2013, 7, 367–374. [Google Scholar]
- Bento, D.; Fernandes, C.; Miranda, J.; Lima, R. In vitro blood flow visualizations and cell-free layer (CFL) measurements in a microchannel network. Exp. Therm. Fluid Sci. 2019, 109, 109847. [Google Scholar]
- Shevkoplyas, S.S.; Yoshida, T.; Gifford, S.C.; Bitensky, M.W. Direct measurement of the impact of impaired erythrocyte deformability on microvascular network perfusion in a microfluidic device. Lab Chip 2006, 6, 914. [Google Scholar]
- Sosa, J.M.; Nielsen, N.D.; Vignes, S.M.; Chen, T.G.; Shevkoplyas, S.S. The relationship between red blood cell deformability metrics and perfusion of an artificial microvascular network. Clin. Hemorheol. Microcirc. 2014, 57, 275–289. [Google Scholar]
- Boas, L.V.; Faustino, V.; Lima, R.; Miranda, J.M.; Minas, G.; Fernandes, C.S.V.; Catarino, S.O. Assessment of the Deformability and Velocity of Healthy and Artificially Impaired Red Blood Cells in Narrow Polydimethylsiloxane (PDMS) Microchannels. Micromachines 2018, 9, 384. [Google Scholar]
- Shelby, J.P.; White, J.; Ganesan, K.; Rathod, P.K.; Chiu, D.T. A microfluidic model for single-cell capillary obstruction by Plasmodium falciparum-infected erythrocytes. Proc. Natl. Acad. Sci. USA 2003, 100, 14618–14622. [Google Scholar]
- Dao, M.; Lim, C.T.; Suresh, S. Mechanics of the human red blood cell deformed by optical tweezers. J. Mech. Phys. Solids 2003, 51, 2259–2280. [Google Scholar]
- Agrawal, R.; Smart, T.; Nobre-Cardoso, J.; Richards, C.; Bhatnagar, R.; Tufail, A.; Shima, D.; Jones, P.H.; Pavesio, C. Assessment of red blood cell deformability in type 2 diabetes mellitus and diabetic retinopathy by dual optical tweezers stretching technique. Sci. Rep. 2016, 6, 15873. [Google Scholar] [PubMed]
- Shin, S.; Ku, Y.-H.; Ho, J.-X.; Kim, Y.-K.; Suh, J.-S.; Singh, M. Progressive impairment of erythrocyte deformability as indicator of microangiopathy in type 2 diabetes mellitus. Clin. Hemorheol. Microcirc. 2007, 36, 253–261. [Google Scholar] [PubMed]
- Tsukada, K.; Sekizuka, E.; Oshio, C.; Minamitani, H. Direct Measurement of Erythrocyte Deformability in Diabetes Mellitus with a Transparent Microchannel Capillary Model and High-Speed Video Camera System. Microvasc. Res. 2001, 61, 231–239. [Google Scholar]
- Bento, D.; Rodrigues, R.O.; Faustino, V.; Pinho, D.; Fernandes, C.S.; Pereira, A.I.; Garcia, V.; Miranda, J.M.; Lima, R. Deformation of Red Blood Cells, Air Bubbles, and Droplets in Microfluidic Devices: Flow Visualizations and Measurements. Micromachines 2018, 9, 151. [Google Scholar]
- Musielak, M. Red blood cell-deformability measurement: Review of techniques. Clin. Hemorheol. Microcirc. 2009, 42, 47–64. [Google Scholar]
- Xue, C.; Wang, J.; Zhao, Y.; Chen, D.; Yue, W.; Chen, J. Constriction Channel Based Single-Cell Mechanical Property Characterization. Micromachines 2015, 6, 1794–1804. [Google Scholar]
- Pinho, D.; Campo-Deaño, L.; Lima, R.; Pinho, F.T. In vitro particulate analogue fluids for experimental studies of rheological and hemorheological behavior of glucose-rich RBC suspensions. Biomicrofluidics 2017, 11, 054105. [Google Scholar]
- Pinho, D.; Rodrigues, R.O.; Faustino, V.; Yaginuma, T.; Exposto, J.; Lima, R. Red blood cells radial dispersion in blood flowing through microchannels: The role of temperature. J. Biomech. 2016, 49, 2293–2298. [Google Scholar]
- Sousa, P.C.; Carneiro, J.; Vaz, R.; Cerejo, A.; Pinho, F.T.; Alves, M.A.; Oliveira, M.S. Shear viscosity and nonlinear behavior of whole blood under large amplitude oscillatory shear. Biorheology 2013, 50, 269–282. [Google Scholar]
- Faustino, V.; Catarino, S.O.; Lima, R.; Minas, G. Biomedical microfluidic devices by using low-cost fabrication techniques: A review. J. Biomech. 2016, 49, 2280–2292. [Google Scholar] [PubMed]
- Wei, Y.; Zheng, Y.; Nguyen, J.; Sun, Y. Recent advances in microfluidic techniques for single-cell biophysical characterization. Lab Chip 2013, 13, 2464. [Google Scholar]
- Catarino, S.O.; Rodrigues, R.O.; Pinho, D.; Miranda, J.M.; Minas, G.; Lima, R. Blood Cells Separation and Sorting Techniques of Passive Microfluidic Devices: From Fabrication to Applications. Micromachines 2019, 10, 593. [Google Scholar]
- Quinn, D.J.; Pivkin, I.; Wong, S.Y.; Chiam, K.H.; Dao, M.; Karniadakis, G.E.; Suresh, S. Combined simulation and experimental study of large deformation of red blood cells in microfluidic systems. Ann. Biomed. Eng. 2011, 39, 1041–1050. [Google Scholar] [PubMed]
- Zeng, N.F.; Ristenpart, W.D. Mechanical response of red blood cells entering a constriction. Biomicrofluidics 2014, 8, 064123. [Google Scholar] [PubMed]
- Zhao, R.; Marhefka, J.N.; Shu, F.; Hund, S.J.; Kameneva, M.V.; Antaki, J.F. Micro-Flow Visualization of Red Blood Cell-Enhanced Platelet Concentration at Sudden Expansion. Ann. Biomed. Eng. 2008, 36, 1130–1141. [Google Scholar] [PubMed]
- Fujiwara, H.; Ishikawa, T.; Lima, R.; Matsuki, N.; Imai, Y.; Kaji, H.; Nishizawa, M.; Yamaguchi, T. Red blood cell motions in high-hematocrit blood flowing through a stenosed microchannel. J. Biomech. 2009, 42, 838–843. [Google Scholar]
- Gossett, D.R.; Tse, H.T.K.; Lee, S.A.; Ying, Y.; Lindgren, A.G.; Yang, O.O.; Rao, J.; Clark, A.T.; Di Carlo, D. Hydrodynamic stretching of single cells for large population mechanical phenotyping. Proc. Natl. Acad. Sci. USA 2012, 109, 7630–7635. [Google Scholar]
- Guillou, L.; Dahl, J.B.; Lin, J.-M.G.; Barakat, A.I.; Husson, J.; Muller, S.J.; Kumar, S. Measuring Cell Viscoelastic Properties Using a Microfluidic Extensional Flow Device. Biophys. J. 2016, 111, 2039–2050. [Google Scholar]
- Lee, S.S.; Yim, Y.; Ahn, K.H.; Lee, S.J. Extensional flow-based assessment of red blood cell deformability using hyperbolic converging microchannel. Biomed. Microdevices 2009, 11, 1021–1027. [Google Scholar]
- Rodrigues, R.O.; Bañobre-López, M.; Gallo, J.; Tavares, P.B.; Silva, A.M.T.; Lima, R.; Gomes, H.T. Haemocompatibility of iron oxide nanoparticles synthesized for theranostic applications: A high-sensitivity microfluidic tool. J. Nanopart. Res. 2016, 18, 1–17. [Google Scholar]
- Rodrigues, R.O.; Lopes, R.; Pinho, D.; Pereira, A.I.; Garcia, V.; Gassmann, S.; Sousa, P.C.; Lima, R. In vitro blood flow and cell-free layer in hyperbolic microchannels: Visualizations and measurements. BioChip J. 2016, 10, 9–15. [Google Scholar]
- Rodrigues, R.O.; Pinho, D.; Faustino, V.; Lima, R. A simple microfluidic device for the deformability assessment of blood cells in a continuous flow. Biomed. Microdevices 2015, 17, 108. [Google Scholar] [PubMed]
- Yaginuma, T.; Oliveira, M.S.N.; Lima, R.; Ishikawa, T.; Yamaguchi, T. Human red blood cell behavior under homogeneous extensional flow in a hyperbolic-shaped microchannel. Biomicrofluidics 2013, 7, 54110. [Google Scholar] [PubMed]
- Zografos, K.; Pimenta, F.; Alves, M.A.; Oliveira, M.S.N. Microfluidic converging/diverging channels optimised for homogeneous extensional deformation. Biomicrofluidics 2016, 10, 043508. [Google Scholar]
- Henon, Y.; Sheard, G.J.; Fouras, A. Erythrocyte deformation in a microfluidic cross-slot channel. RSC Adv. 2014, 4, 36079. [Google Scholar]
- Astor, B.C.; Muntner, P.; Levin, A.; Eustace, J.A.; Coresh, J. Association of kidney function with anemia: The Third National Health and Nutrition Examination Survey (1988–1994). Arch. Intern. Med. 2002, 162, 1401–1408. [Google Scholar]
- Staples, A.O.; Wong, C.S.; Smith, J.M.; Gipson, D.S.; Filler, G.; Warady, B.A.; Martz, K.; Greenbaum, L.A. Anemia and risk of hospitalization in pediatric chronic kidney disease. Clin. J. Am. Soc. Nephrol. CJASN 2009, 4, 48–56. [Google Scholar]
- Brines, M.; Grasso, G.; Fiordaliso, F.; Sfacteria, A.; Ghezzi, P.; Fratelli, M.; Latini, R.; Xie, Q.W.; Smart, J.; Su-Rick, C.J.; et al. Erythropoietin mediates tissue protection through an erythropoietin and common beta-subunit heteroreceptor. Proc. Natl. Acad. Sci. USA 2004, 101, 14907–14912. [Google Scholar]
- Robinson, B.M.; Joffe, M.M.; Berns, J.S.; Pisoni, R.L.; Port, F.K.; Feldman, H.I. Anemia and mortality in hemodialysis patients: Accounting for morbidity and treatment variables updated over time. Kidney Int. 2005, 68, 2323–2330. [Google Scholar]
- Yang, W.; Israni, R.K.; Brunelli, S.M.; Joffe, M.M.; Fishbane, S.; Feldman, H.I. Hemoglobin Variability and Mortality in ESRD. J. Am. Soc. Nephrol. JASN 2007, 18, 3164–3170. [Google Scholar] [PubMed]
- Faustino, V.; Pinho, D.; Yaginuma, T.; Calhelha, R.C.; Ferreira, I.C.; Lima, R. Extensional flow-based microfluidic device: Deformability assessment of red blood cells in contact with tumor cells. BioChip J. 2014, 8, 42–47. [Google Scholar]
- Faustino, V.; Pinho, D.; Yaginuma, T.; Calhelha, R.C.; Kim, G.M.; Arana, S.; Ferreira, I.C.F.R.; Oliveira, M.S.N.; Lima, R. Flow of Red Blood Cells Suspensions through Hyperbolic Microcontractions. In Visualization and Simulation of Complex Flows in Biomedical Engineering; Lima, R., Imai, Y., Ishikawa, T., Oliveira, M.S., Eds.; Springer: Dordrecht, The Netherlands, 2014; pp. 151–163. [Google Scholar]
- Lima, R.A.; Saadatmand, M.; Ishikawa, T. Microfluidic Devices Based on Biomechanics. In Integrated Nano-Biomechanics; Yamaguchi, T., Ishikawa, T., Imai, Y., Eds.; Elsevier: Boston, MA, USA, 2018; pp. 217–263. [Google Scholar] [CrossRef]
- Forsyth, A.M.; Wan, J.; Ristenpart, W.D.; Stone, H.A. The dynamic behavior of chemically “stiffened” red blood cells in microchannel flows. Microvasc. Res. 2010, 80, 37–43. [Google Scholar] [PubMed]
- Pinho, D.; Lima, R.; Pereira, A.I.; Gayubo, F. Automatic tracking of labeled red blood cells in microchannels. Int. J. Numer. Method Biomed. Eng. 2013, 29, 977–987. [Google Scholar] [CrossRef] [PubMed][Green Version]
- Rodrigues, V.; Rodrigues, P.J.; Pereira, A.I.; Lima, R. Automatic tracking of red blood cells in micro channels using OpenCV. In AIP Conference Proceedings; AIP Publishing: Melville, NY, USA, 2013; Volume 1558, p. 594. [Google Scholar] [CrossRef]
- Taboada, B.; Monteiro, F.; Lima, R. Automatic tracking and deformation measurements of red blood cells flowing through a microchannel with a microstenosis: The keyhole model. Comput. Methods Biomech. Biomed. Eng. Imaging Vis. 2016, 4, 229–237. [Google Scholar] [CrossRef]
- Schonbrun, E.; Malka, R.; Di Caprio, G.; Schaak, D.; Higgins, J.M. Quantitative Absorption Cytometry for Measuring Red Blood Cell Hemoglobin Mass and Volume. Cytometry A 2014, 85, 332–338. [Google Scholar] [CrossRef] [PubMed]


| Main Experimental Parameters | |
|---|---|
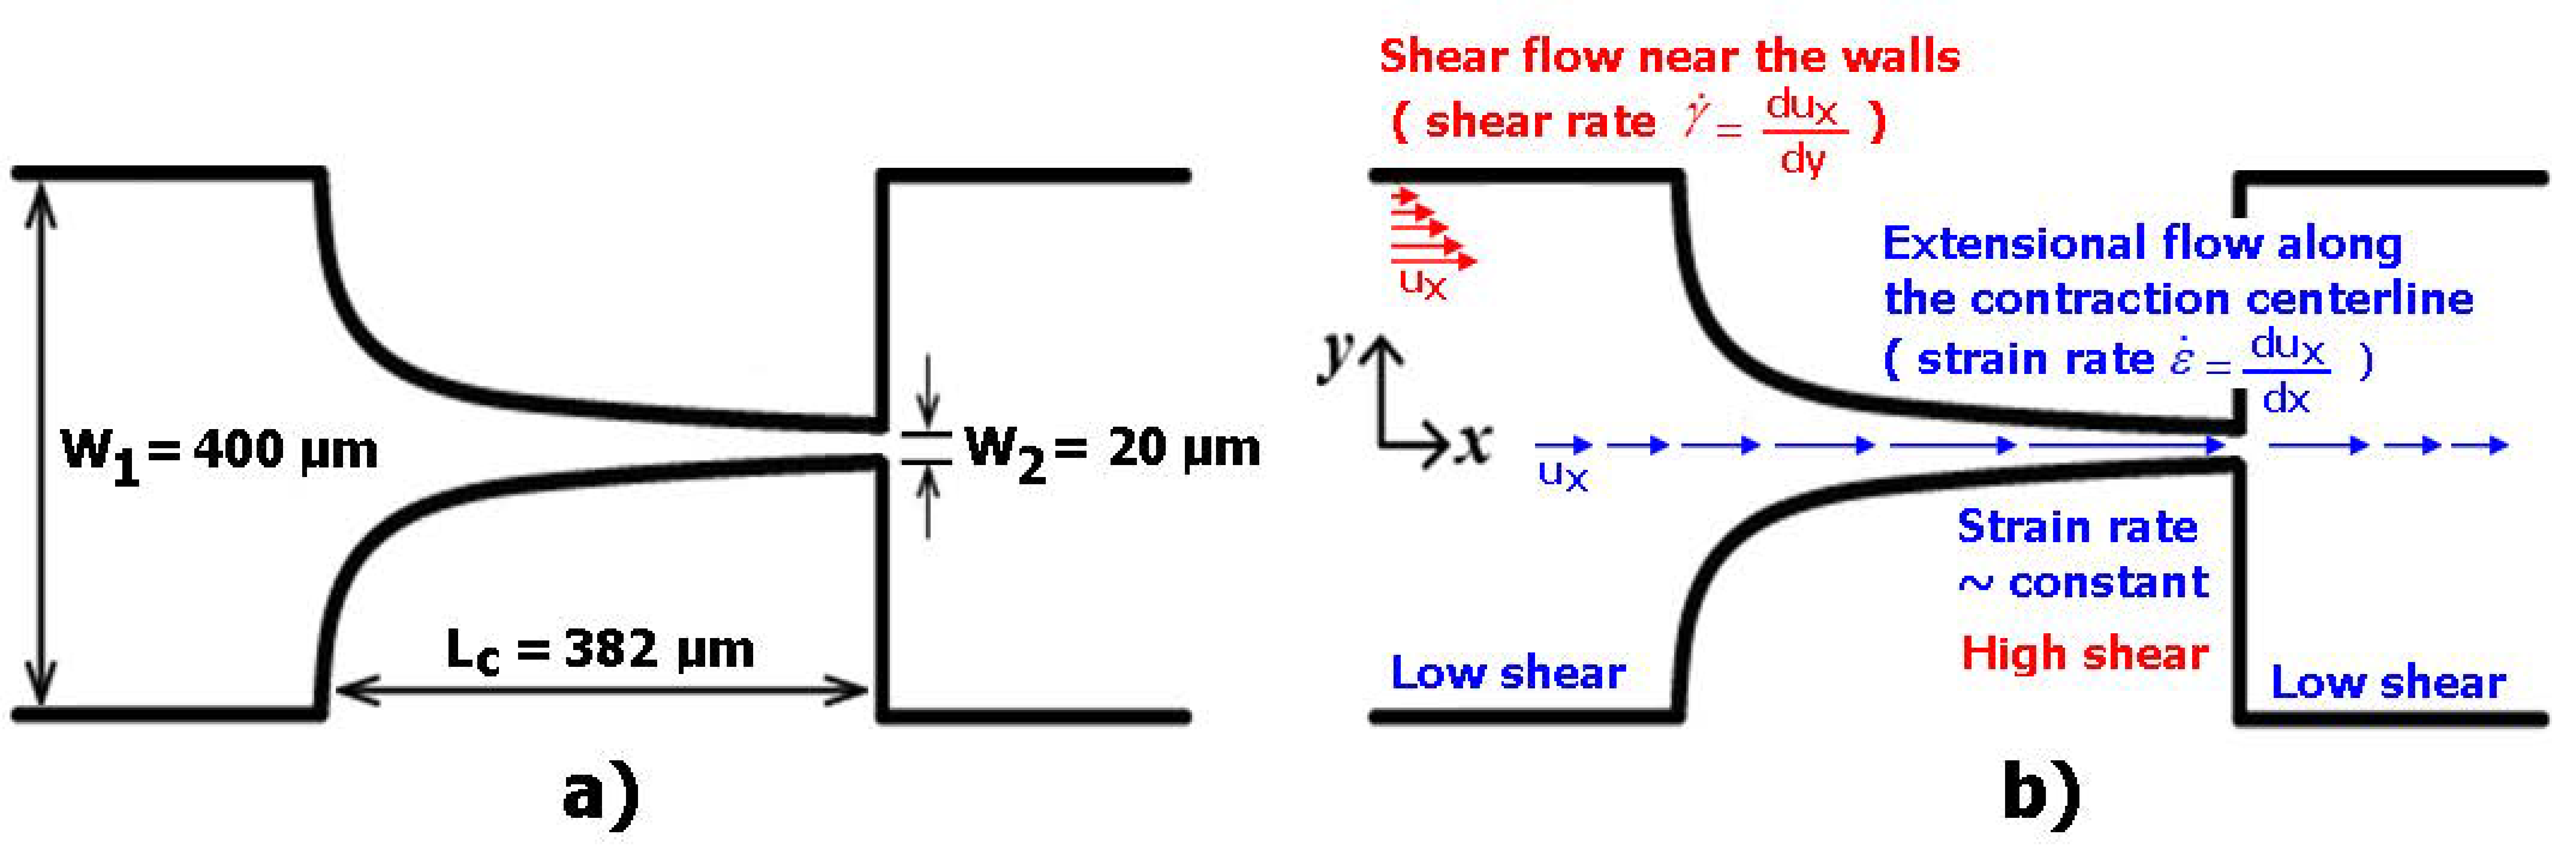
| Maximum width of the microchannel | 400 µm |
| Minimum width of the microchannel | 20 µm |
| Total length of the contraction region | 382 µm |
| Depth of the microchannel | 50 µm |
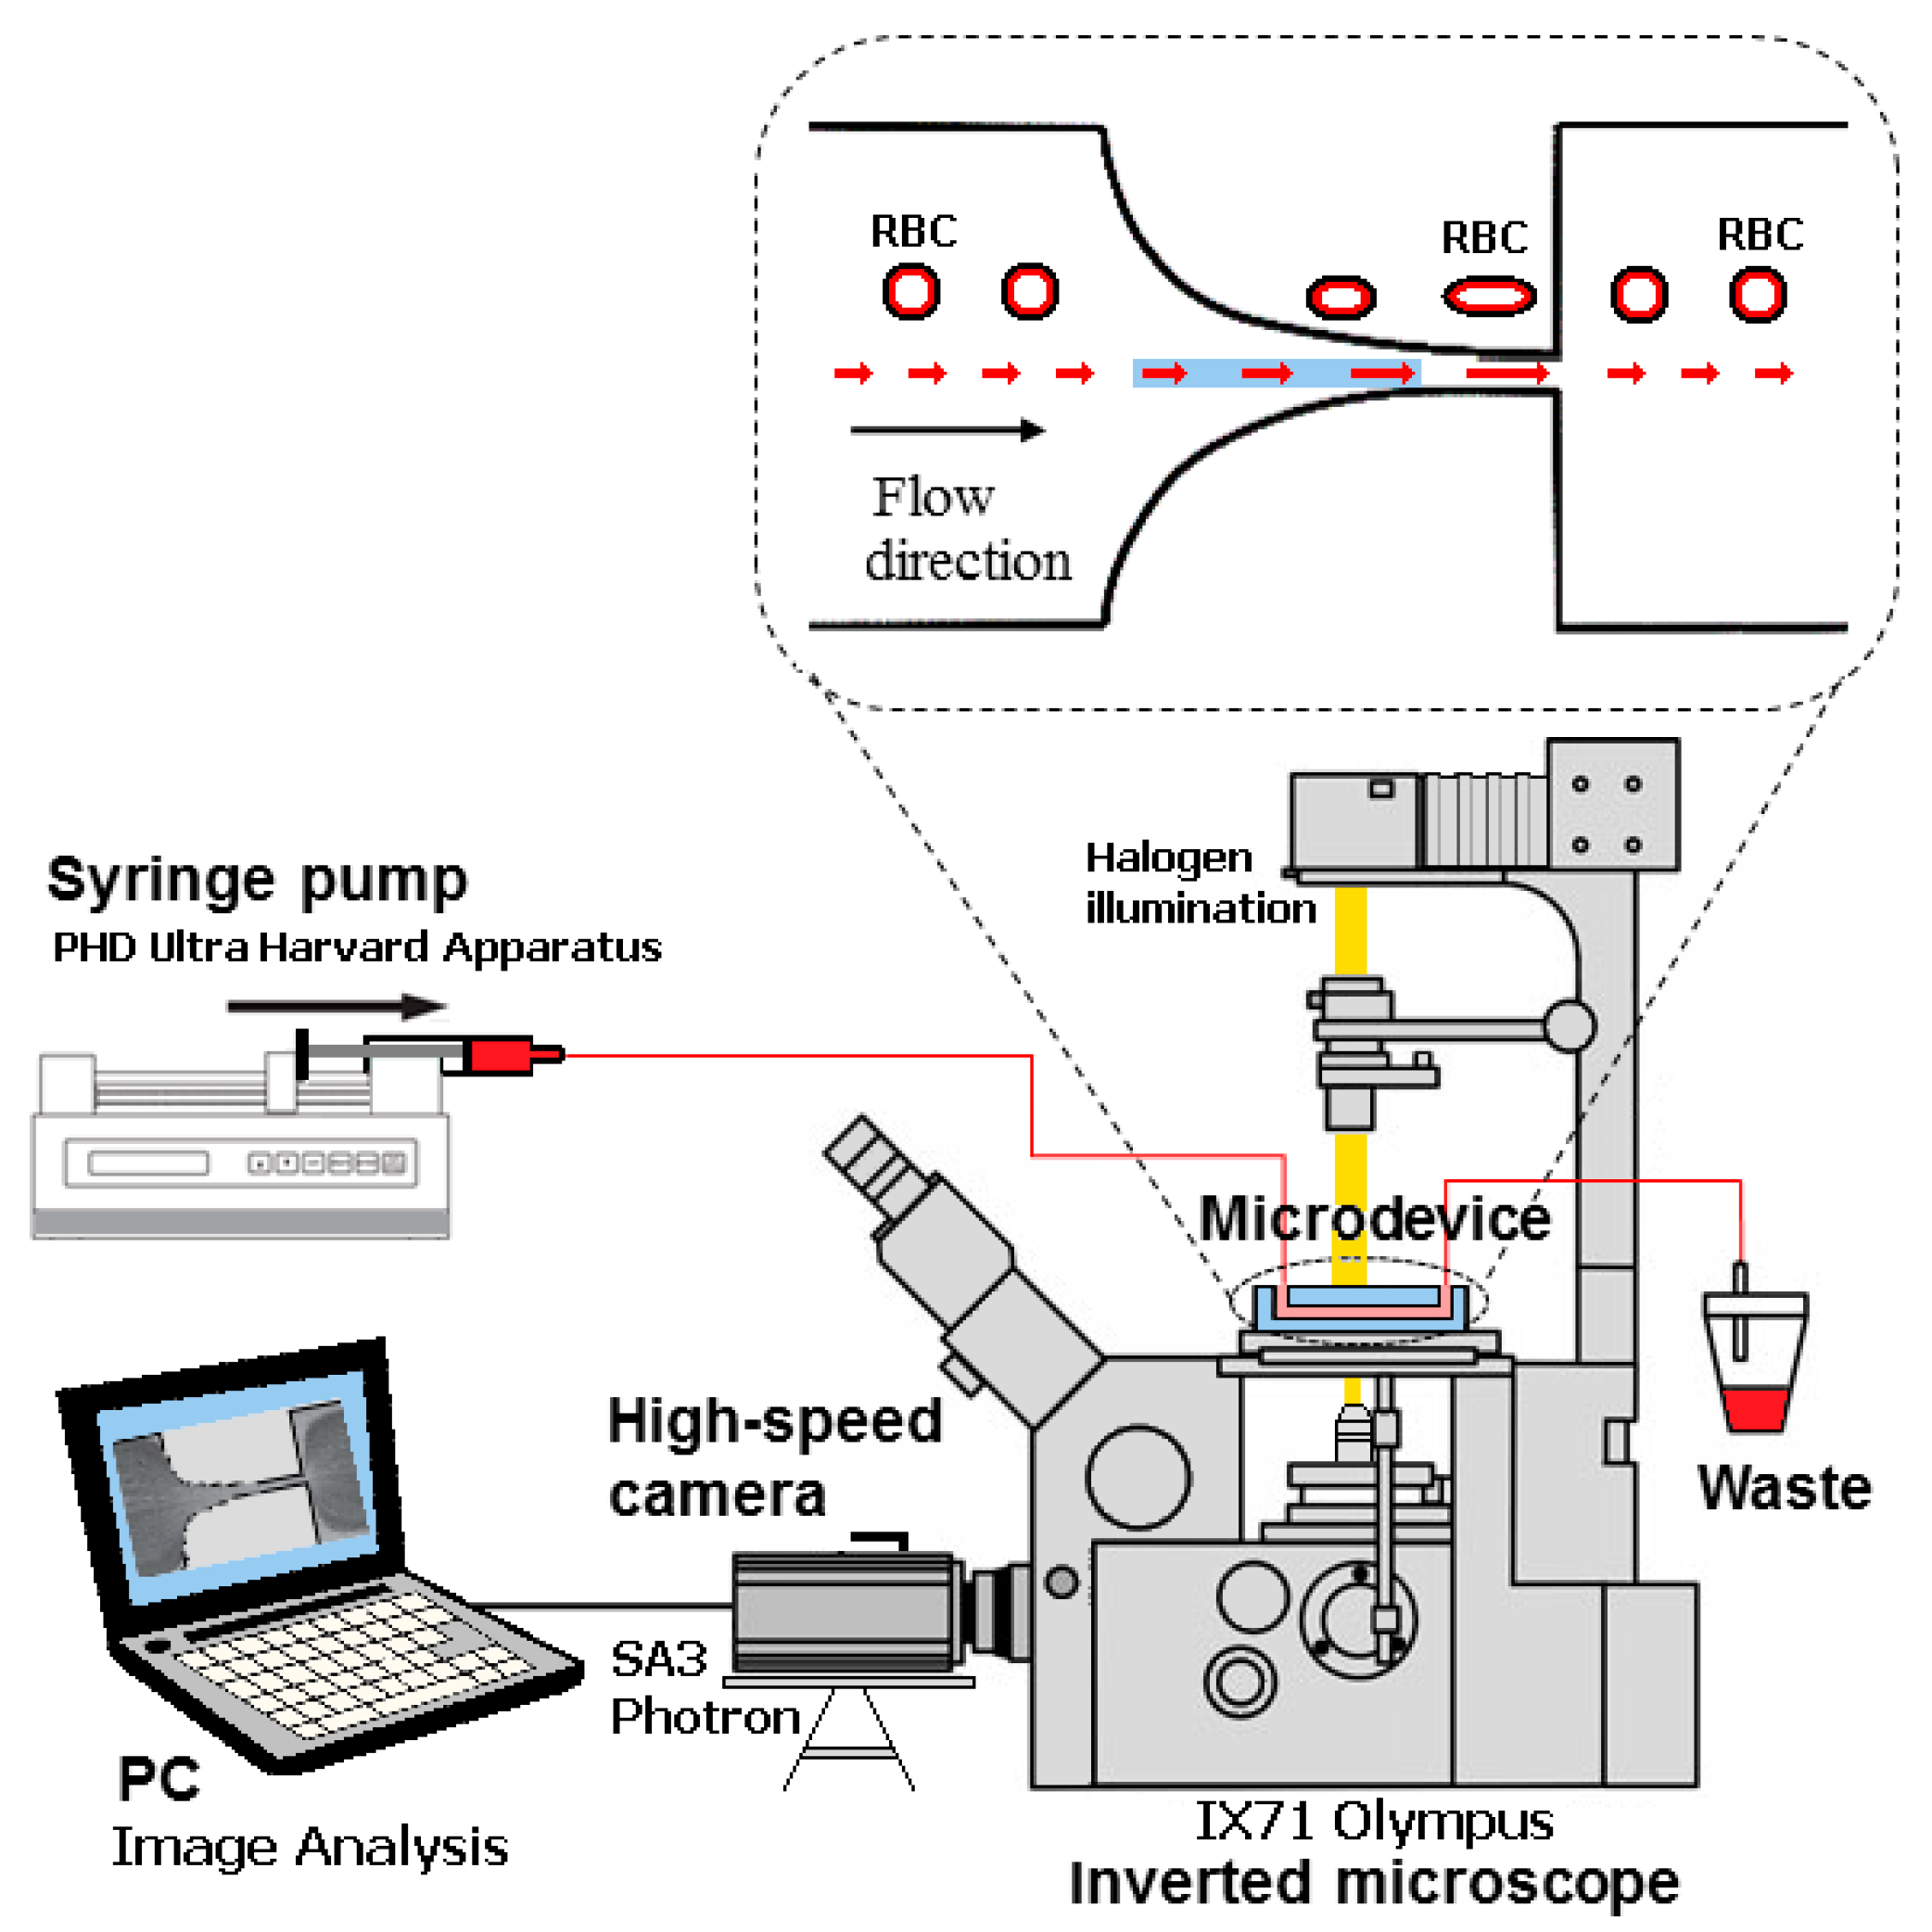
| Flow rate (syringe of 1 mL) | 3 µL/min |
| Average shear rate | 1750 s−1 |
| Shear viscosity of the Dextran 40 | 4.5 × 10⁻³ Pa·s |
| Density of the Dextran 40 | 1046 kg/m3 |
| Haematocrit of the working fluid | 1% |
| Temperature of the working fluid | 22 °C |
| Magnification (M) | 40× |
| Numerical Aperture (NA) | 0.75 |
| Frame rate | 3000 frames/s |
| Exposure time | 1/75,000 s |
| Blood Samples | Contraction Region DR | Expansion Region DR | ||
|---|---|---|---|---|
| Average | SD | Average | SD | |
| ESKD1 | 3.03 | 0.34 | 1.12 | 0.08 |
| ESKD2 | 2.79 | 0.36 | 1.10 | 0.09 |
| ESKD3 | 2.86 | 0.26 | 1.13 | 0.06 |
| ESKD4 | 3.11 | 0.25 | 1.14 | 0.08 |
| ESKD5 | 3.03 | 0.39 | 1.12 | 0.06 |
| ESKD6 | 3.15 | 0.37 | 1.15 | 0.07 |
| ESKD7 | 2.89 | 0.31 | 1.15 | 0.08 |
| ESKD8 | 2.93 | 0.26 | 1.16 | 0.05 |
| ESKD9 | 2.94 | 0.35 | 1.13 | 0.10 |
| ESKD10 | 3.02 | 0.24 | 1.10 | 0.05 |
| ESKD11 | 2.96 | 0.32 | 1.14 | 0.06 |
| ESKD12 | 3.17 | 0.35 | 1.13 | 0.08 |
| ESKDD1 | 2.78 | 0.25 | 1.12 | 0.05 |
| ESKDD2 | 2.60 | 0.27 | 1.13 | 0.07 |
| ESKDD3 | 3.01 | 0.32 | 1.15 | 0.05 |
| ESKDD4 | 3.02 | 0.32 | 1.13 | 0.08 |
| ESKDD5 | 2.72 | 0.37 | 1.14 | 0.07 |
| ESKDD6 | 2.74 | 0.28 | 1.16 | 0.08 |
| ESKDD7 | 2.69 | 0.34 | 1.14 | 0.08 |
| ESKDD8 | 2.81 | 0.43 | 1.11 | 0.06 |
| C1 | 2.99 | 0.21 | 1.14 | 0.07 |
| C2 | 3.12 | 0.23 | 1.13 | 0.06 |
| C3 | 3.28 | 0.22 | 1.13 | 0.10 |
| C4 | 3.23 | 0.27 | 1.12 | 0.06 |
| C5 | 3.24 | 0.31 | 1.15 | 0.07 |
| C6 | 3.07 | 0.30 | 1.14 | 0.07 |
| C7 | 3.27 | 0.27 | 1.15 | 0.06 |
© 2019 by the authors. Licensee MDPI, Basel, Switzerland. This article is an open access article distributed under the terms and conditions of the Creative Commons Attribution (CC BY) license (http://creativecommons.org/licenses/by/4.0/).
Share and Cite
Faustino, V.; Rodrigues, R.O.; Pinho, D.; Costa, E.; Santos-Silva, A.; Miranda, V.; Amaral, J.S.; Lima, R. A Microfluidic Deformability Assessment of Pathological Red Blood Cells Flowing in a Hyperbolic Converging Microchannel. Micromachines 2019, 10, 645. https://doi.org/10.3390/mi10100645
Faustino V, Rodrigues RO, Pinho D, Costa E, Santos-Silva A, Miranda V, Amaral JS, Lima R. A Microfluidic Deformability Assessment of Pathological Red Blood Cells Flowing in a Hyperbolic Converging Microchannel. Micromachines. 2019; 10(10):645. https://doi.org/10.3390/mi10100645
Chicago/Turabian StyleFaustino, Vera, Raquel O. Rodrigues, Diana Pinho, Elísio Costa, Alice Santos-Silva, Vasco Miranda, Joana S. Amaral, and Rui Lima. 2019. "A Microfluidic Deformability Assessment of Pathological Red Blood Cells Flowing in a Hyperbolic Converging Microchannel" Micromachines 10, no. 10: 645. https://doi.org/10.3390/mi10100645
APA StyleFaustino, V., Rodrigues, R. O., Pinho, D., Costa, E., Santos-Silva, A., Miranda, V., Amaral, J. S., & Lima, R. (2019). A Microfluidic Deformability Assessment of Pathological Red Blood Cells Flowing in a Hyperbolic Converging Microchannel. Micromachines, 10(10), 645. https://doi.org/10.3390/mi10100645