
Association Between Psychobehavioral Factors and the Increased Eating Rate of Ultra-Processed Versus Non-Ultra-Processed Meals in Individuals with Obesity: A Secondary Analysis of a Randomized Trial

 , , , , and
Abstract

1. Introduction
2. Materials and Methods
2.1. Experimental Design
2.2. Location, Sample, and Sampling
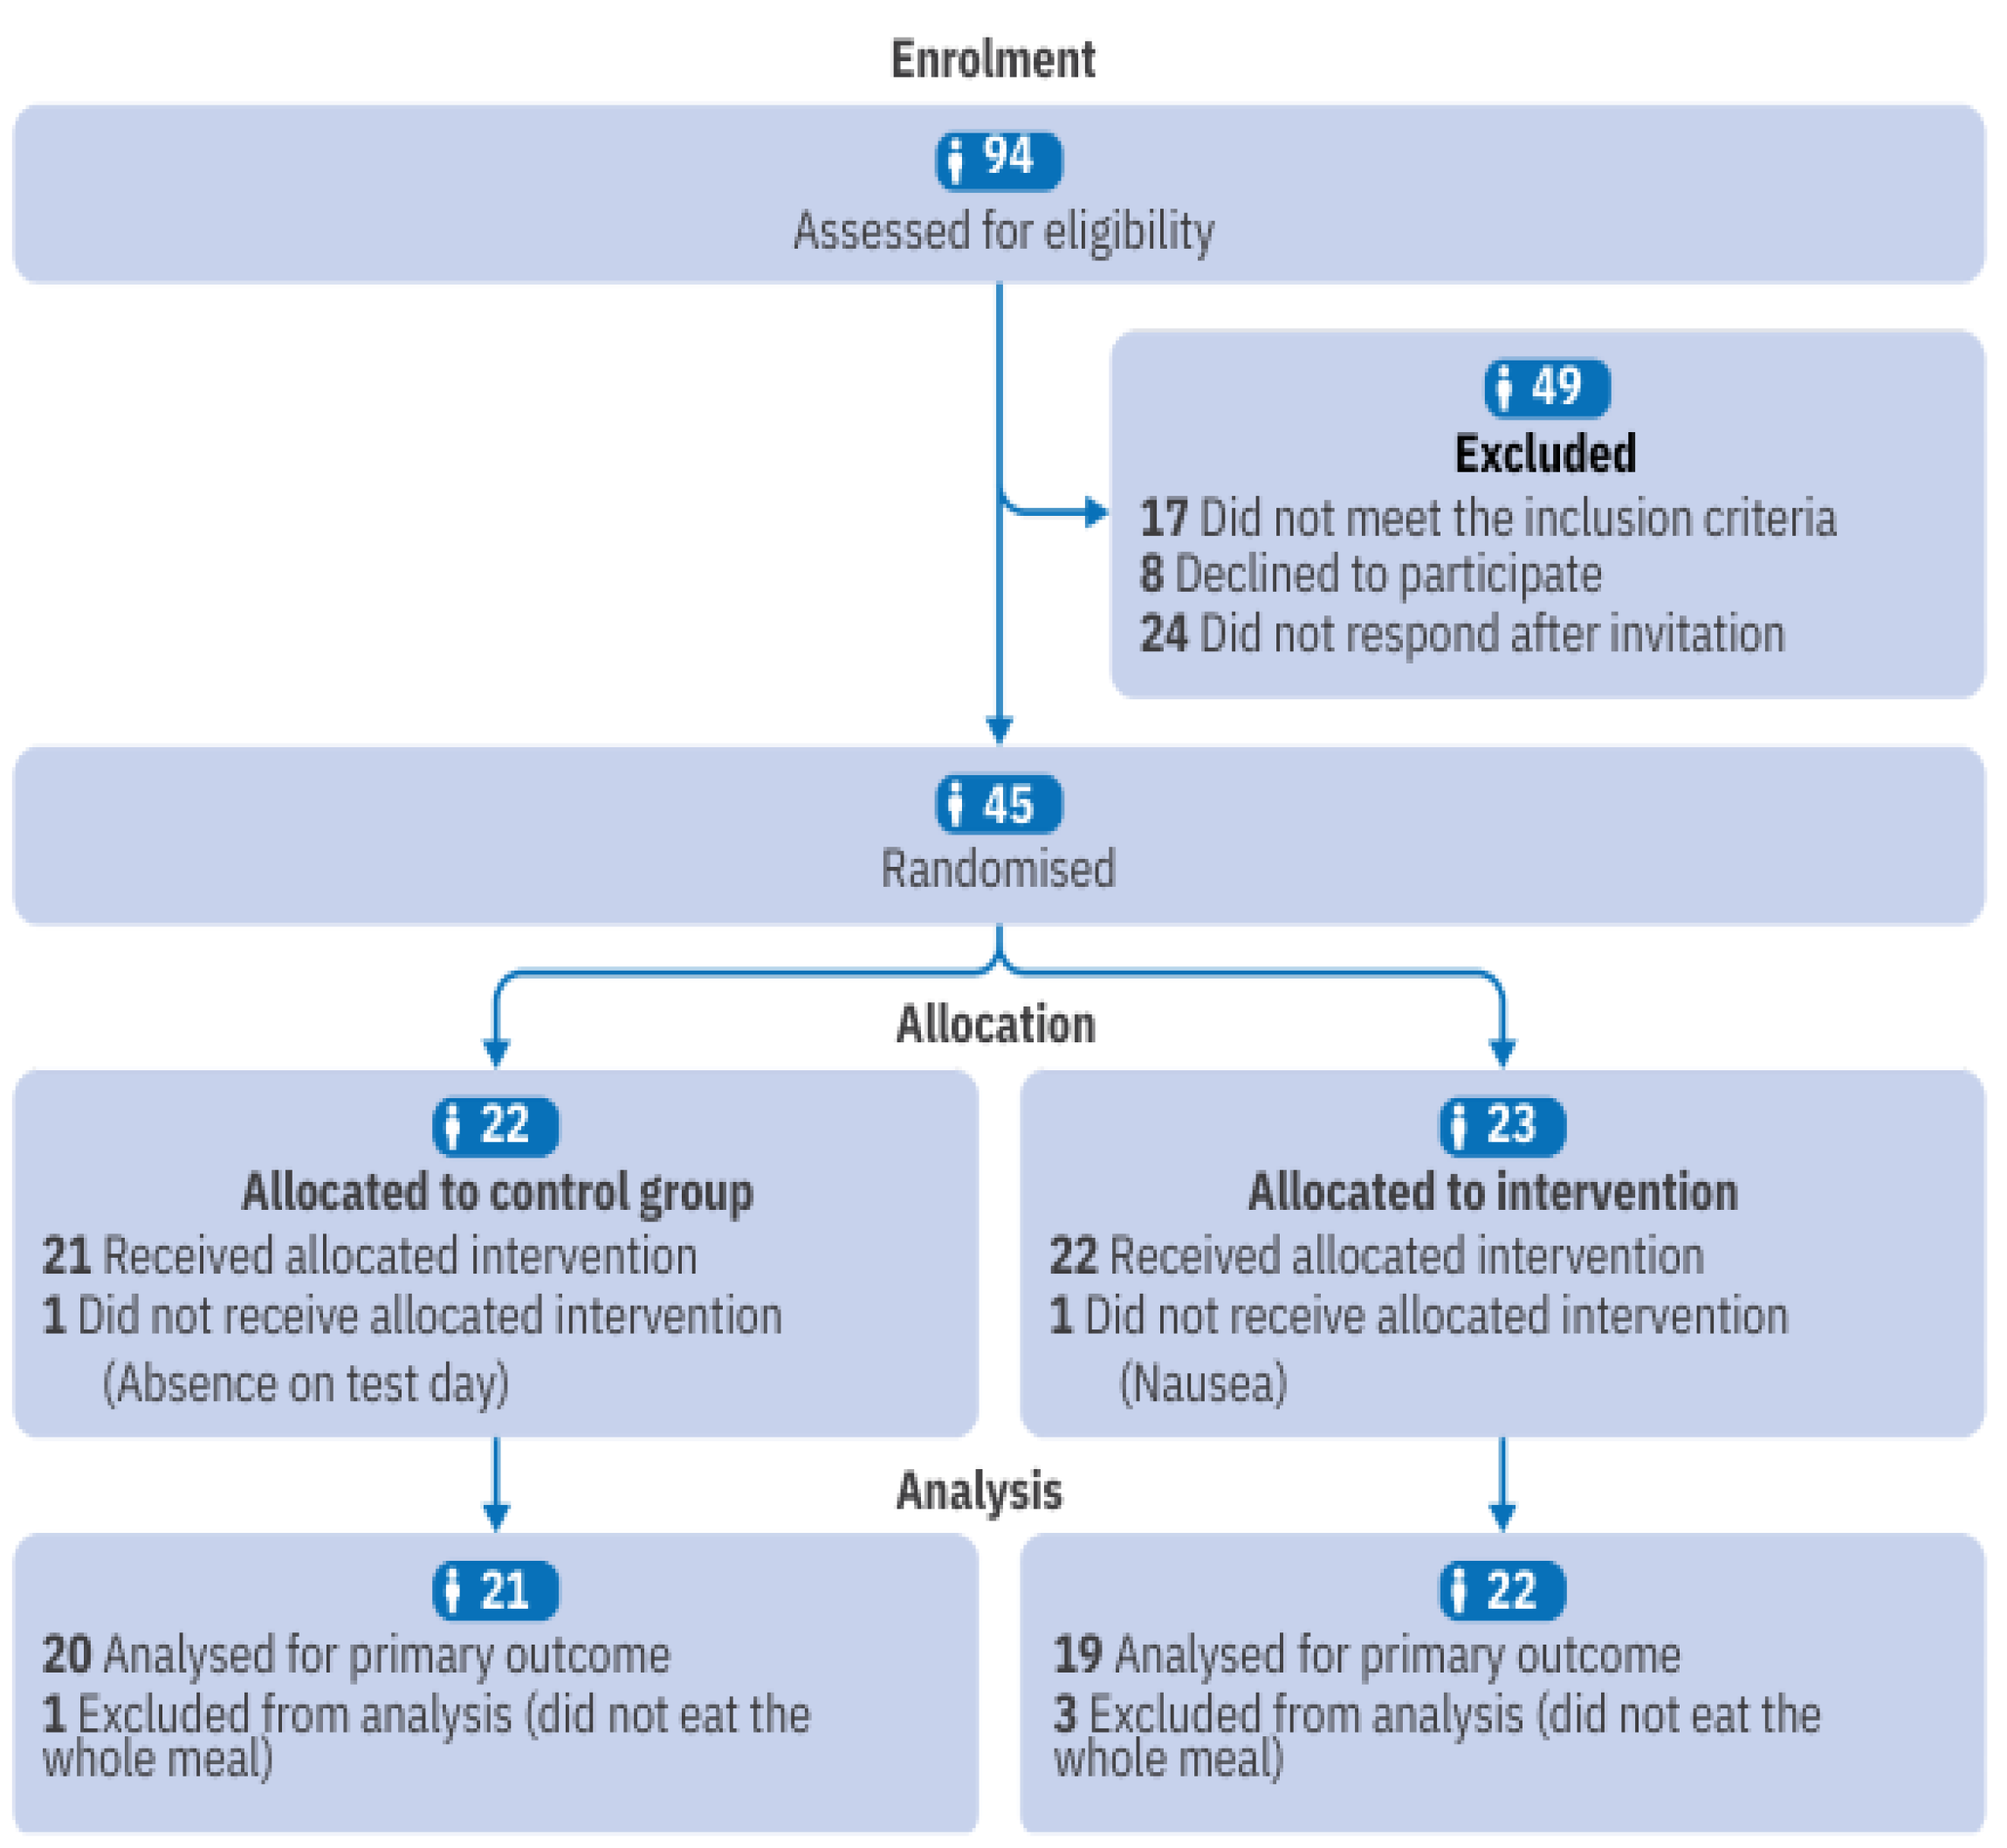
2.3. Randomization and Allocation
2.4. Procedures
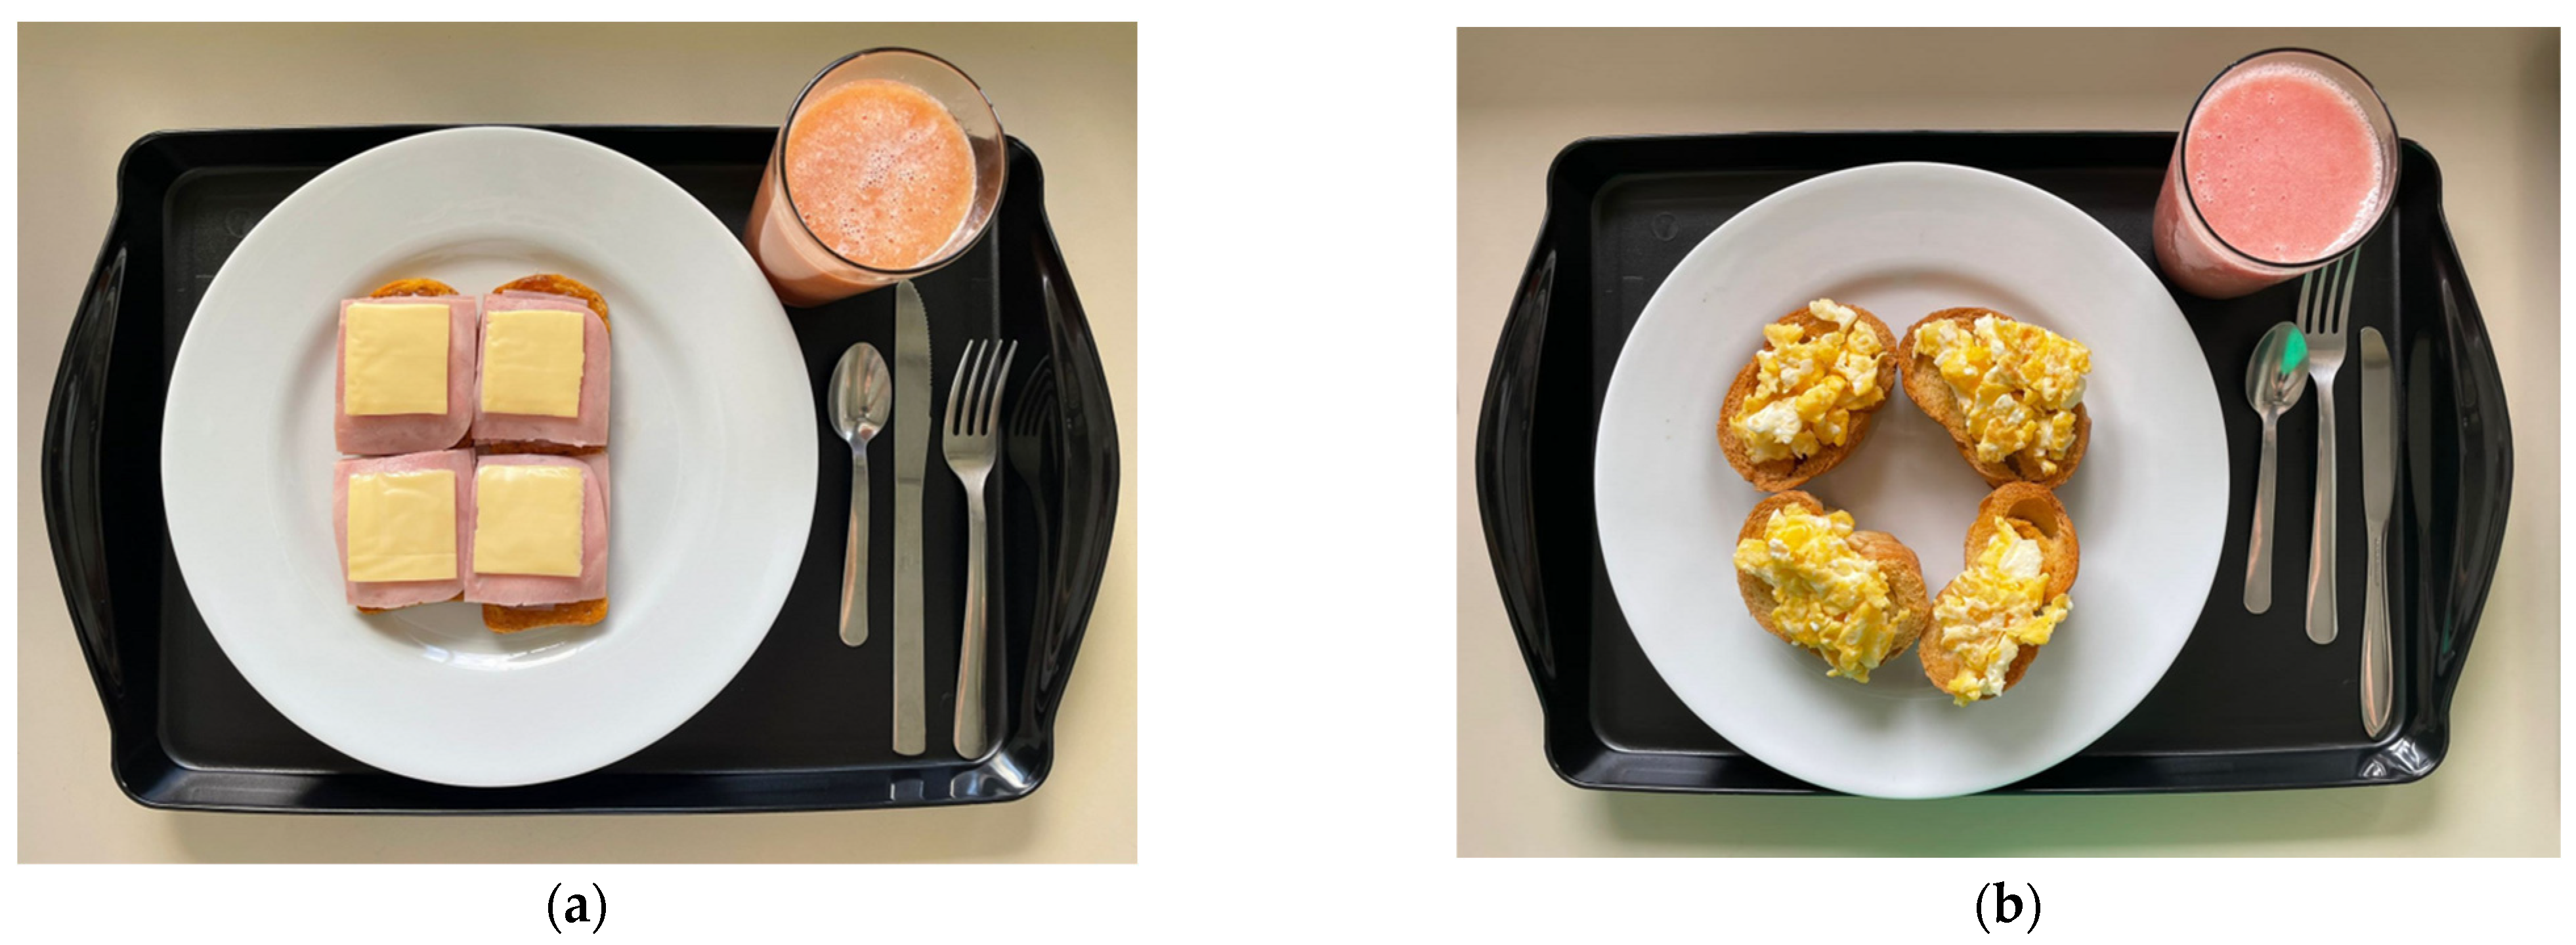
2.5. Test Meals
2.6. Food Addiction
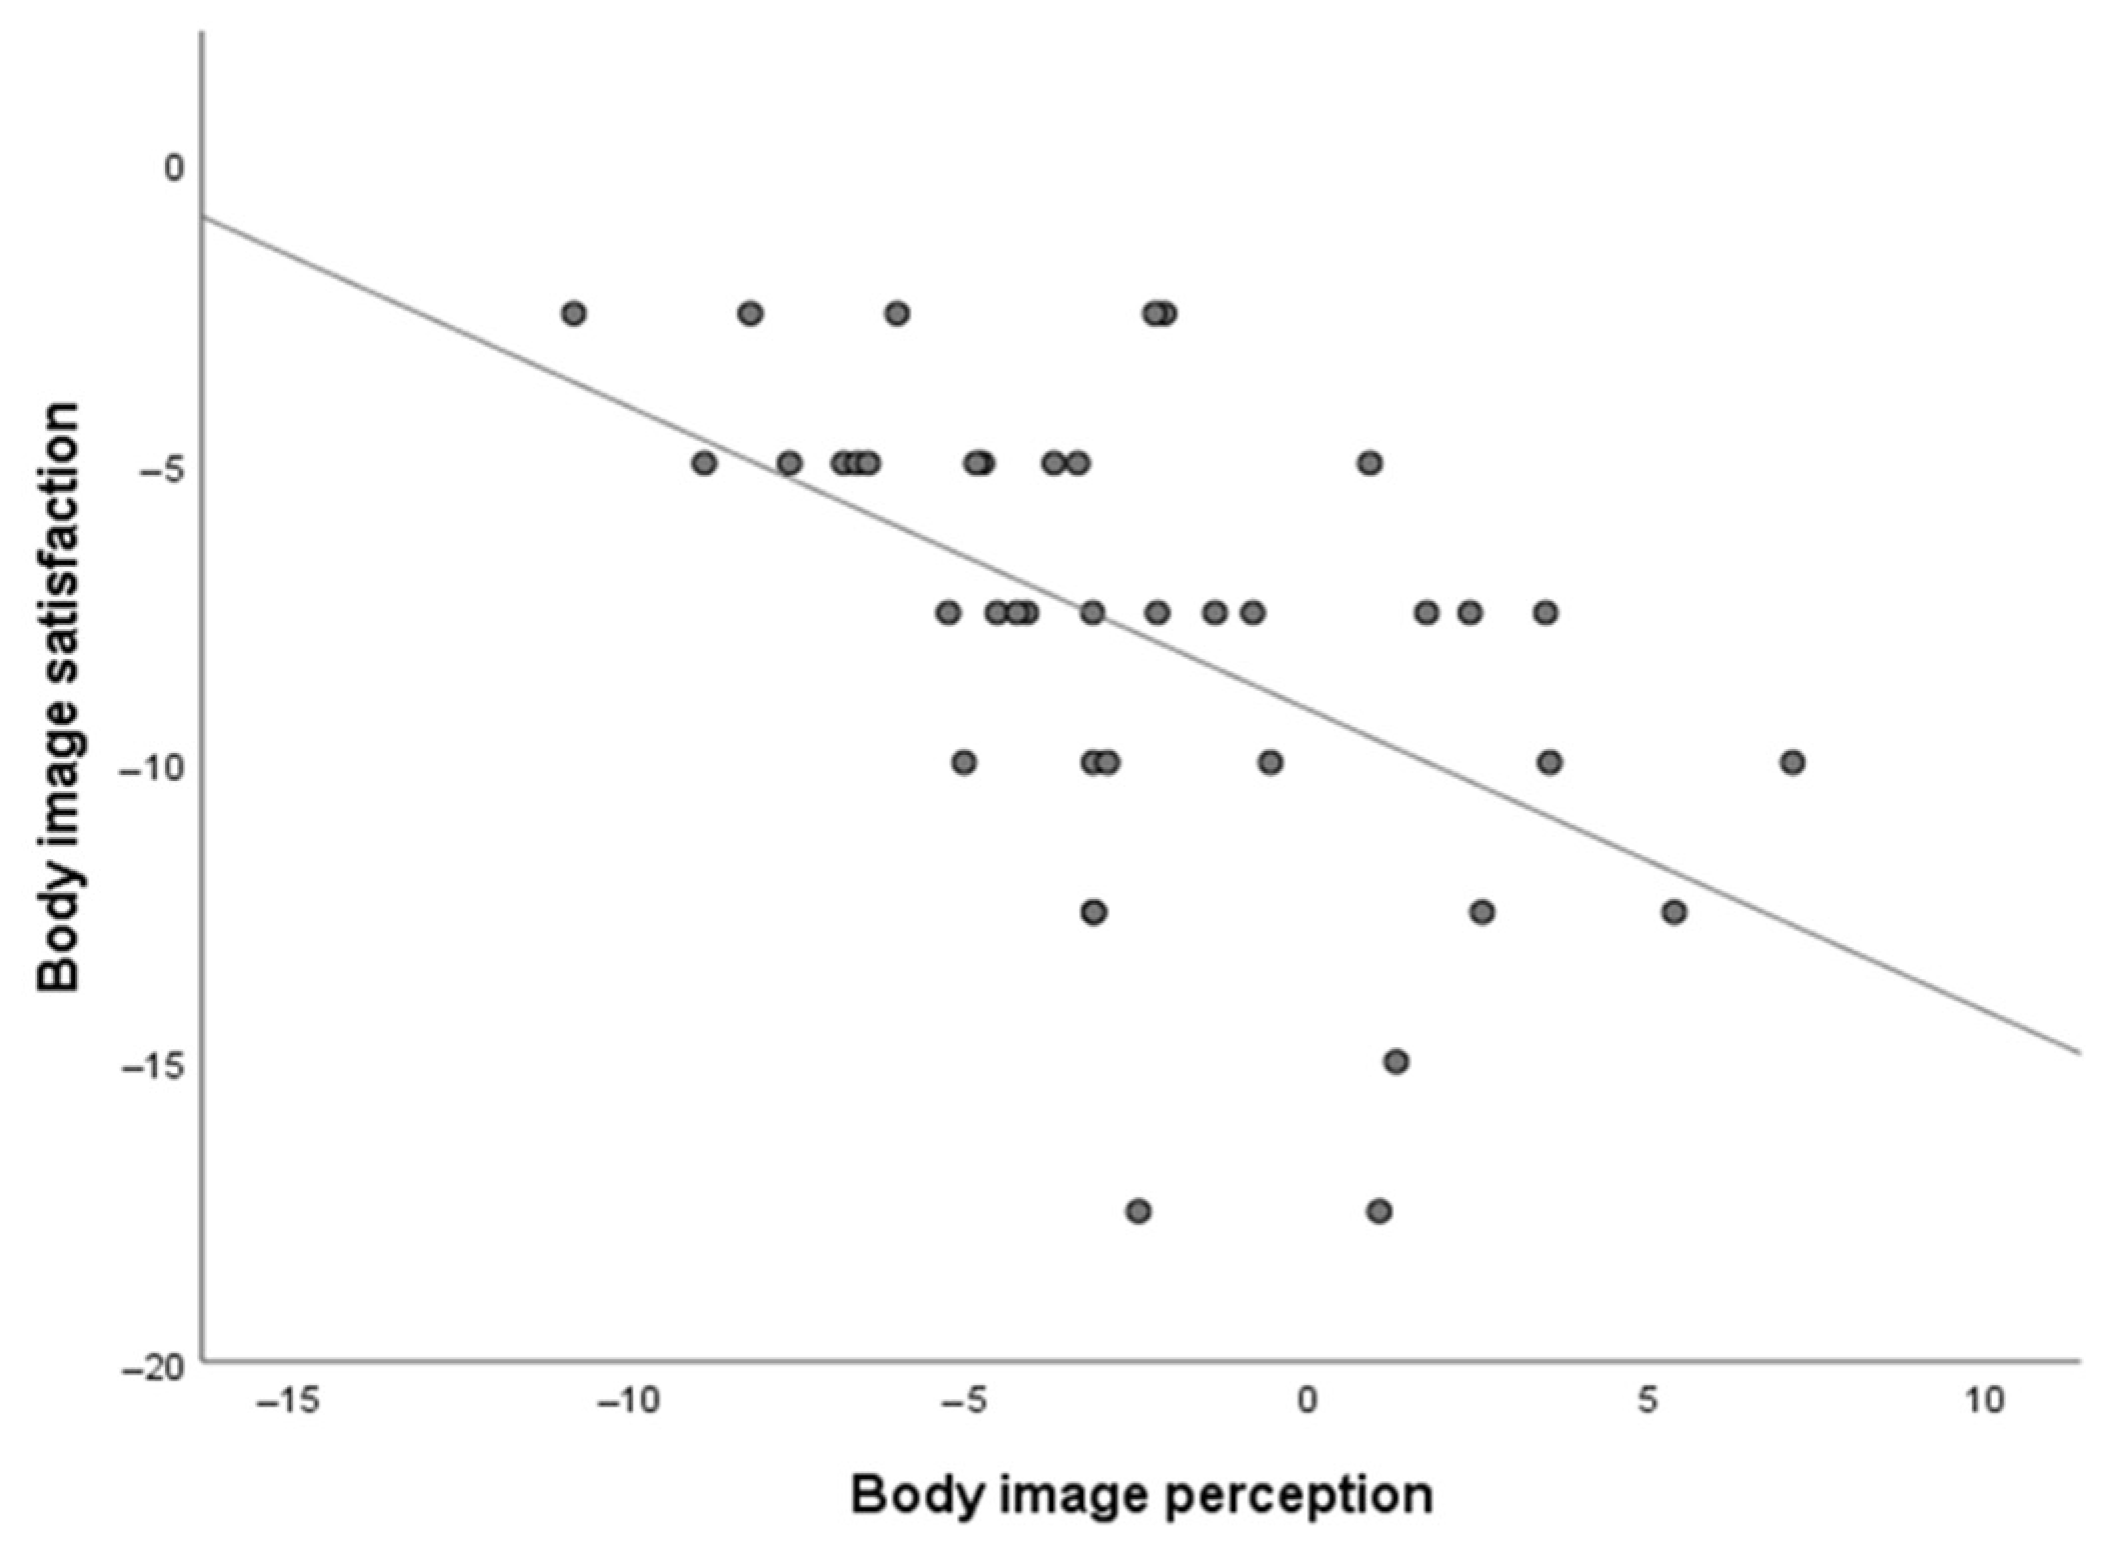
2.7. Body Image Self-Perception
2.8. Generalized Anxiety Disorder Scale (GAD-7)
2.9. Eating Attitudes
2.10. Eating Rate
2.11. Additional Data
2.12. Sample Size Calculation
2.13. Statistical Analysis
3. Results
4. Discussion
5. Conclusions
Author Contributions
Funding
Institutional Review Board Statement
Informed Consent Statement
Data Availability Statement
Acknowledgments
Conflicts of Interest
Appendix A
References
- Dobbs, R.; Sawers, C.; Thompson, F.; Manyika, J.; Woetzel, J.R.; Child, P.; Spatharou, A. Overcoming Obesity: An Initial Economic Analysis; McKinsey Global Institute: New York, NY, USA, 2014. [Google Scholar]
- World Health Organization. Obesity and Overweight. 2024. Available online: https://www.who.int/news-room/fact-sheets/detail/obesity-and-overweight (accessed on 1 March 2025).
- Aune, D.; Sen, A.; Prasad, M.; Norat, T.; Janszky, I.; Tonstad, S.; Vatten, L.J. BMI and all cause mortality: Systematic review and non-linear dose-response meta-analysis of 230 cohort studies with 3.74 million deaths among 30.3 million participants. BMJ 2016, 353, i2156. [Google Scholar] [CrossRef]
- Taylor, V.H.; Forhan, M.; Vigod, S.N.; McIntyre, R.S.; Morrison, K.M. The impact of obesity on quality of life. Best Pract. Res. Clin. Endocrinol. Metab. 2013, 27, 139–146. [Google Scholar] [CrossRef] [PubMed]
- Dulloo, A.G. Explaining the failures of obesity therapy: Willpower attenuation, target miscalculation or metabolic compensation? Int. J. Obes. 2012, 36, 1418–1420. [Google Scholar] [CrossRef]
- Mauro, M.; Taylor, V.; Wharton, S.; Sharma, A.M. Barriers to obesity treatment. Eur. J. Intern. Med. 2008, 19, 173–180. [Google Scholar] [CrossRef] [PubMed]
- Bellisle, F. Edograms: Recording the microstructure of meal intake in humans—A window on appetite mechanisms. Int. J. Obes. 2020, 44, 2347–2357. [Google Scholar] [CrossRef]
- Robinson, E.; Almiron-Roig, E.; Rutters, F.; De Graaf, C.; Forde, C.G.; Smith, C.T.; Nolan, S.J.; Jebb, S.A. A systematic review and meta-analysis examining the effect of eating rate on energy intake and hunger. Am. J. Clin. Nutr. 2014, 100, 123–151. [Google Scholar] [CrossRef] [PubMed]
- Krop, E.M.; Hetherington, M.M.; Nekitsing, C.; Miquel, S.; Postelnicu, L.; Sarkar, A. Influence of oral processing on appetite and food intake–a systematic review and meta-analysis. Appetite 2018, 125, 253–269. [Google Scholar] [CrossRef]
- Fang, K.; Liu, H.; Zhai, B.; Wang, L.; Zhao, L.; Hao, L.; Huang, L.; Zhang, X. Association between eating rate and childhood overweight/obesity: A systematic review and meta-analysis. J. Trop. Pediatr. 2024, 70, fmae040. [Google Scholar] [CrossRef]
- Ohkuma, T.; Hirakawa, Y.; Nakamura, U.; Kiyohara, Y.; Kitazono, T.; Ninomiya, T. Association between eating rate and obesity: A systematic review and meta-analysis. Int. J. Obes. 2015, 39, 1589–1596. [Google Scholar] [CrossRef]
- Fogel, A.; Goh, A.T.; Fries, L.R.; Sadananthan, S.A.; Velan, S.S.; Michael, N.; Tint, M.T.; Fortier, M.V.; Chan, M.J.; Toh, J.Y.; et al. A description of an ‘obesogenic’ eating style that promotes higher energy intake and is associated with greater adiposity in 4.5 year-old children: Results from the GUSTO cohort. Physiol. Behav. 2017, 176, 107–116. [Google Scholar] [CrossRef]
- Berkowitz, R.I.; Moore, R.H.; Faith, M.S.; Stallings, V.A.; Kral, T.V.; Stunkard, A.J. Identification of an obese eating style in 4-year-old children born at high and low risk for obesity. Obesity 2010, 18, 505–512. [Google Scholar] [CrossRef] [PubMed]
- Hall, K.D. From dearth to excess: The rise of obesity in an ultra-processed food system. Philos. Trans. R. Soc. B 2023, 378, 20220214. [Google Scholar] [CrossRef]
- Monteiro, C.A.; Cannon, G.; Levy, R.B.; Moubarac, J.C.; Louzada, M.L.; Rauber, F.; Khandpur, N.; Cediel, G.; Neri, D.; Martinez-Steele, E.; et al. Ultra-processed foods: What they are and how to identify them. Public Health Nutr. 2019, 22, 936–941. [Google Scholar] [CrossRef] [PubMed]
- Forde, C.G.; Bolhuis, D. Interrelations Between Food Form, Texture, and Matrix Influence Energy Intake and Metabolic Responses. Curr. Nutr. Rep. 2022, 11, 124–132. [Google Scholar] [CrossRef]
- Forde, C.G.; Mars, M.; De Graaf, K. Ultra-processing or oral processing? A role for energy density and eating rate in moderating energy intake from processed foods. Curr. Dev. Nutr. 2020, 4, nzaa019. [Google Scholar] [CrossRef] [PubMed]
- Hall, K.D.; Ayuketah, A.; Brychta, R.; Cai, H.; Cassimatis, T.; Chen, K.Y.; Chung, S.T.; Costa, E.; Courville, A.; Darcey, V.; et al. Ultra-processed diets cause excess calorie intake and weight gain: An inpatient randomized controlled trial of ad libitum food intake. Cell Metab. 2019, 30, 67–77. [Google Scholar] [CrossRef] [PubMed]
- Galdino-Silva, M.B.; Almeida, K.M.M.; Oliveira, A.D.S.D.; Santos, J.V.L.D.; Macena, M.D.L.; Silva, D.R.; Pereira, M.R.; Silva-Júnior, A.E.; Ferro, D.C.; Paula, D.T.d.C.; et al. A Meal with Ultra-Processed Foods Leads to a Faster Rate of Intake and to a Lesser Decrease in the Capacity to Eat When Compared to a Similar, Matched Meal Without Ultra-Processed Foods. Nutrients 2024, 16, 4398. [Google Scholar] [CrossRef]
- Hamano, S.; Sawada, M.; Aihara, M.; Sakurai, Y.; Sekine, R.; Usami, S.; Kubota, N. Ultra-processed foods cause weight gain and increased energy intake associated with reduced chewing frequency: A randomized, open-label, crossover study. Diabetes Obes. Metab. 2024, 26, 5431–5443. [Google Scholar] [CrossRef]
- Dicken, S.J.; Batterham, R.L. Ultra-processed food and obesity: What is the evidence? Curr. Nutr. Rep. 2024, 13, 23–38. [Google Scholar] [CrossRef]
- Hetherington, M.M. Cues to overeat: Psychological factors influencing overconsumption. Proc. Nutr. Soc. 2007, 66, 113–123. [Google Scholar] [CrossRef]
- Hilbert, A. Binge-eating disorder. Psychiatr. Clin. 2019, 42, 33–43. [Google Scholar] [CrossRef] [PubMed]
- Mirch, M.C.; McDuffie, J.R.; Yanovski, S.Z.; Schollnberger, M.; Tanofsky-Kraff, M.; Theim, K.R.; Krakoff, J.; Yanovski, J.A. Effects of binge eating on satiation, satiety, and energy intake of overweight children. Am. J. Clin. Nutr. 2006, 84, 732–738. [Google Scholar] [CrossRef] [PubMed]
- Zimmerli, E.J.; Devlin, M.J.; Kissileff, H.R.; Walsh, B.T. The development of satiation in bulimia nervosa. Physiol. Behav. 2010, 100, 346–349. [Google Scholar] [CrossRef] [PubMed]
- Hussenoeder, F.S.; Conrad, I.; Engel, C.; Zachariae, S.; Zeynalova, S.; Glaesmer, H.; Hinz, A.; Witte, V.; Tönjes, A.; Löffler, M.; et al. Analyzing the link between anxiety and eating behavior as a potential pathway to eating-related health outcomes. Sci. Rep. 2021, 11, 14717. [Google Scholar] [CrossRef]
- Oliveira, N.; de Oliveira Coelho, G.M.; Cabral, M.C.; Bezerra, F.F.; Faerstein, E.; Canella, D.S. Association of body image (dis) satisfaction and perception with food consumption according to the NOVA classification: Pró-Saúde Study. Appetite 2020, 144, 104464. [Google Scholar] [CrossRef]
- da Silva Júnior, A.E.; Gearhardt, A.N.; Bueno, N.B. Association between food addiction with ultra-processed food consumption and eating patterns in a Brazilian sample. Appetite 2023, 186, 106572. [Google Scholar] [CrossRef]
- Whatnall, M.; Clarke, E.; Collins, C.E.; Pursey, K.; Burrows, T. Ultra-processed food intakes associated with ‘food addiction’ in young adults. Appetite 2022, 178, 106260. [Google Scholar] [CrossRef]
- Vogel, C.; Abbott, G.; Ntani, G.; Barker, M.; Cooper, C.; Moon, G.; Ball, K.; Baird, J. Examination of how food environment and psychological factors interact in their relationship with dietary behaviours: Test of a cross-sectional model. Int. J. Behav. Nutr. Phys. Act. 2019, 16, 12. [Google Scholar] [CrossRef]
- Heeren, F.A.N.; Darcey, V.L.; Deemer, S.E.; Menon, S.; Tobias, D.; Cardel, M.I. Breaking down silos: The multifaceted nature of obesity and the future of weight management. Philos. Trans. R. Soc. B 2023, 378, 20220215. [Google Scholar] [CrossRef]
- Schulz, K.F.; Altman, D.G.; Moher, D. CONSORT 2010 statement: Updated guidelines for reporting parallel group randomised trials. J. Pharmacol. Pharmacother. 2010, 1, 100–107. [Google Scholar] [CrossRef]
- Rubino, F.; Cummings, D.E.; Eckel, R.H.; Cohen, R.V.; Wilding, J.P.H.; Brown, W.A.; Stanford, F.C.; Batterham, R.L.; Farooqi, I.S.; Farpour-Lambert, N.J.; et al. Definition and diagnostic criteria of clinical obesity. Lancet Diabetes Endocrinol. 2025, 13, 221–262. [Google Scholar] [CrossRef]
- Schulte, E.M.; Gearhardt, A.N. Development of the modified Yale food addiction scale version 2.0. Eur. Eat. Disord. Rev. 2017, 25, 302–308. [Google Scholar] [CrossRef] [PubMed]
- Nunes-Neto, P.R.; Köhler, C.A.; Schuch, F.B.; Quevedo, J.; Solmi, M.; Murru, A.; Vieta, E.; Maes, M.; Stubbs, B.; Carvalho, A.F. Psychometric properties of the modified Yale Food Addiction Scale 2.0 in a large Brazilian sample. Rev. Bras. Psiquiatr. 2018, 40, 444–448. [Google Scholar] [CrossRef]
- Silva-Junior, A.E.; Bueno, N.B. Comments on the translated version of the modified Yale Food Addiction Scale 2.0 into Brazilian Portuguese. Braz. J. Psychiatry 2023, 45, 198–199. [Google Scholar] [CrossRef] [PubMed]
- American Psychiatric Association. Substance-Related and Addictive Disorders. In DSM-5: Diagnostic and Statistical Manual of Mental Disorders, 5th ed.; American Psychiatric Association: Washington, DC, USA, 2014. [Google Scholar]
- Kakeshita, I.S.; Silva, A.I.P.; Zanatta, D.P.; Almeida, S.S. Construção e fidedignidade teste-reteste de escalas de silhuetas brasileiras para adultos e crianças. Psicologia 2009, 25, 263–270. [Google Scholar] [CrossRef]
- Sousa, T.V.; Viveiros, V.; Chai, M.V.; Vicente, F.L.; Jesus, G.; Carnot, M.J.; Gordo, A.C.; Ferreira, P.L. Reliability and validity of the Portuguese version of the Generalized Anxiety Disorder (GAD-7) scale. Health Qual. Life Outcomes 2015, 13, 50. [Google Scholar] [CrossRef]
- Spitzer, R.L.; Kroenke, K.; Williams, J.B.W.; Löwe, B. A Brief Measure for Assessing Generalized Anxiety Disorder: The GAD-7. Arch. Intern. Med. 2006, 166, 1092–1097. [Google Scholar] [CrossRef]
- Garner, D.M.; Olmsted, M.P.; Bohr, Y.; Garfinkel, P.E. The eating attitudes test: Psychometric features and clinical correlates. Psychol. Med. 1982, 12, 871–878. [Google Scholar] [CrossRef]
- Bighetti, F. Tradução e Validação do Eating Attitudes Test (EAT-26) em Adolescentes do Sexo Feminino na Cidade de Ribeirão Preto—SP. Master’s Thesis, Universidade de São Paulo, Ribeirão Preto, Brazil, 2003. [Google Scholar]
- Hamada, Y.; Kashima, H.; Hayashi, N. The number of chews and meal duration affect diet-induced thermogenesis and splanchnic circulation. Obesity 2014, 22, E62–E69. [Google Scholar] [CrossRef]
- Associação Brasileira de Empresas de Pesquisa. Critérios de Classificação Econômica Brasil. 2021. Available online: https://abep.org/criterio-brasil/ (accessed on 1 February 2024).
- Dioneda, B.; Healy, M.; Paul, M.; Sheridan, C.; Mohr, A.E.; Arciero, P.J. A gluten-free meal produces a lower postprandial thermogenic response compared to an iso-energetic/macronutrient whole food or processed food meal in young women: A single-blind randomized cross-over trial. Nutrients 2020, 12, 2035. [Google Scholar] [CrossRef]
- Chen, Y.; Fogel, A.; Bi, Y.; Yen, C.C. Factors associated with eating rate: A systematic review and narrative synthesis informed by socio-ecological model. Nutr. Res. Rev. 2023, 37, 376–395. [Google Scholar] [CrossRef] [PubMed]
- Teo, P.S.; Lim, A.J.; Goh, A.T.; Janani, R.; Choy, J.Y.M.; McCrickerd, K.; Forde, C.G. Texture-based differences in eating rate influence energy intake for minimally processed and ultra-processed meals. Am. J. Clin. Nutr. 2022, 116, 244–254. [Google Scholar] [CrossRef] [PubMed]
- Cunningham, P.M.; Roe, L.S.; Keller, K.L.; Hendriks-Hartensveld, A.E.; Rolls, B.J. Eating rate and bite size were related to food intake across meals varying in portion size: A randomized crossover trial in adults. Appetite 2023, 180, 106330. [Google Scholar] [CrossRef]
- Slyper, A. Oral processing, satiation and obesity: Overview and hypotheses. Diabetes Metab. Syndr. Obes. 2021, 14, 3399–3415. [Google Scholar] [CrossRef]
- Juul, F.; Vaidean, G.; Parekh, N. Ultra-processed foods and cardiovascular diseases: Potential mechanisms of action. Adv. Nutr. 2021, 12, 1673–1680. [Google Scholar] [CrossRef] [PubMed]
- Schilder, P. The somato-psyche in psychiatry and social psychology. J. Abnorm. Soc. Psychol. 1934, 29, 314. [Google Scholar] [CrossRef]
- Cash, T.F. (Ed.) Cognitive-behavioral perspectives on body image. In Encyclopedia of Body Image and Human Appearance; Elsevier Academic Press: London, UK, 2012; pp. 334–342. [Google Scholar]
- Neves, A.N.; Morgado, F.F.D.R.; Tavares, M.D.C.G.C.F. Body image assessment: Essential notes for a good research practice. Psicologia 2015, 31, 375–380. [Google Scholar]
- Eck, K.M.; Quick, V.; Byrd-Bredbenner, C. Body dissatisfaction, eating styles, weight-related behaviors, and health among young women in the United States. Nutrients 2022, 14, 3876. [Google Scholar] [CrossRef]
- Ruderman, A.J. Dietary restraint: A theoretical and empirical review. Psychol. Bull. 1986, 99, 247. [Google Scholar] [CrossRef]
- Moradi, S.; Hojjati Kermani, M.A.; Bagheri, R.; Mohammadi, H.; Jayedi, A.; Lane, M.M.; Asbaghi, O.; Mehrabani, S.; Suzuki, K. Ultra-processed food consumption and adult diabetes risk: A systematic review and dose-response meta-analysis. Nutrients 2021, 13, 4410. [Google Scholar] [CrossRef]
- Wang, M.; Du, X.; Huang, W.; Xu, Y. Ultra-processed foods consumption increases the risk of hypertension in adults: A systematic review and meta-analysis. Am. J. Hypertens. 2022, 35, 892–901. [Google Scholar] [CrossRef] [PubMed]
- Lockyer, S.; Spiro, A.; Berry, S.; He, J.; Loth, S.; Martinez-Inchausti, A.; Mellor, D.; Raats, M.; Sokolović, M.; Vijaykumar, S.; et al. How do we differentiate not demonise—Is there a role for healthier processed foods in an age of food insecurity? Proceedings of a roundtable event. Nutr. Bull. 2023, 48, 278–295. [Google Scholar] [CrossRef] [PubMed]
- Vocks, S.; Legenbauer, T.; Heil, A. Food intake affects state body image: Impact of restrained eating patterns and concerns about eating, weight and shape. Appetite 2007, 49, 467–475. [Google Scholar] [CrossRef]
- Pereira, T.; Mocellin, M.C.; Curioni, C. Association between ultraprocessed foods consumption, eating disorders, food addiction and body image: A systematic review. BMJ Open 2024, 14, e091223. [Google Scholar] [CrossRef]
- Papini, N.M.; Jung, M.; Cook, A.; Lopez, N.V.; Ptomey, L.T.; Herrmann, S.D.; Kang, M. Psychometric properties of the 26-item eating attitudes test (EAT-26): An application of rasch analysis. J. Eat. Disord. 2022, 10, 62. [Google Scholar] [CrossRef]
- Agüera, Z.; Lozano-Madrid, M.; Mallorquí-Bagué, N.; Jiménez-Murcia, S.; Menchón, J.M.; Fernández-Aranda, F. A review of binge eating disorder and obesity. Neuropsychiatrie 2021, 35, 57–67. [Google Scholar] [CrossRef]
- Wee, M.S.M.; Goh, A.T.; Stieger, M.; Forde, C.G. Correlation of instrumental texture properties from textural profile analysis (TPA) with eating behaviours and macronutrient composition for a wide range of solid foods. Food Funct. 2018, 9, 5301–5312. [Google Scholar] [CrossRef] [PubMed]
- Gearhardt, A.N.; Corbin, W.R.; Brownell, K.D. Food addiction: An examination of the diagnostic criteria for dependence. J. Addict. Med. 2009, 3, 1–7. [Google Scholar] [CrossRef]
- Kakeshita, I.S.; Almeida, S.D.S. Relação entre índice de massa corporal e a percepção da auto-imagem em universitários. Rev. Saúde Pública 2006, 40, 497–504. [Google Scholar] [CrossRef]
- Cabral, M.C.; Coelho, G.M.; Oliveira, N.; Canella, D.S.; Brasil, R.L.; Campos, T.A.; Faerstein, E.; Bezerra, F.F.; Antonio-Villa, N.E. Association of body image perception and (dis) satisfaction with adiposity in adults: The Pró-Saúde study. PLoS ONE 2024, 19, e0304987. [Google Scholar] [CrossRef]
- Makara-Studzińska, M.; Zaborska, A. Obesity and body image. Psychiatr. Pol. 2009, 43, 109–114. [Google Scholar] [PubMed]
- Weinberger, N.A.; Kersting, A.; Riedel-Heller, S.G.; Luck-Sikorski, C. Body dissatisfaction in individuals with obesity compared to normal-weight individuals: A systematic review and meta-analysis. Obes. Facts 2017, 9, 424–441. [Google Scholar] [CrossRef]
- Kakeshita, I.S.; Almeida, S.S. The relationship between body mass index and body image in Brazilian adults. Psychol. Neurosci. 2008, 1, 103–107. [Google Scholar] [CrossRef]
- Albuquerque, L.D.S. Fatores Associados com a Insatisfação da Imagem Corporal: Resultados da Linha de Base do ELSA-Brasil. Master’s Thesis, Escola Nacional de Saúde Pública, Rio de Janeiro, Brazil, 2014. [Google Scholar]
- Sedgwick, P.; Greenwood, N. Understanding the Hawthorne effect. BMJ 2015, 351, h4672. [Google Scholar] [CrossRef] [PubMed]
- Robinson, E.; Hardman, C.A.; Halford, J.C.; Jones, A. Eating under observation: A systematic review and meta-analysis of the effect that heightened awareness of observation has on laboratory measured energy intake. Am. J. Clin. Nutr. 2015, 102, 324–337. [Google Scholar] [CrossRef] [PubMed]
- Tufano, M.; Lasschuijt, M.; Chauhan, A.; Feskens, E.J.; Camps, G. Capturing eating behavior from video analysis: A systematic review. Nutrients 2022, 14, 4847. [Google Scholar] [CrossRef]
- Truby, H.; Paxton, S.J. Development of the children’s body image scale. Br. J. Clin. Psychol. 2002, 41, 185–203. [Google Scholar] [CrossRef]
- Williamson, S.; Delin, C. Young children’s figural selections: Accuracy of reporting and body size dissatisfaction. Int. J. Eat. Disord. 2001, 29, 80–84. [Google Scholar] [CrossRef]
- Vanderweele, T.J.; Knol, M.J. A tutorial on interaction. Epidemiol. Methods 2014, 3, 33–72. [Google Scholar] [CrossRef]

| UPF Meal | Control Meal | ||||||||
|---|---|---|---|---|---|---|---|---|---|
| Bauducco® Traditional Toast (04 units)—30 g Polenghi® dish cheese (03 fts)—54 g Perdigão® Ham (2.5 fts)—50 g Purifruti® Strawberry Jelly (02 tablespoons)—40 g Primor® Margarine (01 dessert spoon)—15 g Maratá® guava juice (01 glass)—200 mL Nestlé® FiberMais fiber module (1 tablespoon)—9 g | Regular bakery bread toast (01 unit)—50 g Chicken egg (02 units)—100 g Soybean vegetable oil (01 teaspoon)—5 mL Refined salt (01 coffee spoon)—2 g Extra virgin olive oil (01 tablespoon)—8 mL Guava pulp juice (1 glass)—200 mL Bee honey (01 tablespoon)—20 g | ||||||||
| Meal | KCAL | PTN (g) | PTN (%) | CHO (g) | CHO (%) | LIP (g) | LIP (%) | Fibers (g) | Na (mg) |
| UPF | 557.3 | 18.4 | 13.2 | 71.3 | 51.2 | 21.9 | 35.4 | 8.5 | 1493.3 |
| No UPF | 559.7 | 18.7 | 13.4 | 70.6 | 50.5 | 22.1 | 35.5 | 8.5 | 1267.5 |
| Variables | Control Group (n = 20) | UPF Group (n = 19) | p-Value a | ||
|---|---|---|---|---|---|
| n | % | n | % | ||
| Sex | 0.17 | ||||
| Female | 16 | 80.0 | 11 | 57.9 | |
| Male | 4 | 20.0 | 8 | 42.1 | |
| Skin color | 0.79 | ||||
| White | 5 | 25.0 | 6 | 31.6 | |
| Brown | 3 | 15.0 | 1 | 5.3 | |
| Black | 12 | 60.0 | 12 | 63.2 | |
| Alcohol consumer | 0.75 | ||||
| Yes | 9 | 45.0 | 10 | 52.6 | |
| No | 11 | 55.0 | 9 | 47.4 | |
| Physically inactive | 0.75 | ||||
| Yes | 11 | 55.0 | 9 | 47.4 | |
| No | 9 | 45.0 | 10 | 52.6 | |
| Brazilian economic class system | 0.29 | ||||
| A | 1 | 5.0 | 1 | 5.3 | |
| B1 | 1 | 5.0 | 0 | 0.0 | |
| B2 | 4 | 20.0 | 6 | 31.6 | |
| C1 | 7 | 35.0 | 6 | 31.6 | |
| C2 | 7 | 35.0 | 3 | 15.8 | |
| D/E | 0 | 0.0 | 3 | 15.8 | |
| Educational level | 0.74 | ||||
| Completed high school | 14 | 70.0 | 12 | 63.2 | |
| Completed higher education | 6 | 30.0 | 7 | 36.8 | |
| Mean | SD | Mean | SD | p-Value b | |
| Age (years) | 29.9 | 7.91 | 28.0 | 6.57 | 0.42 |
| Height (m) | 1.64 | 0.10 | 1.68 | 0.09 | 0.16 |
| Weight (kg) | 82.09 | 15.41 | 91.39 | 17.10 | 0.08 |
| BMI (kg/m2) | 30.40 | 3.44 | 32.02 | 3.91 | 0.17 |
| Waist circumference (cm) | 92.90 | 12.86 | 98.15 | 10.63 | 0.17 |
| Body fat percentage (%) | 41.38 | 6.45 | 39.41 | 6.55 | 0.35 |
| Fasting hunger | 44.5 | 26.5 | 45.5 | 30.6 | 0.91 |
| Fasting fullness | 25.3 | 18.6 | 20.4 | 18.1 | 0.41 |
| Fasting satisfaction | 54.9 | 27.9 | 49.9 | 30.1 | 0.60 |
| Fasting prospective food consumption | 57.8 | 22.6 | 61.3 | 26.3 | 0.65 |
| Control Group (n = 20) | UPF Group (n = 19) | Overall Sample (n = 39) | ||||||||
|---|---|---|---|---|---|---|---|---|---|---|
| Beta | 95% CI | p-Value a | Beta | 95% CI | p-Value a | Beta | 95% CI | p-Value b | p-Value × Group c | |
| Number of FA symptoms | 1.68 | −0.73; 4.10 | 0.15 | 0.85 | −5.62; 7.32 | 0.78 | 1.70 | −1.32; 4.72 | 0.26 | 0.89 |
| EAT-26 score | 0.30 | −0.79; 1.41 | 0.56 | −0.14 | −2.18; 1.89 | 0.88 | 0.08 | −1.01; 1.18 | 0.87 | 0.49 |
| GAD-7 score | 0.41 | −0.77; 1.61 | 0.46 | −0.50 | −3.50; 2.49 | 0.72 | 0.29 | −1.11; 1.71 | 0.67 | 0.23 |
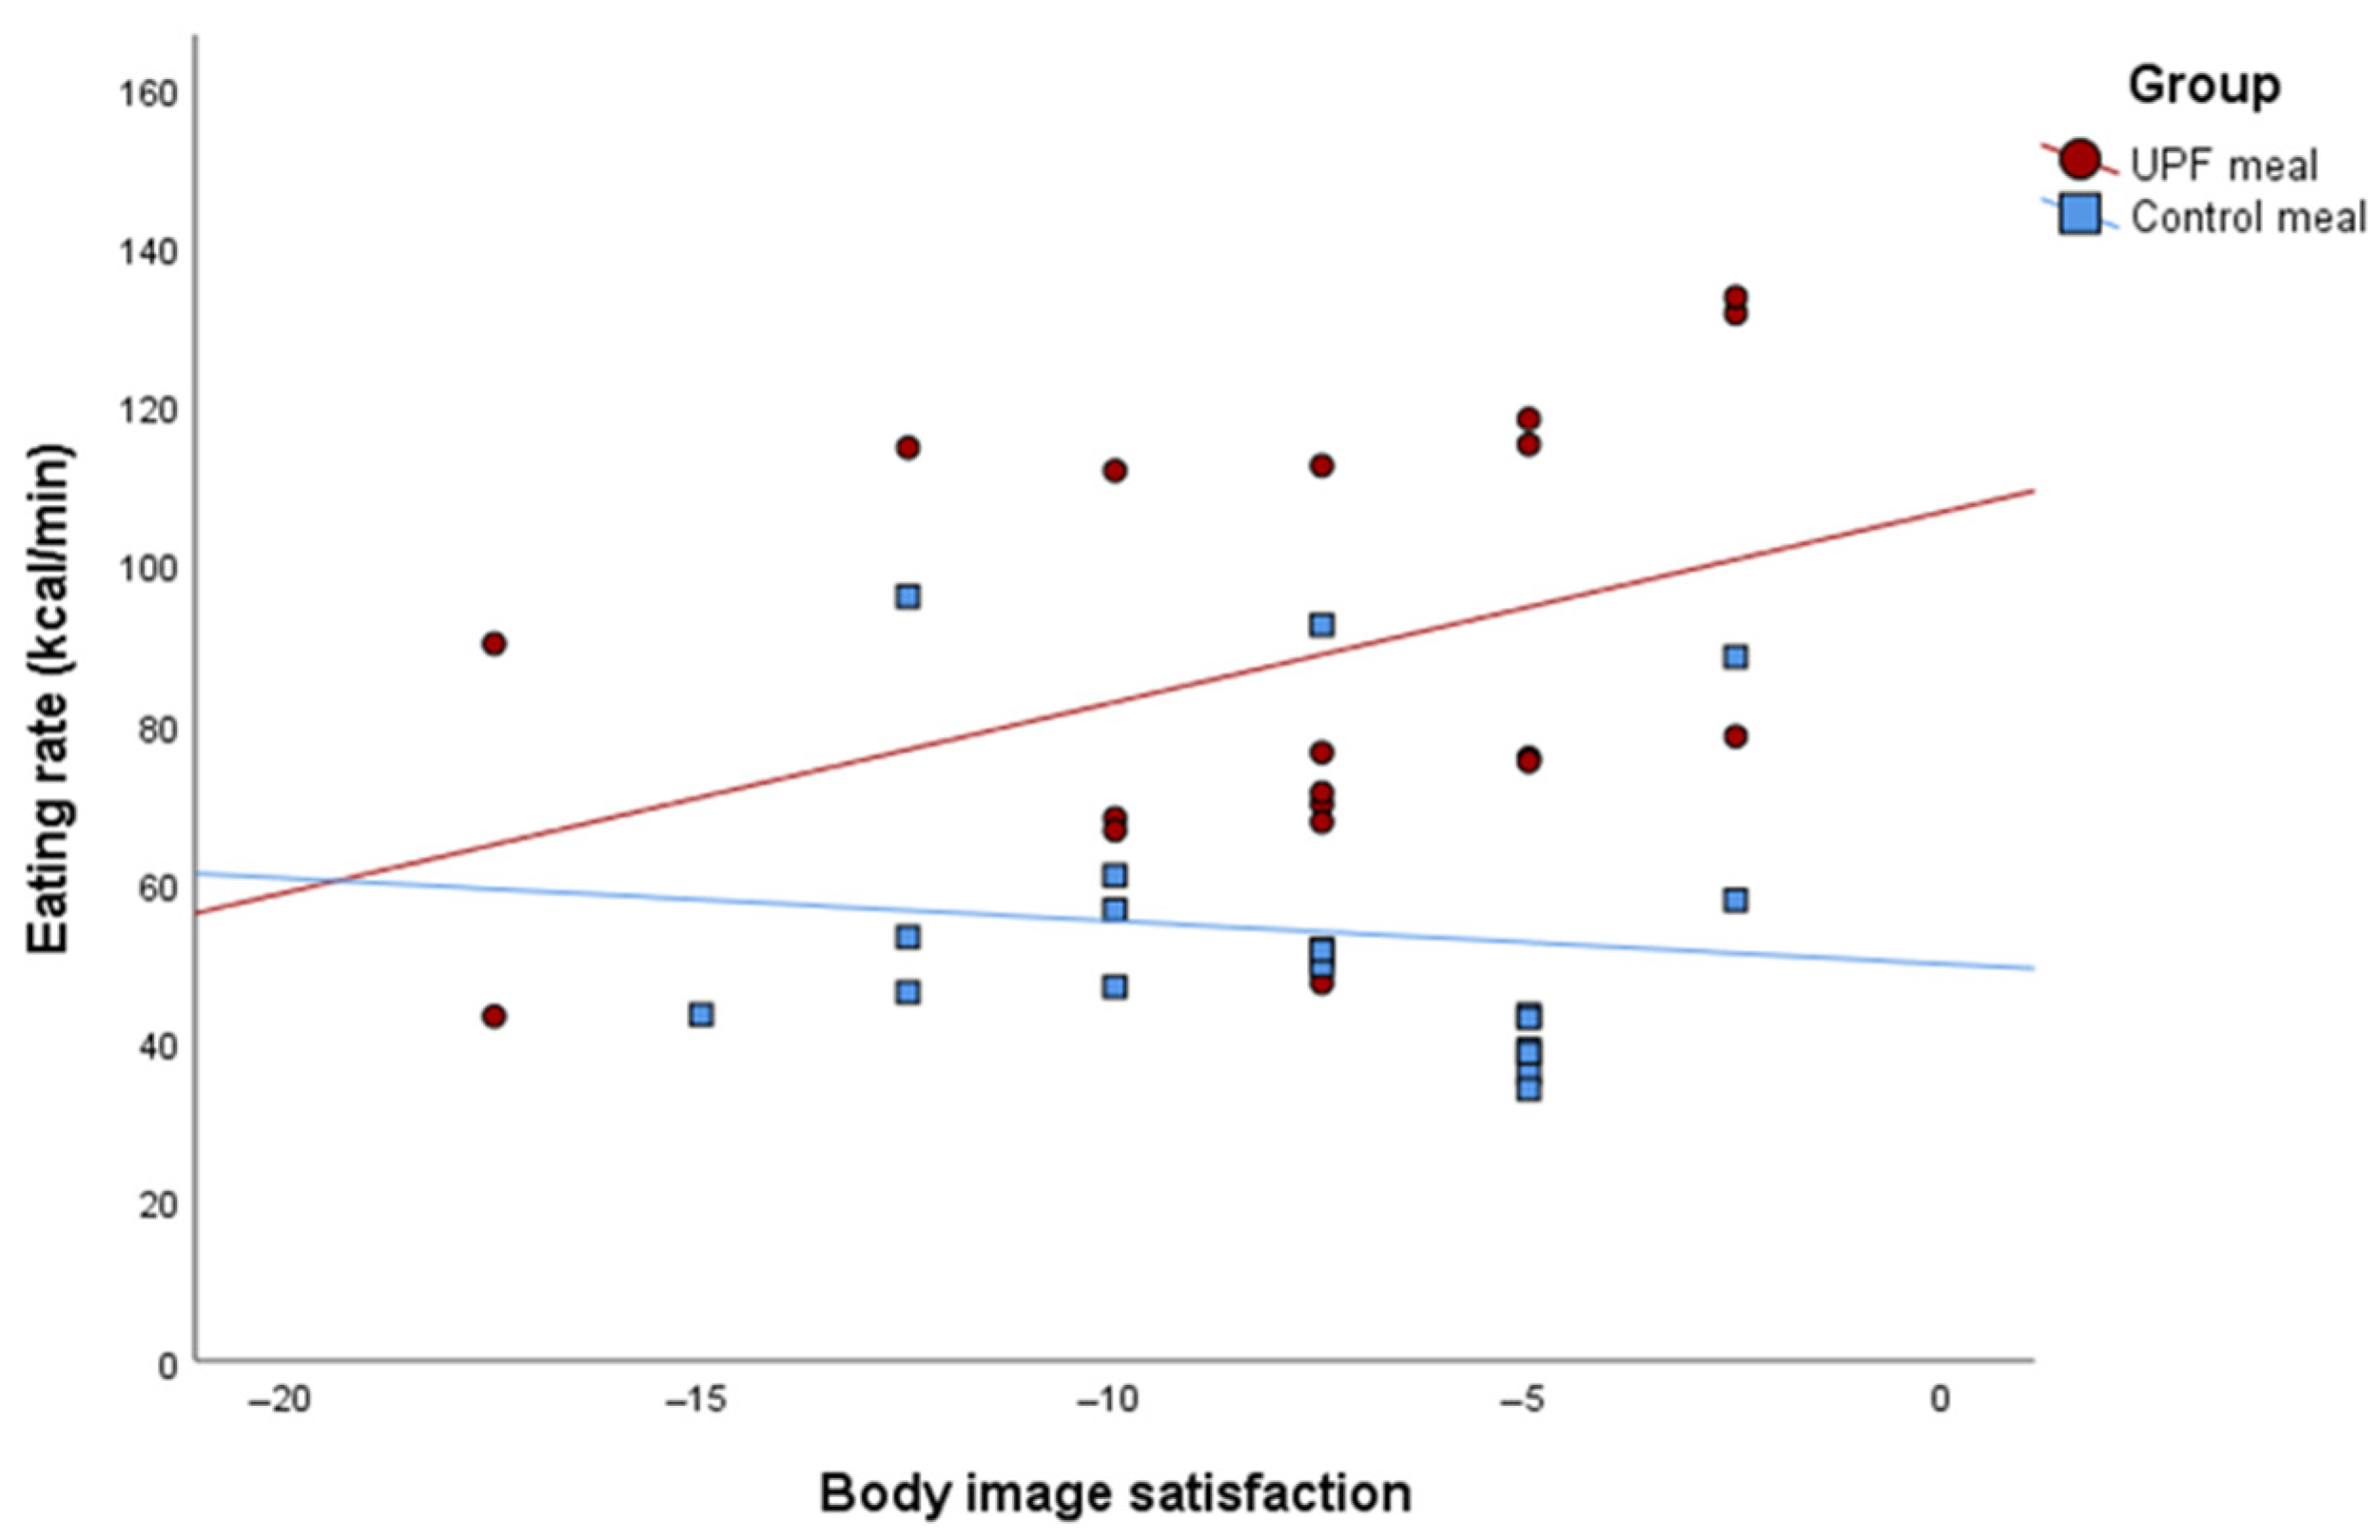
| Body satisfaction | −1.40 | −3.20; 0.39 | 0.11 | 2.71 | −0.14; 5.57 | 0.06 | 0.59 | −1.17; 2.35 | 0.49 | 0.007 |
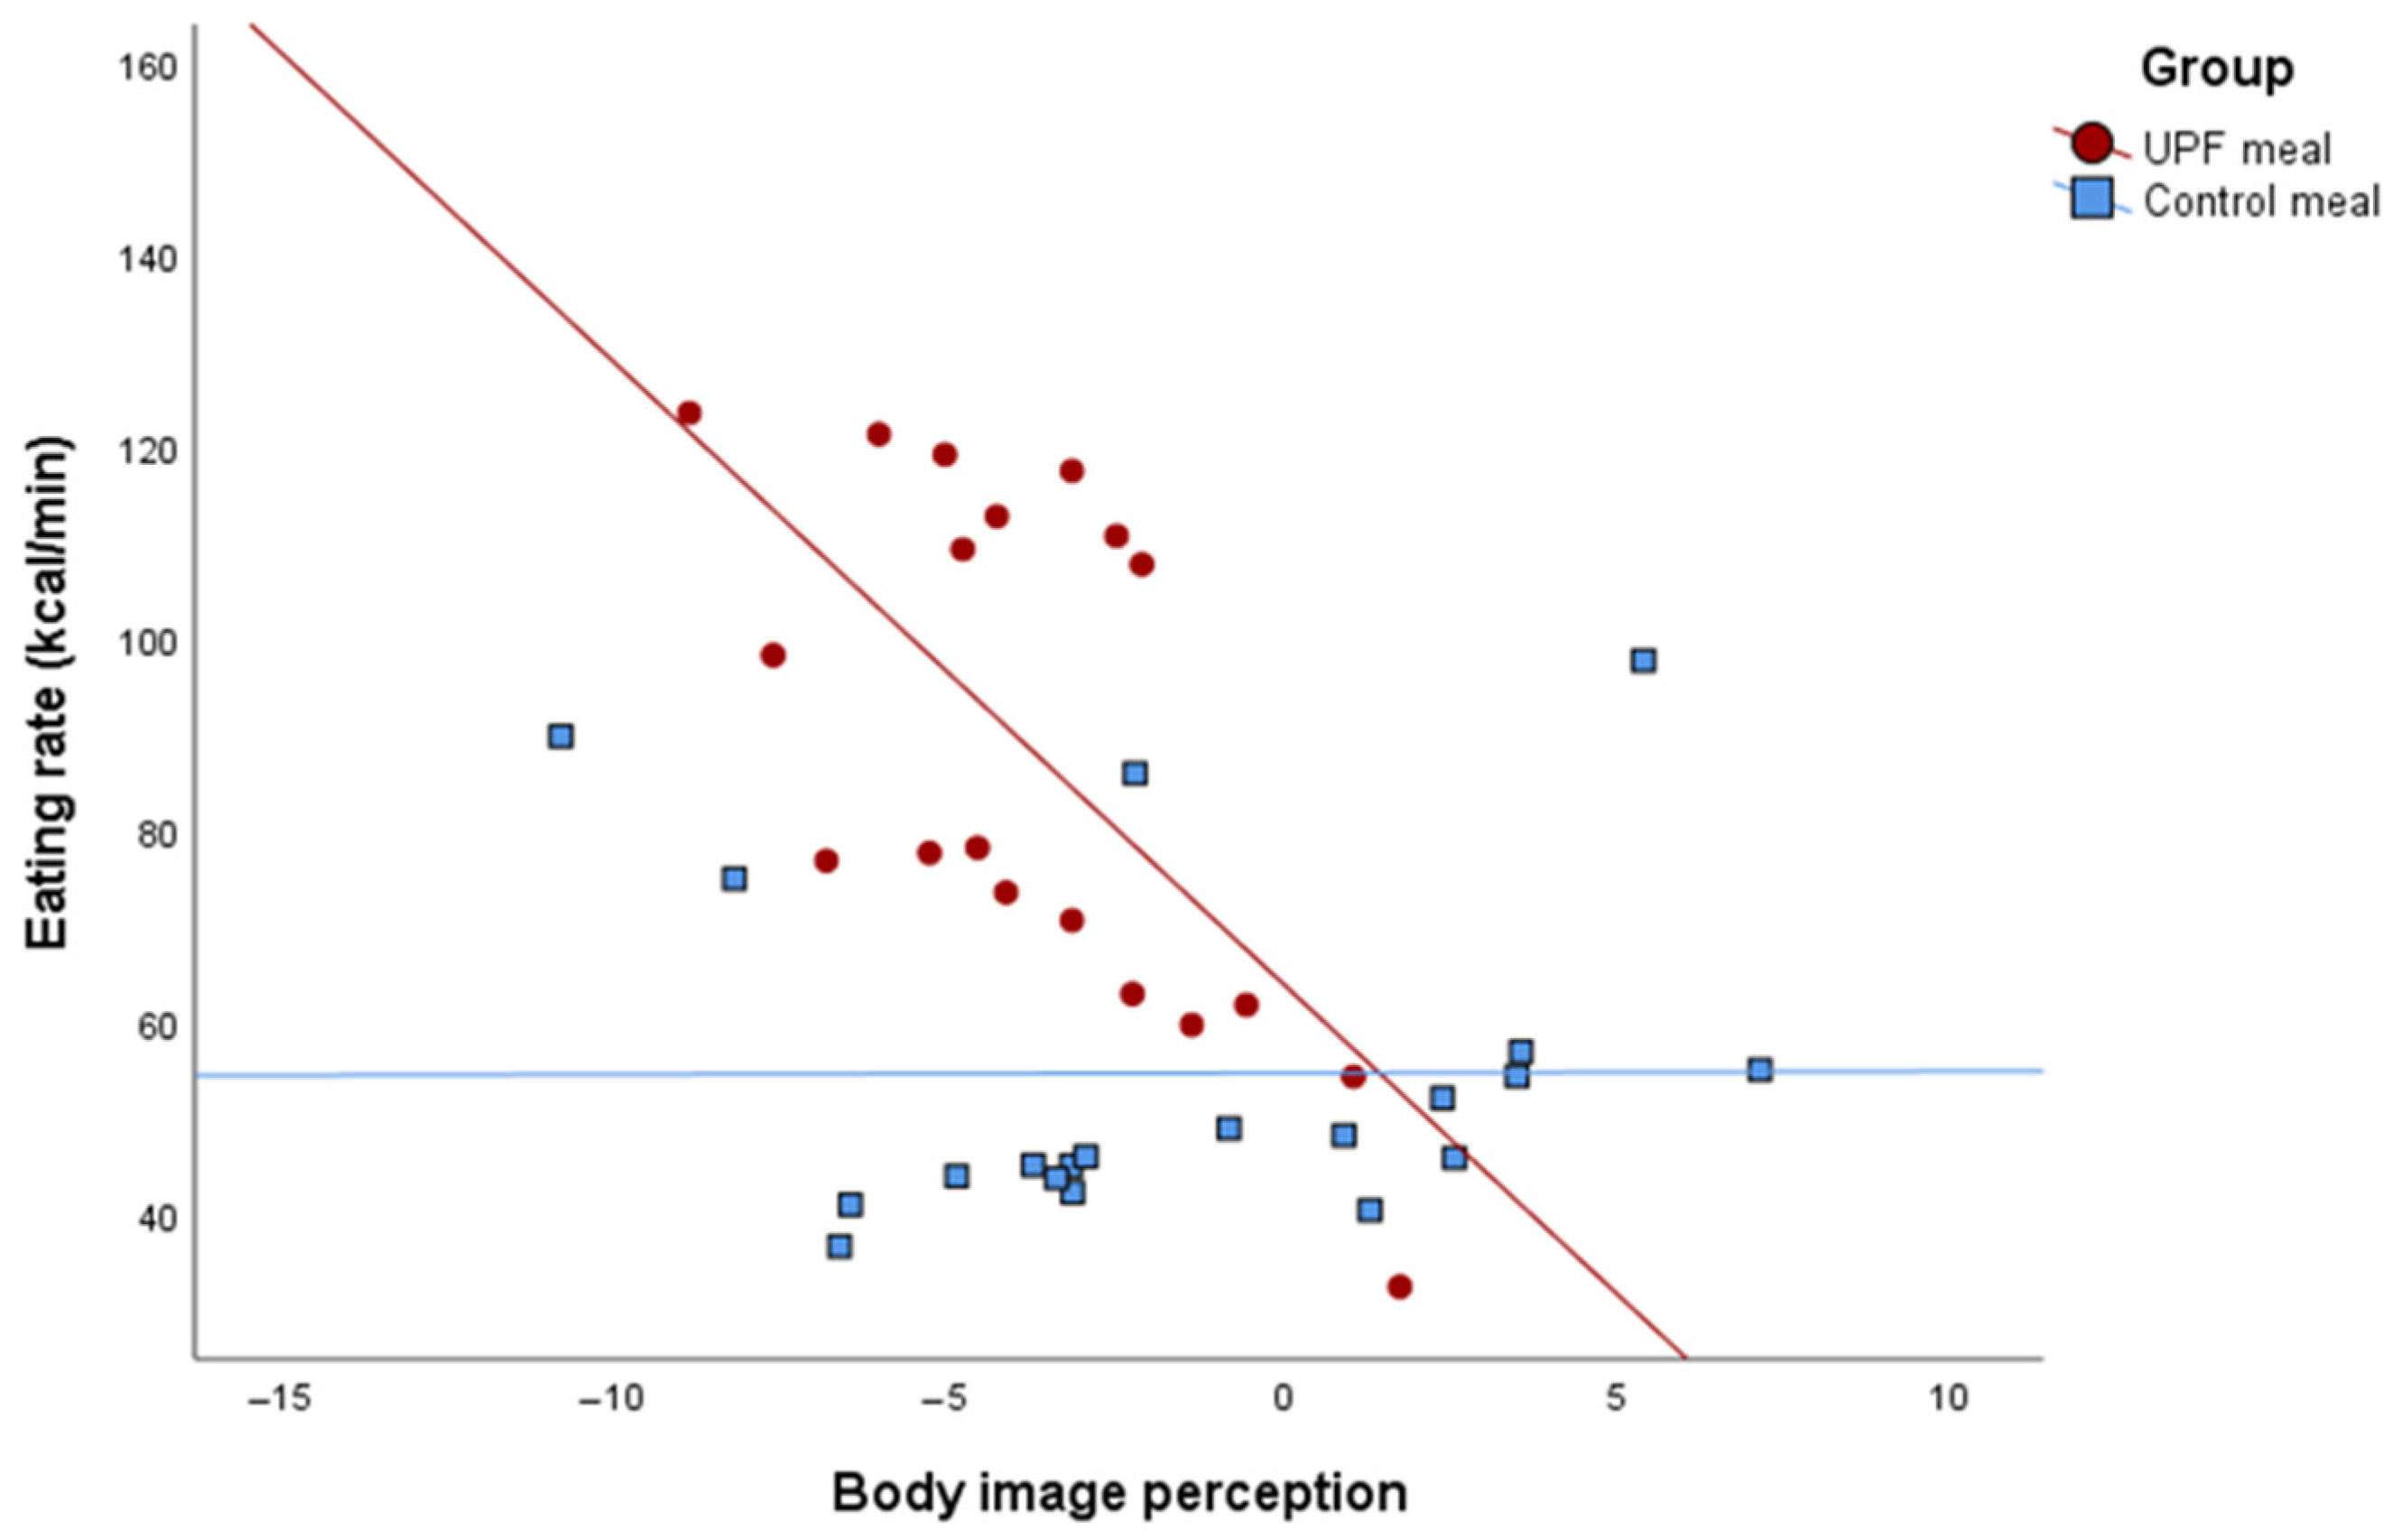
| Body image perception | 0.72 | −0.56; 2.01 | 0.25 | −3.10 | −8.02; 1.80 | 0.19 | 0.01 | −1.83; 1.85 | 0.98 | 0.024 |
Disclaimer/Publisher’s Note: The statements, opinions and data contained in all publications are solely those of the individual author(s) and contributor(s) and not of MDPI and/or the editor(s). MDPI and/or the editor(s) disclaim responsibility for any injury to people or property resulting from any ideas, methods, instructions or products referred to in the content. |
© 2025 by the authors. Licensee MDPI, Basel, Switzerland. This article is an open access article distributed under the terms and conditions of the Creative Commons Attribution (CC BY) license (https://creativecommons.org/licenses/by/4.0/).
Share and Cite
Barros, L.d.M.; Peixoto, V.A.; Carvalho, G.C.O.d.; Pereira, M.R.; Carnaúba, R.T.L.; Bueno, N.B. Association Between Psychobehavioral Factors and the Increased Eating Rate of Ultra-Processed Versus Non-Ultra-Processed Meals in Individuals with Obesity: A Secondary Analysis of a Randomized Trial. Nutrients 2025, 17, 2236. https://doi.org/10.3390/nu17132236
Barros LdM, Peixoto VA, Carvalho GCOd, Pereira MR, Carnaúba RTL, Bueno NB. Association Between Psychobehavioral Factors and the Increased Eating Rate of Ultra-Processed Versus Non-Ultra-Processed Meals in Individuals with Obesity: A Secondary Analysis of a Randomized Trial. Nutrients. 2025; 17(13):2236. https://doi.org/10.3390/nu17132236
Chicago/Turabian StyleBarros, Ludmila de Melo, Vanessa Amorim Peixoto, Guilherme César Oliveira de Carvalho, Micnéias Róberth Pereira, Rodrigo Tenório Lins Carnaúba, and Nassib Bezerra Bueno. 2025. "Association Between Psychobehavioral Factors and the Increased Eating Rate of Ultra-Processed Versus Non-Ultra-Processed Meals in Individuals with Obesity: A Secondary Analysis of a Randomized Trial" Nutrients 17, no. 13: 2236. https://doi.org/10.3390/nu17132236
APA StyleBarros, L. d. M., Peixoto, V. A., Carvalho, G. C. O. d., Pereira, M. R., Carnaúba, R. T. L., & Bueno, N. B. (2025). Association Between Psychobehavioral Factors and the Increased Eating Rate of Ultra-Processed Versus Non-Ultra-Processed Meals in Individuals with Obesity: A Secondary Analysis of a Randomized Trial. Nutrients, 17(13), 2236. https://doi.org/10.3390/nu17132236