
The Effects of Cranberry Consumption on Glycemic and Lipid Profiles in Humans: A Systematic Review and Meta-Analysis of Randomized Controlled Trials


Abstract
1. Introduction
2. Materials and Methods
2.1. Search Strategy
2.2. Study Inclusion and Exclusion Criteria
2.3. Data Extraction
2.4. Quality Assessment of Meta-Analysis
2.5. Statistical Analyses
3. Results
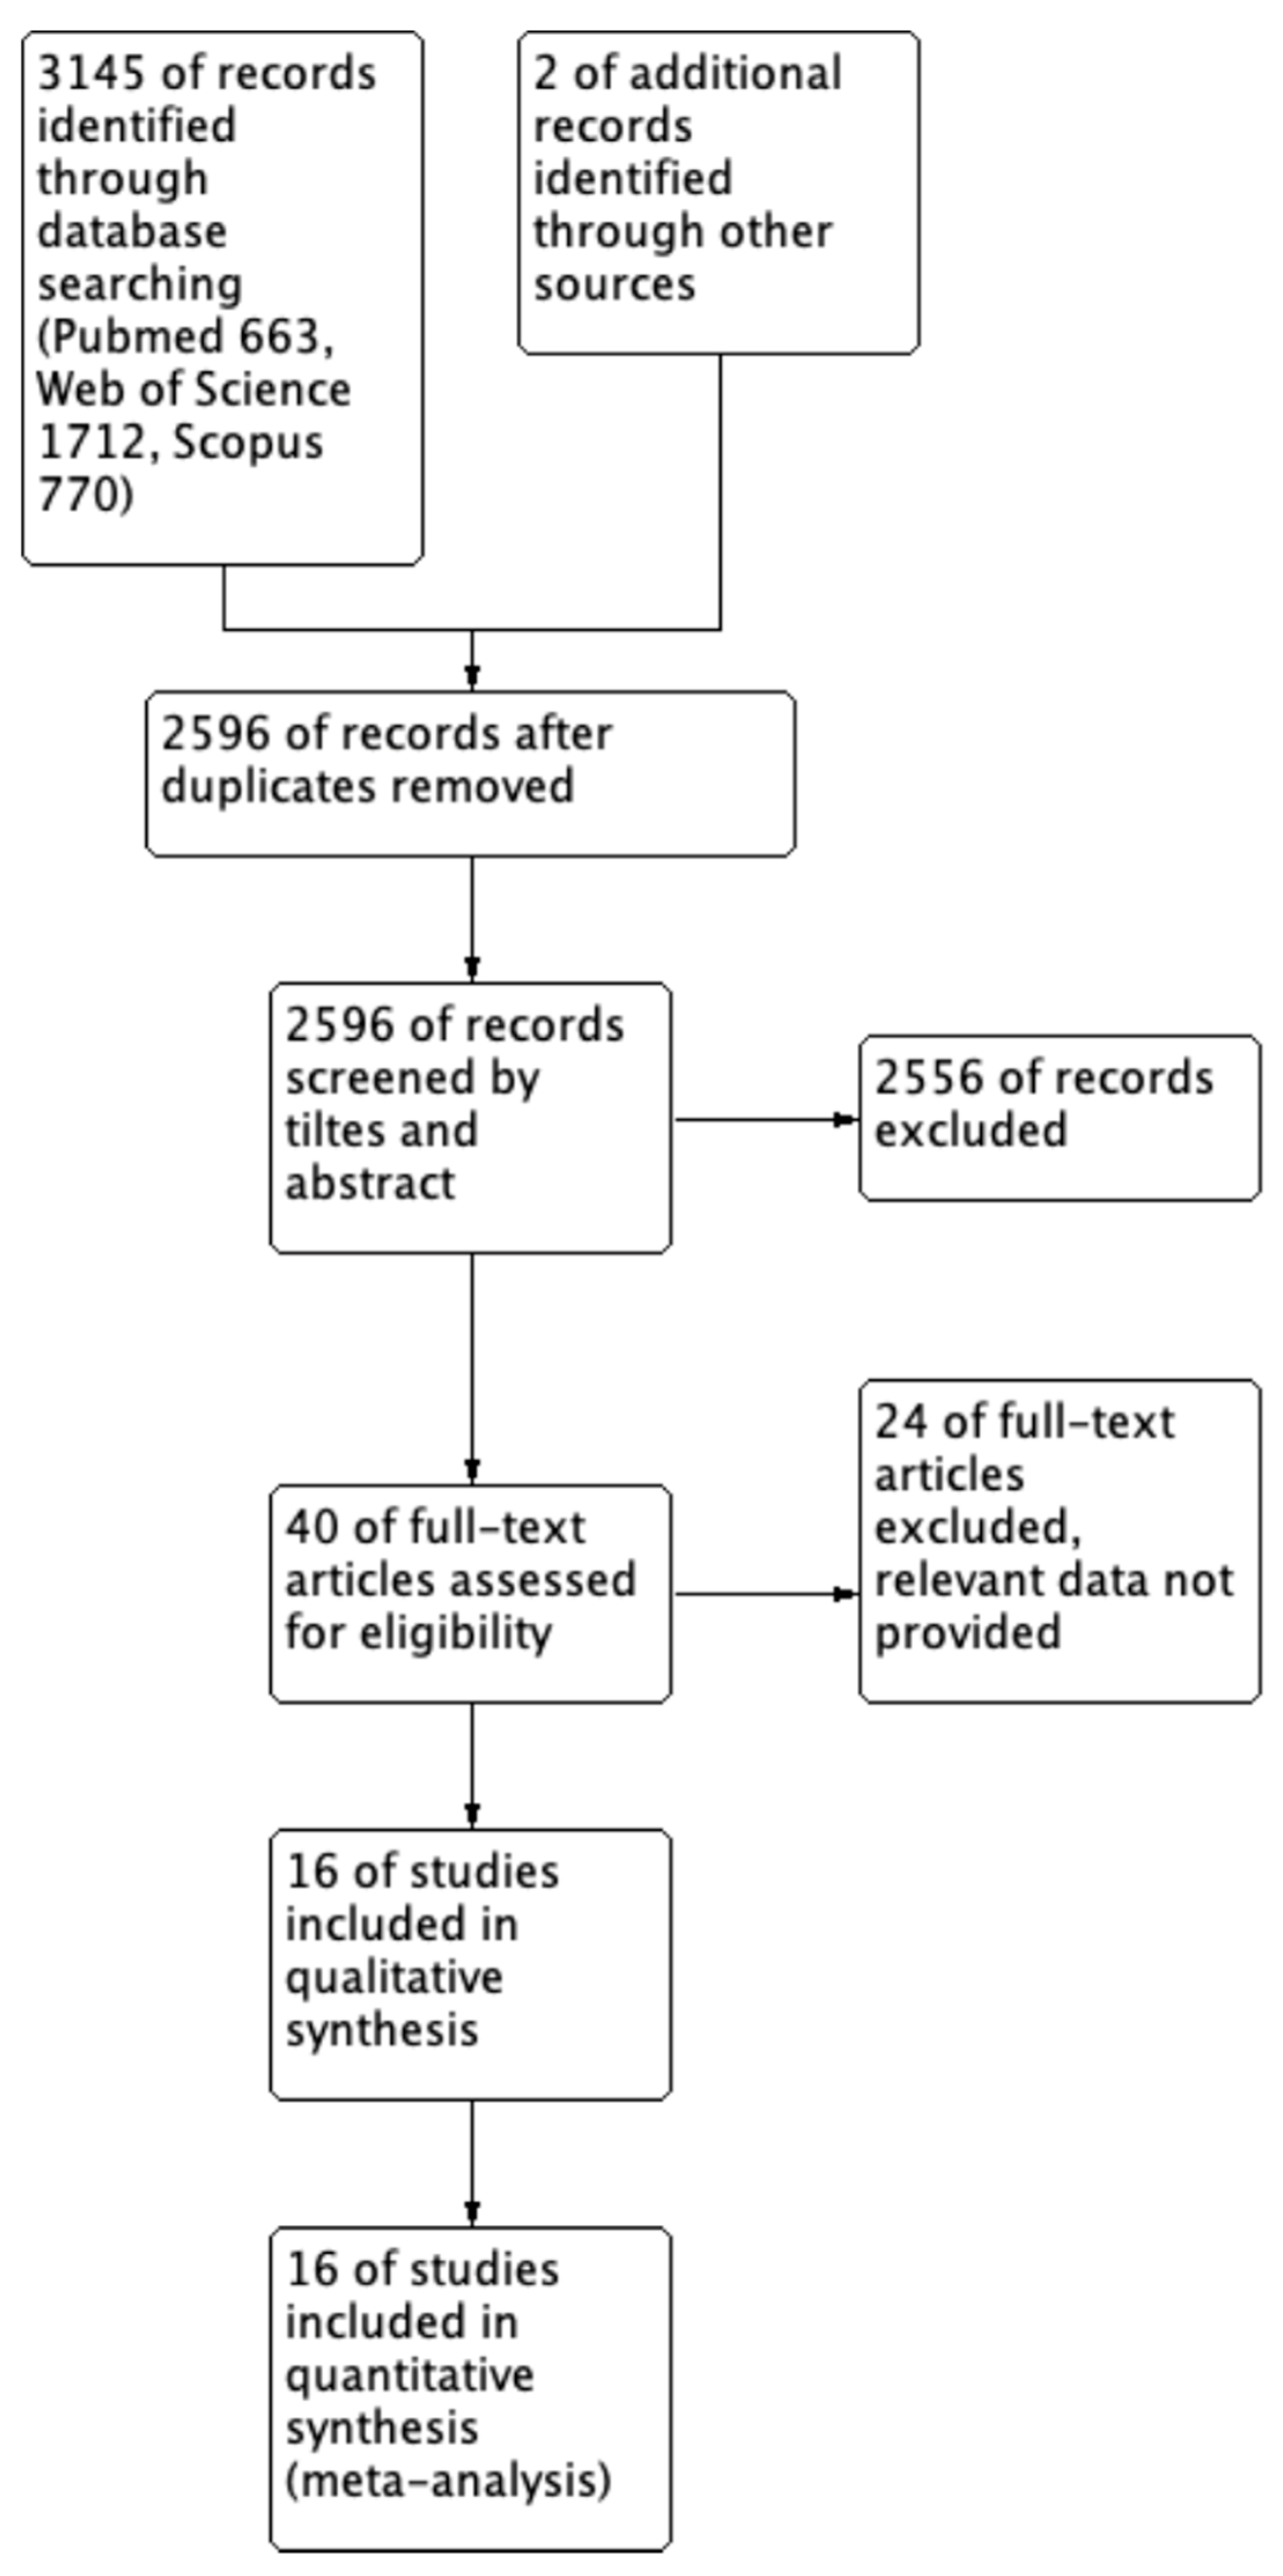
3.1. Search Results
3.2. Study Characteristics
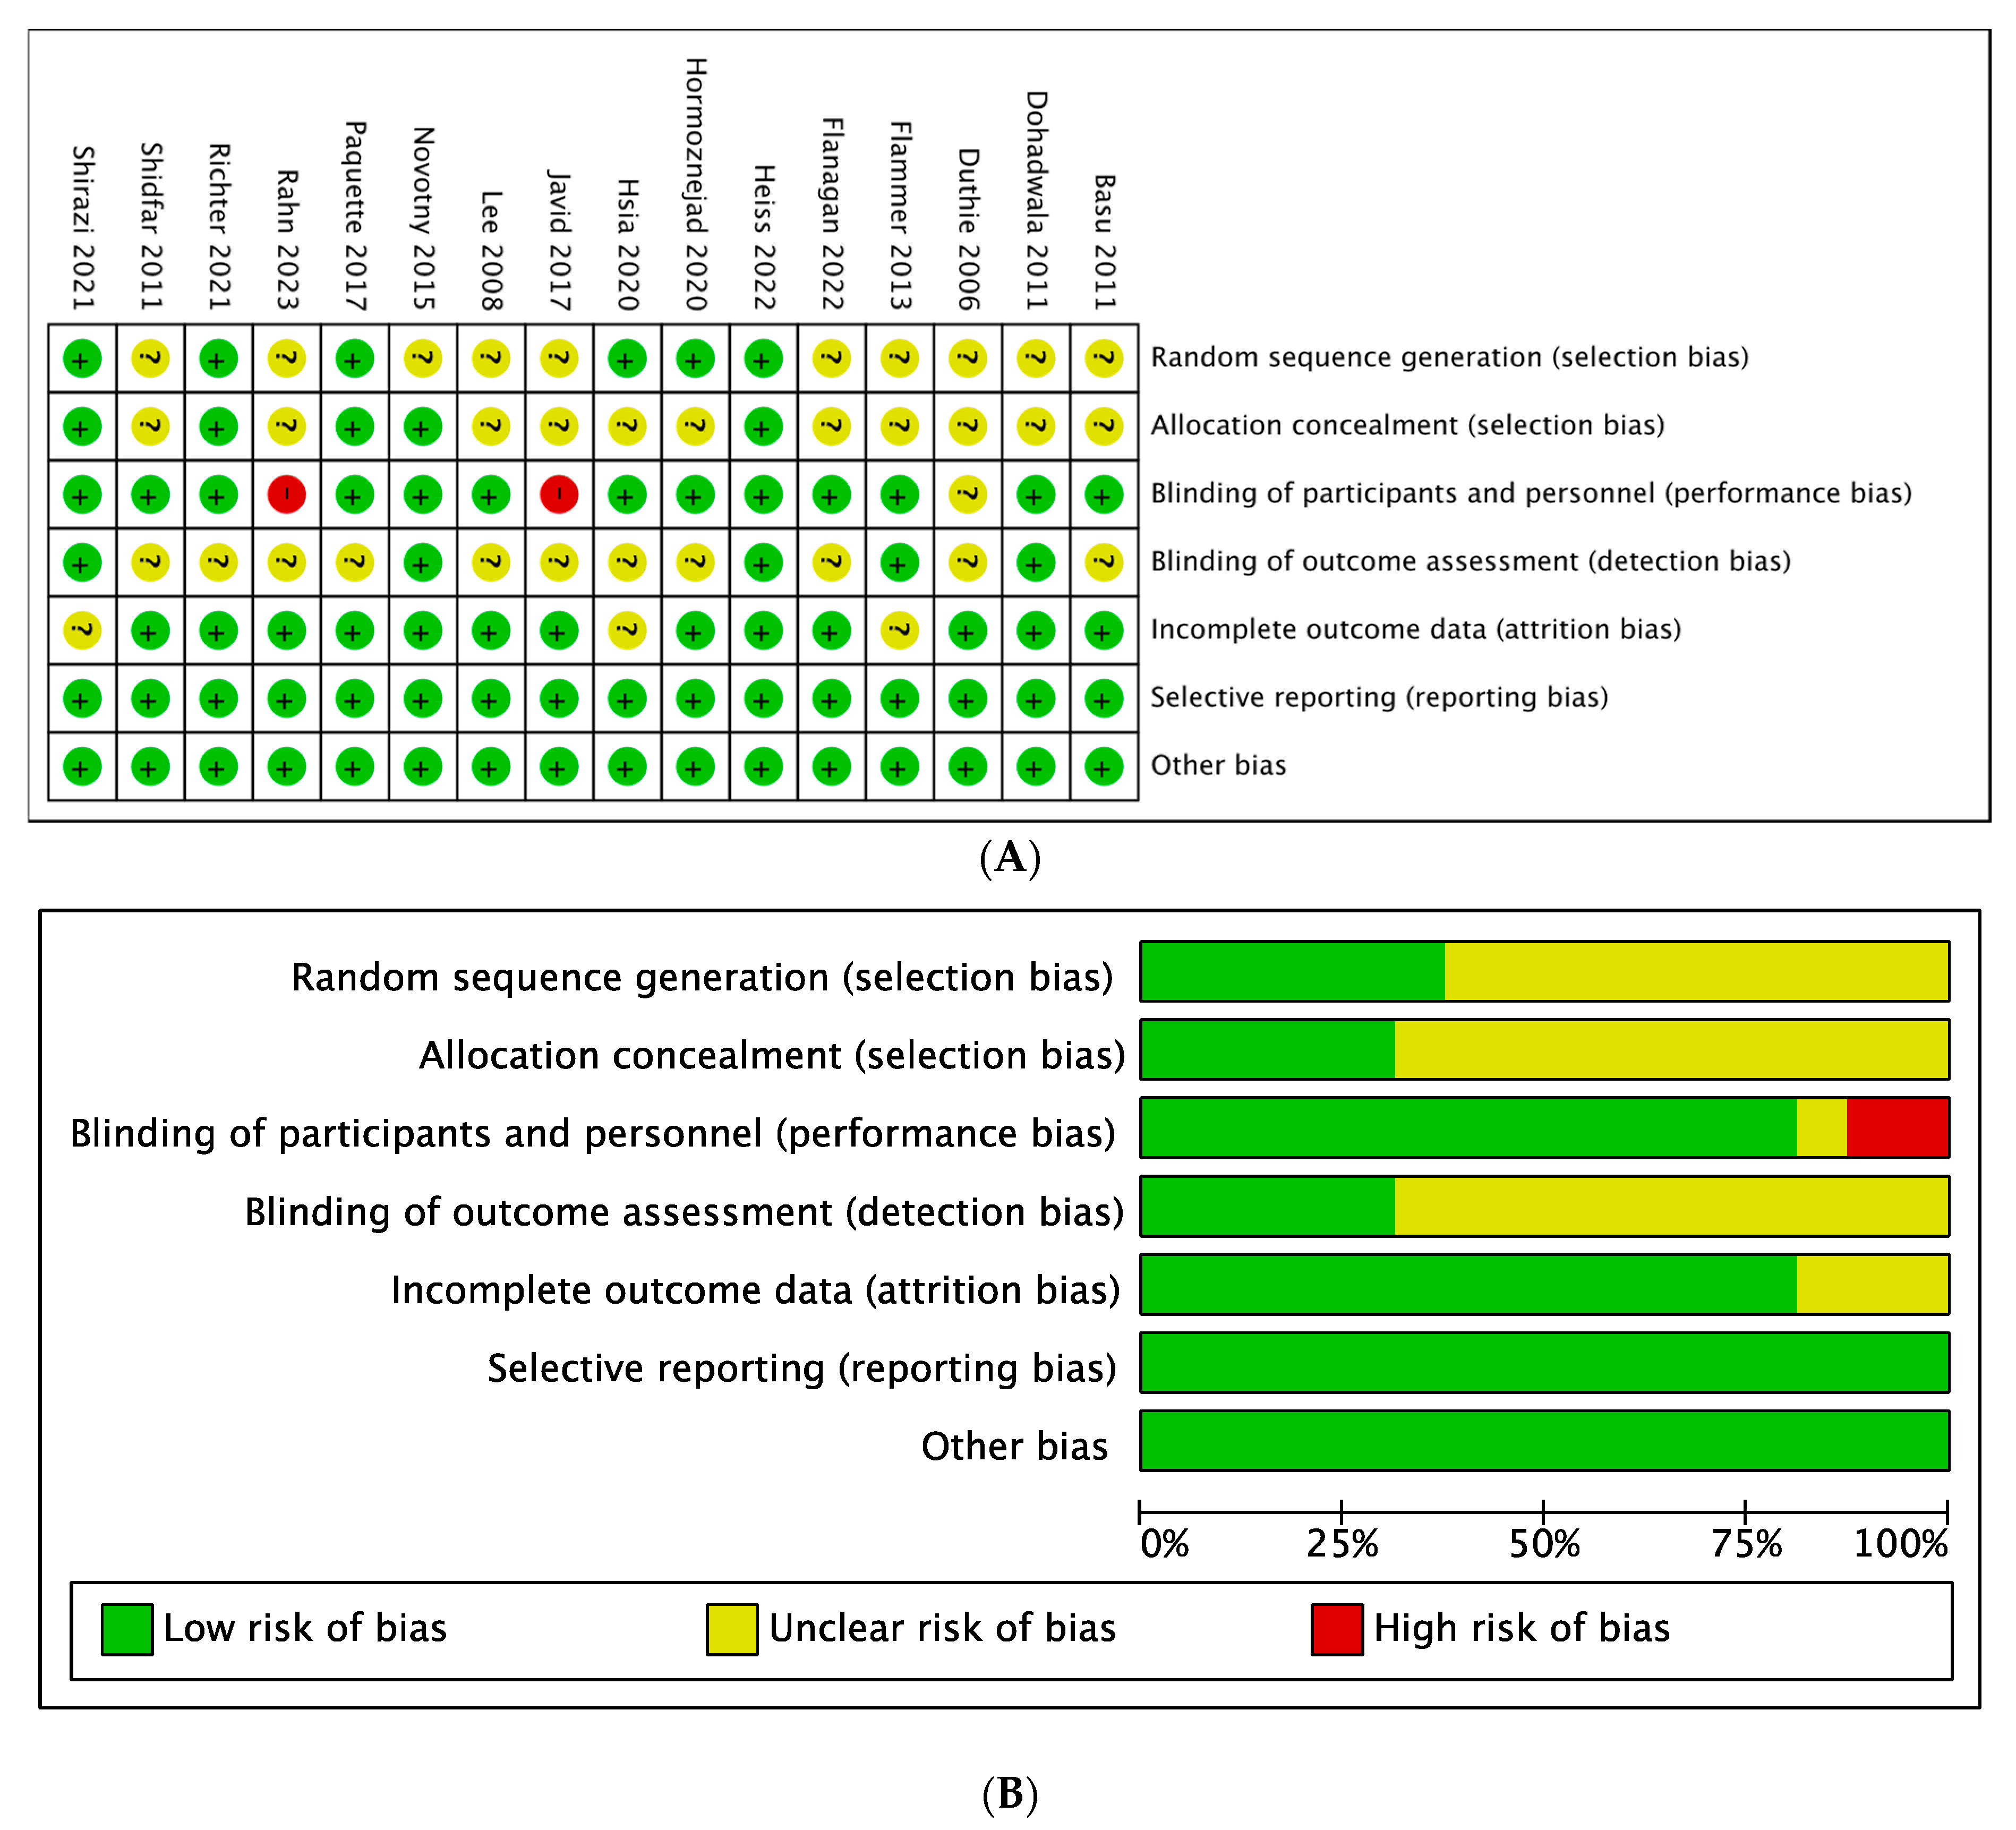
3.3. Quality of the Studies and Publication Bias
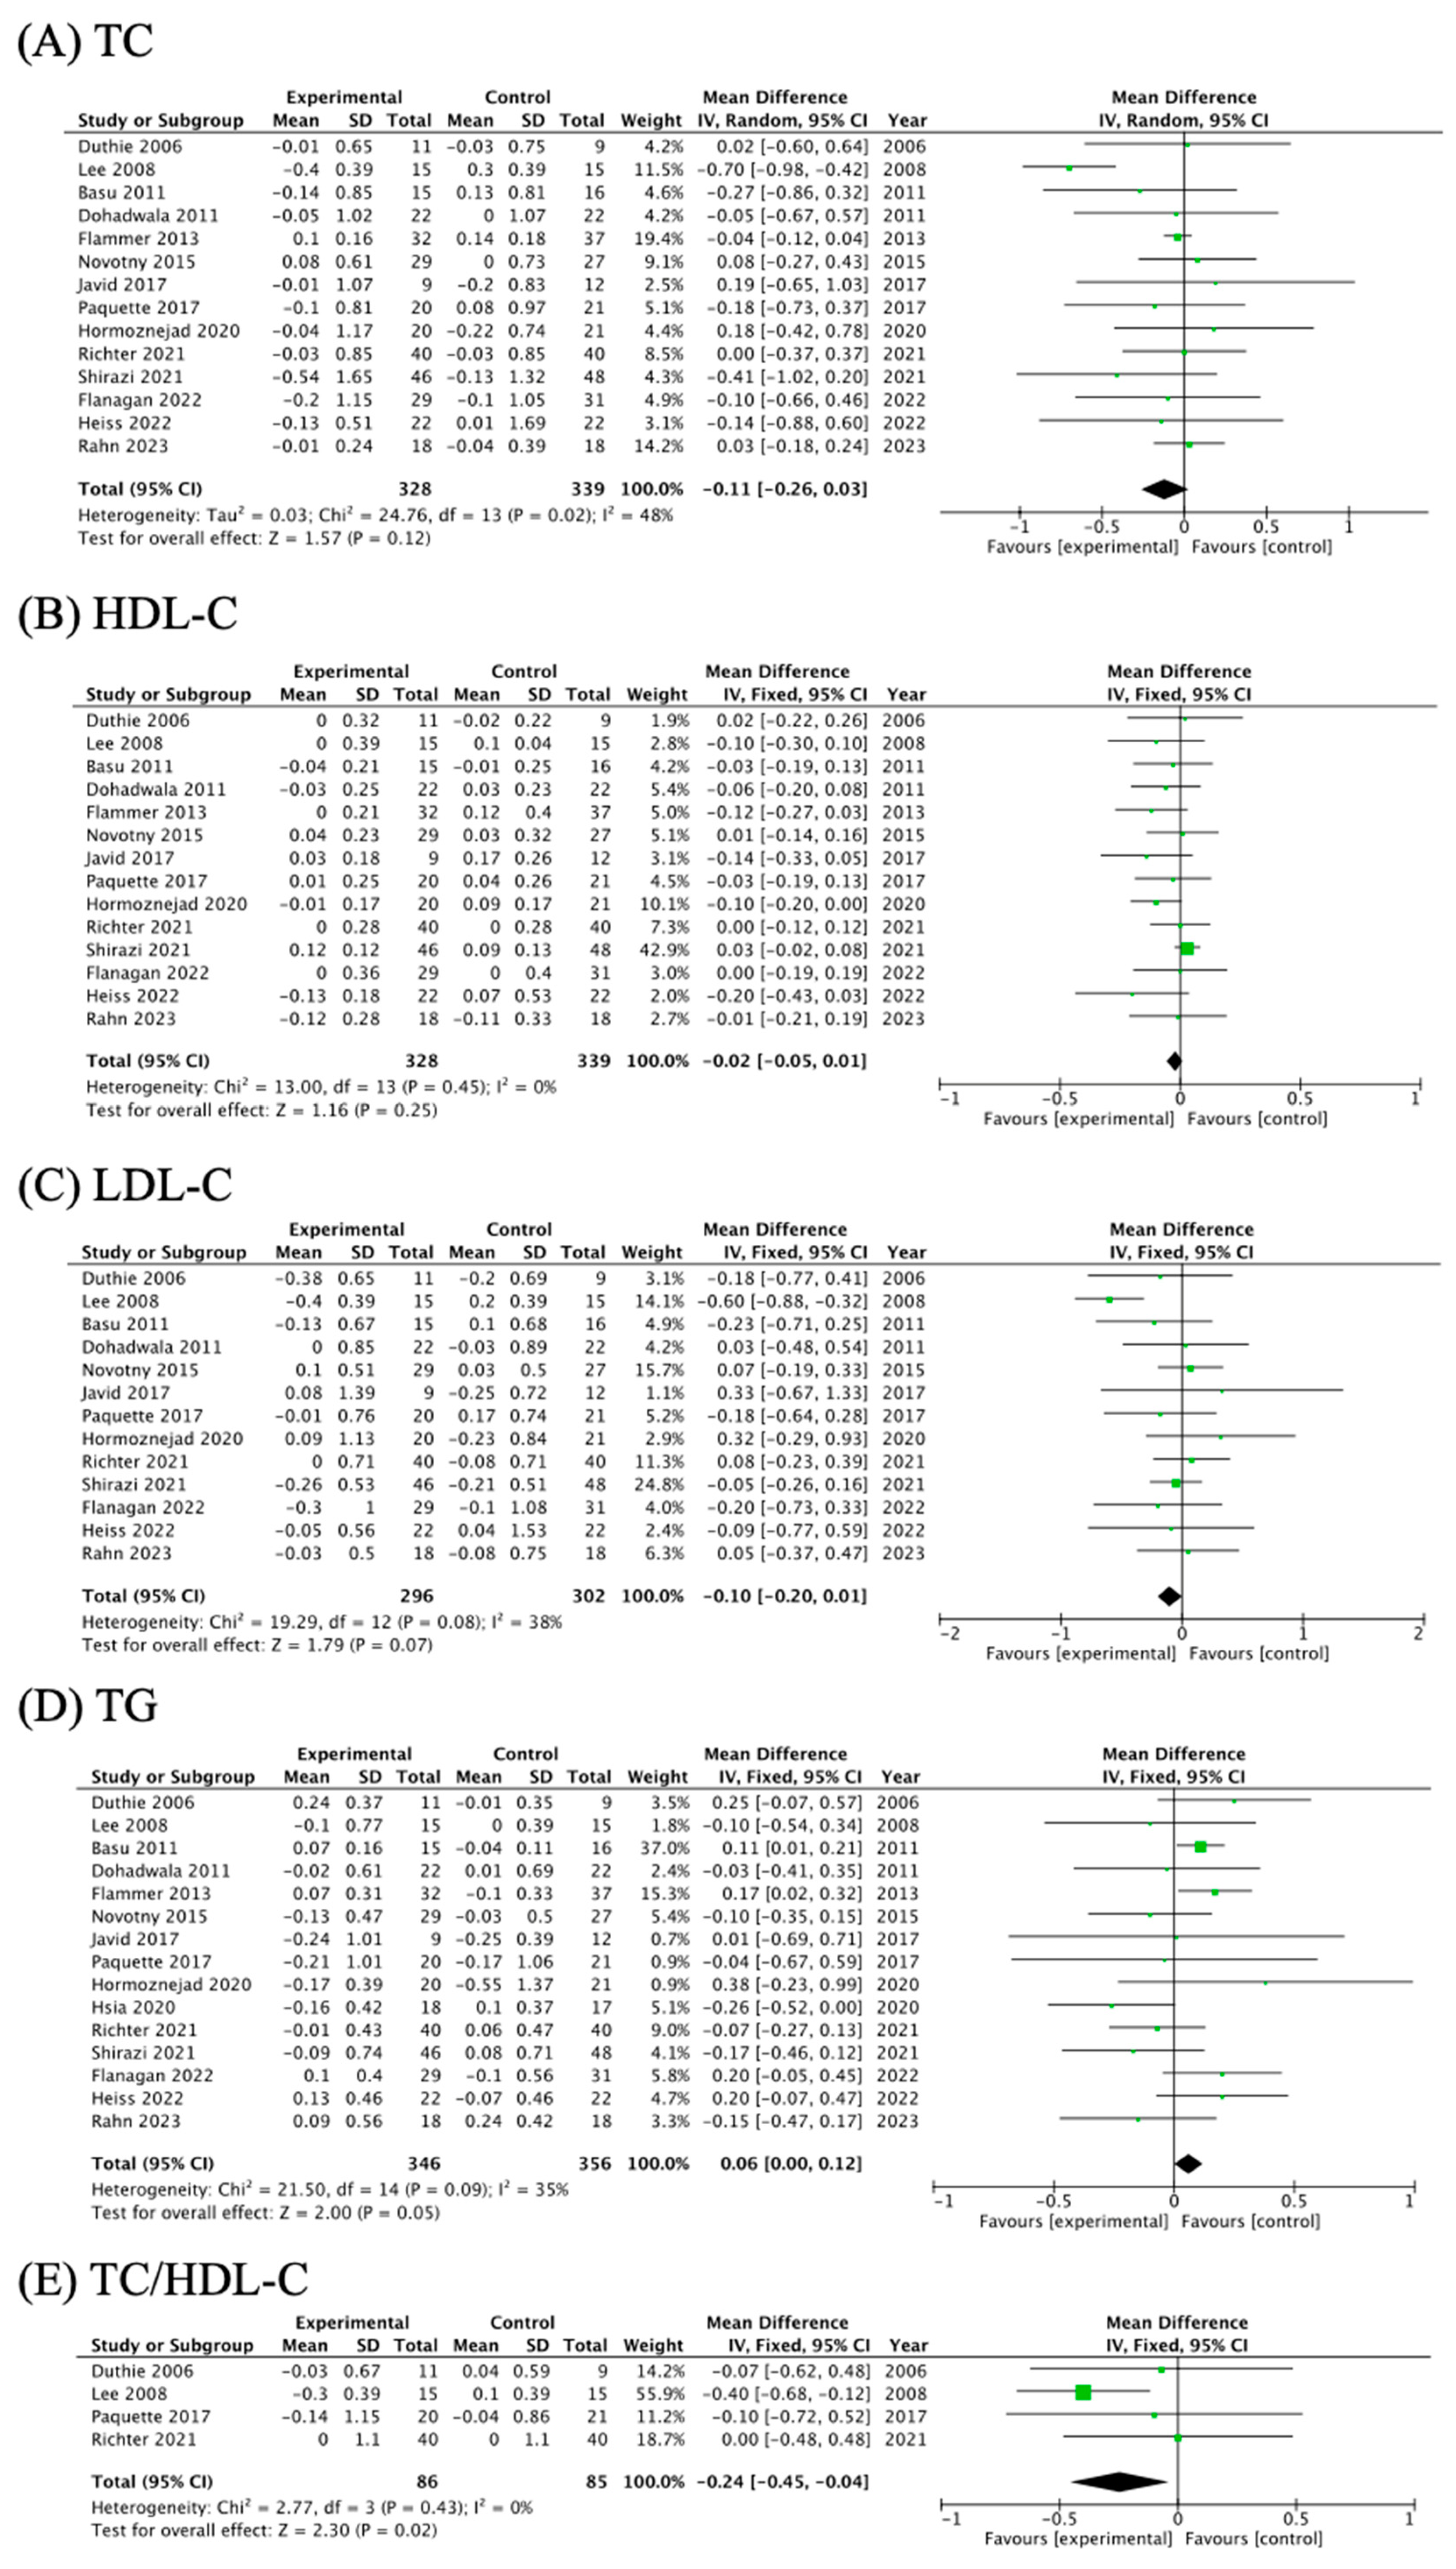
3.4. The Effects of Cranberry Supplementation on Blood Lipid Profiles
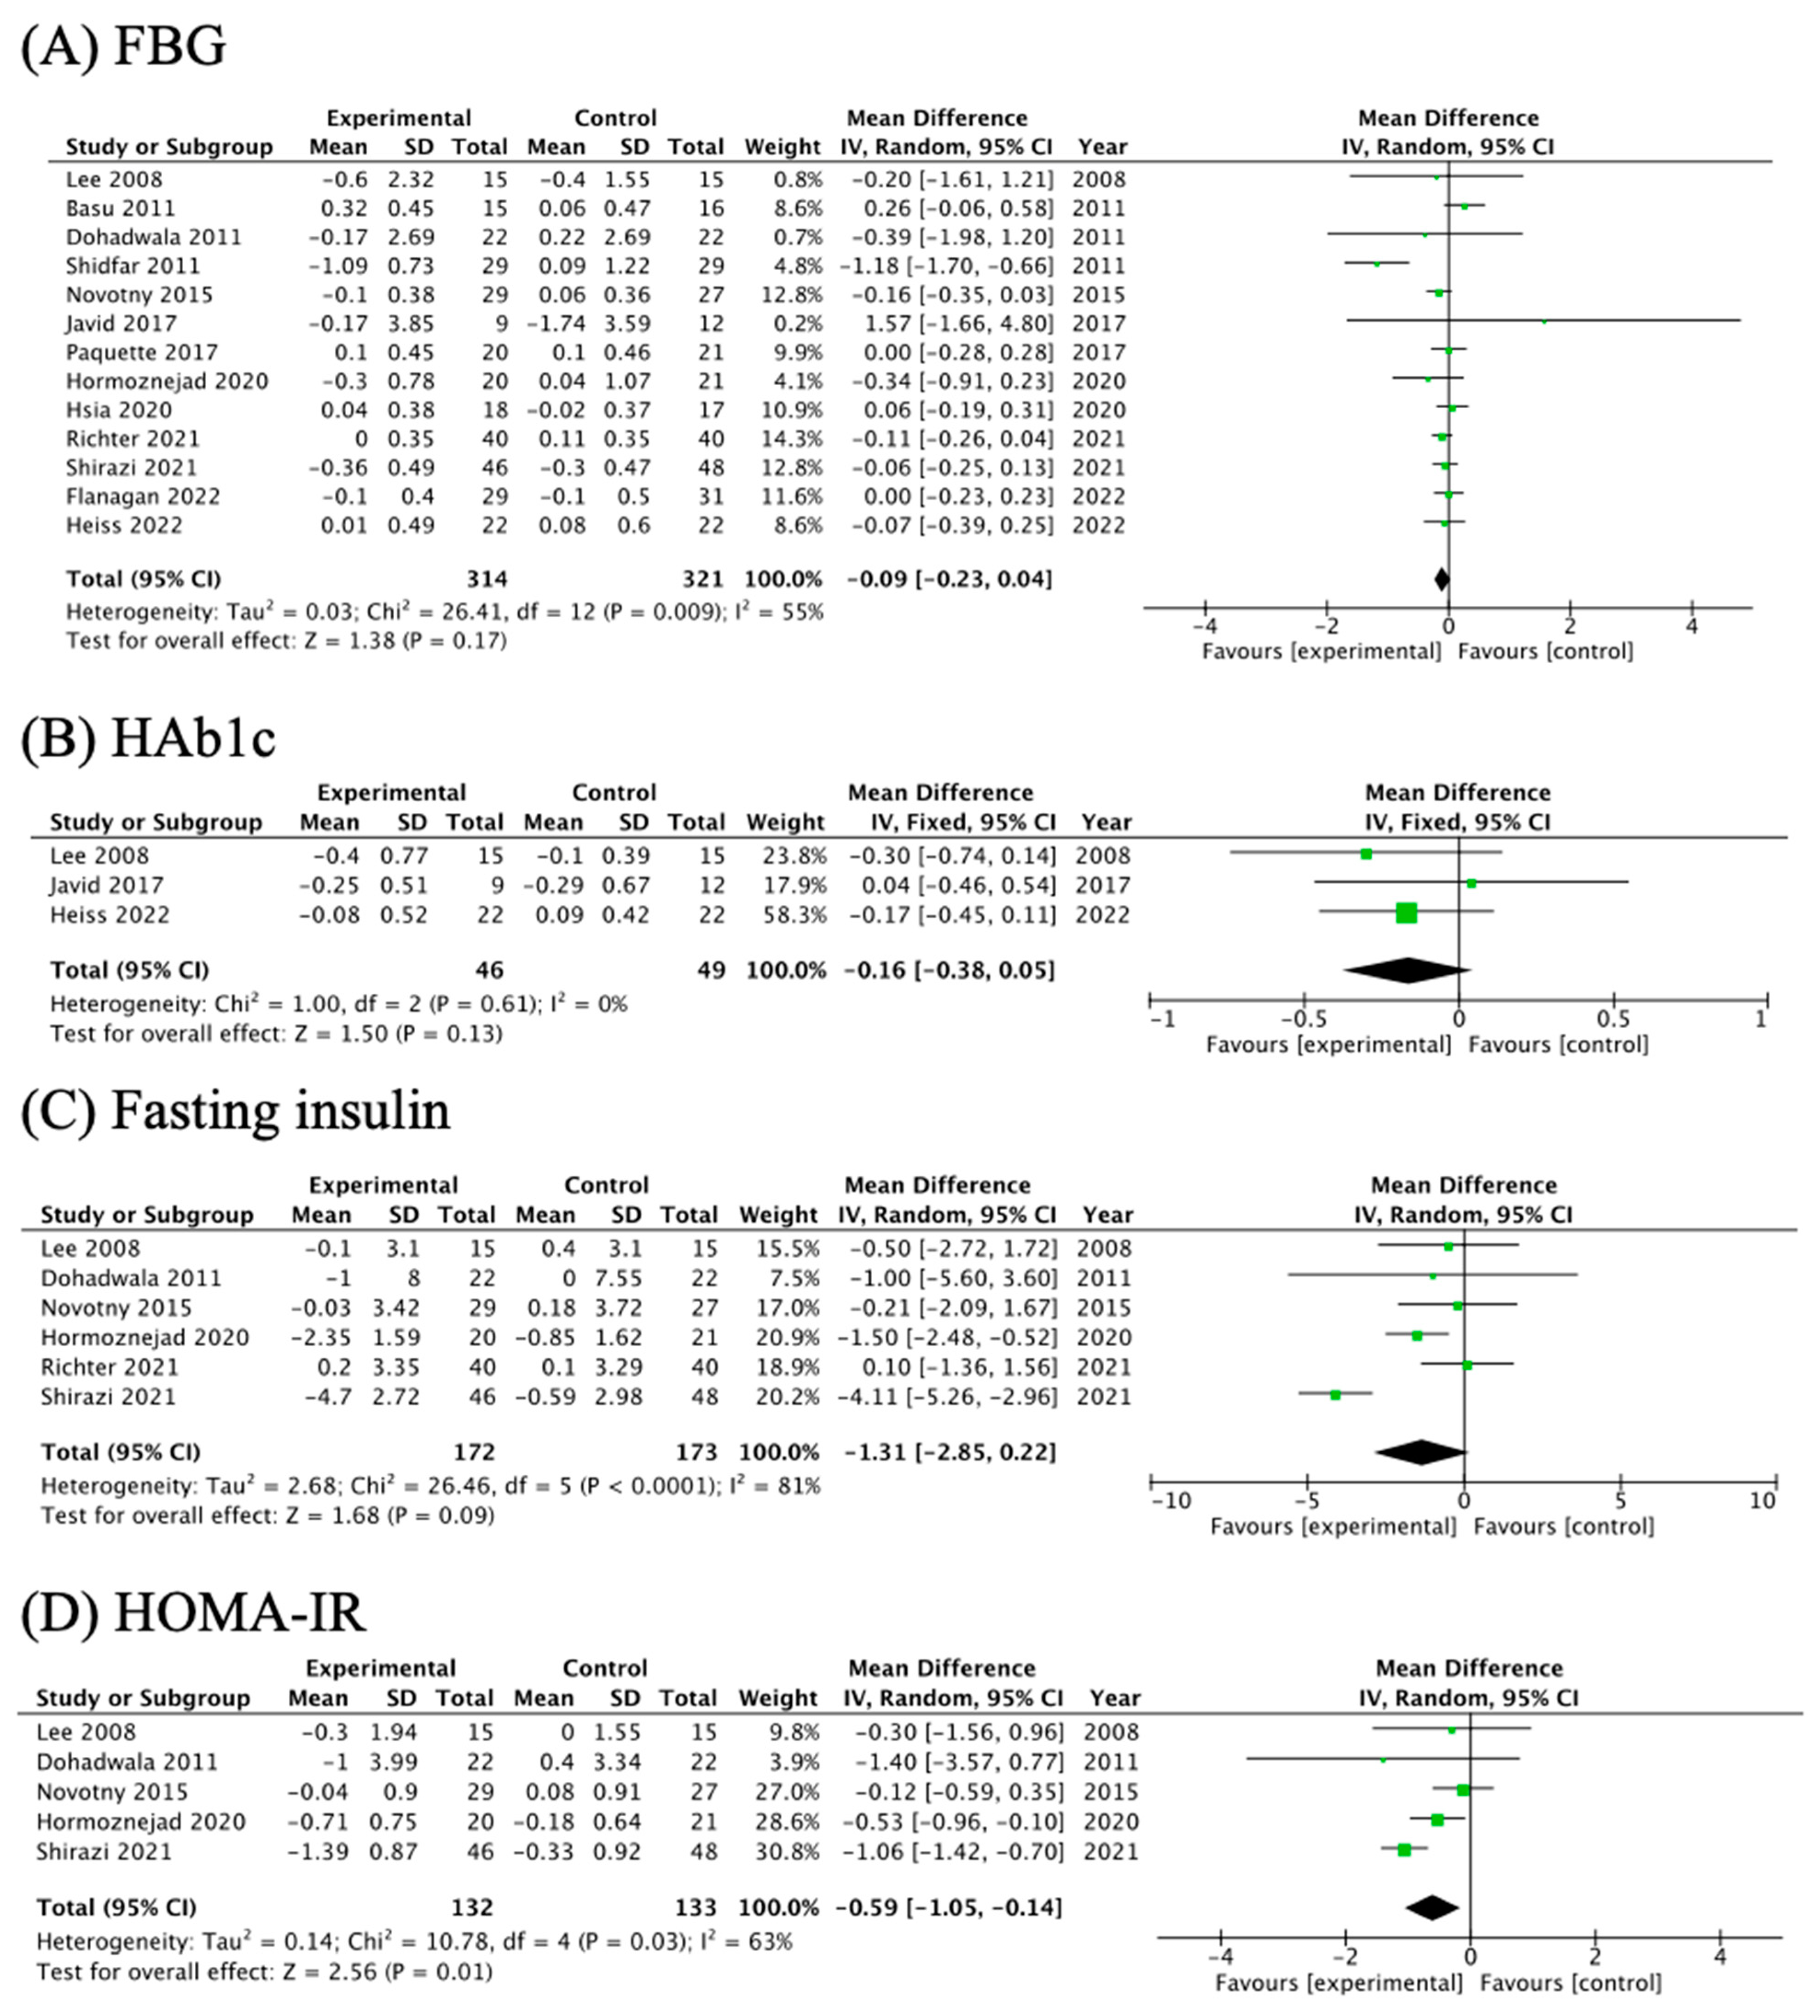
3.5. The Effects of Cranberry Supplementation on Glycemic Parameters
3.6. Subgroup Analysis and Sensitivity Analysis
4. Discussion
5. Conclusions
Supplementary Materials
Author Contributions
Funding
Data Availability Statement
Acknowledgments
Conflicts of Interest
Appendix A
References
- Diaz-Garcia, L.; Rodriguez-Bonilla, L.; Rohde, J.; Smith, T.; Zalapa, J. Pacbio Sequencing Reveals Identical Organelle Genomes between American Cranberry (Vaccinium macrocarpon Ait.) and a Wild Relative. Genes 2019, 10, 291. [Google Scholar] [CrossRef]
- Nemzer, B.V.; Al-Taher, F.; Yashin, A.; Revelsky, I.; Yashin, Y. Cranberry: Chemical Composition, Antioxidant Activity and Impact on Human Health: Overview. Molecules 2022, 27, 1503. [Google Scholar] [CrossRef]
- Williams, G.; Stothart, C.I.; Hahn, D.; Stephens, J.H.; Craig, J.C.; Hodson, E.M. Cranberries for preventing urinary tract infections. Cochrane Database Syst. Rev. 2023, 11, Cd001321. [Google Scholar] [CrossRef]
- García-Manríquez, N.; Lozano, C.; Muñoz, A.; Morales, M.F.; Giacaman, R.A. Anticaries properties of natural berries: Systematic literature review. Nutr. Rev. 2024, 82, 302–317. [Google Scholar] [CrossRef] [PubMed]
- Gao, T.; Hou, M.; Zhang, B.; Pan, X.; Liu, C.; Sun, C.; Jia, M.; Lin, S.; Xiong, K.; Ma, A. Effects of cranberry beverages on oxidative stress and gut microbiota in subjects with Helicobacter pylori infection: A randomized, double-blind, placebo-controlled trial. Food Funct. 2021, 12, 6878–6888. [Google Scholar] [CrossRef] [PubMed]
- Joseph, P.; Leong, D.; McKee, M.; Anand, S.S.; Schwalm, J.D.; Teo, K.; Mente, A.; Yusuf, S. Reducing the Global Burden of Cardiovascular Disease, Part 1: The Epidemiology and Risk Factors. Circ. Res. 2017, 121, 677–694. [Google Scholar] [CrossRef]
- Niesen, S.; Göttel, C.; Becker, H.; Bakuradze, T.; Winterhalter, P.; Richling, E. Fractionation of Extracts from Black Chokeberry, Cranberry, and Pomegranate to Identify Compounds That Influence Lipid Metabolism. Foods 2022, 11, 570. [Google Scholar] [CrossRef] [PubMed]
- Peixoto, T.C.; Moura, E.G.; de Oliveira, E.; Soares, P.N.; Guarda, D.S.; Bernardino, D.N.; Ai, X.X.; Rodrigues, V.; de Souza, G.R.; da Silva, A.J.R.; et al. Cranberry (Vaccinium macrocarpon) extract treatment improves triglyceridemia, liver cholesterol, liver steatosis, oxidative damage and corticosteronemia in rats rendered obese by high fat diet. Eur. J. Nutr. 2018, 57, 1829–1844. [Google Scholar] [CrossRef]
- Yung, L.M.; Tian, X.Y.; Wong, W.T.; Leung, F.P.; Yung, L.H.; Chen, Z.Y.; Lau, C.W.; Vanhoutte, P.M.; Yao, X.; Huang, Y. Chronic cranberry juice consumption restores cholesterol profiles and improves endothelial function in ovariectomized rats. Eur. J. Nutr. 2013, 52, 1145–1155. [Google Scholar] [CrossRef]
- Lee, I.T.; Chan, Y.C.; Lin, C.W.; Lee, W.J.; Sheu, W.H.H. Effect of cranberry extracts on lipid profiles in subjects with Type 2 diabetes. Diabet. Med. 2008, 25, 1473–1477. [Google Scholar] [CrossRef] [PubMed]
- Novotny, J.A.; Baer, D.J.; Khoo, C.; Gebauer, S.K.; Charrons, C.S. Cranberry Juice Consumption Lowers Markers of Cardiometabolic Risk, Including Blood Pressure and Circulating C-Reactive Protein, Triglyceride, and Glucose Concentrations in Adults. J. Nutr. 2015, 145, 1185–1193. [Google Scholar] [CrossRef] [PubMed]
- Duthie, S.J.; Jenkinson, A.M.; Crozier, A.; Mullen, W.; Pirie, L.; Kyle, J.; Yap, L.S.; Christen, P.; Duthie, G.G. The effects of cranberry juice consumption on antioxidant status and biomarkers relating to heart disease and cancer in healthy human volunteers. Eur. J. Nutr. 2006, 45, 113–122. [Google Scholar] [CrossRef] [PubMed]
- Shidfar, F.; Heydari, I.; Hajimiresmaiel, S.J.; Hosseini, S.; Shidfar, S.; Amiri, F. The effects of cranberry juice on serum glucose, apoB, apoA-I, Lp(a), and Paraoxonase-1 activity in type 2 diabetic male patients. J. Res. Med. Sci. 2012, 17, 355–360. [Google Scholar] [PubMed]
- Shirazi, K.M.; Shirinpour, E.; Shirazi, A.M.; Nikniaz, Z. Effect of cranberry supplementation on liver enzymes and cardiometabolic risk factors in patients with NAFLD: A randomized clinical trial. BMC Complement. Med. Ther. 2021, 21, 283. [Google Scholar] [CrossRef]
- Rahn, C.; Bakuradze, T.; Stegmüller, S.; Galan, J.; Niesen, S.; Winterhalter, P.; Richling, E. Polyphenol-Rich Beverage Consumption Affecting Parameters of the Lipid Metabolism in Healthy Subjects. Int. J. Mol. Sci. 2023, 24, 841. [Google Scholar] [CrossRef] [PubMed]
- Nordestgaard, B.G.; Langsted, A.; Mora, S.; Kolovou, G.; Baum, H.; Bruckert, E.; Watts, G.F.; Sypniewska, G.; Wiklund, O.; Borén, J.; et al. Fasting is not routinely required for determination of a lipid profile: Clinical and laboratory implications including flagging at desirable concentration cut-points-a joint consensus statement from the European Atherosclerosis Society and European Federation of Clinical Chemistry and Laboratory Medicine. Eur. Heart J. 2016, 37, 1944–1958. [Google Scholar] [CrossRef]
- ElSayed, N.A.; Aleppo, G.; Aroda, V.R.; Bannuru, R.R.; Brown, F.M.; Bruemmer, D.; Collins, B.S.; Hilliard, M.E.; Isaacs, D.; Johnson, E.L.; et al. 2. Classification and Diagnosis of Diabetes: Standards of Care in Diabetes-2023. Diabetes Care 2023, 46, S19–S40. [Google Scholar] [CrossRef]
- Higgins, J.P.T.; Savović, J.; Page, M.J.; Elbers, R.G.; Sterne, J.A.C. Chapter 8: Assessing risk of bias in a randomized trial. In Cochrane Handbook for Systematic Reviews of Interventions; Higgins, J.P.T., Thomas, J., Chandler, J., Cumpston, M., Li, T., Page, M.J., Welch, V.A., Eds.; 2023; Available online: www.training.cochrane.org/handbook (accessed on 1 February 2024).
- Higgins, J.P.T.; Li, T.; Deeks, J.J. Chapter 6: Choosing effect measures and computing estimates of effect. In Cochrane Handbook for Systematic Reviews of Interventions; Higgins, J.P.T., Thomas, J., Chandler, J., Cumpston, M., Li, T., Page, M.J., Welch, V.A., Eds.; 2023; Available online: www.training.cochrane.org/handbook (accessed on 1 February 2024).
- Wan, X.; Wang, W.; Liu, J.; Tong, T. Estimating the sample mean and standard deviation from the sample size, median, range and/or interquartile range. BMC Med. Res. Methodol. 2014, 14, 135. [Google Scholar] [CrossRef]
- McGrath, S.; Zhao, X.; Steele, R.; Thombs, B.D.; Benedetti, A. Estimating the sample mean and standard deviation from commonly reported quantiles in meta-analysis. Stat. Methods Med. Res. 2020, 29, 2520–2537. [Google Scholar] [CrossRef]
- Luo, D.; Wan, X.; Liu, J.; Tong, T. Optimally estimating the sample mean from the sample size, median, mid-range, and/or mid-quartile range. Stat. Methods Med. Res. 2018, 27, 1785–1805. [Google Scholar] [CrossRef]
- Sterne, J.A.; Sutton, A.J.; Ioannidis, J.P.; Terrin, N.; Jones, D.R.; Lau, J.; Carpenter, J.; Rücker, G.; Harbord, R.M.; Schmid, C.H.; et al. Recommendations for examining and interpreting funnel plot asymmetry in meta-analyses of randomised controlled trials. BMJ 2011, 343, d4002. [Google Scholar] [CrossRef]
- Basu, A.; Betts, N.M.; Ortiz, J.; Simmons, B.; Wu, M.; Lyons, T.J. Low-energy cranberry juice decreases lipid oxidation and increases plasma antioxidant capacity in women with metabolic syndrome. Nutr. Res. 2011, 31, 190–196. [Google Scholar] [CrossRef]
- Dohadwala, M.M.; Holbrook, M.; Hamburg, N.M.; Shenouda, S.M.; Chung, W.B.; Titas, M.; Kluge, M.A.; Wang, N.; Palmisano, J.; Milbury, P.E.; et al. Effects of cranberry juice consumption on vascular function in patients with coronary artery disease. Am. J. Clin. Nutr. 2011, 93, 934–940. [Google Scholar] [CrossRef] [PubMed]
- Flammer, A.J.; Martin, E.A.; Goessl, M.; Widmer, R.J.; Lennon, R.J.; Sexton, J.A.; Loeffler, D.; Khosla, S.; Lerman, L.O.; Lerman, A. Polyphenol-rich cranberry juice has a neutral effect on endothelial function but decreases the fraction of osteocalcin-expressing endothelial progenitor cells. Eur. J. Nutr. 2013, 52, 289–296. [Google Scholar] [CrossRef] [PubMed]
- Paquette, M.; Medina Larqué, A.S.; Weisnagel, S.J.; Desjardins, Y.; Marois, J.; Pilon, G.; Dudonné, S.; Marette, A.; Jacques, H. Strawberry and cranberry polyphenols improve insulin sensitivity in insulin-resistant, non-diabetic adults: A parallel, double-blind, controlled and randomised clinical trial. Br. J. Nutr. 2017, 117, 519–531. [Google Scholar] [CrossRef] [PubMed]
- Javid, A.Z.; Maghsoumi-Norouzabad, L.; Ashrafzadeh, E.; Yousefimanesh, H.A.; Zakerkish, M.; Angali, K.A.; Ravanbakhsh, M.; Babaei, H. Impact of Cranberry Juice Enriched with Omega-3 Fatty Acids Adjunct with Nonsurgical Periodontal Treatment on Metabolic Control and Periodontal Status in Type 2 Patients with Diabetes with Periodontal Disease. J. Am. Coll. Nutr. 2018, 37, 71–79. [Google Scholar] [CrossRef]
- Hormoznejad, R.; Mansoori, A.; Hosseini, S.A.; Zilaee, M.; Asadi, M.; Fathi, M.; Kiany, F. Effects of cranberry consumption on features of the metabolic syndrome: A systematic review and meta-analysis of randomized control trials. Nutr. Food Sci. 2020, 51, 1006–1016. [Google Scholar] [CrossRef]
- Hsia, D.S.; Zhang, D.J.; Beyl, R.S.; Greenway, F.L.; Khoo, C. Effect of daily consumption of cranberry beverage on insulin sensitivity and modification of cardiovascular risk factors in adults with obesity: A pilot, randomised, placebo-controlled study. Br. J. Nutr. 2020, 124, 577–585. [Google Scholar] [CrossRef]
- Richter, C.K.; Skulas-Ray, A.C.; Gaugler, T.L.; Meily, S.; Petersen, K.S.; Kris-Etherton, P.M. Effects of Cranberry Juice Supplementation on Cardiovascular Disease Risk Factors in Adults with Elevated Blood Pressure: A Randomized Controlled Trial. Nutrients 2021, 13, 2618. [Google Scholar] [CrossRef]
- Flanagan, E.; Cameron, D.; Sobhan, R.; Wong, C.; Pontifex, M.G.; Tosi, N.; Mena, P.; Del Rio, D.; Sami, S.; Narbad, A.; et al. Chronic Consumption of Cranberries (Vaccinium macrocarpon) for 12 Weeks Improves Episodic Memory and Regional Brain Perfusion in Healthy Older Adults: A Randomised, Placebo-Controlled, Parallel-Groups Feasibility Study. Front. Nutr. 2022, 9, 849902. [Google Scholar] [CrossRef]
- Heiss, C.; Istas, G.; Feliciano, R.P.; Weber, T.; Wang, B.; Favari, C.; Mena, P.; Del Rio, D.; Rodriguez-Mateos, A. Daily consumption of cranberry improves endothelial function in healthy adults: A double blind randomized controlled trial. Food Funct. 2022, 13, 3812–3824. [Google Scholar] [CrossRef] [PubMed]
- Sánchez, M.C.; Ribeiro-Vidal, H.; Bartolomé, B.; Figuero, E.; Moreno-Arribas, M.V.; Sanz, M.; Herrera, D. New Evidences of Antibacterial Effects of Cranberry against Periodontal Pathogens. Foods 2020, 9, 246. [Google Scholar] [CrossRef] [PubMed]
- Elshazly, M.B.; Quispe, R.; Michos, E.D.; Sniderman, A.D.; Toth, P.P.; Banach, M.; Kulkarni, K.R.; Coresh, J.; Blumenthal, R.S.; Jones, S.R.; et al. Patient-Level Discordance in Population Percentiles of the Total Cholesterol to High-Density Lipoprotein Cholesterol Ratio in Comparison with Low-Density Lipoprotein Cholesterol and Non-High-Density Lipoprotein Cholesterol: The Very Large Database of Lipids Study (VLDL-2B). Circulation 2015, 132, 667–676. [Google Scholar] [CrossRef] [PubMed]
- Manubolu, V.S.; Verghese, D.; Lakshmanan, S.; Alalawi, L.; Kinninger, A.; Bitar, J.A.; Calicchio, F.; Ahmad, K.; Ghanem, A.; Javier, D.A.; et al. Coronary computed tomography angiography evaluation of plaque morphology and its relationship to HDL and total cholesterol to HDL ratio. J. Clin. Lipidol. 2022, 16, 715–724. [Google Scholar] [CrossRef] [PubMed]
- Pikula, A.; Beiser, A.S.; Wang, J.; Himali, J.J.; Kelly-Hayes, M.; Kase, C.S.; Yang, Q.; Seshadri, S.; Wolf, P.A. Lipid and lipoprotein measurements and the risk of ischemic vascular events: Framingham Study. Neurology 2015, 84, 472–479. [Google Scholar] [CrossRef]
- Valenti, L.; Riso, P.; Mazzocchi, A.; Porrini, M.; Fargion, S.; Agostoni, C. Dietary anthocyanins as nutritional therapy for nonalcoholic fatty liver disease. Oxid. Med. Cell. Longev. 2013, 2013, 145421. [Google Scholar] [CrossRef]
- Ruel, G.; Pomerleau, S.; Couture, P.; Lamarche, B.; Couillard, C. Changes in plasma antioxidant capacity and oxidized low-density lipoprotein levels in men after short-term cranberry juice consumption. Metabolism 2005, 54, 856–861. [Google Scholar] [CrossRef]
- Pourmasoumi, M.; Hadi, A.; Najafgholizadeh, A.; Joukar, F.; Mansour-Ghanaei, F. The effects of cranberry on cardiovascular metabolic risk factors: A systematic review and meta-analysis. Clin. Nutr. 2020, 39, 774–788. [Google Scholar] [CrossRef]
- Ruel, G.; Pomerleau, S.; Couture, P.; Lemieux, S.; Lamarche, B.; Couillard, C. Favourable impact of low-calorie cranberry juice consumption on plasma HDL-cholesterol concentrations in men. Br. J. Nutr. 2006, 96, 357–364. [Google Scholar] [CrossRef]
- Son, D.H.; Lee, H.S.; Lee, Y.J.; Lee, J.H.; Han, J.H. Comparison of triglyceride-glucose index and HOMA-IR for predicting prevalence and incidence of metabolic syndrome. Nutr. Metab. Cardiovasc. Dis. 2022, 32, 596–604. [Google Scholar] [CrossRef] [PubMed]
- Faheem, S.A.; Saeed, N.M.; El-Naga, R.N.; Ayoub, I.M.; Azab, S.S. Hepatoprotective Effect of Cranberry Nutraceutical Extract in Non-alcoholic Fatty Liver Model in Rats: Impact on Insulin Resistance and Nrf-2 Expression. Front. Pharmacol. 2020, 11, 218. [Google Scholar] [CrossRef]
- Anhê, F.F.; Roy, D.; Pilon, G.; Dudonné, S.; Matamoros, S.; Varin, T.V.; Garofalo, C.; Moine, Q.; Desjardins, Y.; Levy, E.; et al. A polyphenol-rich cranberry extract protects from diet-induced obesity, insulin resistance and intestinal inflammation in association with increased Akkermansia spp. population in the gut microbiota of mice. Gut 2015, 64, 872–883. [Google Scholar] [CrossRef]
- Khanal, R.C.; Rogers, T.J.; Wilkes, S.E.; Howard, L.R.; Prior, R.L. Effects of dietary consumption of cranberry powder on metabolic parameters in growing rats fed high fructose diets. Food Funct. 2010, 1, 116–123. [Google Scholar] [CrossRef]
- Li, Z.; Tian, J.; Cheng, Z.; Teng, W.; Zhang, W.; Bao, Y.; Wang, Y.; Song, B.; Chen, Y.; Li, B. Hypoglycemic bioactivity of anthocyanins: A review on proposed targets and potential signaling pathways. Crit. Rev. Food Sci. Nutr. 2023, 63, 7878–7895. [Google Scholar] [CrossRef]
- Naz, R.; Saqib, F.; Awadallah, S.; Wahid, M.; Latif, M.F.; Iqbal, I.; Mubarak, M.S. Food Polyphenols and Type II Diabetes Mellitus: Pharmacology and Mechanisms. Molecules 2023, 28, 3996. [Google Scholar] [CrossRef]
- Schell, J.; Betts, N.M.; Foster, M.; Scofield, R.H.; Basu, A. Cranberries improve postprandial glucose excursions in type 2 diabetes. Food Funct. 2017, 8, 3083–3090. [Google Scholar] [CrossRef]
- Xu, X.; Grafenauer, S.; Barr, M.L.; Schutte, A.E. Impact of Fruit and Fruit Juice on Death and Disease Incidence: A Sex-Specific Longitudinal Analysis of 18 603 Adults. J. Am. Heart Assoc. 2023, 12, e030199. [Google Scholar] [CrossRef]
- Jepson, R.G.; Williams, G.; Craig, J.C. Cranberries for preventing urinary tract infections. Cochrane Database Syst. Rev. 2012, 10, Cd001321. [Google Scholar] [CrossRef]
- Michalska, A.; Wojdyło, A.; Honke, J.; Ciska, E.; Andlauer, W. Drying-induced physico-chemical changes in cranberry products. Food Chem. 2018, 240, 448–455. [Google Scholar] [CrossRef] [PubMed]
- Turck, D.; Bresson, J.L.; Burlingame, B.; Dean, T.; Fairweather-Tait, S.; Heinonen, M.; Hirsch-Ernst, K.I.; Mangelsdorf, I.; McArdle, H.J.; Naska, A.; et al. Safety of cranberry extract powder as a novel food ingredient pursuant to Regulation (EC) No 258/97. EFSA J. 2017, 15, e04777. [Google Scholar] [CrossRef] [PubMed]
- Delpino, F.M.; Figueiredo, L.M.; Gonçalves da Silva, T.; Flores, T.R. Effects of blueberry and cranberry on type 2 diabetes parameters in individuals with or without diabetes: A systematic review and meta-analysis of randomized clinical trials. Nutr. Metab. Cardiovasc. Dis. 2022, 32, 1093–1109. [Google Scholar] [CrossRef]
- Wilken, M.R.; Lambert, M.N.T.; Christensen, C.B.; Jeppesen, P.B. Effects of Anthocyanin-rich Berries on the Risk of Metabolic Syndrome: A Systematic Review and Meta-analysis. Rev. Diabet. Stud. 2022, 18, 42–57. [Google Scholar] [CrossRef]
- Milbury, P.E.; Vita, J.A.; Blumberg, J.B. Anthocyanins are bioavailable in humans following an acute dose of cranberry juice. J. Nutr. 2010, 140, 1099–1104. [Google Scholar] [CrossRef]
- Williamson, G.; Manach, C. Bioavailability and bioefficacy of polyphenols in humans. II. Review of 93 intervention studies. Am. J. Clin. Nutr. 2005, 81, 243s–255s. [Google Scholar] [CrossRef] [PubMed]
- Tena, N.; Martín, J.; Asuero, A.G. State of the Art of Anthocyanins: Antioxidant Activity, Sources, Bioavailability, and Therapeutic Effect in Human Health. Antioxidants 2020, 9, 451. [Google Scholar] [CrossRef] [PubMed]
- Lila, M.A.; Burton-Freeman, B.; Grace, M.; Kalt, W. Unraveling Anthocyanin Bioavailability for Human Health. Annu. Rev. Food Sci. Technol. 2016, 7, 375–393. [Google Scholar] [CrossRef] [PubMed]
- Di Lorenzo, C.; Colombo, F.; Biella, S.; Stockley, C.; Restani, P. Polyphenols and Human Health: The Role of Bioavailability. Nutrients 2021, 13, 273. [Google Scholar] [CrossRef] [PubMed]
- Calvano, A.; Izuora, K.; Oh, E.C.; Ebersole, J.L.; Lyons, T.J.; Basu, A. Dietary berries, insulin resistance and type 2 diabetes: An overview of human feeding trials. Food Funct. 2019, 10, 6227–6243. [Google Scholar] [CrossRef]
- Mehmood, A.; Zhao, L.; Wang, Y.; Pan, F.; Hao, S.; Zhang, H.; Iftikhar, A.; Usman, M. Dietary anthocyanins as potential natural modulators for the prevention and treatment of non-alcoholic fatty liver disease: A comprehensive review. Food Res. Int. 2021, 142, 110180. [Google Scholar] [CrossRef] [PubMed]
- Chiva-Blanch, G.; Badimon, L. Effects of Polyphenol Intake on Metabolic Syndrome: Current Evidences from Human Trials. Oxid. Med. Cell. Longev. 2017, 2017, 5812401. [Google Scholar] [CrossRef] [PubMed]
- Favari, C.; Mena, P.; Curti, C.; Istas, G.; Heiss, C.; Del Rio, D.; Rodriguez-Mateos, A. Kinetic profile and urinary excretion of phenyl-γ-valerolactones upon consumption of cranberry: A dose-response relationship. Food Funct. 2020, 11, 3975–3985. [Google Scholar] [CrossRef]
- Feliciano, R.P.; Mills, C.E.; Istas, G.; Heiss, C.; Rodriguez-Mateos, A. Absorption, Metabolism and Excretion of Cranberry (Poly)phenols in Humans: A Dose Response Study and Assessment of Inter-Individual Variability. Nutrients 2017, 9, 268. [Google Scholar] [CrossRef]
- Yang, K.; Chen, J.; Zhang, T.; Yuan, X.; Ge, A.; Wang, S.; Xu, H.; Zeng, L.; Ge, J. Efficacy and safety of dietary polyphenol supplementation in the treatment of non-alcoholic fatty liver disease: A systematic review and meta-analysis. Front. Immunol. 2022, 13, 949746. [Google Scholar] [CrossRef]
- Duffey, K.J.; Sutherland, L.A. Adult cranberry beverage consumers have healthier macronutrient intakes and measures of body composition compared to non-consumers: National Health and Nutrition Examination Survey (NHANES) 2005–2008. Nutrients 2013, 5, 4938–4949. [Google Scholar] [CrossRef]
- García-Mediavilla, V.; Crespo, I.; Collado, P.S.; Esteller, A.; Sánchez-Campos, S.; Tuñón, M.J.; González-Gallego, J. The anti-inflammatory flavones quercetin and kaempferol cause inhibition of inducible nitric oxide synthase, cyclooxygenase-2 and reactive C-protein, and down-regulation of the nuclear factor kappaB pathway in Chang Liver cells. Eur. J. Pharmacol. 2007, 557, 221–229. [Google Scholar] [CrossRef]


| Authors, Years | Country | Subjects | Type of Study | Sample Size (I/C) | Age | Intervention Group | Control Group | Intervention Time | Outcomes | |||
|---|---|---|---|---|---|---|---|---|---|---|---|---|
| Brands | Forms | Phenolic Content | Forms | Phenolic Content | ||||||||
| Duthie et al., 2006 [12] | UK | healthy female | parallel | 20 (11/9) | 18–40 | Ocean Spray, Middleborough, MA, USA | 750 mL/day cranberry juice | total polyphenols: 850 mg; anthocyanins: 2.2 mg; catechins 22 mg | 750 mL placebo drink | 0 | 2 weeks | no changes |
| Lee et al., 2008 [10] | Taiwan | type 2 diabetes | parallel | 30 (15/15) | 63–68 | Triarco Industries Inc., Cranbury, NJ, USA | 3 capsules of cranberry extracts (500 mg/capsule) | total polyphenols: 328.5 mg *; anthocyanins: 0.08 mg *; flavonoids 3.2 mg * | 3 placebo capsules | not mentioned | 12 weeks | TC, LDL-C, TC/HDL-C↓ |
| Dohadwala et al., 2011 [25] | USA | stable coronary artery disease | crossover | 22 (22/22) | 50–72 | Ocean Spray, Middleborough, MA, USA | 480 mL cranberry juice, double-strength (54% juice) | total polyphenols: 835 mg; anthocyanins: 94 mg | 480 mL placebo drink | 0 | 4 weeks | HDL-C↓ |
| Basu et al., 2011 [24] | USA | female with metabolic syndrome | parallel | 31 (15/16) | 44–60 | Ocean Spray, Middleborough, MA, USA | 480 mL cranberry juice | total polyphenols: 458 mg; anthocyanins: 24.8 mg | 480 mL placebo juice | 0 | 8 weeks | no changes |
| Shidfar et al., 2011 [13] | Iran | type 2 diabetic male | parallel | 58 (29/29) | 45–64 | Not mentioned | 240 mL cranberry juice | unavailable | 240 mL placebo drink | 0 | 12 weeks | no changes |
| Flammer et al., 2013 [26] | USA | peripheral endothelial dysfunction and cardiovascular risk factors | parallel | 69 (32/37) | 27–67 | Ocean Spray, Middleborough, MA, USA | 460 mL cranberry juice cocktail, double-strength (54% juice) | total polyphenols: 800 mg; anthocyanins: 70 mg | 460 mL placebo juice | 0 | 4 months | no changes |
| Novotny et al., 2015 [11] | USA | healthy | parallel | 56 (29/27) | 25–65 | Ocean Spray, Middleborough, MA, USA | 480 mL cranberry juice | total polyphenols: 346 mg; anthocyanins: 20.6 mg; proanthocyanins: 236 mg | 480 mL placebo juice | total polyphenols: 124 mg; anthocyanins: 0 | 8 weeks | TG, FBG, HOMA-IR↓ |
| Javid et al., 2017 [28] | Iran | diabetes and periodontal disease | parallel | 31 (9/12) | 35–67 | Takdaneh Industry & Cultivate Company, Tehran, Iran | 400 mL cranberry juice | total polyphenols: 390 mg; anthocyanins: 16 mg; proanthocyanins: 214 mg | none | none | 8 weeks | no changes |
| Paquette et al., 2017 [27] | Canada | overweight/obese with insulin resistant | parallel | 41 (20/21) | 40–70 | Nutra-Canada, Champlain, QC, Canada | 120 mL strawberry and cranberry polyphenols (SCP) beverage | total polyphenols: 333 mg; anthocyanins: unavailable | 120 mL SCP-free beverage | total polyphenols: around 10 mg | 6 weeks | no changes |
| Hsia et al., 2020 [30] | USA | obese with elevated fasting glucose/impaired glucose tolerance | parallel | 35 (18/17) | 31–63 | Ocean Spray, Middleborough, MA, USA | 450 mL low-calorie cranberry beverage | total polyphenols: 158 mg; anthocyanins: 6.75 mg; proanthocyanins: 143 mg | 450 mL placebo juice | 0 | 8 weeks | TG↓ when CRP > 4 mg/L |
| Hormoznejad et al., 2020 [29] | Iran | non-alcoholic fatty liver | parallel | 41 (20/21) | 30–55 | Shari Company, Tehran, Iran | 2 Cranberry tablets (equal to 26 g dried cranberry fruit) | total polyphenols and anthocyanins: unavailable proanthocyanins: 72 mg | Placebo tablets | 0 | 12 weeks | fasting insulin↓, HOMA-IR↓ in cranberry group; HDL-C↑ in placebo group |
| Richter et al., 2021 [31] | USA | overweight/obese and elevated brachial blood pressure | crossover | 40 (40/40) | 30–65 | Ocean Spray, Middleborough, MA, USA | 500 mL cranberry juice | total polyphenols: 320 mg; anthocyanins: 4.5 mg; phenolic acids: 68 mg; flavonols: 17 mg | 500 mL placebo drink | 0 | 8–12 weeks | no changes |
| Shirazi et al., 2021 [14] | Iran | patients with non-alcoholic fatty liver | parallel | 94 (46/48) | 32–55 | Shari Company, Tehran, Iran | 144 mg cranberry capsule (equal to 13 g dried cranberry fruit) | total polyphenols and anthocyanins: unavailable | placebo capsule | 0 | 6 months | TC, TG, insulin, HOMA-IR↓ |
| Heiss et al., 2022 [33] | UK | healthy male | parallel | 44 (22/22) | 18–45 | Cranberry Institute, Carver, MA, USA | 9 g cranberry powder | total polyphenols: 525 mg; anthocyanins: 54 mg; proanthocyanidins: 374.2 mg; phenolic acids: 17 mg | placebo powder | 0 | 1 month | No changes |
| Flanagan et al., 2022 [32] | UK | healthy | parallel | 60 (29/31) | 50–80 | Cranberry Institute, Carver, MA, USA | 9 g cranberry powder | total polyphenols: 588 mg; anthocyanins: 59 mg | placebo powder | 0 | 12 weeks | LDL-C↓ |
| Rahn et al., 2023 [15] | Germany | healthy male | parallel | 36 (18/18) | 22–27 | Eckes-Granini Group GmbH, Nieder-Olm, Germany | 750 mL drinks (51% chokeberry, cranberry, and pomegranate) | total polyphenols: 2250 mg; anthocyanins: 552 mg | 750 mL placebo drink | 0 | 8 weeks | TG↑ in placebo group |
| Indicators | Studies Numbers | I2 | pheterogeneity | MD | 95% CI | Z Values | peffect | Egger’s Test |
|---|---|---|---|---|---|---|---|---|
| TC | 14 | 48% | 0.02 | −0.11 | (−0.26, 0.03) | 1.57 | 0.12 | −0.59, 0.567 |
| HDL | 14 | 0% | 0.45 | −0.02 | (−0.05, 0.01) | 1.16 | 0.25 | −2.87, 0.015 |
| LDL | 13 | 38% | 0.08 | −0.10 | (−0.20, 0.01) | 1.79 | 0.07 | 0.46, 0.657 |
| TG | 15 | 35% | 0.09 | 0.06 | (0.00, 0.12) | 2.00 | 0.05 | −0.90, 0.385 |
| TC/HDL-C | 4 | 0% | 0.43 | −0.24 | (−0.45, −0.04) | 2.30 | 0.02 | / |
| FBG | 13 | 55% | 0.009 | −0.09 | (−0.23, 0.04) | 1.38 | 0.17 | −0.45, 0.660 |
| HbA1c | 3 | 0% | 0.61 | −0.16 | (−0.38, 0.05) | 1.50 | 0.13 | / |
| Insulin | 6 | 81% | <0.001 | −1.31 | (−2.85, 0.22) | 1.68 | 0.09 | / |
| HOMA-IR | 5 | 63% | 0.03 | −0.59 | (−1.05, −0.14) | 2.56 | 0.01 | / |
Disclaimer/Publisher’s Note: The statements, opinions and data contained in all publications are solely those of the individual author(s) and contributor(s) and not of MDPI and/or the editor(s). MDPI and/or the editor(s) disclaim responsibility for any injury to people or property resulting from any ideas, methods, instructions or products referred to in the content. |
© 2024 by the authors. Licensee MDPI, Basel, Switzerland. This article is an open access article distributed under the terms and conditions of the Creative Commons Attribution (CC BY) license (https://creativecommons.org/licenses/by/4.0/).
Share and Cite
Li, X.; Chen, W.; Xia, J.; Pan, D.; Sun, G. The Effects of Cranberry Consumption on Glycemic and Lipid Profiles in Humans: A Systematic Review and Meta-Analysis of Randomized Controlled Trials. Nutrients 2024, 16, 782. https://doi.org/10.3390/nu16060782
Li X, Chen W, Xia J, Pan D, Sun G. The Effects of Cranberry Consumption on Glycemic and Lipid Profiles in Humans: A Systematic Review and Meta-Analysis of Randomized Controlled Trials. Nutrients. 2024; 16(6):782. https://doi.org/10.3390/nu16060782
Chicago/Turabian StyleLi, Xiangrui, Wenqing Chen, Jiayue Xia, Da Pan, and Guiju Sun. 2024. "The Effects of Cranberry Consumption on Glycemic and Lipid Profiles in Humans: A Systematic Review and Meta-Analysis of Randomized Controlled Trials" Nutrients 16, no. 6: 782. https://doi.org/10.3390/nu16060782
APA StyleLi, X., Chen, W., Xia, J., Pan, D., & Sun, G. (2024). The Effects of Cranberry Consumption on Glycemic and Lipid Profiles in Humans: A Systematic Review and Meta-Analysis of Randomized Controlled Trials. Nutrients, 16(6), 782. https://doi.org/10.3390/nu16060782