Gender-Specific Bile Acid Profiles in Non-Alcoholic Fatty Liver Disease


 , ,
, ,
Abstract
1. Introduction
2. Material and Methods
2.1. Study Design
2.2. Laboratory Work
2.3. Mass Spectrometry Analyses
2.4. Enhanced Liver Fibrosis (ELF) Test
2.5. Statistics
3. Results
3.1. Table 1 and Table 2 Show Baseline Anthropometric and Clinical Characteristics of Female and Male Participants

| Characteristic | NAFLD, N = 17 1 | Controls, N = 52 1 | ALD, N = 12 1 | NAFLD vs. Controls 2 | NAFLD vs. ALD 2 | Controls vs. ALD 2 |
|---|---|---|---|---|---|---|
| Age | 53 (13) | 55 (8) | 48 (8) | 0.587 | 0.234 | 0.022 |
| BMI | 32.7 (27.3, 38.4) | 21.6 (20.5, 23.1) | 28.3 (22.4, 31.7) | <0.001 | 0.084 | 0.002 |
| Waist (cm) | 111 (100, 118) | 78 (73, 82) | NA (NA, NA) | <0.001 | NA | NA |
| Fasting Glucose (mg/dL) | 110 (95, 143) | 87 (84, 90) | 89 (85, 91) | <0.001 | 0.001 | 0.404 |
| AST (U/L) | 50 (38, 76) | 21 (18, 23) | 26 (23, 37) | <0.001 | 0.005 | 0.001 |
| ALT (U/L) | 71 (33, 95) | 17 (14, 20) | 24 (20, 28) | <0.001 | <0.001 | 0.001 |
| GGT (U/L) | 122 (72, 195) | 16 (11, 20) | 55 (37, 77) | <0.001 | 0.011 | <0.001 |
| Cholinesterase (U/L) | 8984 (6936, 9624) | 7500 (6588, 8636) | 5959 (5037, 7320) | 0.096 | 0.014 | 0.025 |
| Alcaline phosphatase (U/L) | 111 (78, 121) | 60 (50, 70) | 69 (53, 81) | <0.001 | 0.010 | 0.203 |
| Tchol (mg/dL) | 217 (190, 254) | 210 (189, 228) | 209 (197, 230) | 0.807 | >0.999 | 0.979 |
| HDL (mg/dL) | 45 (39, 53) | 84 (69, 93) | 60 (48, 74) | <0.001 | 0.086 | 0.005 |
| LDL (mg/dL) | 136 (97, 150) | 135 (106, 152) | 128 (100, 151) | 0.561 | >0.999 | 0.681 |
| TG (mg/dL) | 122 (100, 170) | 32 (28, 40) | 102 (60, 123) | <0.001 | 0.073 | <0.001 |
| Creatinin (mg/dL) | 0.78 (0.71, 0.91) | 0.75 (0.69, 0.81) | 0.73 (0.60, 0.87) | 0.132 | 0.307 | 0.890 |
| Urea nitrogen (mg/dL) | 31 (26, 36) | 28 (24, 32) | 26 (18, 30) | 0.107 | 0.073 | 0.222 |
| Uric acid (mg/dL) | 5.50 (4.80, 6.00) | 3.98 (3.61, 4.50) | 4.40 (3.68, 5.10) | <0.001 | 0.035 | 0.302 |
| Thrombocytes (G/L) | 222 (191, 272) | 253 (230, 290) | 240 (208, 286) | 0.066 | 0.352 | 0.497 |
| C-reactive protein (mg/dL) | 4.8 (2.1, 8.0) | 0.1 (0.1, 0.1) | 3.8 (1.6, 9.5) | <0.001 | 0.955 | <0.001 |
| Fib-4 index | 1.87 (1.06, 2.42) | 1.14 (0.92, 1.30) | 1.13 (0.72, 1.43) | 0.016 | 0.088 | 0.904 |
| FLI score | 93 (82, 98) | 3 (2, 5) | NA (NA, NA) | <0.001 | ||
| ELF Score | 9.24 (8.48, 10.37) | NA (NA, NA) | 8.57 (8.25, 9.31) | 0.438 | ||
| NAFLD Fibrosis Score | −0.57 (−1.48, −0.09) | −2.71 (−3.00, −2.06) | −2.23 (−2.31, −1.15) | <0.001 | 0.088 | 0.109 |
| Characteristic | NAFLD, N = 28 1 | Controls, N = 51 1 | ALD, N = 45 1 | NAFLD vs. Controls 2 | NAFLD vs. ALD 2 | Controls vs. ALD 2 |
|---|---|---|---|---|---|---|
| Age | 50 (14) | 53 (7) | 48 (9) | 0.397 | 0.435 | 0.007 |
| BMI | 28.9 (25.9, 30.9) | 22.7 (21.8, 24.0) | 26.2 (24.2, 29.4) | <0.001 | 0.024 | <0.001 |
| Waist (cm) | 103 (99, 110) | 86 (82, 91) | NA (NA, NA) | <0.001 | ||
| Fasting Glucose (mg/dL) | 99 (92, 113) | 89 (84, 94) | 88 (83, 94) | <0.001 | <0.001 | 0.964 |
| AST (U/L) | 52 (41, 72) | 23 (20, 27) | 31 (24, 50) | <0.001 | 0.001 | <0.001 |
| ALT (U/L) | 82 (57, 143) | 20 (18, 23) | 37 (25, 58) | <0.001 | <0.001 | <0.001 |
| GGT (U/L) | 115 (77, 282) | 20 (16, 25) | 121 (47, 292) | <0.001 | 0.371 | <0.001 |
| Cholinesterase (U/L) | 8335 (7690, 9596) | 7398 (6602, 8253) | 7629 (6374, 8272) | 0.004 | 0.009 | 0.849 |
| Alcaline phosphatase (U/L) | 70 (62, 81) | 54 (47, 68) | 67 (60, 87) | <0.001 | 0.921 | <0.001 |
| Tchol (mg/dL) | 186 (175, 222) | 193 (173, 218) | 188 (150, 214) | 0.914 | 0.578 | 0.340 |
| HDL (mg/dL) | 40 (33, 46) | 64 (59, 73) | 45 (34, 56) | <0.001 | 0.220 | <0.001 |
| LDL (mg/dL) | 112 (85, 142) | 130 (113, 151) | 116 (95, 140) | 0.048 | 0.781 | 0.051 |
| TG (mg/dL) | 139 (99, 178) | 68 (50, 80) | 97 (75, 133) | <0.001 | 0.018 | <0.001 |
| Creatinin (mg/dL) | 0.99 (0.91, 1.04) | 0.91 (0.82, 1.01) | 0.83 (0.76, 0.96) | 0.061 | 0.002 | 0.024 |
| Urea nitrogen (mg/dL) | 33 (30, 40) | 29 (25, 33) | 22 (18, 28) | 0.001 | <0.001 | <0.001 |
| Uric acid (mg/dL) | 6.40 (5.33, 7.30) | 5.22 (4.58, 5.77) | 5.60 (4.90, 6.30) | <0.001 | 0.064 | 0.042 |
| Thrombocytes (G/L) | 198 (152, 225) | 262 (223, 282) | 257 (214, 283) | <0.001 | <0.001 | >0.999 |
| C-reactive protein (mg/dL) | 1.2 (0.7, 3.2) | 0.1 (0.0, 0.1) | 2.6 (1.3, 4.4) | <0.001 | 0.008 | <0.001 |
| Fib-4 index | 1.41 (0.89, 2.87) | 1.16 (0.93, 1.38) | 1.02 (0.74, 1.36) | 0.088 | 0.045 | 0.274 |
| FLI score | 88 (77, 92) | 15 (9, 20) | NA (NA, NA) | <0.001 | ||
| ELF Score | 8.35 (8.20, 9.77) | NA (NA, NA) | 9.45 (8.51, 10.03) | 0.077 | ||
| FiB_Score | −1.11 (−2.63, 0.10) | −2.16 (−3.20, −1.60) | −2.73 (−3.32, −1.94) | 0.033 | 0.015 | 0.356 |
3.2. Bile Acids
3.2.1. Females
3.2.2. Males
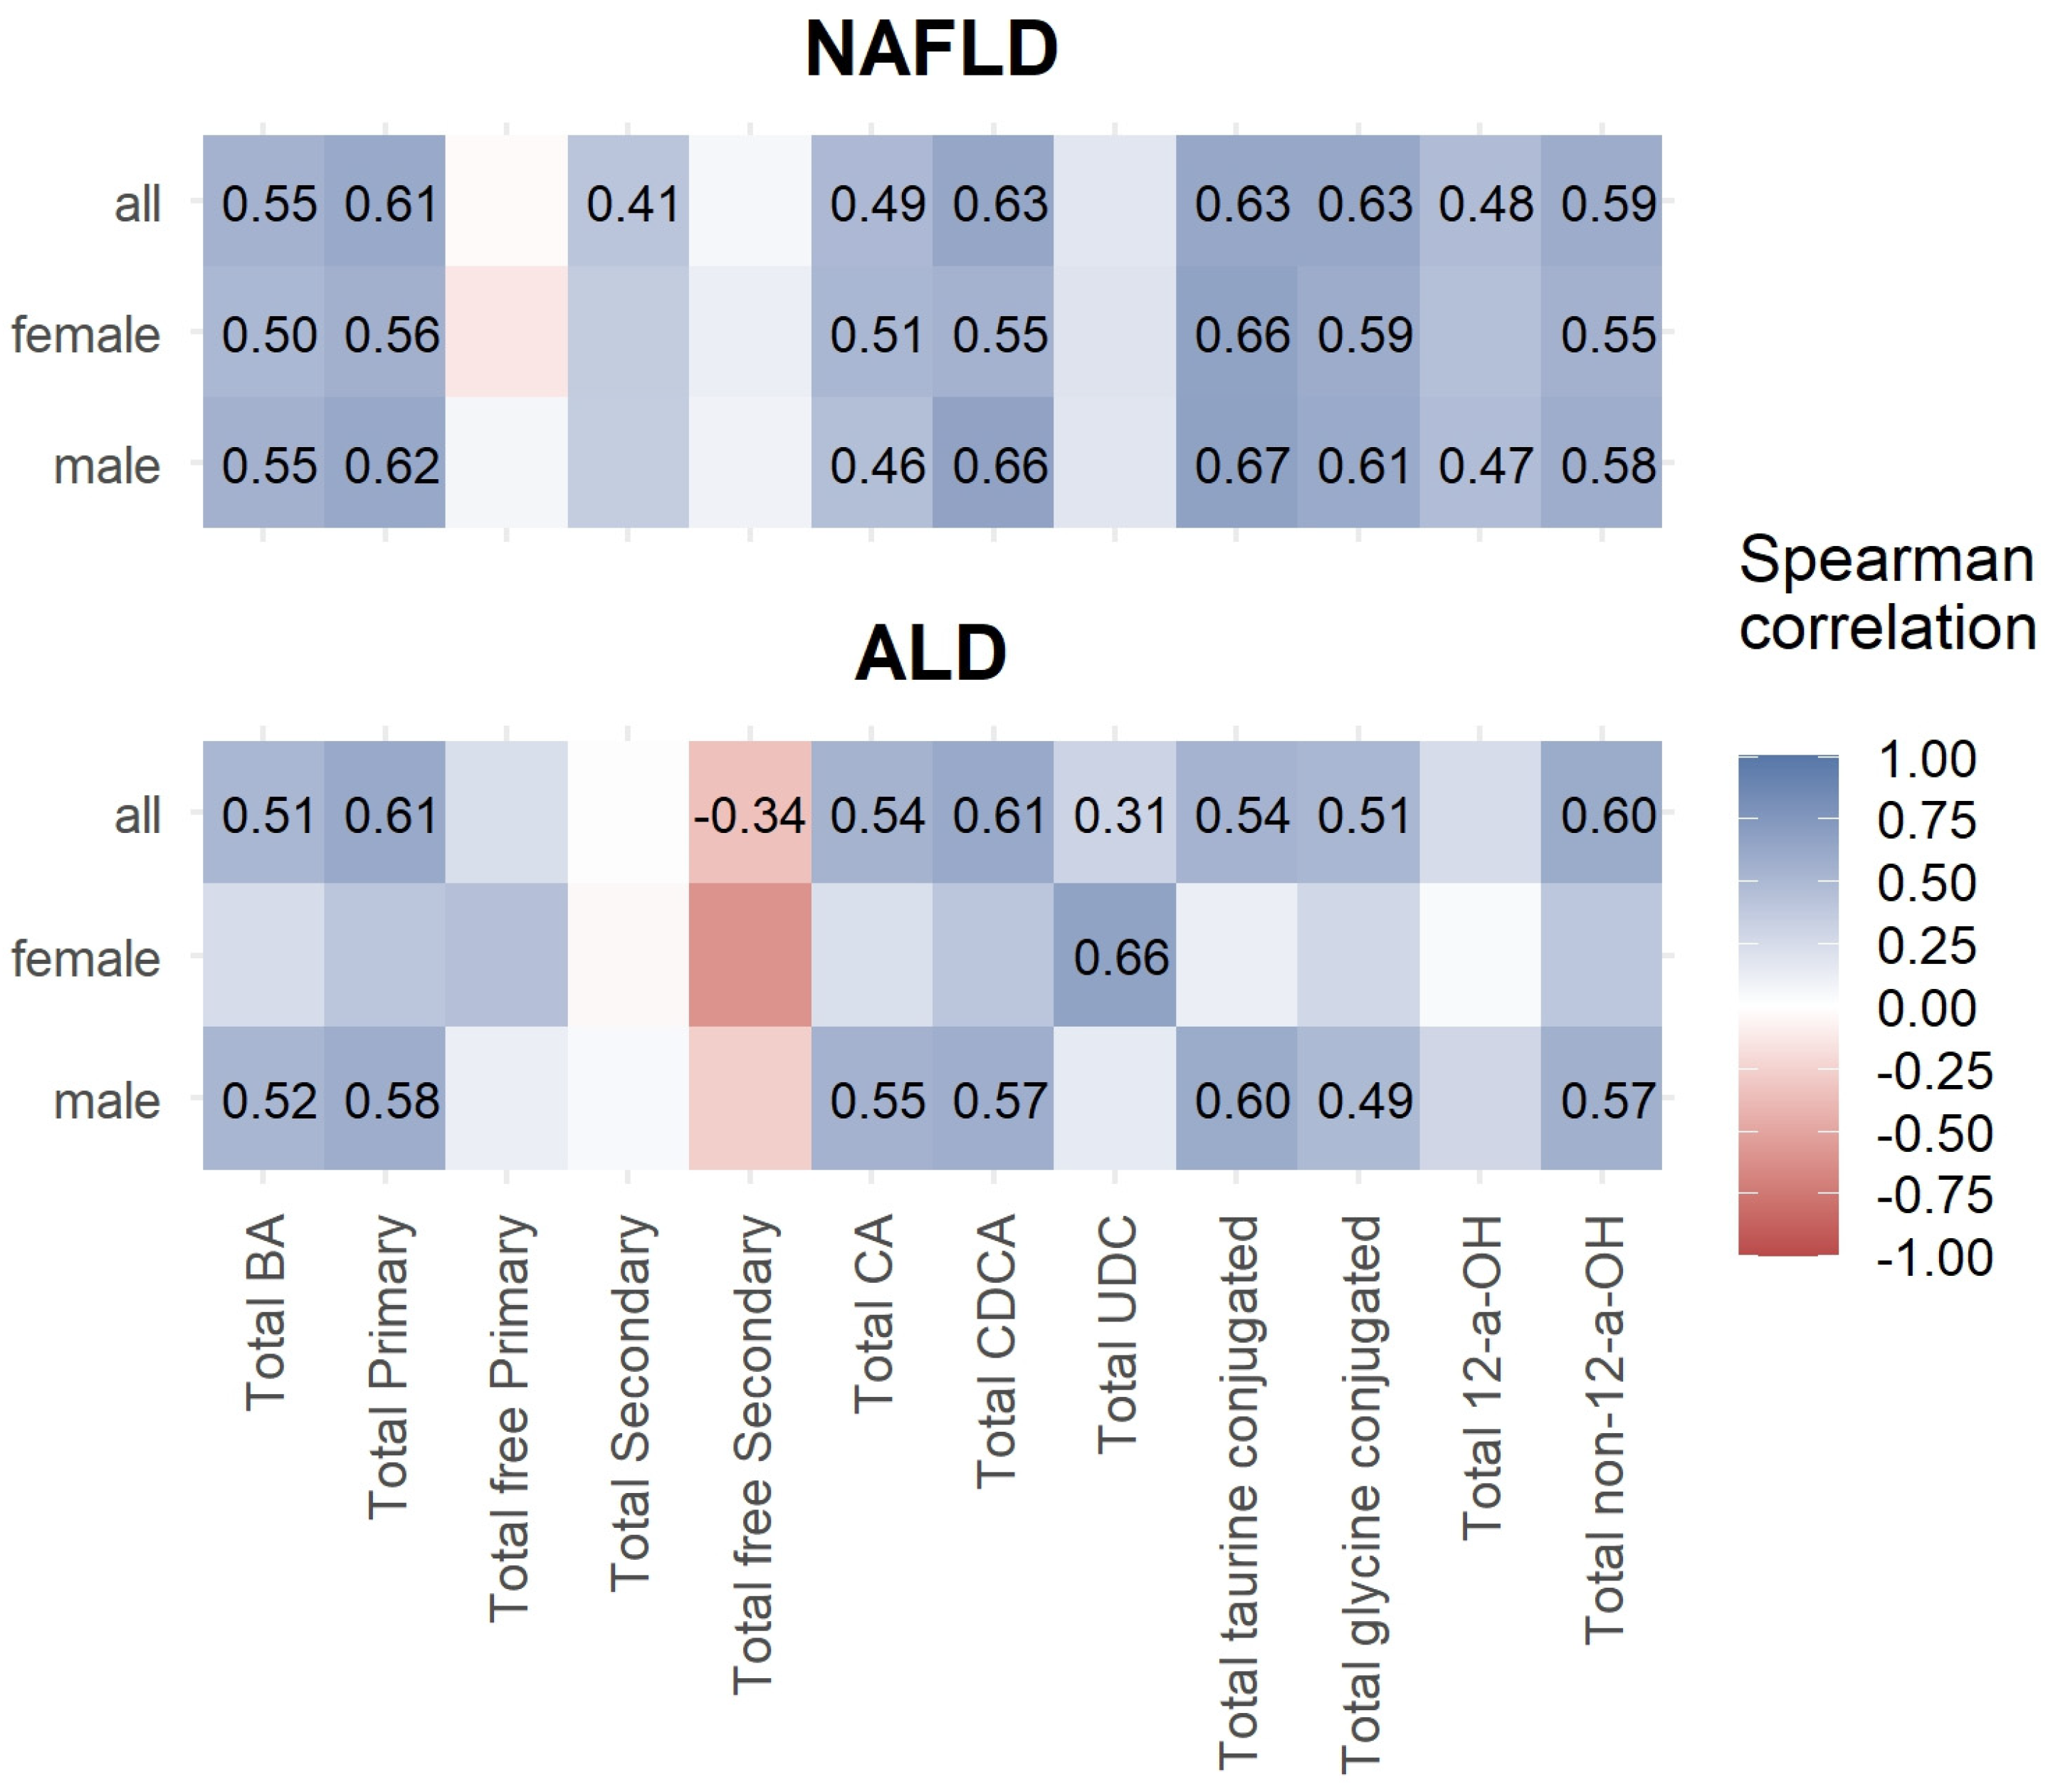
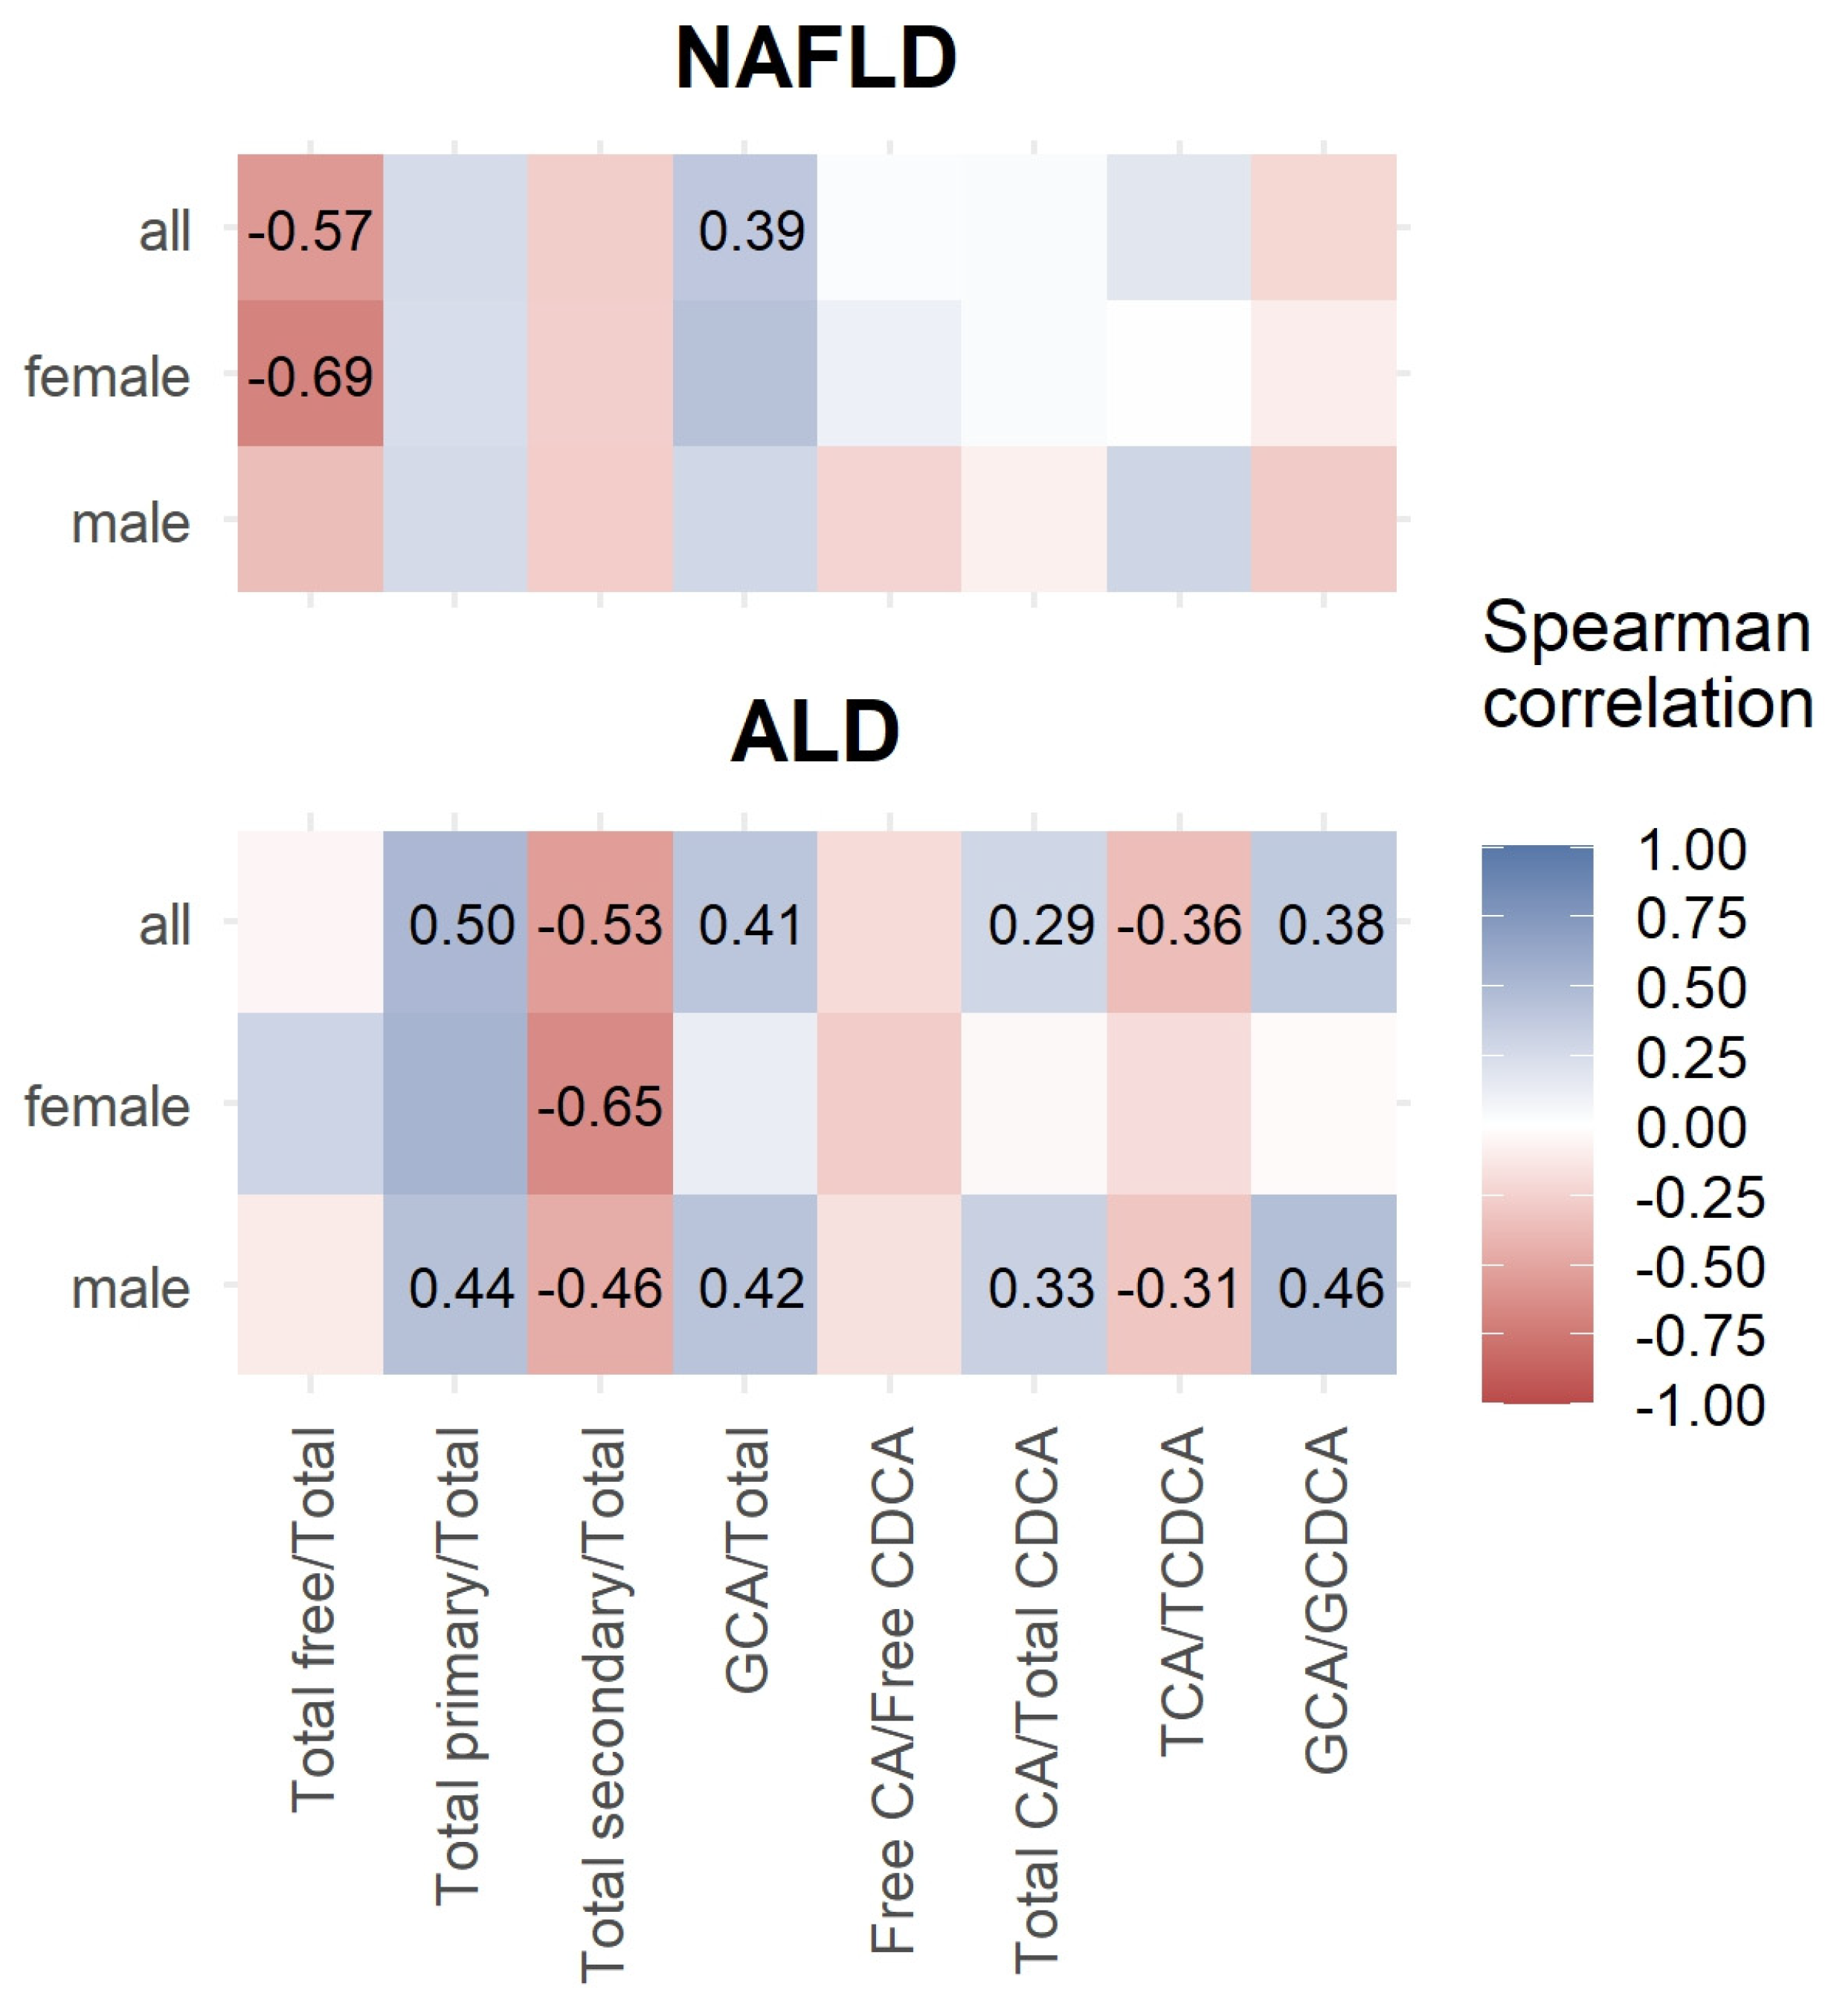
3.3. Correlations between Bile Acids and ELF Score
3.4. Bile Acids in NAFLD without and with NASH
4. Discussion
5. Conclusions
Author Contributions
Funding
Institutional Review Board Statement
Informed Consent Statement
Data Availability Statement
Conflicts of Interest
References
- Chacon, C.; Arteaga, I.; Martinez-Escude, A.; Ruiz Rojano, I.; Lamonja-Vicente, N.; Caballeria, L.; Ribatallada Diez, A.M.; Schröder, H.; Montraveta, M.; Bovo, M.V.; et al. Clinical epidemiology of non-alcoholic fatty liver disease in children and adolescents. The LiverKids: Study protocol. PLoS ONE 2023, 18, e0286586. [Google Scholar] [CrossRef] [PubMed]
- Younossi, Z.M.; Marchesini, G.; Pinto-Cortez, H.; Petta, S. Epidemiology of Nonalcoholic Fatty Liver Disease and Nonalcoholic Steatohepatitis: Implications for Liver Transplantation. Transplantation 2019, 103, 22–27. [Google Scholar] [CrossRef] [PubMed]
- Jayachandran, M.; Qu, S. Non-alcoholic fatty liver disease and gut microbial dysbiosis- underlying mechanisms and gut microbiota mediated treatment strategies. Rev. Endocr. Metab. Disord. 2023, 24, 1189–1204. [Google Scholar] [CrossRef] [PubMed]
- Machado, M.V.; Cortez-Pinto, H. NAFLD, MAFLD and obesity: Brothers in arms? Nat. Rev. Gastroenterol. Hepatol. 2023, 20, 67–68. [Google Scholar] [CrossRef]
- Eslam, M.; Newsome, P.N.; Sarin, S.K.; Anstee, Q.M.; Targher, G.; Romero-Gomez, M.; Zelber-Sagi, S.; Wai-Sun Wong, V.; Dufour, J.F.; Schattenberg, J.M.; et al. A new definition for metabolic dysfunction-associated fatty liver disease: An international expert consensus statement. J. Hepatol. 2020, 73, 202–209. [Google Scholar] [CrossRef]
- Rinella, M.E.; Lazarus, J.V.; Ratziu, V.; Francque, S.M.; Sanyal, A.J.; Kanwal, F.; Romero, D.; Abdelmalek, M.F.; Anstee, Q.M.; Arab, J.P.; et al. A multisociety Delphi consensus statement on new fatty liver disease nomenclature. Ann. Hepatol. 2023, 29, 101133. [Google Scholar] [CrossRef]
- Staufer, K.; Stauber, R.E. Steatotic Liver Disease: Metabolic Dysfunction, Alcohol, or Both? Biomedicines 2023, 11, 2108. [Google Scholar] [CrossRef]
- Feng, R.N.; Du, S.S.; Wang, C.; Li, Y.C.; Liu, L.Y.; Guo, F.C.; Sun, C.H. Lean-non-alcoholic fatty liver disease increases risk for metabolic disorders in a normal weight Chinese population. World J. Gastroenterol. 2014, 20, 17932–17940. [Google Scholar] [CrossRef]
- Younossi, Z.; Anstee, Q.M.; Marietti, M.; Hardy, T.; Henry, L.; Eslam, M.; George, J.; Bugianesi, E. Global burden of NAFLD and NASH: Trends, predictions, risk factors and prevention. Nat. Rev. Gastroenterol. Hepatol. 2018, 15, 11–20. [Google Scholar] [CrossRef]
- Feldman, A.; Eder, S.K.; Felder, T.K.; Kedenko, L.; Paulweber, B.; Stadlmayr, A.; Huber-Schonauer, U.; Niederseer, D.; Stickel, F.; Auer, S.; et al. Clinical and Metabolic Characterization of Lean Caucasian Subjects with Non-alcoholic Fatty Liver. Am. J. Gastroenterol. 2017, 112, 102–110. [Google Scholar] [CrossRef]
- Mangge, H.; Baumgartner, B.G.; Zelzer, S.; Pruller, F.; Schnedl, W.J.; Reininghaus, E.Z.; Haybaeck, J.; Lackner, C.; Stauber, R.; Aigner, E.; et al. Patatin-like phospholipase 3 (rs738409) gene polymorphism is associated with increased liver enzymes in obese adolescents and metabolic syndrome in all ages. Aliment. Pharmacol. Ther. 2015, 42, 99–105. [Google Scholar] [CrossRef] [PubMed]
- Chiang, J.Y.L. Bile acid metabolism and signaling in liver disease and therapy. Liver Res. 2017, 1, 3–9. [Google Scholar] [CrossRef] [PubMed]
- Way, G.W.; Jackson, K.G.; Muscu, S.R.; Zhou, H. Key Signaling in Alcohol-Associated Liver Disease: The Role of Bile Acids. Cells 2022, 11, 1374. [Google Scholar] [CrossRef] [PubMed]
- Wan, P.; Hengfan, N.I.; Dale, G.; Yun, D.; Manyun, D. Farnesoid X receptor regulators from natural products and their biological function. J. Tradit. Chin. Med. 2023, 43, 618–626. [Google Scholar] [CrossRef] [PubMed]
- Farooqui, N.; Elhence, A.; Shalimar. A Current Understanding of Bile Acids in Chronic Liver Disease. J. Clin. Exp. Hepatol. 2022, 12, 155–173. [Google Scholar] [CrossRef] [PubMed]
- Puri, P.; Daita, K.; Joyce, A.; Mirshahi, F.; Santhekadur, P.K.; Cazanave, S.; Luketic, V.A.; Siddiqui, M.S.; Boyett, S.; Min, H.K.; et al. The presence and severity of nonalcoholic steatohepatitis is associated with specific changes in circulating bile acids. Hepatology 2018, 67, 534–548. [Google Scholar] [CrossRef]
- McGlone, E.R.; Bloom, S.R. Bile acids and the metabolic syndrome. Ann. Clin. Biochem. 2019, 56, 326–337. [Google Scholar] [CrossRef]
- Chen, H.; Liu, Y.; Liu, D.; Liang, Y.; Zhu, Z.; Dong, K.; Li, H.; Bao, Y.; Wu, J.; Hou, X.; et al. Sex- and age-specific associations between abdominal fat and non-alcoholic fatty liver disease: A prospective cohort study. J. Mol. Cell Biol. 2023. epub ahead of print. [Google Scholar] [CrossRef]
- Perez-Rubio, A.; Soluyanova, P.; Moro, E.; Quintas, G.; Rienda, I.; Perianez, M.D.; Painel, A.; Vizuete, J.; Perez-Rojas, J.; Castell, J.V.; et al. Gut Microbiota and Plasma Bile Acids Associated with Non-Alcoholic Fatty Liver Disease Resolution in Bariatric Surgery Patients. Nutrients 2023, 15, 3187. [Google Scholar] [CrossRef]
- Masoodi, M.; Gastaldelli, A.; Hyotylainen, T.; Arretxe, E.; Alonso, C.; Gaggini, M.; Brosnan, J.; Anstee, Q.M.; Millet, O.; Ortiz, P.; et al. Metabolomics and lipidomics in NAFLD: Biomarkers and non-invasive diagnostic tests. Nat. Rev. Gastroenterol. Hepatol. 2021, 18, 835–856. [Google Scholar] [CrossRef]
- Piras, C.; Noto, A.; Ibba, L.; Deidda, M.; Fanos, V.; Muntoni, S.; Leoni, V.P.; Atzori, L. Contribution of Metabolomics to the Understanding of NAFLD and NASH Syndromes: A Systematic Review. Metabolites 2021, 11, 694. [Google Scholar] [CrossRef]
- Pieters, A.; Gijbels, E.; Cogliati, B.; Annaert, P.; Devisscher, L.; Vinken, M. Biomarkers of cholestasis. Biomark. Med. 2021, 15, 437–454. [Google Scholar] [CrossRef] [PubMed]
- Trottier, J.; Caron, P.; Straka, R.J.; Barbier, O. Profile of serum bile acids in noncholestatic volunteers: Gender-related differences in response to fenofibrate. Clin. Pharmacol. Ther. 2011, 90, 279–286. [Google Scholar] [CrossRef] [PubMed]
- Jia, W.; Wei, M.; Rajani, C.; Zheng, X. Targeting the alternative bile acid synthetic pathway for metabolic diseases. Protein Cell 2021, 12, 411–425. [Google Scholar] [CrossRef] [PubMed]
- Phelps, T.; Snyder, E.; Rodriguez, E.; Child, H.; Harvey, P. The influence of biological sex and sex hormones on bile acid synthesis and cholesterol homeostasis. Biol. Sex. Differ. 2019, 10, 52. [Google Scholar] [CrossRef] [PubMed]
- Yetti, H.; Naito, H.; Yuan, Y.; Jia, X.; Hayashi, Y.; Tamada, H.; Kitamori, K.; Ikeda, K.; Yamori, Y.; Nakajima, T. Bile acid detoxifying enzymes limit susceptibility to liver fibrosis in female SHRSP5/Dmcr rats fed with a high-fat-cholesterol diet. PLoS ONE 2018, 13, e0192863. [Google Scholar] [CrossRef]
- Hirano, F.; Haneda, M.; Makino, I. Chenodeoxycholic acid and taurochenodexycholic acid induce anti-apoptotic cIAP-1 expression in human hepatocytes. J. Gastroenterol. Hepatol. 2006, 21, 1807–1813. [Google Scholar] [CrossRef]
- Kasai, Y.; Kessoku, T.; Tanaka, K.; Yamamoto, A.; Takahashi, K.; Kobayashi, T.; Iwaki, M.; Ozaki, A.; Nogami, A.; Honda, Y.; et al. Association of Serum and Fecal Bile Acid Patterns with Liver Fibrosis in Biopsy-Proven Nonalcoholic Fatty Liver Disease: An Observational Study. Clin. Transl. Gastroenterol. 2022, 13, e00503. [Google Scholar] [CrossRef]
- Mozes, F.E.; Lee, J.A.; Selvaraj, E.A.; Jayaswal, A.N.A.; Trauner, M.; Boursier, J.; Fournier, C.; Staufer, K.; Stauber, R.E.; Bugianesi, E.; et al. Diagnostic accuracy of non-invasive tests for advanced fibrosis in patients with NAFLD: An individual patient data meta-analysis. Gut 2022, 71, 1006–1019. [Google Scholar] [CrossRef]
- Kjaergaard, M.; Lindvig, K.P.; Thorhauge, K.H.; Andersen, P.; Hansen, J.K.; Kastrup, N.; Jensen, J.M.; Hansen, C.D.; Johansen, S.; Israelsen, M.; et al. Using the ELF test, FIB-4 and NAFLD fibrosis score to screen the population for liver disease. J. Hepatol. 2023, 79, 277–286. [Google Scholar] [CrossRef]
| Characteristic (µmol/L) | NAFLD, N = 17 1 | Controls, N = 52 1 | ALD, N = 12 1 | NAFLD vs. Controls 2 | NAFLD vs. ALD 2 | Controls vs. ALD 2 |
|---|---|---|---|---|---|---|
| Total BA (µmol/L) | 2.89 (1.40, 6.50) | 1.18 (0.86, 2.30) | 0.95 (0.50, 1.90) | 0.009 | 0.049 | 0.327 |
| Total primary BA | 1.62 (1.25, 3.45) | 0.65 (0.45, 1.11) | 0.49 (0.27, 1.05) | 0.003 | 0.049 | 0.331 |
| Total free primary BA | 0.33 (0.13, 0.58) | 0.21 (0.11, 0.33) | 0.00 (0.00, 0.11) | 0.197 | 0.002 | <0.001 |
| Total secondary BA | 1.23 (0.33, 3.58) | 0.54 (0.42, 1.07) | 0.34 (0.18, 0.68) | 0.156 | 0.035 | 0.049 |
| Total free secondary BA | 0.40 (0.21, 0.48) | 0.22 (0.10, 0.32) | 0.15 (0.08, 0.25) | 0.092 | 0.013 | 0.164 |
| Total CA | 0.46 (0.21, 0.94) | 0.16 (0.08, 0.33) | 0.07 (0.00, 0.21) | 0.003 | 0.008 | 0.070 |
| Total CDCA | 1.16 (0.68, 2.88) | 0.46 (0.33, 0.77) | 0.42 (0.26, 0.89) | 0.004 | 0.088 | 0.655 |
| Total UDC | 0.17 (0.07, 0.22) | 0.09 (0.05, 0.18) | 0.00 (0.00, 0.00) | 0.126 | 0.004 | <0.001 |
| Total taurine-conjugated BA | 0.17 (0.10, 0.36) | 0.05 (0.03, 0.15) | 0.01 (0.01, 0.24) | 0.032 | 0.029 | 0.028 |
| Total glycine-conjugated BA | 1.89 (1.04, 5.15) | 0.65 (0.40, 1.10) | 0.74 (0.32, 1.25) | 0.007 | 0.066 | 0.923 |
| Total 12-a-OH BA | 1.59 (0.46, 3.27) | 0.59 (0.43, 1.02) | 0.41 (0.19, 0.75) | 0.035 | 0.035 | 0.109 |
| Total non-12-a-OH BA | 1.45 (0.80, 3.86) | 0.61 (0.45, 1.07) | 0.44 (0.28, 0.93) | 0.010 | 0.048 | 0.244 |
| Chenodeoxycholic acid | 0.20 (0.09, 0.41) | 0.15 (0.07, 0.22) | 0.00 (0.00, 0.11) | 0.234 | 0.014 | 0.004 |
| Cholic acid | 0.06 (0.02, 0.24) | 0.03 (0.02, 0.11) | 0.00 (0.00, 0.00) | 0.350 | <0.001 | <0.001 |
| Deoxycholic acid | 0.20 (0.09, 0.34) | 0.17 (0.07, 0.24) | 0.12 (0.05, 0.25) | 0.372 | 0.222 | 0.563 |
| Glycocholic acid | 0.19 (0.12, 0.68) | 0.07 (0.04, 0.12) | 0.07 (0.00, 0.17) | <0.001 | 0.025 | 0.468 |
| Glycochenodeoxycholic acid | 0.84 (0.61, 2.27) | 0.25 (0.17, 0.44) | 0.40 (0.20, 0.62) | 0.005 | 0.127 | 0.377 |
| Glycodeoxycholic acid | 0.77 (0.07, 2.26) | 0.24 (0.14, 0.48) | 0.04 (0.00, 0.23) | 0.103 | 0.008 | 0.008 |
| Glycolithocholic acid | 0.015 (0.010, 0.026) | 0.016 (0.012, 0.026) | 0.001 (0.001, 0.001) | 0.403 | 0.008 | <0.001 |
| Glycoursodeoxycholic acid | 0.08 (0.03, 0.13) | 0.04 (0.02, 0.07) | 0.00 (0.00, 0.03) | 0.061 | 0.011 | 0.010 |
| Lithocholic acid | 0.003 (0.001, 0.011) | 0.007 (0.003, 0.013) | 0.001 (0.001, 0.001) | 0.330 | <0.001 | <0.001 |
| Taurocholic acid | 0.02 (0.01, 0.09) | 0.01 (0.00, 0.03) | 0.00 (0.00, 0.03) | 0.035 | 0.048 | 0.048 |
| Taurochenodeoxycholic acid | 0.14 (0.04, 0.24) | 0.03 (0.02, 0.08) | 0.00 (0.00, 0.09) | 0.025 | 0.018 | 0.007 |
| Taurodeoxycholic acid | 0.01 (0.00, 0.04) | 0.01 (0.00, 0.04) | 0.00 (0.00, 0.00) | 0.954 | 0.044 | 0.010 |
| Taurolithocholic acid | 0.0010 (0.0010, 0.0010) | 0.0010 (0.0010, 0.0010) | 0.0010 (0.0010, 0.0010) | 0.740 | 0.143 | 0.151 |
| Tauroursodeoxycholic acid | 0.001 (0.001, 0.008) | 0.001 (0.001, 0.001) | 0.001 (0.001, 0.001) | 0.060 | 0.268 | 0.931 |
| Ursodeoxycholic acid | 0.08 (0.04, 0.14) | 0.04 (0.02, 0.09) | 0.00 (0.00, 0.00) | 0.063 | <0.001 | <0.001 |
| Total free/total BA | 0.08 (0.02, 0.22) | 0.16 (0.09, 0.24) | 0.01 (0.00, 0.11) | 0.116 | 0.054 | 0.004 |
| Total primary/total BA | 0.59 (0.48, 0.61) | 0.51 (0.48, 0.56) | 0.60 (0.52, 0.82) | 0.153 | 0.580 | 0.058 |
| GCA/total BA | 0.10 (0.07, 0.13) | 0.06 (0.04, 0.09) | 0.08 (0.04, 0.09) | 0.015 | 0.191 | 0.813 |
| Free CA/free CDCA | 0.4 (0.2, 0.9) | 0.4 (0.1, 1.9) | 1.0 (0.0, 1.0) | 0.899 | 0.964 | 0.489 |
| Total CA/total CDCA | 0.38 (0.28, 0.57) | 0.34 (0.20, 0.50) | 0.17 (0.06, 0.41) | 0.453 | 0.044 | 0.043 |
| TCA/TCDCA | 0.26 (0.21, 0.40) | 0.17 (0.09, 0.29) | 1.00 (0.49, 1.00) | 0.036 | 0.001 | <0.001 |
| GCA/GCDCA | 0.36 (0.21, 0.62) | 0.27 (0.21, 0.39) | 0.17 (0.06, 0.40) | 0.257 | 0.054 | 0.065 |
| Characteristic (µmol/L) | NAFLD, N = 28 1 | Controls, N = 51 1 | ALD, N = 45 1 | NAFLD vs. Controls 2 | NAFLD vs. ALD 2 | Controls vs. ALD 2 |
|---|---|---|---|---|---|---|
| Total BA | 2.88 (1.49, 3.97) | 1.85 (1.30, 2.43) | 1.50 (0.80, 2.90) | 0.090 | 0.012 | 0.129 |
| Total primary BA | 1.23 (0.68, 2.61) | 0.97 (0.64, 1.50) | 1.06 (0.43, 1.88) | 0.247 | 0.158 | 0.658 |
| Total free primary BA | 0.32 (0.18, 0.54) | 0.32 (0.24, 0.54) | 0.05 (0.00, 0.24) | 0.416 | <0.001 | <0.001 |
| Total secondary BA | 1.12 (0.75, 1.90) | 0.82 (0.59, 1.19) | 0.46 (0.20, 0.76) | 0.047 | <0.001 | <0.001 |
| Total free secondary BA | 0.47 (0.33, 0.67) | 0.41 (0.27, 0.56) | 0.18 (0.04, 0.32) | 0.587 | <0.001 | <0.001 |
| Total CA | 0.34 (0.15, 0.67) | 0.38 (0.27, 0.51) | 0.14 (0.06, 0.30) | 0.718 | 0.005 | <0.001 |
| Total CDCA | 0.83 (0.55, 2.07) | 0.59 (0.44, 0.98) | 0.89 (0.36, 1.56) | 0.049 | 0.424 | 0.398 |
| Total UDC | 0.17 (0.08, 0.50) | 0.20 (0.20, 0.30) | 0.00 (0.00, 0.20) | 0.376 | <0.001 | <0.001 |
| Total taurine-conjugated BA | 0.10 (0.05, 0.50) | 0.16 (0.10, 0.22) | 0.05 (0.01, 0.17) | 0.884 | 0.007 | 0.001 |
| Total glycine-conjugated BA | 1.01 (0.67, 2.72) | 0.88 (0.42, 1.28) | 1.00 (0.52, 1.99) | 0.071 | 0.202 | 0.440 |
| Total 12-a-OH BA | 1.15 (0.64, 2.47) | 0.93 (0.63, 1.34) | 0.49 (0.26, 0.81) | 0.299 | <0.001 | <0.001 |
| Total non-12-a-OH BA | 1.36 (0.81, 2.27) | 0.88 (0.63, 1.25) | 0.98 (0.37, 2.07) | 0.028 | 0.124 | 0.942 |
| Chenodeoxycholic acid | 0.27 (0.13, 0.40) | 0.14 (0.07, 0.32) | 0.04 (0.00, 0.22) | 0.065 | <0.001 | <0.001 |
| Cholic acid | 0.04 (0.01, 0.12) | 0.20 (0.17, 0.28) | 0.00 (0.00, 0.00) | <0.001 | <0.001 | <0.001 |
| Deoxycholic acid | 0.27 (0.13, 0.40) | 0.26 (0.15, 0.43) | 0.13 (0.00, 0.28) | 0.743 | 0.009 | <0.001 |
| Glycocholic acid | 0.20 (0.09, 0.35) | 0.08 (0.05, 0.16) | 0.14 (0.05, 0.25) | <0.001 | 0.037 | 0.299 |
| Glycochenodeoxycholic acid | 0.42 (0.25, 1.26) | 0.40 (0.23, 0.69) | 0.75 (0.29, 1.19) | 0.401 | 0.679 | 0.034 |
| Glycodeoxycholic acid | 0.30 (0.24, 1.11) | 0.18 (0.10, 0.41) | 0.08 (0.00, 0.23) | 0.003 | <0.001 | 0.003 |
| Glycolithocholic acid | 0.014 (0.009, 0.037) | 0.007 (0.001, 0.021) | 0.001 (0.001, 0.001) | 0.008 | <0.001 | <0.001 |
| Glycoursodeoxycholic acid | 0.07 (0.03, 0.19) | 0.05 (0.03, 0.12) | 0.00 (0.00, 0.15) | 0.690 | 0.022 | 0.033 |
| Lithocholic acid | 0.006 (0.001, 0.019) | 0.001 (0.001, 0.001) | 0.001 (0.001, 0.001) | <0.001 | <0.001 | <0.001 |
| Taurocholic acid | 0.02 (0.01, 0.11) | 0.06 (0.04, 0.07) | 0.00 (0.00, 0.00) | 0.185 | <0.001 | <0.001 |
| Taurochenodeoxycholic acid | 0.08 (0.03, 0.29) | 0.05 (0.03, 0.07) | 0.03 (0.00, 0.10) | 0.060 | 0.027 | 0.346 |
| Taurodeoxycholic acid | 0.02 (0.01, 0.05) | 0.04 (0.03, 0.07) | 0.00 (0.00, 0.03) | 0.080 | <0.001 | <0.001 |
| Taurolithocholic acid | 0.0010 (0.0010, 0.0023) | 0.0010 (0.0010, 0.0010) | 0.0010 (0.0010, 0.0010) | <0.001 | <0.001 | >0.999 |
| Tauroursodeoxycholic acid | 0.001 (0.001, 0.009) | 0.001 (0.001, 0.001) | 0.001 (0.001, 0.001) | <0.001 | <0.001 | 0.123 |
| Ursodeoxycholic acid | 0.07 (0.02, 0.31) | 0.16 (0.12, 0.19) | 0.00 (0.00, 0.00) | 0.274 | <0.001 | <0.001 |
| Total free/total BA | 0.13 (0.07, 0.20) | 0.20 (0.14, 0.30) | 0.04 (0.00, 0.10) | 0.009 | <0.001 | <0.001 |
| Total primary/total BA | 0.52 (0.47, 0.59) | 0.57 (0.50, 0.63) | 0.68 (0.53, 0.85) | 0.210 | 0.003 | 0.003 |
| GCA/total BA | 0.09 (0.06, 0.11) | 0.04 (0.03, 0.08) | 0.07 (0.04, 0.13) | <0.001 | 0.392 | 0.048 |
| Free CA/free CDCA | 0.18 (0.08, 0.47) | 1.68 (0.88, 3.22) | 0.17 (0.01, 1.00) | <0.001 | 0.643 | <0.001 |
| Total CA/total CDCA | 0.33 (0.24, 0.40) | 0.64 (0.43, 0.86) | 0.14 (0.08, 0.28) | <0.001 | <0.001 | <0.001 |
| TCA/TCDCA | 0.30 (0.20, 0.40) | 1.08 (0.56, 1.58) | 0.31 (0.03, 1.00) | <0.001 | 0.855 | <0.001 |
| GCA/GCDCA | 0.37 (0.30, 0.60) | 0.24 (0.16, 0.32) | 0.16 (0.10, 0.27) | <0.001 | <0.001 | 0.009 |
| Significant Different BA Profiles in NAFLD vs. Controls | ||
|---|---|---|
| Total Bile Acids | Individual Bile Acids | |
| Female NAFLD | ↑ total BA * ↑ total primary BA ** ↑ total CA ** ↑ total CDCA * ↑ total glycine-conjugated BA * ↑ total non-12-a-OH BA * | ↑ Glycocholic acid *** ↑ Glycochenodeoxycholic acid * |
| Male NAFLD | ↓ Cholic acid *** ↑ Glycocholic acid *** ↑ Glycodeoxycholic acid ** ↑ Glycolithocholic acid * ↑ Lithocholic acid *** ↑ Taurolithocholic acid *** ↑ Tauroursodeoxycholic acid *** | |
| NAFLD, N = 41 | ALD, N = 54 | |||||
|---|---|---|---|---|---|---|
| Characteristic | Low/Moderate, N = 27 1 | High, N = 14 1 | p-Value 2 | Low/Moderate, N = 38 1 | High, N = 16 1 | p-Value 2 |
| Gender | 0.142 | 0.474 | ||||
| female | 9 (33.3%) | 8 (57.1%) | 9 (23.7%) | 2 (12.5%) | ||
| male | 18 (66.7%) | 6 (42.9%) | 29 (76.3%) | 14 (87.5%) | ||
| Age | 45 (14) | 60 (8) | <0.001 | 48 (9) | 48 (10) | 0.948 |
| C-reactive protein (mg/dL) | 1.5 (0.8, 4.1) | 2.2 (0.6, 6.4) | 0.674 | 2 (1, 4) | 4 (3, 15) | 0.010 |
| ALT (U/L) | 81 (50, 126) | 77 (59, 150) | 0.891 | 28 (22, 42) | 37 (28, 62) | 0.229 |
| total BA | 2.1 (1.5, 3.0) | 7.2 (2.9, 9.5) | 0.004 | 1.1 (0.6, 1.7) | 3.3 (1.6, 6.9) | <0.001 |
| Total Primary | 1.18 (0.66, 1.78) | 3.70 (1.61, 5.66) | 0.001 | 0.6 (0.2, 1.4) | 2.3 (1.4, 6.6) | <0.001 |
| Total free Primary | 0.36 (0.19, 0.57) | 0.26 (0.12, 0.56) | 0.357 | 0.04 (0.00, 0.14) | 0.08 (0.00, 0.49) | 0.312 |
| Total Secondary | 0.87 (0.70, 1.26) | 3.53 (0.54, 4.41) | 0.026 | 0.40 (0.18, 0.65) | 0.52 (0.30, 1.22) | 0.169 |
| Total free Secondary | 0.44 (0.25, 0.57) | 0.47 (0.32, 0.61) | 0.525 | 0.23 (0.07, 0.32) | 0.12 (0.03, 0.20) | 0.223 |
| Total CA | 0.24 (0.16, 0.54) | 0.81 (0.25, 1.56) | 0.025 | 0.08 (0.01, 0.18) | 0.53 (0.17, 1.70) | <0.001 |
| Total CDCA | 0.68 (0.50, 1.15) | 2.99 (1.37, 4.10) | <0.001 | 0.48 (0.22, 1.13) | 1.97 (1.10, 4.88) | <0.001 |
| Total UDC | 0.15 (0.06, 0.34) | 0.24 (0.10, 0.74) | 0.283 | 0.00 (0.00, 0.10) | 0.10 (0.00, 0.50) | 0.029 |
| Total taurine conjugated | 0.09 (0.05, 0.17) | 0.44 (0.20, 1.32) | 0.001 | 0.01 (0.01, 0.07) | 0.30 (0.06, 1.86) | <0.001 |
| Total glycine conjugated | 0.85 (0.66, 1.81) | 5.40 (2.11, 7.30) | <0.001 | 0.66 (0.31, 1.36) | 1.97 (1.04, 5.02) | <0.001 |
| Total 12-a-OH | 0.97 (0.60, 1.60) | 3.51 (0.92, 5.08) | 0.013 | 0.41 (0.21, 0.60) | 0.79 (0.43, 2.61) | 0.008 |
| Total non-12-a-OH | 1.07 (0.78, 1.53) | 3.78 (1.69, 4.61) | 0.002 | 0.50 (0.28, 1.20) | 2.11 (1.18, 5.19) | <0.001 |
| total free/Total | 0.18 (0.10, 0.32) | 0.07 (0.01, 0.08) | <0.001 | 0.04 (0.00, 0.12) | 0.02 (0.00, 0.06) | 0.289 |
| total primary/total BA | 0.52 (0.44, 0.59) | 0.57 (0.48, 0.60) | 0.402 | 0.63 (0.47, 0.80) | 0.76 (0.68, 0.93) | 0.019 |
| Total secondary/Total | 0.48 (0.41, 0.56) | 0.43 (0.40, 0.53) | 0.355 | 0.39 (0.21, 0.58) | 0.27 (0.07, 0.35) | 0.011 |
| GCA/Total | 0.08 (0.05, 0.10) | 0.11 (0.09, 0.12) | 0.033 | 0.06 (0.01, 0.09) | 0.12 (0.07, 0.13) | 0.003 |
| Free CA/Free CDCA | 0.2 (0.1, 0.6) | 0.3 (0.0, 0.8) | 0.670 | 0.59 (0.01, 1.00) | 0.06 (0.01, 1.00) | 0.404 |
| Total CA/Total CDCA | 0.34 (0.28, 0.51) | 0.32 (0.22, 0.39) | 0.501 | 0.11 (0.04, 0.20) | 0.27 (0.14, 0.40) | 0.009 |
| T-CA/T-CDCA | 0.28 (0.18, 0.39) | 0.28 (0.22, 0.37) | 0.837 | 1.00 (0.05, 1.00) | 0.27 (0.03, 0.43) | 0.012 |
| G-CA/G-CDCA | 0.37 (0.27, 0.64) | 0.35 (0.22, 0.37) | 0.182 | 0.12 (0.01, 0.21) | 0.26 (0.17, 0.35) | 0.003 |
| Characteristic | NAFLD without NASH, N = 24 1 | NAFLD with NASH, N = 20 1 | p-Value 2 |
|---|---|---|---|
| Gender | 0.429 | ||
| female | 8 (33.3%) | 9 (45.0%) | |
| male | 16 (66.7%) | 11 (55.0%) | |
| Age | 48 (15) | 56 (11) | 0.050 |
| C-reactive protein (mg/dL) | 1.7 (0.8, 3.7) | 2.2 (1.1, 6.2) | 0.425 |
| ALT (U/L) | 72 (51, 91) | 97 (57, 155) | 0.207 |
| ELF score cut | 0.026 | ||
| low/moderate | 17 (81.0%) | 9 (47.4%) | |
| high | 4 (19.0%) | 10 (52.6%) | |
| total BA | 3.0 (1.4, 5.1) | 2.9 (1.9, 6.4) | 0.768 |
| Total primary | 1.41 (0.65, 2.69) | 1.78 (1.10, 3.45) | 0.444 |
| Total free primary | 0.27 (0.12, 0.52) | 0.45 (0.24, 0.65) | 0.225 |
| Total secondary | 1.13 (0.70, 2.44) | 1.21 (0.61, 2.45) | 0.760 |
| Total free secondary | 0.46 (0.21, 0.66) | 0.44 (0.33, 0.50) | 0.854 |
| Total CA | 0.29 (0.14, 1.06) | 0.48 (0.22, 0.63) | 0.768 |
| Total CDCA | 0.83 (0.47, 2.03) | 1.15 (0.64, 2.88) | 0.352 |
| Total UDC | 0.17 (0.07, 0.67) | 0.15 (0.07, 0.41) | 0.637 |
| Total taurine conjugated | 0.13 (0.05, 0.42) | 0.18 (0.09, 0.49) | 0.390 |
| Total glycine conjugated | 1.4 (0.7, 3.3) | 1.8 (0.8, 4.2) | 0.612 |
| Total 12-a-OH | 1.32 (0.61, 2.59) | 1.29 (0.81, 3.24) | 0.897 |
| Total non-12-a-OH | 1.42 (0.73, 2.59) | 1.31 (0.96, 2.91) | 0.687 |
| Total free/total | 0.14 (0.05, 0.22) | 0.12 (0.07, 0.18) | 0.823 |
| Total primary/total | 0.52 (0.46, 0.61) | 0.57 (0.52, 0.60) | 0.430 |
| GCA/total | 0.09 (0.05, 0.12) | 0.09 (0.08, 0.11) | 0.805 |
| Free CA/free CDCA | 0.3 (0.1, 1.2) | 0.2 (0.1, 0.5) | 0.207 |
| Total CA/total CDCA | 0.35 (0.24, 0.52) | 0.32 (0.24, 0.42) | 0.663 |
| TCA/TCDCA | 0.30 (0.20, 0.40) | 0.30 (0.24, 0.43) | 0.733 |
| GCA/GCDCA | 0.39 (0.31, 0.66) | 0.34 (0.21, 0.55) | 0.234 |
Disclaimer/Publisher’s Note: The statements, opinions and data contained in all publications are solely those of the individual author(s) and contributor(s) and not of MDPI and/or the editor(s). MDPI and/or the editor(s) disclaim responsibility for any injury to people or property resulting from any ideas, methods, instructions or products referred to in the content. |
© 2024 by the authors. Licensee MDPI, Basel, Switzerland. This article is an open access article distributed under the terms and conditions of the Creative Commons Attribution (CC BY) license (https://creativecommons.org/licenses/by/4.0/).
Share and Cite
Fitzinger, J.; Rodriguez-Blanco, G.; Herrmann, M.; Borenich, A.; Stauber, R.; Aigner, E.; Mangge, H. Gender-Specific Bile Acid Profiles in Non-Alcoholic Fatty Liver Disease. Nutrients 2024, 16, 250. https://doi.org/10.3390/nu16020250
Fitzinger J, Rodriguez-Blanco G, Herrmann M, Borenich A, Stauber R, Aigner E, Mangge H. Gender-Specific Bile Acid Profiles in Non-Alcoholic Fatty Liver Disease. Nutrients. 2024; 16(2):250. https://doi.org/10.3390/nu16020250
Chicago/Turabian StyleFitzinger, Julia, Giovanny Rodriguez-Blanco, Markus Herrmann, Andrea Borenich, Rudolf Stauber, Elmar Aigner, and Harald Mangge. 2024. "Gender-Specific Bile Acid Profiles in Non-Alcoholic Fatty Liver Disease" Nutrients 16, no. 2: 250. https://doi.org/10.3390/nu16020250
APA StyleFitzinger, J., Rodriguez-Blanco, G., Herrmann, M., Borenich, A., Stauber, R., Aigner, E., & Mangge, H. (2024). Gender-Specific Bile Acid Profiles in Non-Alcoholic Fatty Liver Disease. Nutrients, 16(2), 250. https://doi.org/10.3390/nu16020250