
Fermented Gold Kiwi for Improved Gastric Health: Evaluation of Efficacy and Safety in a Randomised, Double-Blind, Placebo-Controlled Trial

 , ,
, ,
Abstract
1. Introduction
2. Materials and Methods
2.1. Study Design and Participants
2.2. Intervention
2.3. Randomisation and Blinding
2.4. Endpoints
2.5. Safety
2.6. Sample Size Calculation
2.7. Statistical Analyses
3. Results
3.1. Participant Characteristics
3.2. Study Endpoints
3.3. Safety
3.4. Physical Activity and Diet
4. Discussion
5. Conclusions
Supplementary Materials
Author Contributions
Funding
Institutional Review Board Statement
Informed Consent Statement
Data Availability Statement
Conflicts of Interest
References
- Health Insurance Review & Assessment Service. Statistics on Frequent Diseases in 2021; Health Insurance Review & Assessment Service Open Data System. Available online: https://opendata.hira.or.kr (accessed on 4 April 2024).
- Kim, S.E.; Kim, N.; Lee, J.Y.; Park, K.S.; Shin, J.E.; Nam, K.; Kim, H.J.; Song, H.J.; Joo, Y.E.; Myung, D.S.; et al. Prevalence and Risk Factors of Functional Dyspepsia in Health Check-up Population: A Nationwide Multicenter Prospective Study. J. Neurogastroenterol. Motil. 2018, 24, 603–613. [Google Scholar] [CrossRef] [PubMed]
- Joo, Y.E.; Park, H.K.; Myung, D.S.; Baik, G.H.; Shin, J.E.; Seo, G.S., II; Kim, G.H.; Kim, H.U.; Kim, H.Y.; Cho, S.I.; et al. Prevalence and Risk Factors of Atrophic Gastritis and Intestinal Metaplasia: A Nationwide Multicenter Prospective Study in Korea. Gut Liver 2013, 7, 303–310. [Google Scholar] [CrossRef] [PubMed]
- Mishra, S.R.; Neupane, D.; Bhandari, P.M.; Gyawali, B.; Thapa, P.; Siwakoti, S. Global, Regional, and National Burden of 10 Digestive Diseases in 204 Countries and Territories from 1990 to 2019. Front. Public Health 2023, 11, 1061453. [Google Scholar] [CrossRef]
- Oh, J.H.; Kwon, J.G.; Jung, H.K.; Tae, C.H.; Song, K.H.; Kang, S.J.; Kim, S.E.; Jung, K.; Kim, J.S.; Park, J.K.; et al. Clinical Practice Guidelines for the Treatment of Functional Dyspepsia in Korea. Korean J. Med. 2021, 96, 116–138. [Google Scholar] [CrossRef]
- Kang, S.J.; Kim, J.G.; Moon, H.S.; Kook, M.C.; Lee, J.Y.; Bang, C.S.; Tae, C.H.; Gong, E.J.; Nam, S.Y.; Korean College of Helicobacter and Upper Gastrointestinal Research; et al. Clinical Practice Guideline for Gastritis in Korea. J. Korean Med. Sci. 2023, 38, e115. [Google Scholar] [CrossRef] [PubMed]
- Kim, B.J. Natural Course of Atrophic Gastritis and Intestinal Metaplasia. Korean J. Helicobacter Up. Gastrointest. Res. 2020, 20, 101–106. [Google Scholar] [CrossRef]
- Ryu, J.Y.; Park, H.J.; Moon, J.Y.; Kim, C.S.; Somi, K. Lactic Fermentation Enhances the Antioxidant Activity of Gold Kiwifruit. Korean J. Food Preserv. 2018, 25, 255–262. [Google Scholar] [CrossRef]
- Jeon, E.J.; Choi, J.H.; Lee, N.Y.; Oh, H.J.; Kwon, H.S.; Kwon, J. Gastroprotective Effects of Fermented Gold Kiwi (Actinidia chinenesis L.) Extracts on HCl/EtOH-Induced Gastric Injury in Rats. Appl. Sci. 2022, 12, 5271. [Google Scholar] [CrossRef]
- Revicki, D.A.; Wood, M.; Wiklund, I.; Crawley, J. Reliability and Validity of the Gastrointestinal Symptom Rating Scale in Patients with Gastroesophageal Reflux Disease. Qual. Life Res. 1998, 7, 75–83. [Google Scholar] [CrossRef]
- Mizukami, K.; Murakami, K.; Hirashita, Y.; Hisamatsu, A.; Ogawa, R.; Uchida, M.; Nakagawa, Y.; Okimoto, T.; Kodama, M.; Fujioka, T. Efficacy of Rebamipide for Low-Dose Aspirin-Related Gastrointestinal Symptoms. J. Clin. Biochem. Nutr. 2012, 51, 216–220. [Google Scholar] [CrossRef]
- Kulich, K.R.; Madisch, A.; Pacini, F.; Piqué, J.M.; Regula, J.; Van Rensburg, C.J.; Újszászy, L.; Carlsson, J.; Halling, K.; Wiklund, I.K. Reliability and Validity of the Gastrointestinal Symptom Rating Scale (GSRS) and Quality of Life in Reflux and Dyspepsia (QOLRAD) Questionnaire in Dyspepsia: A Six-Country Study. Health Qual. Life Outcomes 2008, 6, 12. [Google Scholar] [CrossRef] [PubMed]
- Kim, E.S. Effects of Internal Organ Massage on EEG, HRV and Psychology in Women with Irritable Bowel Syndrome. Ph.D. Thesis, Daejeon University, Daejeon, Republic of Korea, 2017. [Google Scholar]
- Okdahl, T.; Bertoli, D.; Brock, B.; Krogh, K.; Krag Knop, F.; Brock, C.; Drewes, A.M. Study Protocol for a Multicentre, Randomised, Parallel Group, Sham-Controlled Clinical Trial Investigating the Effect of Transcutaneous Vagal Nerve Stimulation on Gastrointestinal Symptoms in People with Diabetes Complicated with Diabetic Autonomic Neuropathy: The DAN-VNS Study. BMJ Open 2021, 11, e038677. [Google Scholar] [CrossRef]
- Haque, M.; Talley, N.J.; Wyeth, J.W.; Stace, N.H.; Tytgat, G.N.; Stanghellini, V.; Holtmann, G.; Verlinden, M.; Jones, M.P. Patient-Reported Outcome Measures in Functional Dyspepsia: A Systematic Review and COSMIN Analysis. BMC Gastroenterol. 2023, 23, 45. [Google Scholar] [CrossRef]
- Cho, Y.K.; Choi, M.G.; Kim, S.H.; Lee, I.S.; Kim, S.W.; Chung, I.S.; Lee, S.Y.; Choi, S.C.; Seol, S.Y. The effect of mosapride on quality of life in functional dyspepsia. Korean J. Gastroenterol. 2004, 43, 160–167. [Google Scholar]
- Lee, J.W.; Youn, Y.H.; Choi, S.C.; Lee, K.J.; Kim, N. Multicenter, Randomized, Placebo-Controlled Trial to Evaluate the Efficacy and Safety of a Controlled-Release, Once-Daily UIC201609/UIC201610 Combination Therapy for Functional Dyspepsia: Preliminary Study. Korean J. Gastroenterol. 2021, 77, 171–178. [Google Scholar] [CrossRef]
- Kim, J.W.; Park, S.Y.; Chung, J.O.; Cho, H.A.; Kim, D.H.; Yoon, J.H.; Park, C.H.; Kim, H.S.; Choi, S.K.; Rew, J.S. Influencing Factors on Lactulose Breath Test Results. Korean J. Gastroenterol. 2020, 75, 23. [Google Scholar] [CrossRef]
- Bajgai, J.; Lee, M.; Jang, Y.-G.; Lee, K.; Sharma, S.; Jeong, Y.J.; Park, H.J.; Goh, S.H.; Kim, C.-S.; Kim, H.I.; et al. Effects of Drinking Electrolyzed Alkaline-Reduced Water on Functional Dyspepsia: A Randomized, Double-Blind, Controlled Prospective Trial. Processes 2023, 11, 968. [Google Scholar] [CrossRef]
- Nam, S.U.; Park, J.W.; Kim, J.S. Correlation Analysis between Stomach Qi Deficiency Pattern and Gastric Emptying Measured by Abdominal Ultrasonography in Patients with Functional Dyspepsia. J. Intern. Korean Med. 2018, 39, 405–425. [Google Scholar] [CrossRef]
- Lee, E.H.; Hahm, K.B.; Lee, J.H.; Park, J.J.; Lee, D.H.; Kim, S.K.; Choi, S.R.; Lee, S.T. Development and Validation of a Functional Dyspepsia-Related Quality of Life (FD-QOL) Scale in South Korea. J. Gastroenterol. Hepatol. 2006, 21, 268–274. [Google Scholar] [CrossRef]
- Raish, M.; Ahmad, A.; Ansari, M.A.; Alkharfy, K.M.; Aljenoobi, F.I.; Jan, B.L.; Al-Mohizea, A.M.; Khan, A.; Ali, N. Momordica Charantia Polysaccharides Ameliorate Oxidative Stress, Inflammation, and Apoptosis in Ethanol-Induced Gastritis in Mucosa through NF-kB Signaling Pathway Inhibition. Int. J. Biol. Macromol. 2018, 111, 193–199. [Google Scholar] [CrossRef]
- Lauritano, C.; Montuori, E.; De Falco, G.; Carrella, S. In Silico Methodologies to Improve Antioxidants’ Characterization from Marine Organisms. Antioxidants 2023, 12, 710. [Google Scholar] [CrossRef] [PubMed]
- Suzuki, H.; Nishizawa, T.; Tsugawa, H.; Mogami, S.; Hibi, T. Roles of Oxidative Stress in Stomach Disorders. J. Clin. Biochem. Nutr. 2011, 50, 35–39. [Google Scholar] [CrossRef] [PubMed]
- Pérez, S.; Taléns-Visconti, R.; Rius-Pérez, S.; Finamor, I.; Sastre, J. Redox Signaling in the Gastrointestinal Tract. Free Radic. Biol. Med. 2017, 104, 75–103. [Google Scholar] [CrossRef] [PubMed]
- Đorđević, S.; Petrović, S.; Dobrić, S.; Milenković, M.; Vučićević, D.; Žižić, S.; Kukić, J. Antimicrobial, Anti-Inflammatory, Anti-Ulcer and Antioxidant Activities of Carlina Acanthifolia Root Essential Oil. J. Ethnopharmacol. 2007, 109, 458–463. [Google Scholar] [CrossRef] [PubMed]
- Jayakumari, S.; Anbu, J.; Ravichandiran, V.; Anjana, A.; Siva Kumar, G.M.; Singh, M. Antiulcerogenic and Free Radical Scavenging Activity of Flavonoid Fraction of Psidium Guajava Linn Leaves. Int. J. Pharm. Pharm. Sci 2012, 4, 170–174. [Google Scholar]
- Shehata, M.M.S.M.; Soltan, S.S.A. Effects of Bioactive Component of Kiwi Fruit and Avocado (Fruit and Seed) on Hypercholesterolemic Rats. World J. Dairy Food Sci 2013, 8, 82–93. [Google Scholar] [CrossRef]
- Park, Y.S.; Im, M.H.; Ham, K.S.; Kang, S.G.; Park, Y.K.; Namiesnik, J.; Leontowicz, H.; Leontowicz, M.; Trakhtenberg, S.; Gorinstein, S. Quantitative Assessment of the Main Antioxidant Compounds, Antioxidant Activities and FTIR Spectra from Commonly Consumed Fruits, Compared to Standard Kiwi Fruit. Lebenson. Wiss. Technol. 2015, 63, 346–352. [Google Scholar] [CrossRef]
- Yang, Y.; Yin, B.; Lv, L.; Wang, Z.; He, J.; Chen, Z.; Wen, X.; Zhang, Y.; Sun, W.; Li, Y.; et al. Gastroprotective Effect of Aucubin against Ethanol-Induced Gastric Mucosal Injury in Mice. Life Sci. 2017, 189, 44–51. [Google Scholar] [CrossRef]
- Tarnawski, A.; Ahluwalia, A.; Jones, M.K. Gastric Cytoprotection beyond Prostaglandins: Cellular and Molecular Mechanisms of Gastroprotective and Ulcer Healing Actions of Antacids. Curr. Pharm. Des. 2023, 19, 126–132. [Google Scholar] [CrossRef]
- AlRashdi, A.S.; Salama, S.M.; Alkiyumi, S.S.; Abdulla, M.A.; Hadi, A.H.A.; Abdelwahab, S.I.; Taha, M.M.; Hussiani, J.; Asykin, N. Mechanisms of Gastroprotective Effects of Ethanolic Leaf Extract of Jasminum sambac against HCl/Ethanol-Induced Gastric Mucosal Injury in Rats. Evid. -Based Complement. Altern. Med. 2012, 2012, 786426. [Google Scholar] [CrossRef]
- Jeon, W.Y.; Lee, M.Y.; Shin, I.S.; Jin, S.E.; Ha, H. Curcuma aromatica Water Extract Attenuates Ethanol-Induced Gastritis via Enhancement of Antioxidant Status. Evid. Based Complement. Alternat. Med. 2015, 2015, 82496. [Google Scholar] [CrossRef] [PubMed]
- Shin, J.; Habashy, N.; Sharba, M. Pharmacological Targeting of Gastric Mucosal Barrier with Traditional Chinese Medications for Repairing Gastric Mucosal Injury. Front. Pharmacol. 2023, 12, 1234. [Google Scholar] [CrossRef]
- Enck, P.; Klosterhalfen, S. Placebo Responses and Placebo Effects in Functional Gastrointestinal Disorders. Front. Psychiatry 2020, 11, 797. [Google Scholar] [CrossRef] [PubMed]
- Hafliðadóttir, S.H.; Juhl, C.B.; Nielsen, S.M.; Henriksen, M.; Harris, I.A.; Bliddal, H.; Christensen, R. Placebo Response and Effect in Randomized Clinical Trials: Meta-Research with Focus on Contextual Effects. Trials 2021, 22, 493. [Google Scholar] [CrossRef] [PubMed]


| Inclusion |
| Adult males and females aged 19–70 years |
| Participants with at least one of the Rome IV classified dyspepsia symptoms * and not requiring urgent pharmacologic treatment (onset of symptoms more than 6 months prior to V1, and symptoms present in the past 3 months) * Dyspeptic symptoms classified as Rome IV - Unpleasant postprandial fullness (bothersome postprandial fullness) - Unpleasant early satiation (bothersome early satiation) - Unpleasant epigastric pain (bothersome epigastric pain) - Unpleasant epigastric burning (bothersome epigastric burning) |
| Participants with at least two of the eight major symptoms of the NDI-K (epigastric pain, epigastric discomfort, epigastric burning, early satiety, postprandial fullness, epigastric pressure, epigastric bloating, and nausea) scoring moderate (3) or higher on at least two of the eight items and a total score of 6 or higher |
| Participants who agree to participate in this study and have voluntarily signed a written informed consent form. |
| Exclusion |
| History of peptic ulcer and reflux oesophagitis within 6 months prior to V1, individuals with a history of gastrointestinal surgery (except appendectomy and haemorrhoidectomy), and patients with a history of digestive system malignancy. |
| Participants who had taken H2 receptor blockers, anticholinergics (muscarinic receptor antagonists), gastrin receptor antagonists, prostaglandin preparations, proton pump inhibitors, gastric mucosal protectants, other drugs intended to treat gastritis, or gastric health supplements within 2 weeks prior to V1. |
| Participants who required continuous use of medications that may cause gastritis during the study, such as corticosteroids, non-steroidal anti-inflammatory drugs, or aspirin, |
| Participants with severe cerebrovascular disease (such as cerebral infarction and cerebral haemorrhage), cardiac disease (angina pectoris, myocardial infarction, heart failure, arrhythmia requiring treatment), or malignancy within 6 months prior to V1; however, patients with a history of cerebrovascular disease or cardiac disease but who are clinically stable may be allowed to participate at the discretion of the investigator. |
| Participants with alcohol consumption habits averaging > 210 g/week for men and >140 g/week for women in the past 1 month based on the answers to a drinking habits questionnaire. |
| Participants with uncontrolled diabetes (fasting blood glucose ≥ 180 mg/dL). |
| Participants with uncontrolled hypertension (blood pressure ≥ 160/100 mmHg). |
| Participants with a creatinine concentration ≥ 2 times the upper limit of site normal at V1. |
| Participants with AST (GOT) or ALT (GPT) ≥ 3 times the upper limit of site normal at V1. |
| Participation in a human application study or clinical trial less than 3 months prior. |
| Participants who were pregnant, lactating, or planning to become pregnant during the study period. |
| Participants with an allergic reaction to any of the foods in the investigational product. |
| FGK (n = 48) | Placebo (n = 45) | ||
|---|---|---|---|
| Sex, n (%) | n | 48 | 45 |
| Male | 12 (25.00) | 7 (15.56) | |
| Female | 36 (75.00) | 38 (84.44) | |
| p-value 1 | 0.2589 (C) | ||
| Age (year) | Mean ± SD | 45.17 ± 10.53 | 40.67 ± 11.74 |
| Median | 47.00 | 43.00 | |
| (Min, Max) | (24.00, 68.00) | (20.00, 67.00) | |
| p-value 2 | 0.0545 (T) | ||
| Height (cm) | Mean ± SD | 162.95 ± 8.52 | 162.48 ± 8.38 |
| Median | 162.15 | 160.70 | |
| (Min, Max) | (147.00, 180.30) | (152.80, 186.50) | |
| p-value 2 | 0.4307 (W) | ||
| Weight (kg) | Mean ± SD | 64.36 ± 11.30 | 61.06 ± 13.63 |
| Median | 62.70 | 56.50 | |
| (Min, Max) | (42.90, 89.40) | (41.10, 112.00) | |
| p-value 2 | 0.0522 (W) | ||
| Body mass index (kg/m2) | Mean ± SD | 24.11 ± 2.97 | 23.02 ± 4.06 |
| Median | 23.65 | 21.60 | |
| (Min, Max) | (19.00, 33.90) | (17.00, 36.40) | |
| p-value 2 | 0.0136 (W) | ||
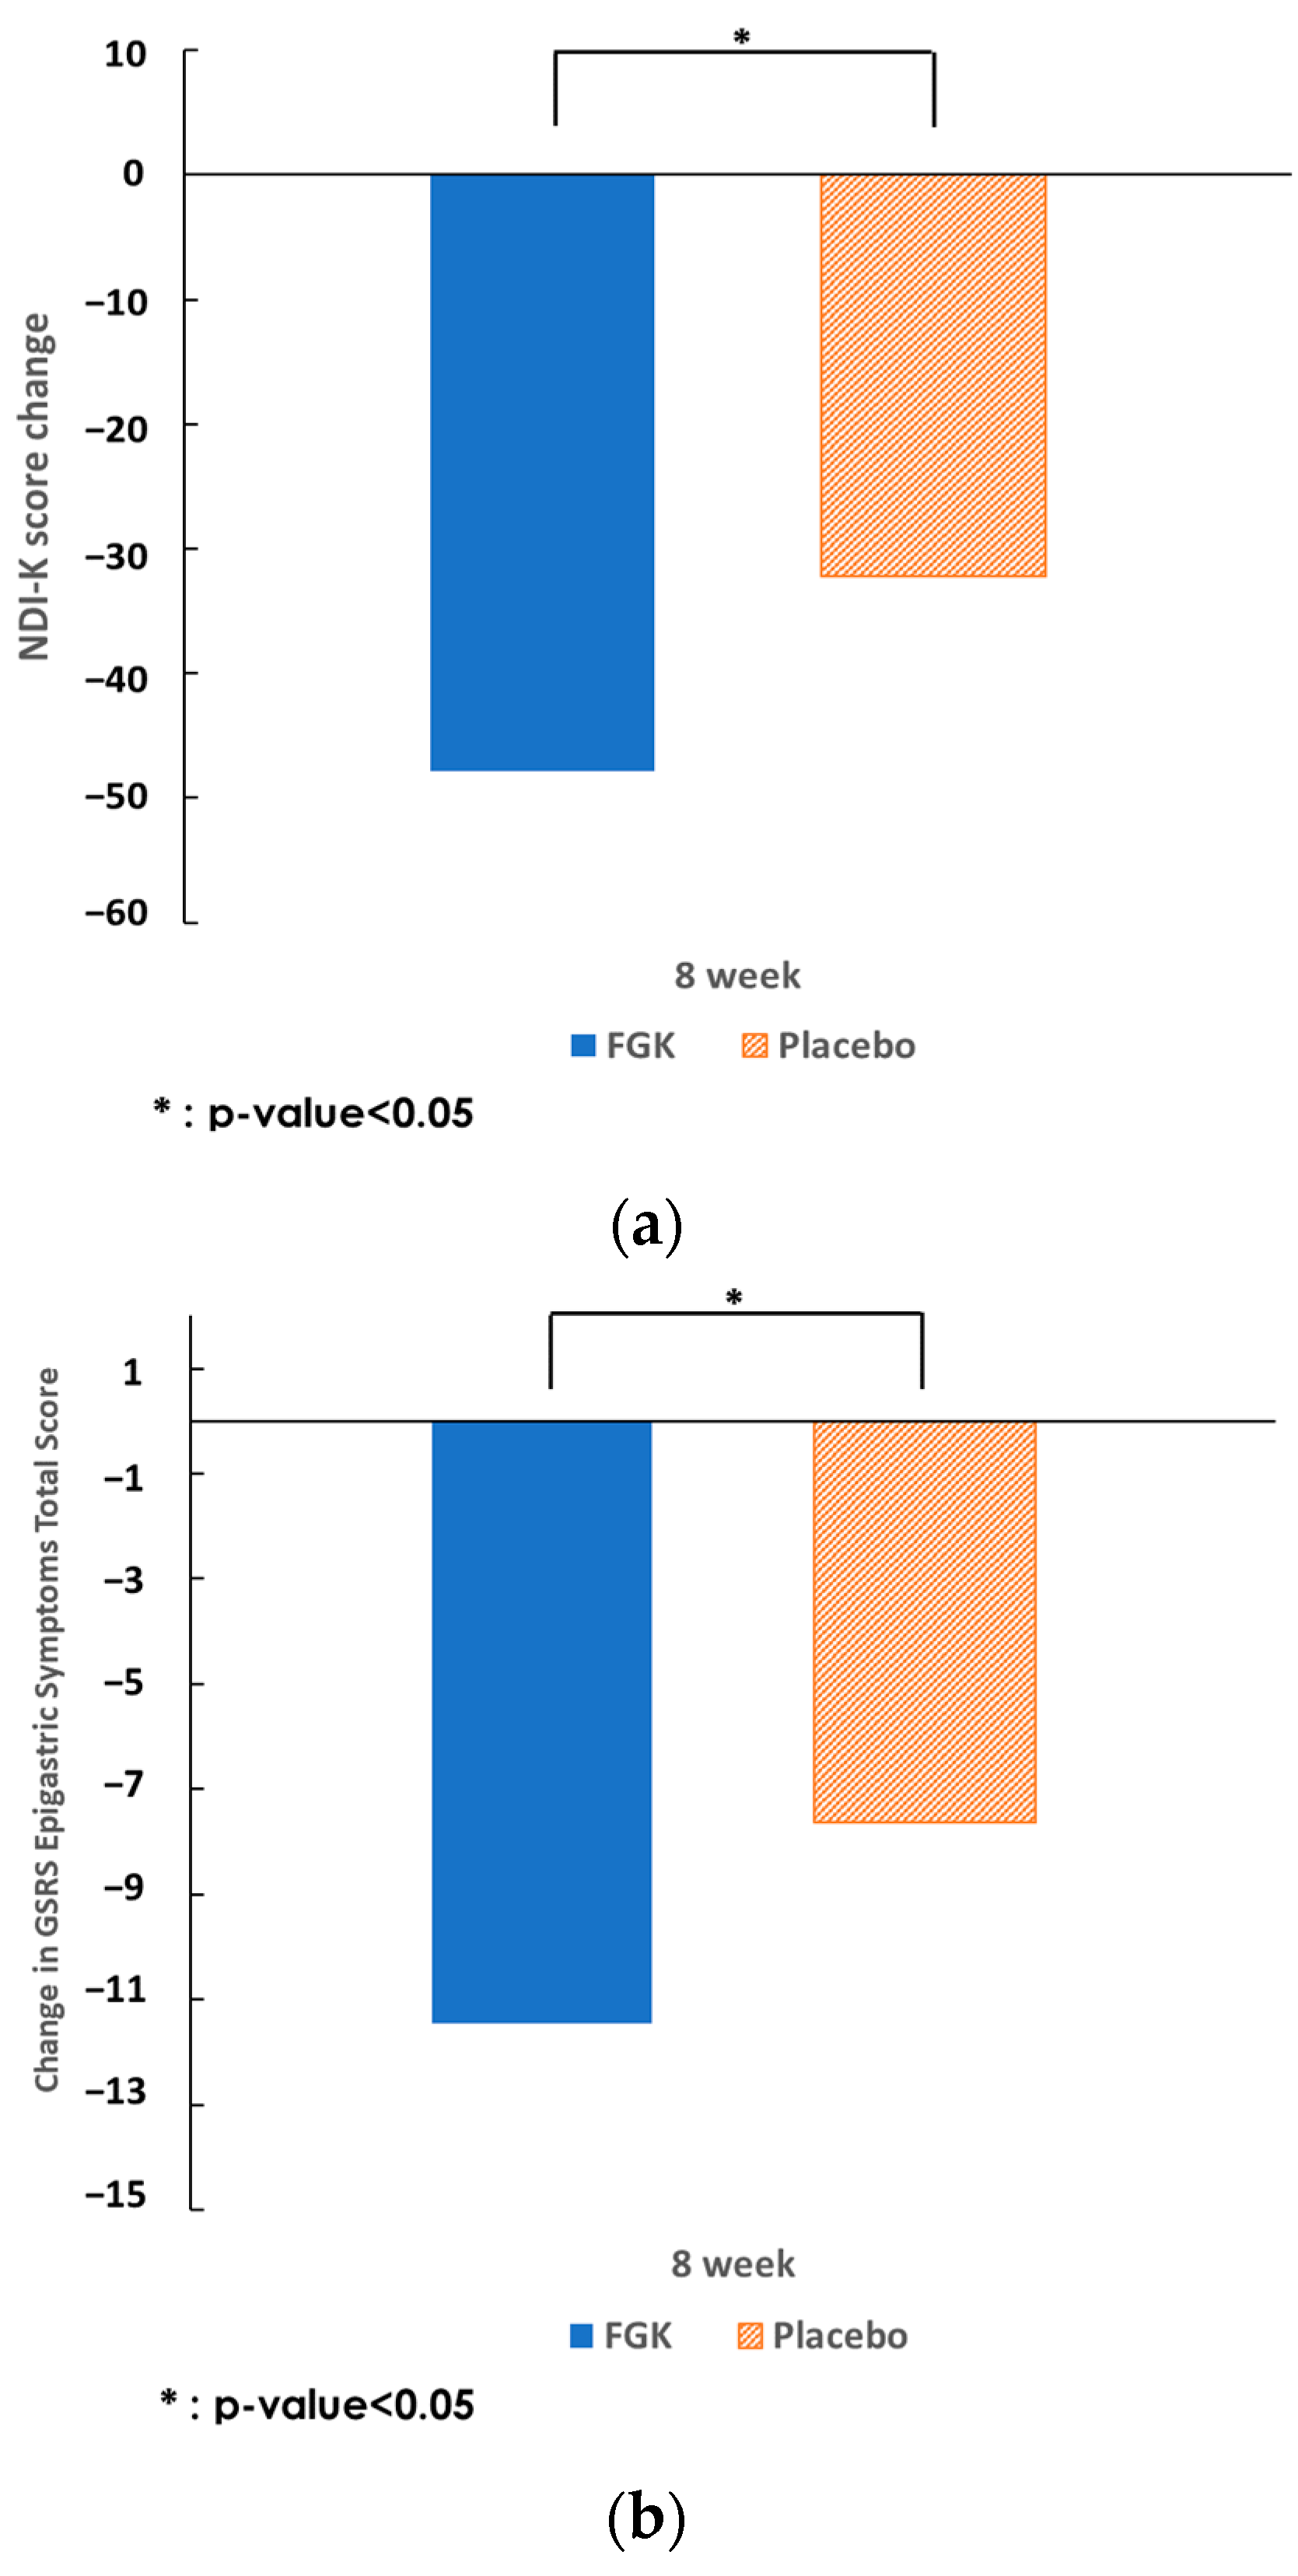
| Visit | GSRS Epigastric Symptoms Score | NDI-K Score | |||
|---|---|---|---|---|---|
| FGK (n = 48) | Placebo (n = 45) | FGK (n = 48) | Placebo (n = 45) | ||
| V1 | Mean ± SD | 25.10 ± 7.01 | 26.13 ± 7.13 | 72.92 ± 22.85 | 72.51 ± 24.67 |
| Median | 25.50 | 26.00 | 73.00 | 72.00 | |
| (Min, Max) | (11.00, 45.00) | (12.00, 43.00) | (34.00, 138.00) | (29.00, 139.00) | |
| p-value 1 | 0.4229 (W) | 0.9346 (T) | |||
| V5 | Mean ± SD | 13.65 ± 6.70 | 18.49 ± 9.66 | 25.06 ± 22.63 | 40.36 ± 34.17 |
| Median | 11.50 | 15.00 | 18.00 | 29.00 | |
| (Min, Max) | (8.00, 45.00) | (8.00, 49.00) | (0.00, 118.00) | (0.00, 146.00) | |
| p-value 1 | 0.0052 (W) | 0.0364 (W) | |||
| Change from V1 to V5 | Mean ± SD | −11.46 ± 7.89 | −7.64 ± 8.66 | −47.85 ± 29.77 | −32.16 ± 30.88 |
| Median | −11.50 | −7.00 | −47.50 | −34.00 | |
| (Min, Max) | (−32.00, 4.00) | (−28.00, 20.00) | (−118.00, 44.00) | (−89.00, 48.00) | |
| LS Mean ± SE § | −11.71 ± 1.09 | −7.38 ± 1.12 | −47.74 ± 3.92 | −32.28 ± 4.05 | |
| p-value 2 | <0.0001 (T) | <0.0001 (T) | <0.0001 (T) | <0.0001 (T) | |
| Treatment-induced difference in change from V1 to V5 (treatment–placebo) | Mean ± SD | −3.81 ± 8.27 | −15.70 ± 30.31 | ||
| (95% CI †) | (−7.22, −0.40) | (−28.19, −3.21) | |||
| LS mean difference § | −4.33 | −15.46 | |||
| (95% CI ‡) | (−7.44, −1.22) | (−26.66, −4.27) | |||
| p-value 3 | 0.0069 (A) | 0.0073 (A) | |||
| p-value 4 | 0.0083 | 0.0061 | |||
Disclaimer/Publisher’s Note: The statements, opinions and data contained in all publications are solely those of the individual author(s) and contributor(s) and not of MDPI and/or the editor(s). MDPI and/or the editor(s) disclaim responsibility for any injury to people or property resulting from any ideas, methods, instructions or products referred to in the content. |
© 2024 by the authors. Licensee MDPI, Basel, Switzerland. This article is an open access article distributed under the terms and conditions of the Creative Commons Attribution (CC BY) license (https://creativecommons.org/licenses/by/4.0/).
Share and Cite
Shin, S.M.; Youn, S.J.; Choi, Y.; Kim, B.M.; Lee, N.Y.; Oh, H.J.; Kwon, H.S.; Ko, H. Fermented Gold Kiwi for Improved Gastric Health: Evaluation of Efficacy and Safety in a Randomised, Double-Blind, Placebo-Controlled Trial. Nutrients 2024, 16, 2670. https://doi.org/10.3390/nu16162670
Shin SM, Youn SJ, Choi Y, Kim BM, Lee NY, Oh HJ, Kwon HS, Ko H. Fermented Gold Kiwi for Improved Gastric Health: Evaluation of Efficacy and Safety in a Randomised, Double-Blind, Placebo-Controlled Trial. Nutrients. 2024; 16(16):2670. https://doi.org/10.3390/nu16162670
Chicago/Turabian StyleShin, Seon Mi, Sang Jun Youn, Yong Choi, Bong Min Kim, Na Young Lee, Hyun Jeong Oh, Hyuck Se Kwon, and Heung Ko. 2024. "Fermented Gold Kiwi for Improved Gastric Health: Evaluation of Efficacy and Safety in a Randomised, Double-Blind, Placebo-Controlled Trial" Nutrients 16, no. 16: 2670. https://doi.org/10.3390/nu16162670
APA StyleShin, S. M., Youn, S. J., Choi, Y., Kim, B. M., Lee, N. Y., Oh, H. J., Kwon, H. S., & Ko, H. (2024). Fermented Gold Kiwi for Improved Gastric Health: Evaluation of Efficacy and Safety in a Randomised, Double-Blind, Placebo-Controlled Trial. Nutrients, 16(16), 2670. https://doi.org/10.3390/nu16162670