Whole Coffee Cherry Extract Improves Working Memory and Response Inhibition: Acute and Longitudinal Results from a Remote, Randomized, Double-Blind, Placebo-Controlled Clinical Trial
Abstract
1. Introduction
2. Materials and Methods
2.1. Study Design
2.2. Participants
2.3. Tasks
2.3.1. N-Back
2.3.2. Go/No-Go
2.4. Data Analysis
3. Results
3.1. Acute Challenge Results
3.1.1. N-Back
3.1.2. Go/No-Go
3.2. Longitudinal (Long-Term) Challenge Results
3.2.1. N-Back
3.2.2. Go/No-Go
4. Discussion
5. Conclusions
Author Contributions
Funding
Institutional Review Board Statement
Informed Consent Statement
Data Availability Statement
Conflicts of Interest
References
- Valls-Pedret, C.; Lamuela-Raventos, R.M.; Medina-Remon, A.; Quintana, M.; Corella, D.; Pinto, X.; Martinez-Gonzalez, M.A.; Estruch, R.; Ros, E. Polyphenol-rich foods in the Mediterranean diet are associated with better cognitive function in elderly subjects at high cardiovascular risk. J. Alzheimers Dis. 2012, 29, 773–782. [Google Scholar] [CrossRef] [PubMed]
- Whyte, R.A.; Cheng, N.; Fromentin, E.; Williams, M.C. A Randomized, Double-Blinded, Placebo-Controlled Study to Compare the Safety and Efficacy of Low Dose Enhanced Wild Blueberry Powder and Wild Blueberry Extract (ThinkBlue™) in Maintenance of Episodic and Working Memory in Older Adults. Nutrients 2018, 10, 660. [Google Scholar] [CrossRef] [PubMed]
- Socci, V.; Tempesta, D.; Desideri, G.; De Gennaro, L.; Ferrara, M. Enhancing Human Cognition with Cocoa Flavonoids. Front. Nutr. 2017, 4, 264265. [Google Scholar] [CrossRef] [PubMed]
- Reyes-Izquierdo, T.; Nemzer, B.; Shu, C.; Huynh, L.; Argumedo, R.; Keller, R.; Pietrzkowski, Z. Modulatory effect of coffee fruit extract on plasma levels of brain-derived neurotrophic factor in healthy subjects. Br. J. Nutr. 2013, 110, 420–425. [Google Scholar] [CrossRef] [PubMed]
- Robinson, J.L.; Yanes, J.A.; Reid, M.A.; Murphy, J.E.; Busler, J.N.; Mumford, P.W.; Young, K.C.; Pietrzkowski, Z.J.; Hunter, J.M.; Beck, D.T. Neurophysiological effects of a polyphenol-rich whole coffee cherry extract in older adults with subjective cognitive impairment: A randomized, double-blind, placebo-controlled study. Antioxidants 2021, 10, 144. [Google Scholar] [CrossRef] [PubMed]
- Nemzer, B.; Abshiru, N.; Al-Taher, F. Identification of phytochemical compounds in Coffea arabica whole coffee cherries and their extracts by LC-MS/MS. J. Agric. Food Chem. 2021, 69, 3430–3438. [Google Scholar] [CrossRef] [PubMed]
- Nemzer, B.; Kalita, D.; Abshiru, N. Quantification of Major Bioactive Constituents, Antioxidant Activity, and Enzyme Inhibitory Effects of Whole Coffee Cherries (Coffea arabica) and Their Extracts. Molecules 2021, 26, 4306. [Google Scholar] [CrossRef]
- Reed, R.; Mitchell, E.; Saunders, C.; O’Connor, P. Acute Low and Moderate Doses of a Caffeine-Free Polyphenol-Rich Coffeeberry Extract Improve Feelings of Alertness and Fatigue Resulting from the Performance of Fatiguing Cognitive Tasks. J. Cogn. Enhanc. 2019, 3, 193–206. [Google Scholar] [CrossRef]
- Schuster, J.; Mitchell, E.S. More than just caffeine: Psychopharmacology of methylxanthine interactions with plant-derived phytochemicals. Progress. Neuro-Psychopharmacol. Biol. Psychiatry 2019, 89, 263–274. [Google Scholar] [CrossRef]
- Li, S.; Chen, Y.; Zhang, Y.; Lv, H.; Luo, L.; Wang, S.; Guan, X. Polyphenolic Extracts of Coffee Cherry Husks Alleviated Colitis-Induced Neural Inflammation via NF-κB Signaling Regulation and Gut Microbiota Modification. J. Agric. Food Chem. 2022, 70, 6467–6477. [Google Scholar] [CrossRef]
- Doma, K.M.; Lewis, E.D.; Barracato, J.M.; Brink, L.R.; Gratson, A.A.; Pandey, N.; Crowley, D.C.; Evans, M. A Randomized, Double-Blind, Placebo-Controlled, Parallel Study Investigating the Efficacy of a Whole Coffee Cherry Extract and Phosphatidylserine Formulation on Cognitive Performance of Healthy Adults with Self-Perceived Memory Problems. Neurol. Ther. 2023, 12, 777–794. [Google Scholar] [CrossRef] [PubMed]
- Robinson, J.L.; Hunter, J.M.; Reyes-Izquierdo, T.; Argumedo, R.; Brizuela-Bastien, J.; Keller, R.; Pietrzkowski, Z. Cognitive short- and long-term effects of coffee cherry extract in older adults with mild cognitive decline. Aging Neuropsychol. Cogn. 2019, 12, 918–934. [Google Scholar] [CrossRef] [PubMed]
- Heneghan, C.; Goldacre, B.; Mahtani, K.R. Why clinical trial outcomes fail to translate into benefits for patients. Trials 2017, 18, 122. [Google Scholar] [CrossRef] [PubMed]
- Blonde, L.; Khunti, K.; Harris, S.B.; Meizinger, C.; Skolnik, N.S. Interpretation and Impact of Real-World Clinical Data for the Practicing Clinician. Adv. Ther. 2018, 35, 1763–1774. [Google Scholar] [CrossRef]
- Chodankar, D. Introduction to real-world evidence studies. Perspect. Clin. Res. 2021, 12, 171–174. [Google Scholar] [CrossRef]
- Millisecond – Inquisit. Available online: https://www.millisecond.com/ (accessed on 31 May 2024).
- Mencarelli, L.; Neri, F.; Momi, D.; Menardi, A.; Rossi, S.; Rossi, A.; Santarnecchi, E. Stimuli, presentation modality, and load-specific brain activity patterns during n-back task. Hum. Brain Mapp. 2019, 40, 3810–3831. [Google Scholar] [CrossRef]
- Wang, H.; He, W.; Wu, J.; Zhang, J.; Jin, Z.; Li, L. A coordinate-based meta-analysis of the n-back working memory paradigm using activation likelihood estimation. Brain Cogn. 2019, 132, 1–12. [Google Scholar] [CrossRef]
- Jaeggi, S.M.; Studer-Luethi, B.; Buschkuehl, M.; Su, Y.; Jonides, J.; Perrig, W.J. The relationship between n-back performance and matrix reasoning—Implications for training and transfer. Intelligence 2010, 38, 625–635. [Google Scholar] [CrossRef]
- Robinson, J.L.; Zhou, X.; Bird, R.T.; Leavitt, M.J.; Nichols, S.J.; Blaine, S.K.; Deshpande, G. Neurofunctional Segmentation Shifts in the Hippocampus. Front. Human. Neurosci. 2021, 15, 632. [Google Scholar] [CrossRef]
- Tsukiura, T.; Sekiguchi, A.; Yomogida, Y.; Nakagawa, S.; Shigemune, Y.; Kambara, T.; Akitsuki, Y.; Taki, Y.; Kawashima, R. Effects of aging on hippocampal and anterior temporal activation during successful retrieval of memory for face-name associations. J. Cogn. Neurosci. 2010, 23, 200–213. [Google Scholar] [CrossRef]
- Laird, A.R.; McMillan, K.M.; Lancaster, J.L.; Kochunov, P.; Turkeltaub, P.E.; Pardo, J.V.; Fox, P.T. A comparison of label-based review and activation likelihood estimation in the Stroop task. Human. Brain Mapp. 2005, 25, 6–21. [Google Scholar] [CrossRef] [PubMed]
- Stroop, J.R. Studies of interference in serial verbal reactions. J. Exp. Psychol. 1935, 18, 643–662. [Google Scholar] [CrossRef]
- Robinson, J.L.; Erath, S.A.; Kana, R.K.; El-Sheikh, M. Neurophysiological differences in the adolescent brain following a single night of restricted sleep—A 7T fMRI study. Dev. Cogn. Neurosci. 2018, 31, 1–10. [Google Scholar] [CrossRef] [PubMed]
- Fan, J.; McCandliss, B.D.; Sommer, T.; Raz, A.; Posner, M.I. Testing the efficiency and independence of attentional networks. J. Cogn. Neurosci. 2002, 14, 340–347. [Google Scholar] [CrossRef] [PubMed]
- Ebaid, D.; Crewther, S.G.; MacCalman, K.; Brown, A.; Crewther, D.P. Cognitive Processing Speed across the Lifespan: Beyond the Influence of Motor Speed. Front. Aging Neurosci. 2017, 9, 62. [Google Scholar] [CrossRef] [PubMed]
- Liebel, S.A.-O.; Clark, U.S.; Xu, X.A.-O.; Riskin-Jones, H.H.; Hawkshead, B.E.; Schwarz, N.F.; Labbe, D.; Jerskey, B.A.; Sweet, L.H. An FMRI-compatible Symbol Search task. J. Int. Neuropsychol. Soc. 2015, 21, 231–238. [Google Scholar] [CrossRef] [PubMed]
- Armitages, S.G. An analysis of certain psychological rests used for the evaluation of brain injury. Psychol. Monogr. 1946, 60, 1. [Google Scholar]
- Reitan, R.M. Validity of the Trail Making Test as an Indicator of Organic Brain Damage. Percept. Mot. Ski. 1958, 8, 271–276. [Google Scholar] [CrossRef]
- Hansen, C.H.; Hansen, R.D. Finding the face in the crowd: An anger superiority effect. Journal of Personality and Social Psychology, 54, 917–924. Finding the face in the crowd: An anger superiority effect. J. Personal. Social. Psychol. 1988, 54, 917–924. [Google Scholar] [CrossRef]
- Metricwire. Available online: https://metricwire.com/ (accessed on 31 May 2024).
- Meule, A. Reporting and Interpreting Working Memory Performance in n-back Tasks. Front. Psychol. 2017, 8, 352. [Google Scholar] [CrossRef]
- Hur, J.; Iordan, A.D.; Dolcos, F.; Berenbaum, H. Emotional influences on perception and working memory. Cogn. Emot. 2017, 31, 1294–1302. [Google Scholar] [CrossRef] [PubMed]
- Reyes-Izquierdo, T.; Argumedo, R.; Shu, C.; Nemzer, B.; Pietrzkowski, Z. Stimulatory effect of whole coffee fruit concentrate powder on plasma levels of total and exosomal brain-derived neurotrophic factor in healthy subjects: An acute within-subject clinical study. Food Nutr. Sci. 2013, 4, 984–990. [Google Scholar] [CrossRef]
- Spector, T.D.; Gardner, C.D. Challenges and opportunities for better nutrition science—An essay by Tim Spector and Christopher Gardner. BMJ 2020, 369, m2470. [Google Scholar] [CrossRef] [PubMed]
- Ali, Z.; Zibert, J.R.; Thomsen, S.F. Virtual Clinical Trials: Perspectives in Dermatology. Dermatology 2020, 236, 375–382. [Google Scholar] [CrossRef] [PubMed]
- Dahne, J.; Tomko, R.L.; McClure, E.A.; Obeid, J.S.; Carpenter, M.J. Remote Methods for Conducting Tobacco-Focused Clinical Trials. Nicotine Tob. Res. 2020, 22, 2134–2140. [Google Scholar] [CrossRef]
- Alemayehu, D.; Hemmings, R.; Natarajan, K.; Roychoudhury, S. Perspectives on Virtual (Remote) Clinical Trials as the “New Normal” to Accelerate Drug Development. Clin. Pharmacol. Ther. 2022, 111, 373–381. [Google Scholar] [CrossRef]

| N-Back | Go/No-Go | |||||||
|---|---|---|---|---|---|---|---|---|
| Placebo (n = 68) | CCE (n = 74) | Statistic | p | Placebo (n = 97) | CCE (n = 99) | Statistic | p | |
| Ethnicity | ||||||||
| American Indian or Alaskan Native, Hispanic or Latino, Asian or Asian American | 2.94% | 2.70% | χ2 = 4.072 | 0.771 | 3.09% | 4.04% | χ2 = 7.381 | 0.598 |
| Asian or Asian American | 2.94% | 2.70% | 5.15% | 3.03% | ||||
| Black of African American | 4.41% | 6.76% | 2.06% | 4.04% | ||||
| Hawaiian or Pacific Islander, White | 0.00% | 1.35% | 0.00% | 2.02% | ||||
| Hispanic or Latino | 5.88% | 9.46% | 5.15% | 6.06% | ||||
| White | 82.35% | 75.68% | 81.44% | 79.80% | ||||
| Mixed race | 0.00% | 1.35% | 2.06% | 1.01% | ||||
| Preferred not to say | 1.47% | 0.00% | 1.03% | 0.00% | ||||
| Education | ||||||||
| High School Diploma | 4.41% | 2.70% | χ2 = 2.097 | 0.836 | 3.09% | 2.02% | χ2 = 2.783 | 0.947 |
| Post-secondary Non-Degree Award | 0.00% | 0.00% | 1.03% | 1.01% | ||||
| Associate’s Degree | 5.88% | 9.46% | 7.22% | 11.11% | ||||
| Some College, No Degree | 19.12% | 21.62% | 19.59% | 18.18% | ||||
| Bachelor’s Degree | 36.76% | 37.84% | 35.05% | 34.34% | ||||
| Master’s Degree | 23.53% | 22.97% | 22.68% | 24.24% | ||||
| Doctoral or Professional Degree | 10.29% | 5.41% | 9.28% | 6.06% | ||||
| Other | 0.00% | 0.00% | 0.00% | 1.01% | ||||
| No Response | 0.00% | 0.00% | 2.06% | 2.02% | ||||
| Employment | ||||||||
| Homemaker | 10.29% | 4.05% | χ2 = 8.806 | 0.551 | 9.28% | 3.03% | χ2 = 11.732 | 0.303 |
| Student | 0.00% | 1.35% | 0.00% | 1.01% | ||||
| Employed for Wages | 63.24% | 62.16% | 62.89% | 65.66% | ||||
| Military | 0.00% | 1.35% | 0.00% | 1.01% | ||||
| Other | 0.00% | 1.35% | 0.00% | 1.01% | ||||
| Out of Work—Looking | 5.88% | 4.05% | 4.12% | 3.03% | ||||
| Out of Work—Not Looking | 0.00% | 4.05% | 0.00% | 4.04% | ||||
| Retired | 10.29% | 9.46% | 8.25% | 9.09% | ||||
| Self-Employed | 7.35% | 6.76% | 10.31% | 8.08% | ||||
| Unable to Work | 2.94% | 4.05% | 3.09% | 1.01% | ||||
| No Response | 0.00% | 1.35% | 2.06% | 3.03% | ||||
| Marital Status | ||||||||
| Divorced | 11.76% | 16.22% | χ2 = 7.477 | 0.279 | 10.31% | 17.17% | χ2 = 7.459 | 0.281 |
| Married or Domestic Partnership | 72.06% | 56.76% | 68.04% | 56.57% | ||||
| Other | 1.47% | 0.00% | 1.03% | 0.00% | ||||
| Separated | 1.47% | 2.70% | 4.12% | 2.02% | ||||
| Single, Never Married | 11.76% | 14.86% | 13.40% | 16.16% | ||||
| Widowed | 1.47% | 8.11% | 1.03% | 5.05% | ||||
| No Response | 0.00% | 1.35% | 2.06% | 3.03% | ||||
| Household Size | ||||||||
| 1 Person | 16.18% | 25.68% | χ2 = 7.130 | 0.203 | 13.40% | 23.23% | χ2 = 9.394 | 0.153 |
| 2 People | 35.29% | 33.78% | 35.05% | 33.33% | ||||
| 3 People | 14.71% | 16.22% | 17.53% | 21.21% | ||||
| 4 People | 20.59% | 8.11% | 18.56% | 6.06% | ||||
| 5 People | 7.35% | 10.81% | 8.25% | 8.08% | ||||
| 6 or More People | 5.88% | 4.05% | 5.15% | 5.05% | ||||
| No Response | 0.00% | 1.35% | 2.06% | 3.03% | ||||
| Household Income | ||||||||
| Less than $25,000 | 4.41% | 8.11% | χ2 = 9.195 | 0.420 | 2.06% | 5.05% | χ2 = 10.928 | 0.281 |
| $25,000–$34,999 | 2.94% | 5.41% | 3.09% | 6.06% | ||||
| $35,000–$49,999 | 5.88% | 9.46% | 7.22% | 9.09% | ||||
| $50,000–$74,999 | 10.29% | 14.86% | 14.43% | 16.16% | ||||
| $75,000–$99,999 | 25.00% | 22.97% | 22.68% | 28.28% | ||||
| $100,000–$149,999 | 27.94% | 20.27% | 28.87% | 18.18% | ||||
| $150,000–$199,999 | 7.35% | 12.16% | 7.22% | 10.10% | ||||
| $200,000 or more | 10.29% | 2.70% | 9.28% | 2.02% | ||||
| I prefer not to say | 5.88% | 2.70% | 3.09% | 2.02% | ||||
| No Response | 0.00% | 1.35% | 2.06% | 3.03% | ||||
| Geographical Region | ||||||||
| Midwest—IA, IL, IN, KS, MI, MN, MO, ND, NE, OH, SD, WI | 23.53% | 25.68% | χ2 = 4.221 | 0.518 | 23.71% | 19.19% | χ2 = 0.904 | 0.970 |
| Northeast—CT, DC, DE, MA, MD, ME, NH, NJ, NY, PA, RI, VT | 16.18% | 10.81% | 12.37% | 13.13% | ||||
| Southeast—AL, AR, FL, GA, KY, LA, MS, NC, SC, TN, VA, WV | 27.94% | 33.78% | 34.02% | 36.36% | ||||
| Southwest—AZ, NM, OK, TX | 13.24% | 17.57% | 14.43% | 16.16% | ||||
| West—AK, CA, CO, HI, ID, MT, NV, OR, UT, WA, WY | 19.12% | 10.81% | 13.40% | 12.12% | ||||
| No Response | 0.00% | 1.35% | 2.06% | 3.03% | ||||
| Sex Assigned at Birth | ||||||||
| Male | 24 | 30 | χ2 = 0.414 | 0.520 | 29 | 36 | χ2 = 0.924 | 0.336 |
| Female | 44 | 44 | 68 | 63 | ||||
| Age (M ± SD) | 50.26 ± 7.49 | 51.24 ± 7.47 | F (1, 140) = 0.606 | 0.438 | 49.46 ± 7.15 | 51.88 ± 7.57 | F (1, 193) = 5.238 * | 0.023 |
| Pre-Adminstration | Post-Administration | Effect of Treatment | Effect of Time | Treatment Time | ||||||||||
|---|---|---|---|---|---|---|---|---|---|---|---|---|---|---|
| Placebo (n = 68) | CCE (n = 74) | Placebo | CCE | |||||||||||
| M | SE | M | SE | M | SE | M | SE | F (1, 140) | p | F (1, 140) | p | F (1, 140) | p | |
| Accuracy | ||||||||||||||
| Proportion Correct N = 1 & N = 2 Combined | 0.765 | 0.014 | 0.747 | 0.013 | 0.803 | 0.014 | 0.813 | 0.013 | 0.049 | 0.825 | 48.030 | <0.001 | 3.388 | 0.068 |
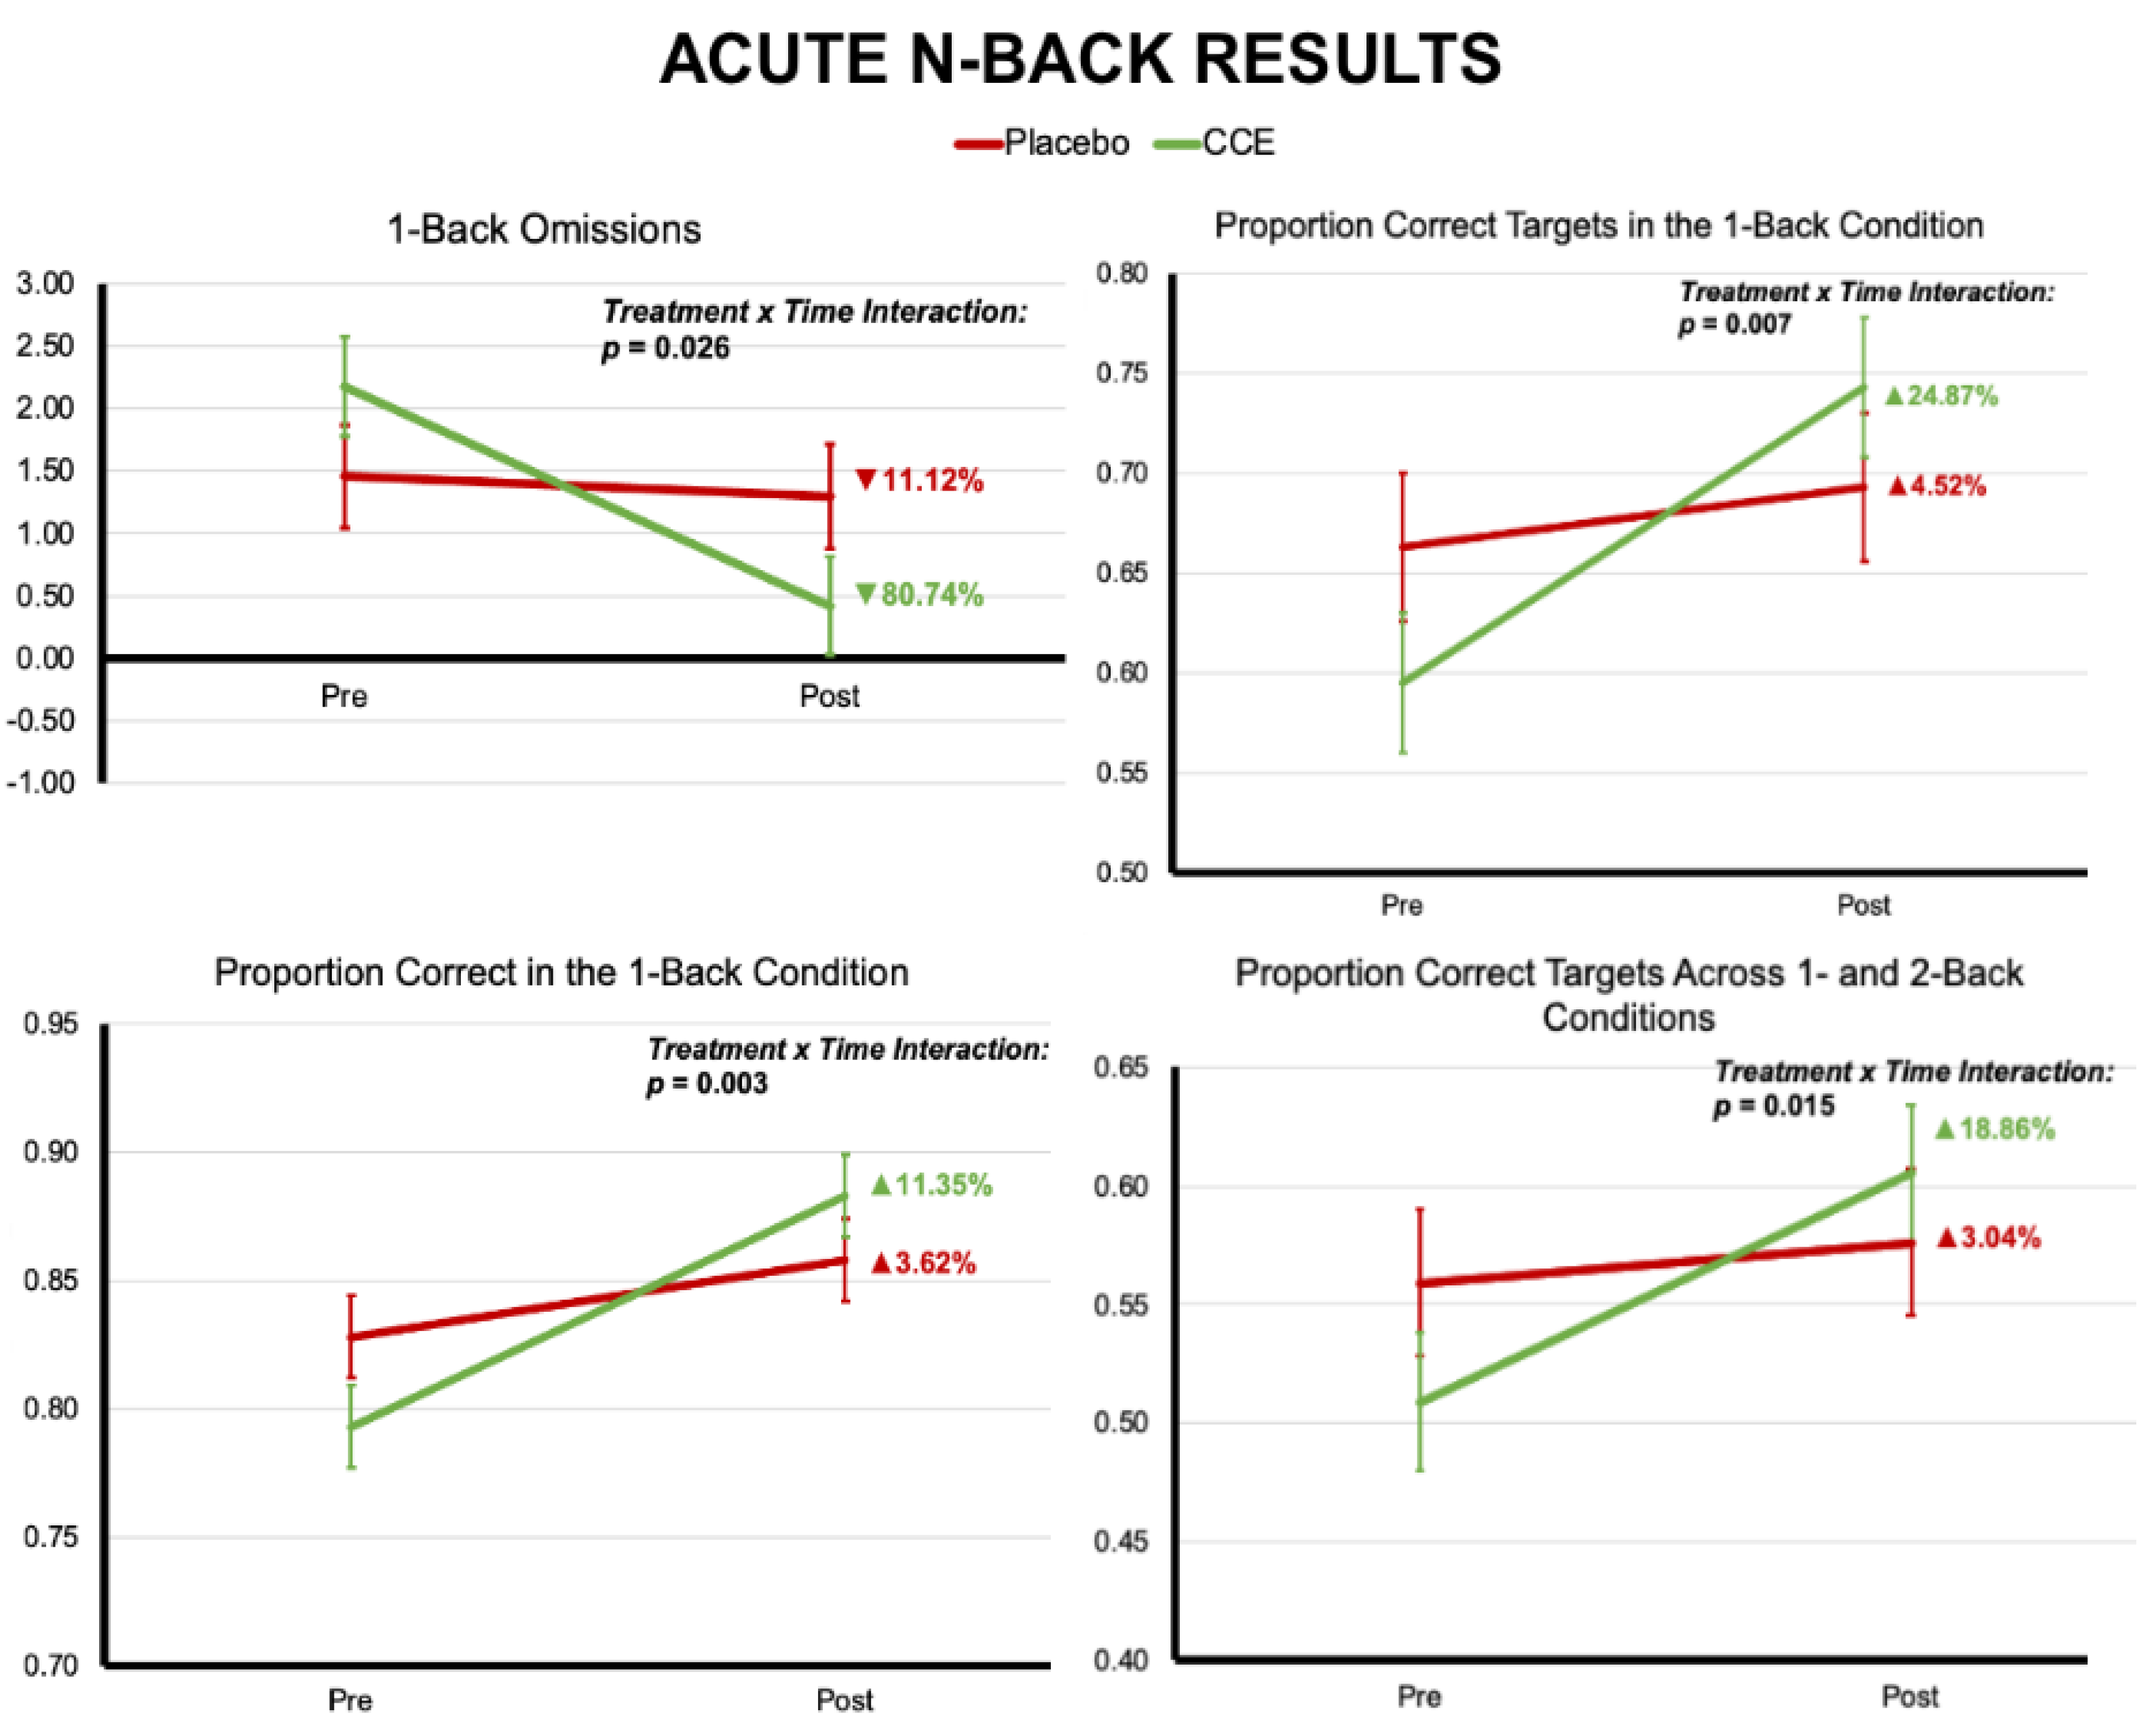
| Proportion Correct N = 1 & N = 2 Target Trials | 0.559 | 0.031 | 0.509 | 0.029 | 0.576 | 0.031 | 0.605 | 0.029 | 0.068 | 0.795 | 12.201 | <0.001 | 6.032 | 0.015 |
| Proportion Correct N = 1 & N = 2 Non-Target Trials | 0.853 | 0.013 | 0.849 | 0.013 | 0.901 | 0.013 | 0.902 | 0.013 | 0.005 | 0.942 | 35.924 | <0.001 | 0.112 | 0.738 |
| Proportion of False Alarms N = 1 & N = 2 Trials | 0.103 | 0.011 | 0.113 | 0.010 | 0.073 | 0.011 | 0.077 | 0.010 | 0.277 | 0.600 | 37.423 | <0.001 | 0.311 | 0.578 |
| Omissions N = 1 & N = 2 Trials | 4.941 | 0.951 | 4.135 | 0.911 | 3.265 | 0.951 | 2.230 | 0.911 | 0.685 | 0.409 | 6.431 | 0.012 | 0.026 | 0.871 |
| Proportion Correct 0-Back Trials | 0.922 | 0.009 | 0.942 | 0.009 | 0.930 | 0.009 | 0.921 | 0.009 | 0.272 | 0.603 | 0.675 | 0.413 | 4.109 | 0.045 |
| Proportion Correct 0-Back Target Trials | 0.832 | 0.022 | 0.877 | 0.021 | 0.826 | 0.022 | 0.813 | 0.021 | 0.412 | 0.522 | 4.514 | 0.035 | 3.151 | 0.078 |
| Proportion Correct 0-Back Non-Target Trials | 0.960 | 0.006 | 0.969 | 0.005 | 0.975 | 0.006 | 0.968 | 0.005 | 0.036 | 0.851 | 2.083 | 0.151 | 3.232 | 0.074 |
| Proportion of False Alarms 0-Back Trials | 0.027 | 0.004 | 0.020 | 0.004 | 0.016 | 0.004 | 0.022 | 0.004 | 0.011 | 0.916 | 1.584 | 0.210 | 3.905 | 0.050 |
| Omissions 0-Back Trials | 0.676 | 0.181 | 0.662 | 0.174 | 0.706 | 0.181 | 0.527 | 0.174 | 0.230 | 0.632 | 0.124 | 0.726 | 0.299 | 0.585 |
| Proportion Correct 1-Back Trials | 0.828 | 0.016 | 0.793 | 0.016 | 0.858 | 0.016 | 0.883 | 0.016 | 0.055 | 0.815 | 38.440 | <0.001 | 9.446 | 0.003 |
| Proportion Correct 1-Back Target Trials | 0.663 | 0.037 | 0.595 | 0.035 | 0.693 | 0.037 | 0.743 | 0.035 | 0.036 | 0.850 | 17.047 | <0.001 | 7.471 | 0.007 |
| Proportion Correct 1-Back Non-Target Trials | 0.899 | 0.014 | 0.879 | 0.013 | 0.929 | 0.014 | 0.943 | 0.013 | 0.036 | 0.849 | 27.748 | <0.001 | 3.602 | 0.060 |
| Proportion of False Alarms 1-Back Trials | 0.074 | 0.011 | 0.081 | 0.011 | 0.051 | 0.011 | 0.048 | 0.011 | 0.020 | 0.887 | 20.358 | <0.001 | 0.723 | 0.397 |
| Omissions 1-Back Trials | 1.456 | 0.414 | 2.176 | 0.397 | 1.294 | 0.414 | 0.419 | 0.397 | 0.030 | 0.864 | 7.373 | 0.007 | 5.096 | 0.026 |
| Proportion Correct 2-Back Trials | 0.702 | 0.015 | 0.701 | 0.014 | 0.749 | 0.015 | 0.744 | 0.014 | 0.026 | 0.872 | 21.931 | <0.001 | 0.039 | 0.843 |
| Proportion Correct 2-Back Target Trials | 0.456 | 0.030 | 0.424 | 0.028 | 0.459 | 0.030 | 0.468 | 0.028 | 0.096 | 0.757 | 1.821 | 0.179 | 1.348 | 0.248 |
| Proportion Correct 2-Back Non-Target Trials | 0.807 | 0.017 | 0.819 | 0.016 | 0.873 | 0.017 | 0.862 | 0.016 | 0.001 | 0.970 | 20.329 | <0.001 | 0.901 | 0.344 |
| Proportion of False Alarms 2-Back Trials | 0.133 | 0.012 | 0.146 | 0.012 | 0.095 | 0.012 | 0.106 | 0.012 | 0.678 | 0.412 | 25.732 | <0.001 | 0.013 | 0.911 |
| Omissions 2-Back Trials | 3.485 | 0.684 | 1.959 | 0.655 | 1.971 | 0.684 | 1.811 | 0.655 | 1.135 | 0.288 | 2.552 | 0.112 | 1.721 | 0.192 |
| Reaction Time | ||||||||||||||
| N = 1 & N = 2 Correct Trials | 556.709 | 12.135 | 560.564 | 11.633 | 489.173 | 12.135 | 504.664 | 11.633 | 0.405 | 0.525 | 73.644 | <0.001 | 0.655 | 0.420 |
| N = 1 & N = 2 Correct Target Trials | 568.768 | 12.559 | 587.692 | 12.314 | 510.154 | 12.622 | 535.192 | 12.314 | 1.968 | 0.163 | 47.706 | <0.001 | 0.144 | 0.705 |
| N = 1 & N = 2 Correct Non-Target Trials | 558.736 | 12.338 | 558.249 | 11.774 | 486.627 | 12.283 | 498.767 | 11.823 | 0.144 | 0.705 | 79.812 | <0.001 | 0.735 | 0.393 |
| 0-Back Correct Trials | 473.973 | 7.327 | 494.045 | 7.024 | 439.422 | 7.327 | 447.410 | 7.024 | 2.323 | 0.130 | 90.053 | <0.001 | 1.995 | 0.160 |
| 0-Back Correct Target Trials | 503.531 | 9.178 | 525.540 | 8.798 | 482.800 | 9.224 | 487.257 | 8.839 | 1.374 | 0.243 | 24.918 | <0.001 | 2.204 | 0.140 |
| 0-Back Correct Non-Target Trials | 463.660 | 7.571 | 484.093 | 7.257 | 424.510 | 7.571 | 433.331 | 7.257 | 2.411 | 0.123 | 95.073 | <0.001 | 1.586 | 0.210 |
| 1-Back Correct Trials | 540.297 | 11.420 | 543.248 | 10.947 | 471.964 | 11.420 | 493.422 | 10.947 | 0.750 | 0.388 | 67.624 | <0.001 | 1.659 | 0.200 |
| 1-Back Correct Target Trials | 549.380 | 12.953 | 569.375 | 12.532 | 495.606 | 12.953 | 530.893 | 12.286 | 3.108 | 0.080 | 28.011 | <0.001 | 0.770 | 0.382 |
| 1-Back Correct Non-Target Trials | 541.266 | 11.569 | 541.198 | 11.090 | 467.466 | 11.569 | 483.921 | 11.090 | 0.332 | 0.565 | 78.511 | <0.001 | 1.248 | 0.266 |
| 2-Back Correct Trials | 573.122 | 14.418 | 577.880 | 13.821 | 506.382 | 14.418 | 515.906 | 13.821 | 0.159 | 0.691 | 53.324 | <0.001 | 0.073 | 0.787 |
| 2-Back Correct Target Trials | 585.146 | 15.299 | 606.483 | 14.760 | 528.300 | 15.386 | 542.221 | 15.082 | 0.910 | 0.342 | 31.453 | <0.001 | 0.118 | 0.732 |
| 2-Back Correct Non-Target Trials | 574.825 | 14.678 | 575.301 | 14.004 | 505.789 | 14.609 | 514.069 | 14.065 | 0.058 | 0.809 | 51.092 | <0.001 | 0.183 | 0.669 |
| Pre-Adminstration | Post-Administration | Effect of Treatment | Effect of Time | Treatment Time | ||||||||||
|---|---|---|---|---|---|---|---|---|---|---|---|---|---|---|
| Placebo (n = 97) | CCE (n = 99) | Placebo | CCE | |||||||||||
| M | SE | M | SE | M | SE | M | SE | F (1, 194) | p | F (1, 194) | p | F (1, 194) | p | |
| Accuracy | ||||||||||||||
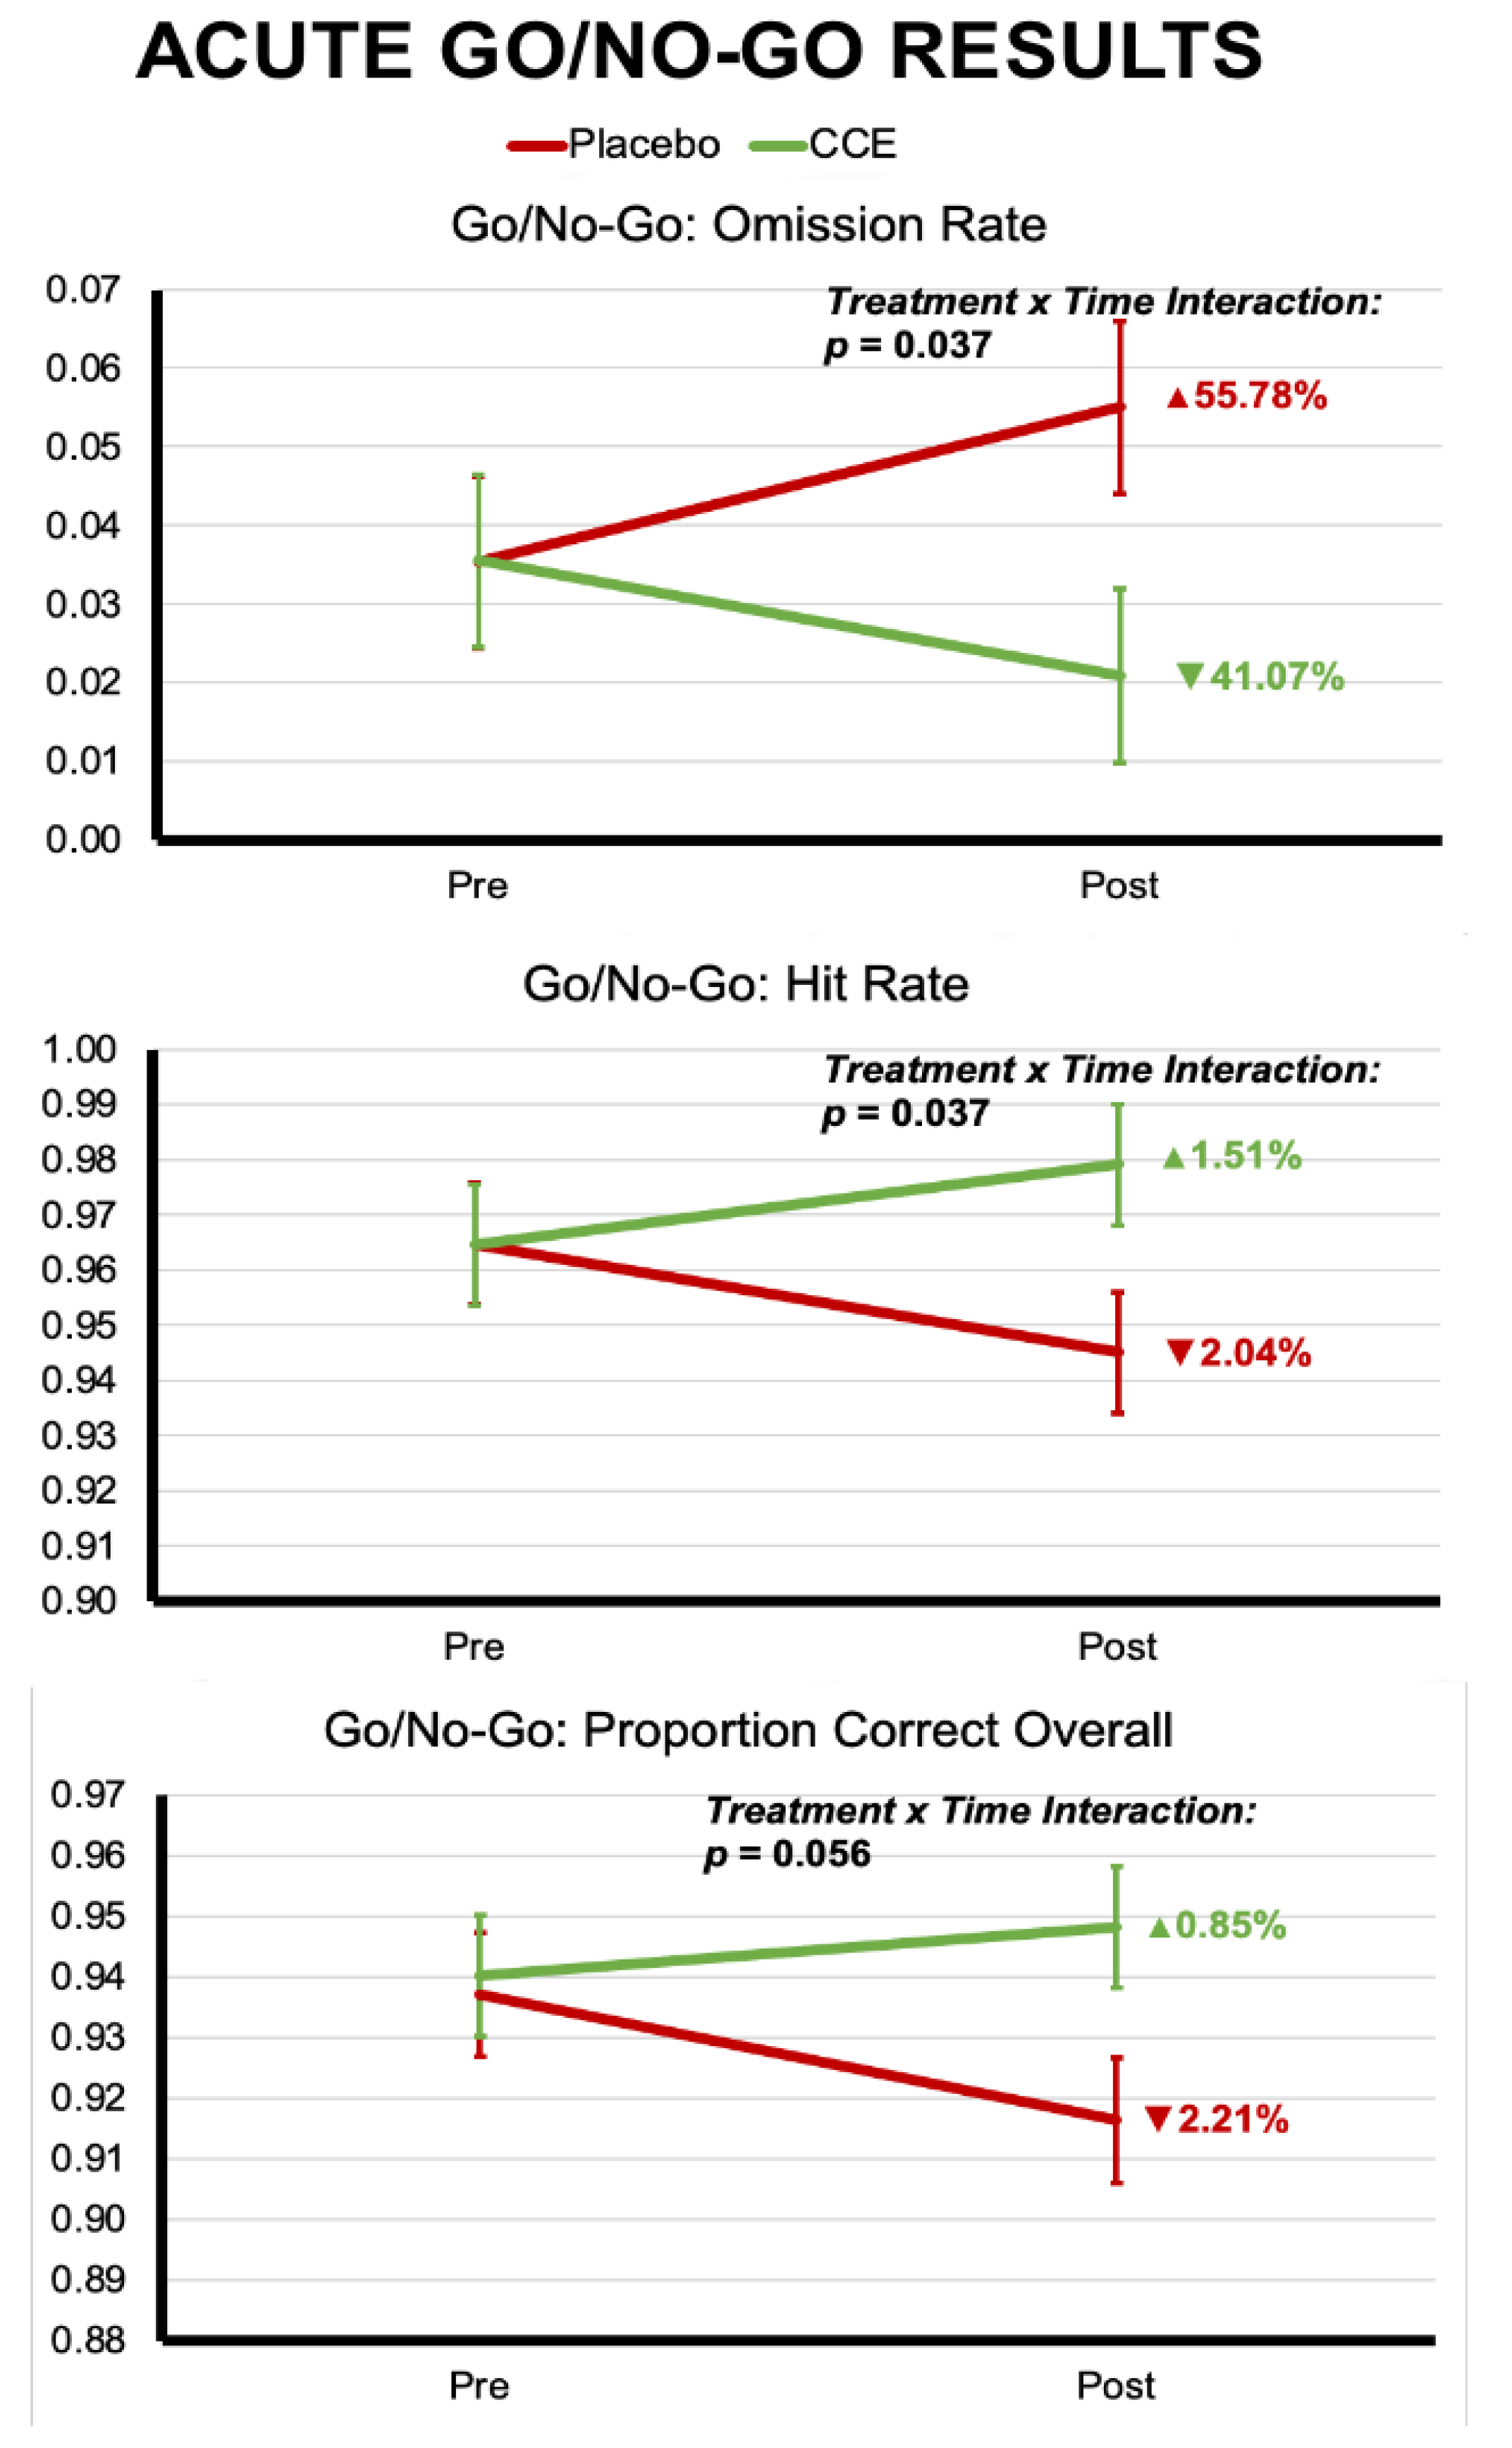
| Proportion Correct Overall | 0.937 | 0.010 | 0.940 | 0.010 | 0.916 | 0.010 | 0.948 | 0.010 | 2.013 | 0.158 | 0.734 | 0.393 | 3.699 | 0.056 |
| Hit Rate | 0.965 | 0.011 | 0.965 | 0.011 | 0.945 | 0.011 | 0.979 | 0.011 | 1.658 | 0.199 | 0.098 | 0.754 | 4.417 | 0.037 |
| Commission Rate | 0.307 | 0.016 | 0.275 | 0.016 | 0.337 | 0.016 | 0.325 | 0.016 | 1.149 | 0.285 | 15.727 | 0.000 | 1.012 | 0.316 |
| Reaction Time | ||||||||||||||
| Mean Reaction Time Overall | 444.211 | 6.127 | 435.977 | 6.065 | 416.403 | 6.127 | 413.853 | 6.065 | 0.448 | 0.504 | 66.149 | 0.000 | 0.857 | 0.356 |
| Mean Hit Reaction Time | 445.312 | 6.131 | 437.330 | 6.069 | 417.816 | 6.131 | 415.368 | 6.069 | 0.419 | 0.518 | 64.368 | 0.000 | 0.806 | 0.370 |
| Mean Commission Rate | 408.855 | 7.687 | 396.078 | 7.577 | 377.167 | 7.624 | 375.007 | 7.547 | 0.664 | 0.416 | 21.910 | 0.000 | 0.887 | 0.347 |
| N-Back | Go/No-Go | |||||||
|---|---|---|---|---|---|---|---|---|
| Placebo (n = 92) | CCE (n = 96) | Statistic | p | Placebo (n = 73) | CCE (n = 81) | Statistic | p | |
| Ethnicity | ||||||||
| American Indian or Alaskan Native, Hispanic or Latino, Asian or Asian American | 1.09% | 4.17% | χ2 = 9.644 | 0.210 | 1.37% | 3.70% | χ2 = 6.195 | 0.517 |
| Asian or Asian American | 3.26% | 3.13% | 5.48% | 3.70% | ||||
| Black of African American | 2.17% | 8.33% | 2.74% | 6.17% | ||||
| Hawaiian or Pacific Islander, White | 0.00% | 2.08% | 0.00% | 2.47% | ||||
| Hispanic or Latino | 6.52% | 6.25% | 8.22% | 6.17% | ||||
| White | 85.87% | 75.00% | 80.82% | 76.54% | ||||
| Mixed race | 0.00% | 0.00% | 0.00% | 0.00% | ||||
| Preferred not to say | 1.09% | 1.04% | 1.37% | 1.23% | ||||
| Education | ||||||||
| High School Diploma | 3.26% | 3.13% | χ2 = 4.392 | 0.734 | 4.11% | 6.17% | χ2 = 4.987 | 0.662 |
| Post-secondary Non-Degree Award | 1.09% | 0.00% | 0.00% | 0.00% | ||||
| Associate’s Degree | 8.70% | 10.42% | 6.85% | 11.11% | ||||
| Some College, No Degree | 17.39% | 12.50% | 19.18% | 18.52% | ||||
| Bachelor’s Degree | 41.30% | 38.54% | 41.10% | 30.86% | ||||
| Master’s Degree | 19.57% | 23.96% | 21.92% | 23.46% | ||||
| Doctoral or Professional Degree | 8.70% | 9.38% | 6.85% | 6.17% | ||||
| Other | 0.00% | 0.00% | 0.00% | 1.23% | ||||
| No Response | 0.00% | 2.08% | 0.00% | 2.47% | ||||
| Employment | ||||||||
| Homemaker | 8.70% | 3.13% | χ2 = 16.620 | 0.083 | 8.22% | 4.94% | χ2 = 12.672 | 0.178 |
| Student | 0.00% | 2.08% | 0.00% | 1.23% | ||||
| Employed for Wages | 64.13% | 66.67% | 68.49% | 59.26% | ||||
| Military | 0.00% | 1.04% | 0.00% | 1.23% | ||||
| Other | 0.00% | 1.04% | 0.00% | 0.00% | ||||
| Out of Work—Looking | 4.35% | 4.17% | 4.11% | 4.94% | ||||
| Out of Work—Not Looking | 0.00% | 3.13% | 0.00% | 3.70% | ||||
| Retired | 10.87% | 7.29% | 6.85% | 9.88% | ||||
| Self-Employed | 8.70% | 5.21% | 6.85% | 4.94% | ||||
| Unable to Work | 3.26% | 1.04% | 5.48% | 2.47% | ||||
| No Response | 0.00% | 5.21% | 0.00% | 7.41% | ||||
| Marital Status | ||||||||
| Divorced | 10.87% | 15.63% | χ2 = 9.752 | 0.135 | 10.96% | 14.81% | χ2 = 10.829 | 0.094 |
| Married or Domestic Partnership | 68.48% | 57.29% | 72.60% | 60.49% | ||||
| Other | 1.09% | 0.00% | 1.37% | 0.00% | ||||
| Separated | 3.26% | 1.04% | 4.11% | 2.47% | ||||
| Single, Never Married | 15.22% | 17.71% | 10.96% | 11.11% | ||||
| Widowed | 1.09% | 3.13% | 0.00% | 3.70% | ||||
| No Response | 0.00% | 5.21% | 0.00% | 7.41% | ||||
| Household Size | ||||||||
| 1 Person | 15.22% | 20.83% | χ2 = 9.965 | 0.126 | 13.70% | 19.75% | χ2 = 11.711 | 0.069 |
| 2 People | 38.04% | 32.29% | 30.14% | 30.86% | ||||
| 3 People | 17.39% | 22.92% | 17.81% | 22.22% | ||||
| 4 People | 16.30% | 8.33% | 20.55% | 8.64% | ||||
| 5 People | 8.70% | 8.33% | 10.96% | 6.17% | ||||
| 6 or More People | 4.35% | 2.08% | 6.85% | 4.94% | ||||
| No Response | 0.00% | 5.21% | 0.00% | 7.41% | ||||
| Household Income | ||||||||
| Less than $25,000 | 4.35% | 4.17% | χ2 = 8.056 | 0.529 | 4.11% | 6.17% | χ2 = 13.953 | 0.124 |
| $25,000–$34,999 | 3.26% | 5.21% | 2.74% | 6.17% | ||||
| $35,000–$49,999 | 7.61% | 7.29% | 6.85% | 9.88% | ||||
| $50,000–$74,999 | 17.39% | 16.67% | 15.07% | 14.81% | ||||
| $75,000–$99,999 | 22.83% | 22.92% | 20.55% | 22.22% | ||||
| $100,000–$149,999 | 25.00% | 21.88% | 27.40% | 18.52% | ||||
| $150,000–$199,999 | 6.52% | 9.38% | 10.96% | 12.35% | ||||
| $200,000 or more | 9.78% | 4.17% | 10.96% | 2.47% | ||||
| I prefer not to say | 3.26% | 3.13% | 1.37% | 0.00% | ||||
| No Response | 0.00% | 5.21% | 0.00% | 7.41% | ||||
| Geographical Region | ||||||||
| Midwest—IA, IL, IN, KS, MI, MN, MO, ND, NE, OH, SD, WI | 21.74% | 21.88% | χ2 = 5.453 | 0.363 | 28.77% | 22.22% | χ2 = 5.581 | 0.349 |
| Northeast—CT, DC, DE, MA, MD, ME, NH, NJ, NY, PA, RI, VT | 16.30% | 12.50% | 13.70% | 11.11% | ||||
| Southeast—AL, AR, FL, GA, KY, LA, MS, NC, SC, TN, VA, WV | 31.52% | 36.46% | 32.88% | 33.33% | ||||
| Southwest—AZ, NM, OK, TX | 14.13% | 13.54% | 10.96% | 13.58% | ||||
| West—AK, CA, CO, HI, ID, MT, NV, OR, UT, WA, WY | 16.30% | 11.46% | 13.70% | 13.58% | ||||
| No Response | 0.00% | 4.17% | 0.00% | 6.17% | ||||
| Sex Assigned at Birth | ||||||||
| Male | 33 | 38 | χ2 = 0.276 | 0.600 | 25 | 32 | χ2 = 0.456 | 0.500 |
| Female | 59 | 58 | 48 | 49 | ||||
| Age (M ± SD) | 49.61 ± 7.46 | 50.91 ± 7.63 | F (1, 185) = 1.380 | 0.242 | 48.36 ± 6.82 | 51.09 ± 7.92 | F (1, 151) = 5.182 * | 0.024 |
| Effect of Treatment | Effect of Time | Treatment Time | Main Effect of Time & Interaction | |||||||
|---|---|---|---|---|---|---|---|---|---|---|
| F | p | Numerator df | Denominator df | F | p | F | p | Numerator df | Denominator df | |
| Accuracy | ||||||||||
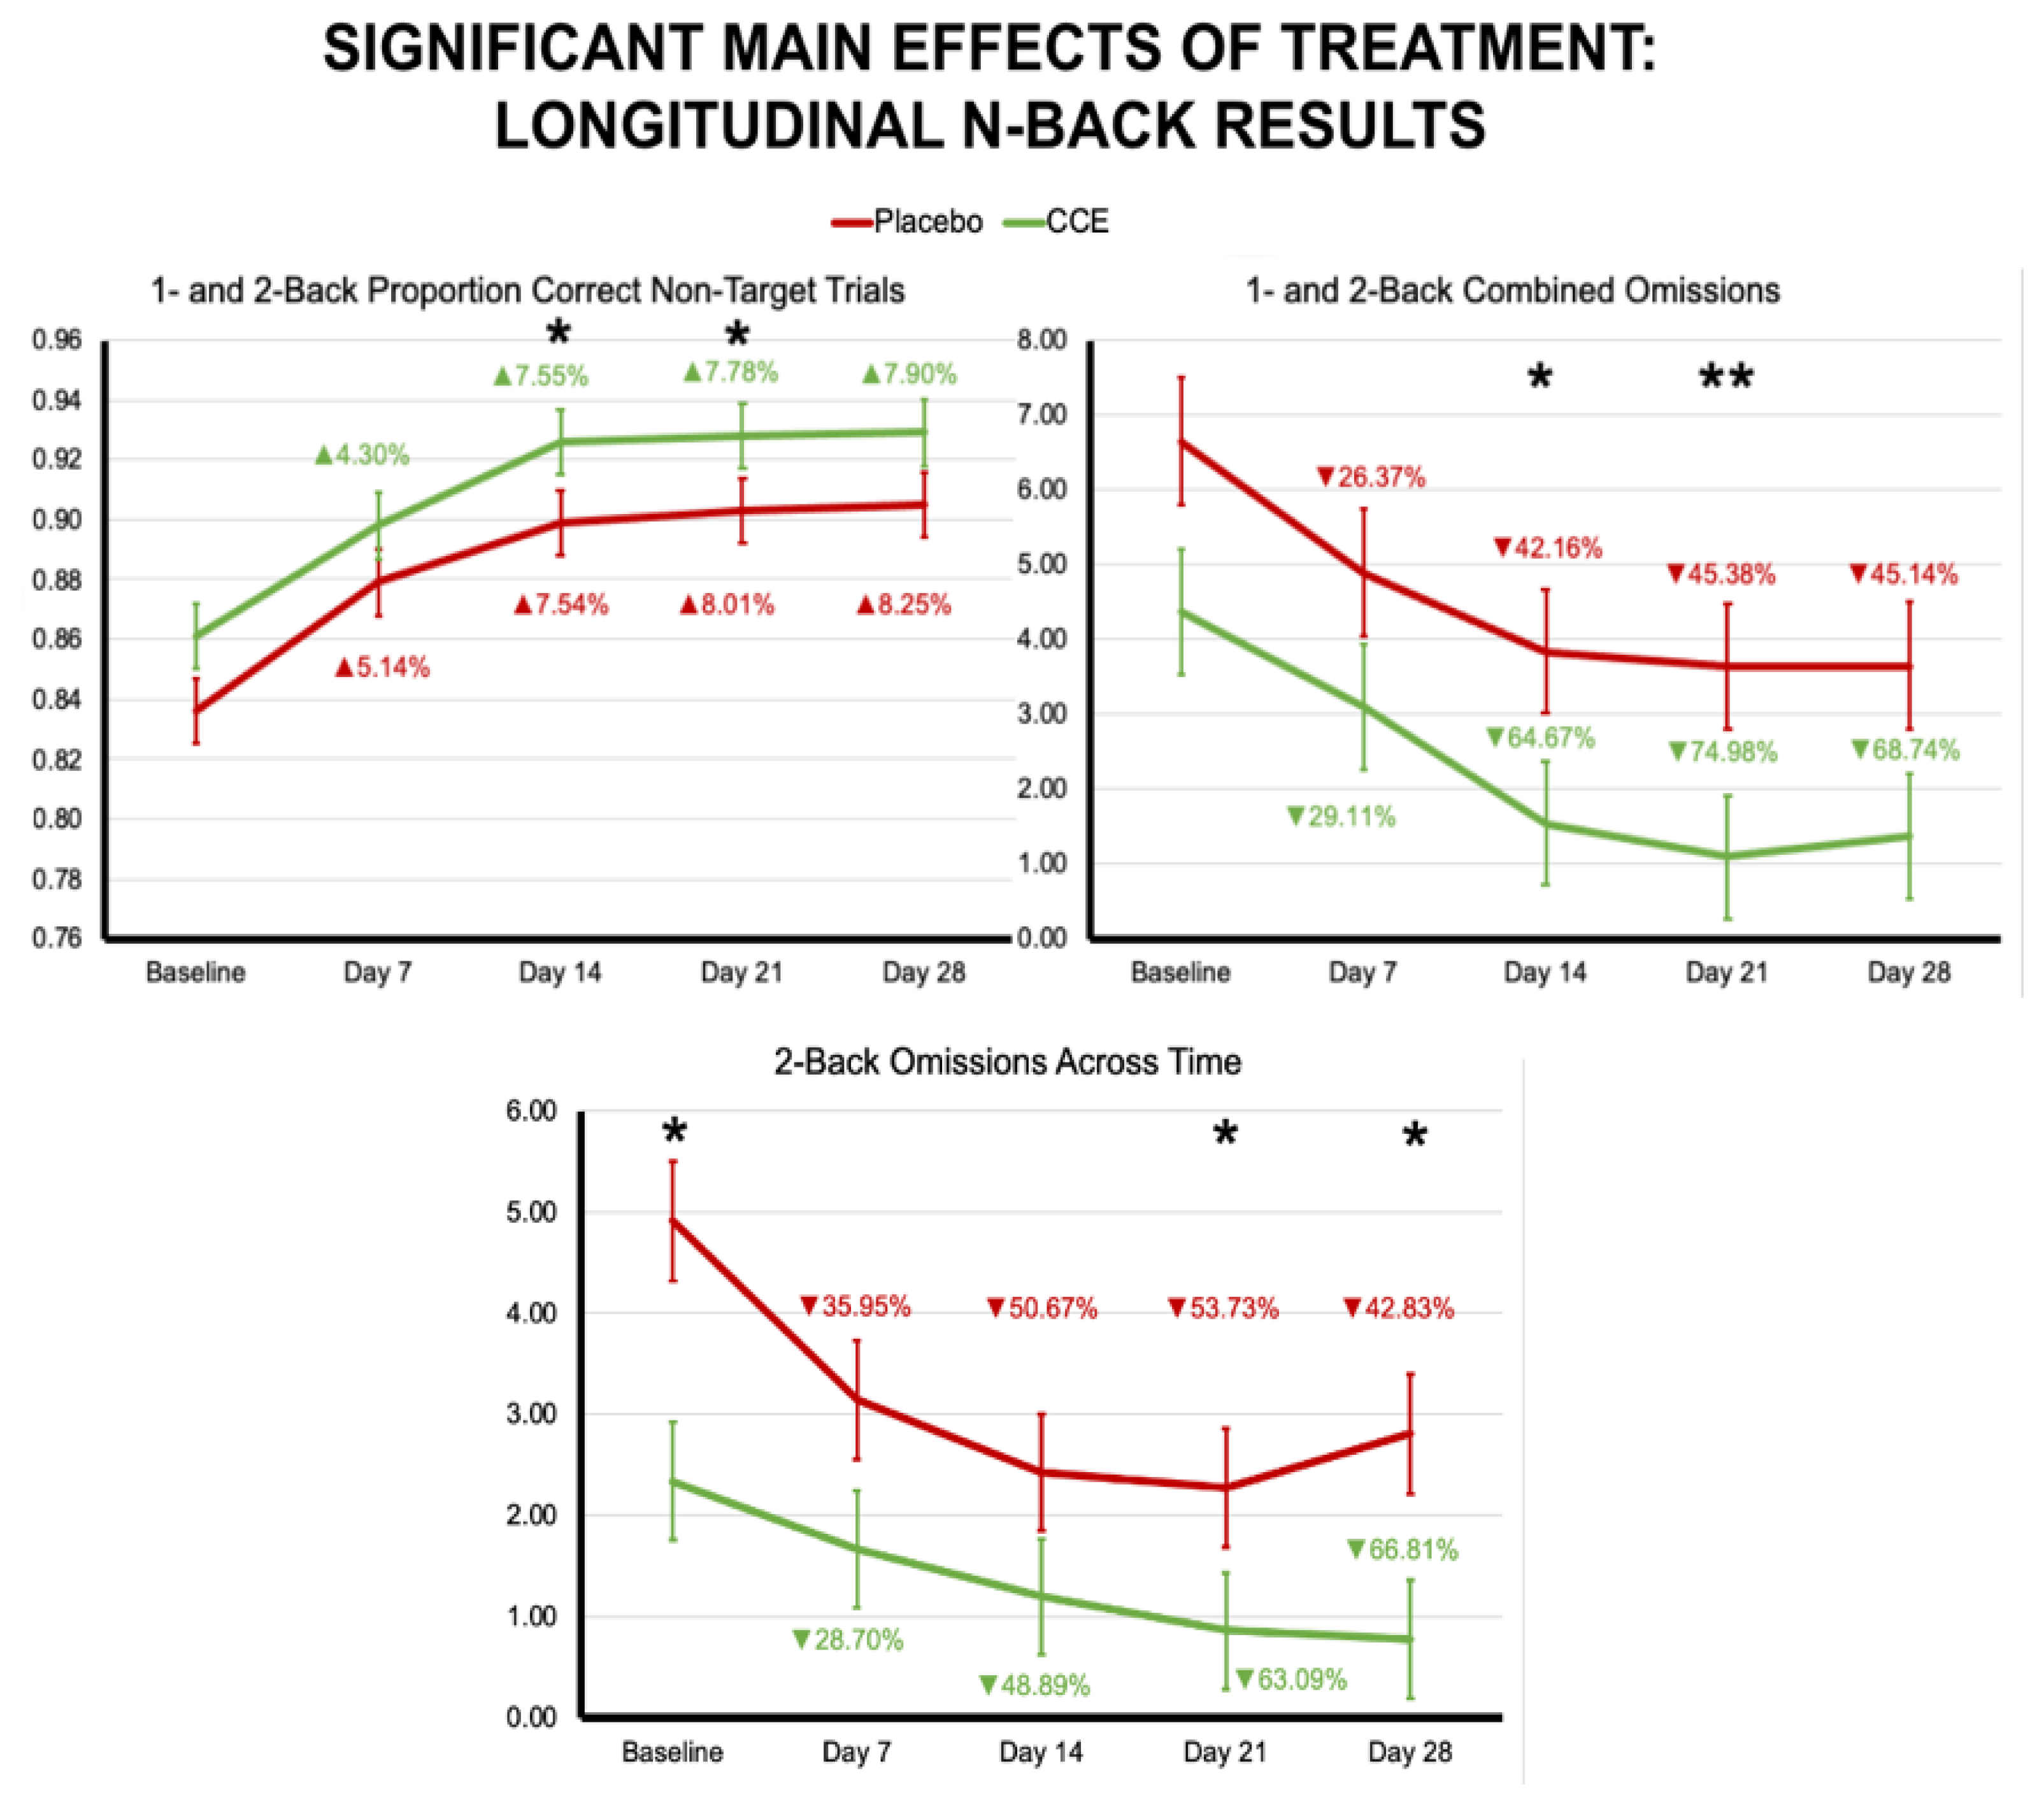
| Proportion Correct N = 1 & N = 2 Combined | 2.129 | 0.146 | 1 | 201.068 | 23.708 | <0.001 | 0.947 | 0.436 | 4 | 654.212 |
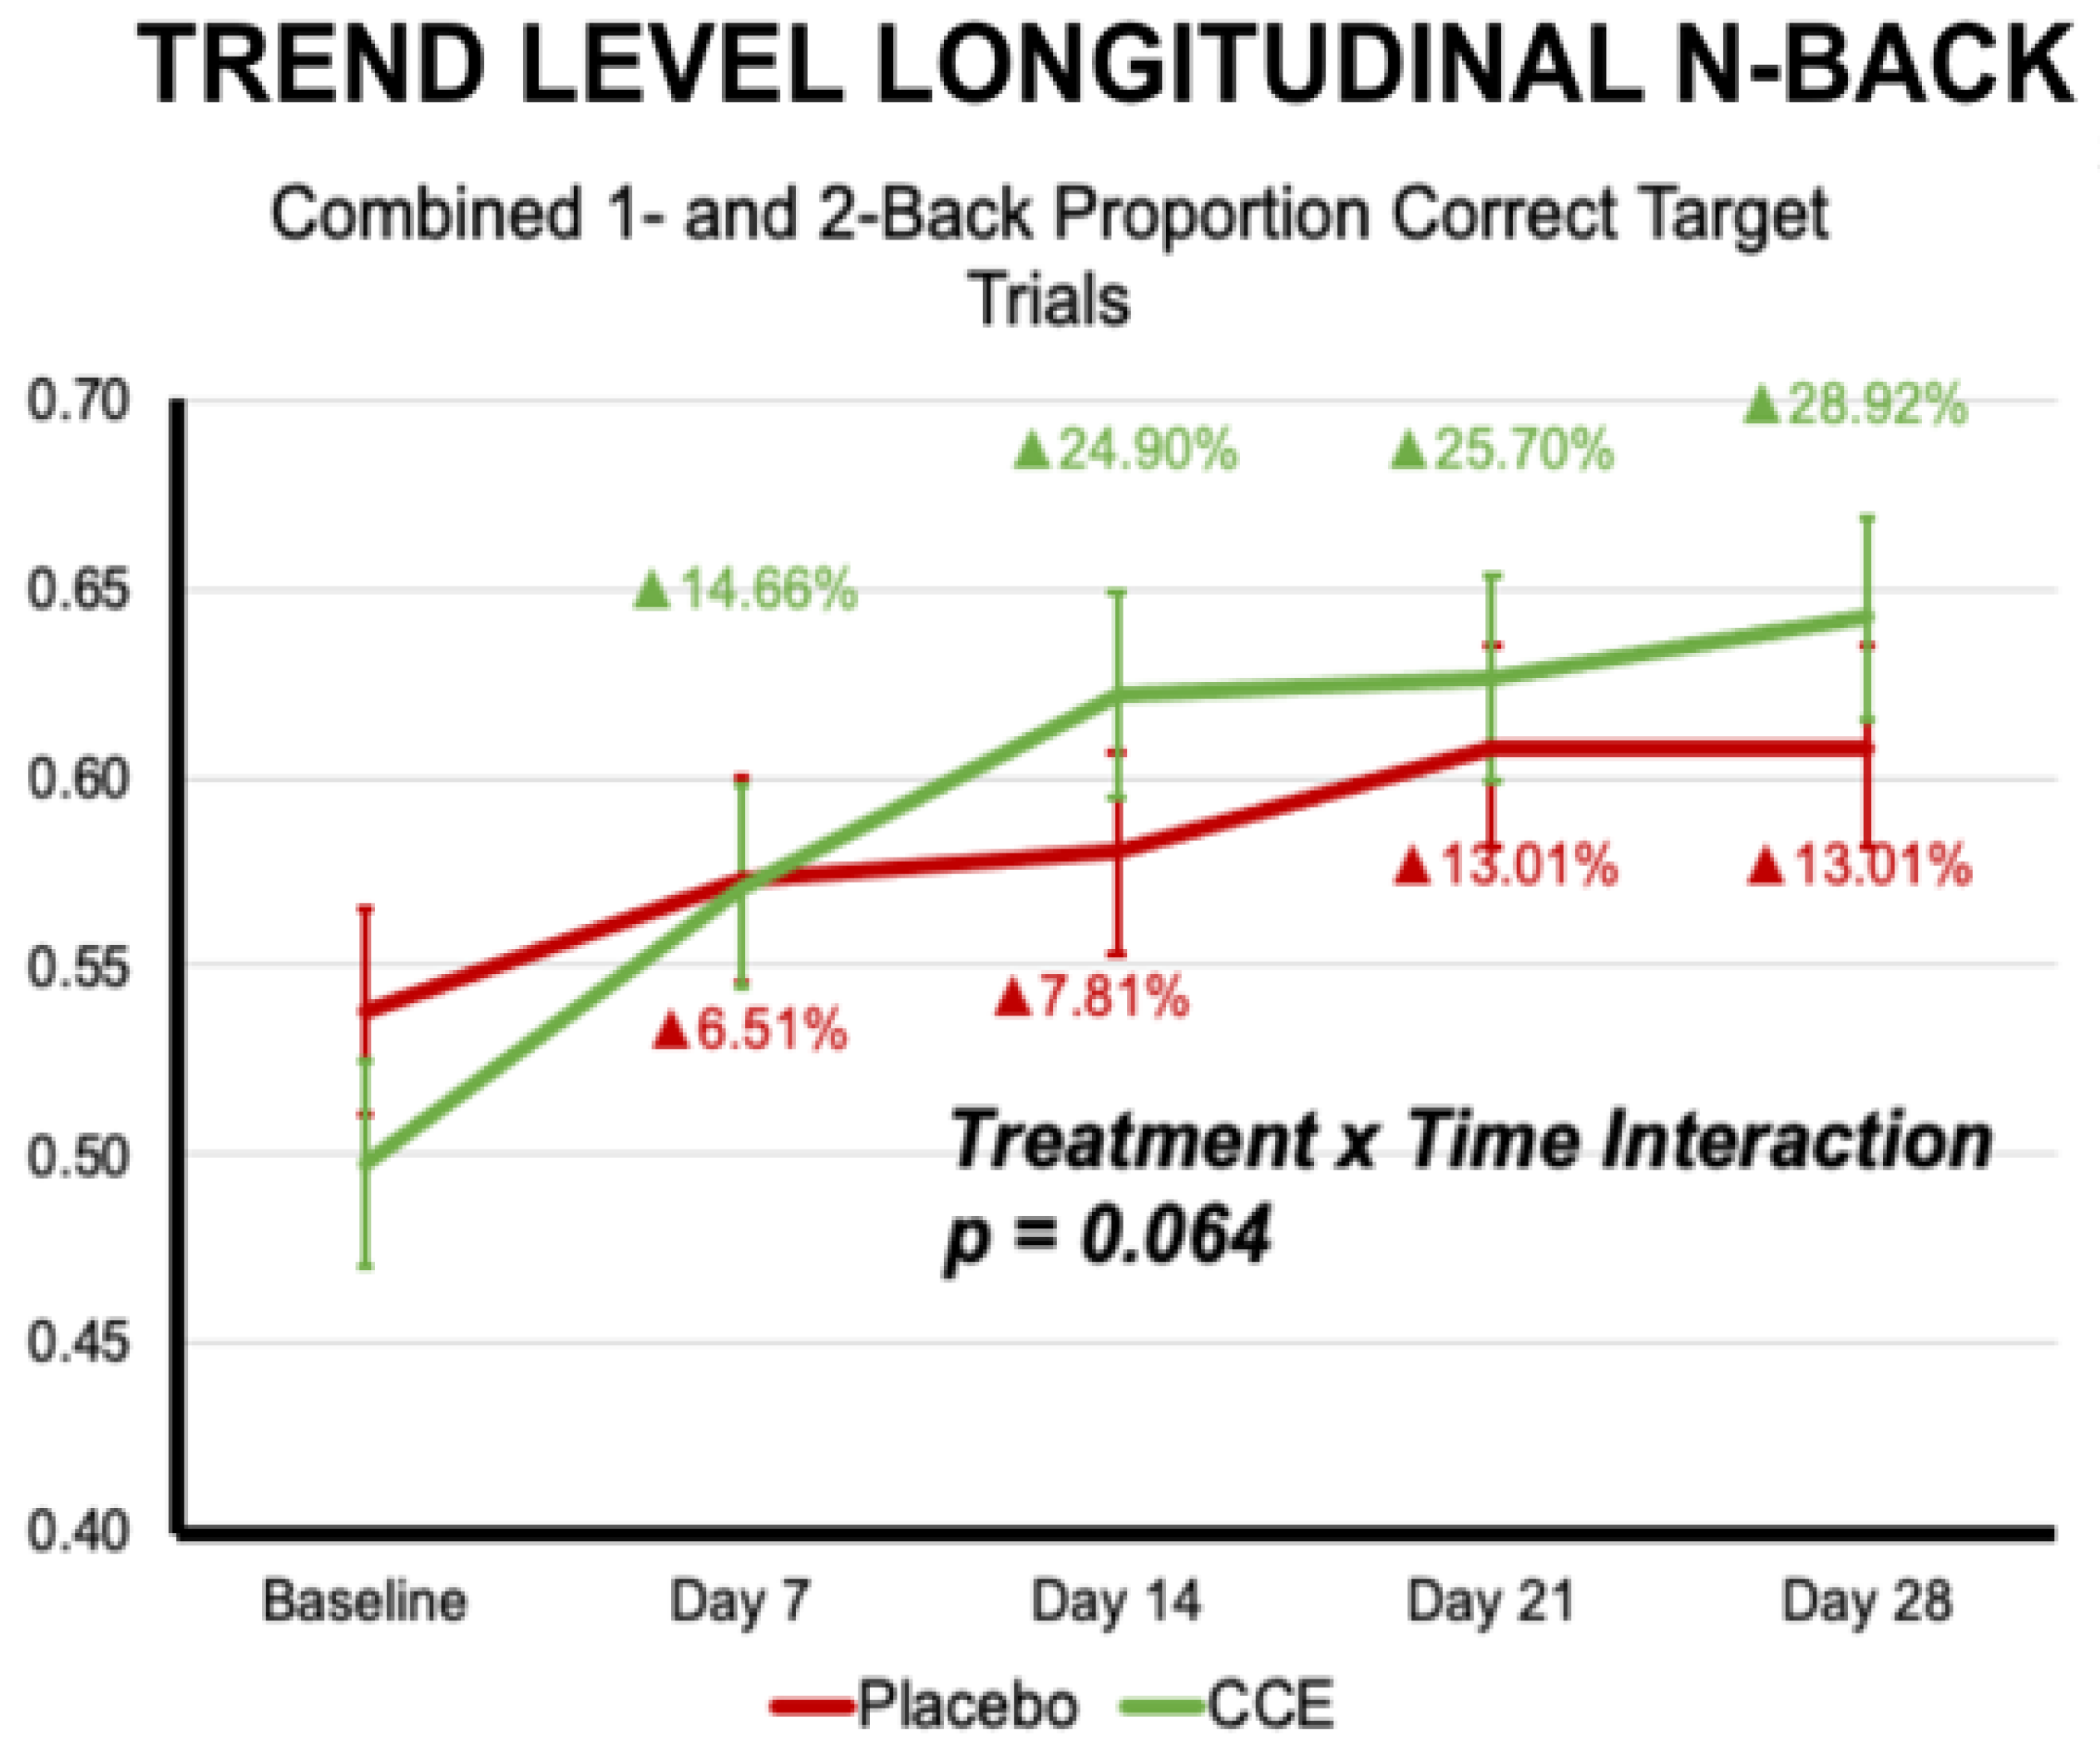
| Proportion Correct N = 1 & N = 2 Target Trials | 0.094 | 0.759 | 1 | 196.458 | 9.487 | <0.001 | 2.235 | 0.064 | 4 | 665.183 |
| Proportion Correct N = 1 & N = 2 Non-Target Trials | 4.925 | 0.028 | 1 | 203.427 | 16.539 | <0.001 | 0.118 | 0.976 | 4 | 619.148 |
| Proportion of False Alarms N = 1 & N = 2 Trials | 0.204 | 0.652 | 1 | 195.684 | 15.564 | <0.001 | 0.136 | 0.969 | 4 | 641.268 |
| Omissions N = 1 & N = 2 Trials | 8.284 | 0.004 | 1 | 196.894 | 4.781 | <0.001 | 0.086 | 0.987 | 4 | 585.205 |
| Proportion Correct 0-Back Trials | 2.760 | 0.098 | 1 | 221.430 | 1.766 | 0.134 | 0.425 | 0.791 | 4 | 612.745 |
| Proportion Correct 0-Back Target Trials | 1.859 | 0.174 | 1 | 218.398 | 0.955 | 0.432 | 0.530 | 0.714 | 4 | 619.311 |
| Proportion Correct 0-Back Non-Target Trials | 2.595 | 0.108 | 1 | 272.157 | 2.198 | 0.068 | 0.450 | 0.772 | 4 | 613.690 |
| Proportion of False Alarms 0-Back Trials | 1.725 | 0.190 | 1 | 301.950 | 1.525 | 0.193 | 1.523 | 0.194 | 4 | 634.316 |
| Omissions 0-Back Trials | 1.712 | 0.192 | 1 | 214.768 | 2.203 | 0.067 | 2.034 | 0.088 | 4 | 573.777 |
| Proportion Correct 1-Back Trials | 0.987 | 0.322 | 1 | 206.676 | 12.756 | <0.001 | 2.112 | 0.078 | 4 | 640.984 |
| Proportion Correct 1-Back Target Trials | 0.260 | 0.611 | 1 | 195.324 | 6.908 | <0.001 | 1.306 | 0.266 | 4 | 653.941 |
| Proportion Correct 1-Back Non-Target Trials | 1.805 | 0.180 | 1 | 229.925 | 10.032 | <0.001 | 1.355 | 0.248 | 4 | 597.683 |
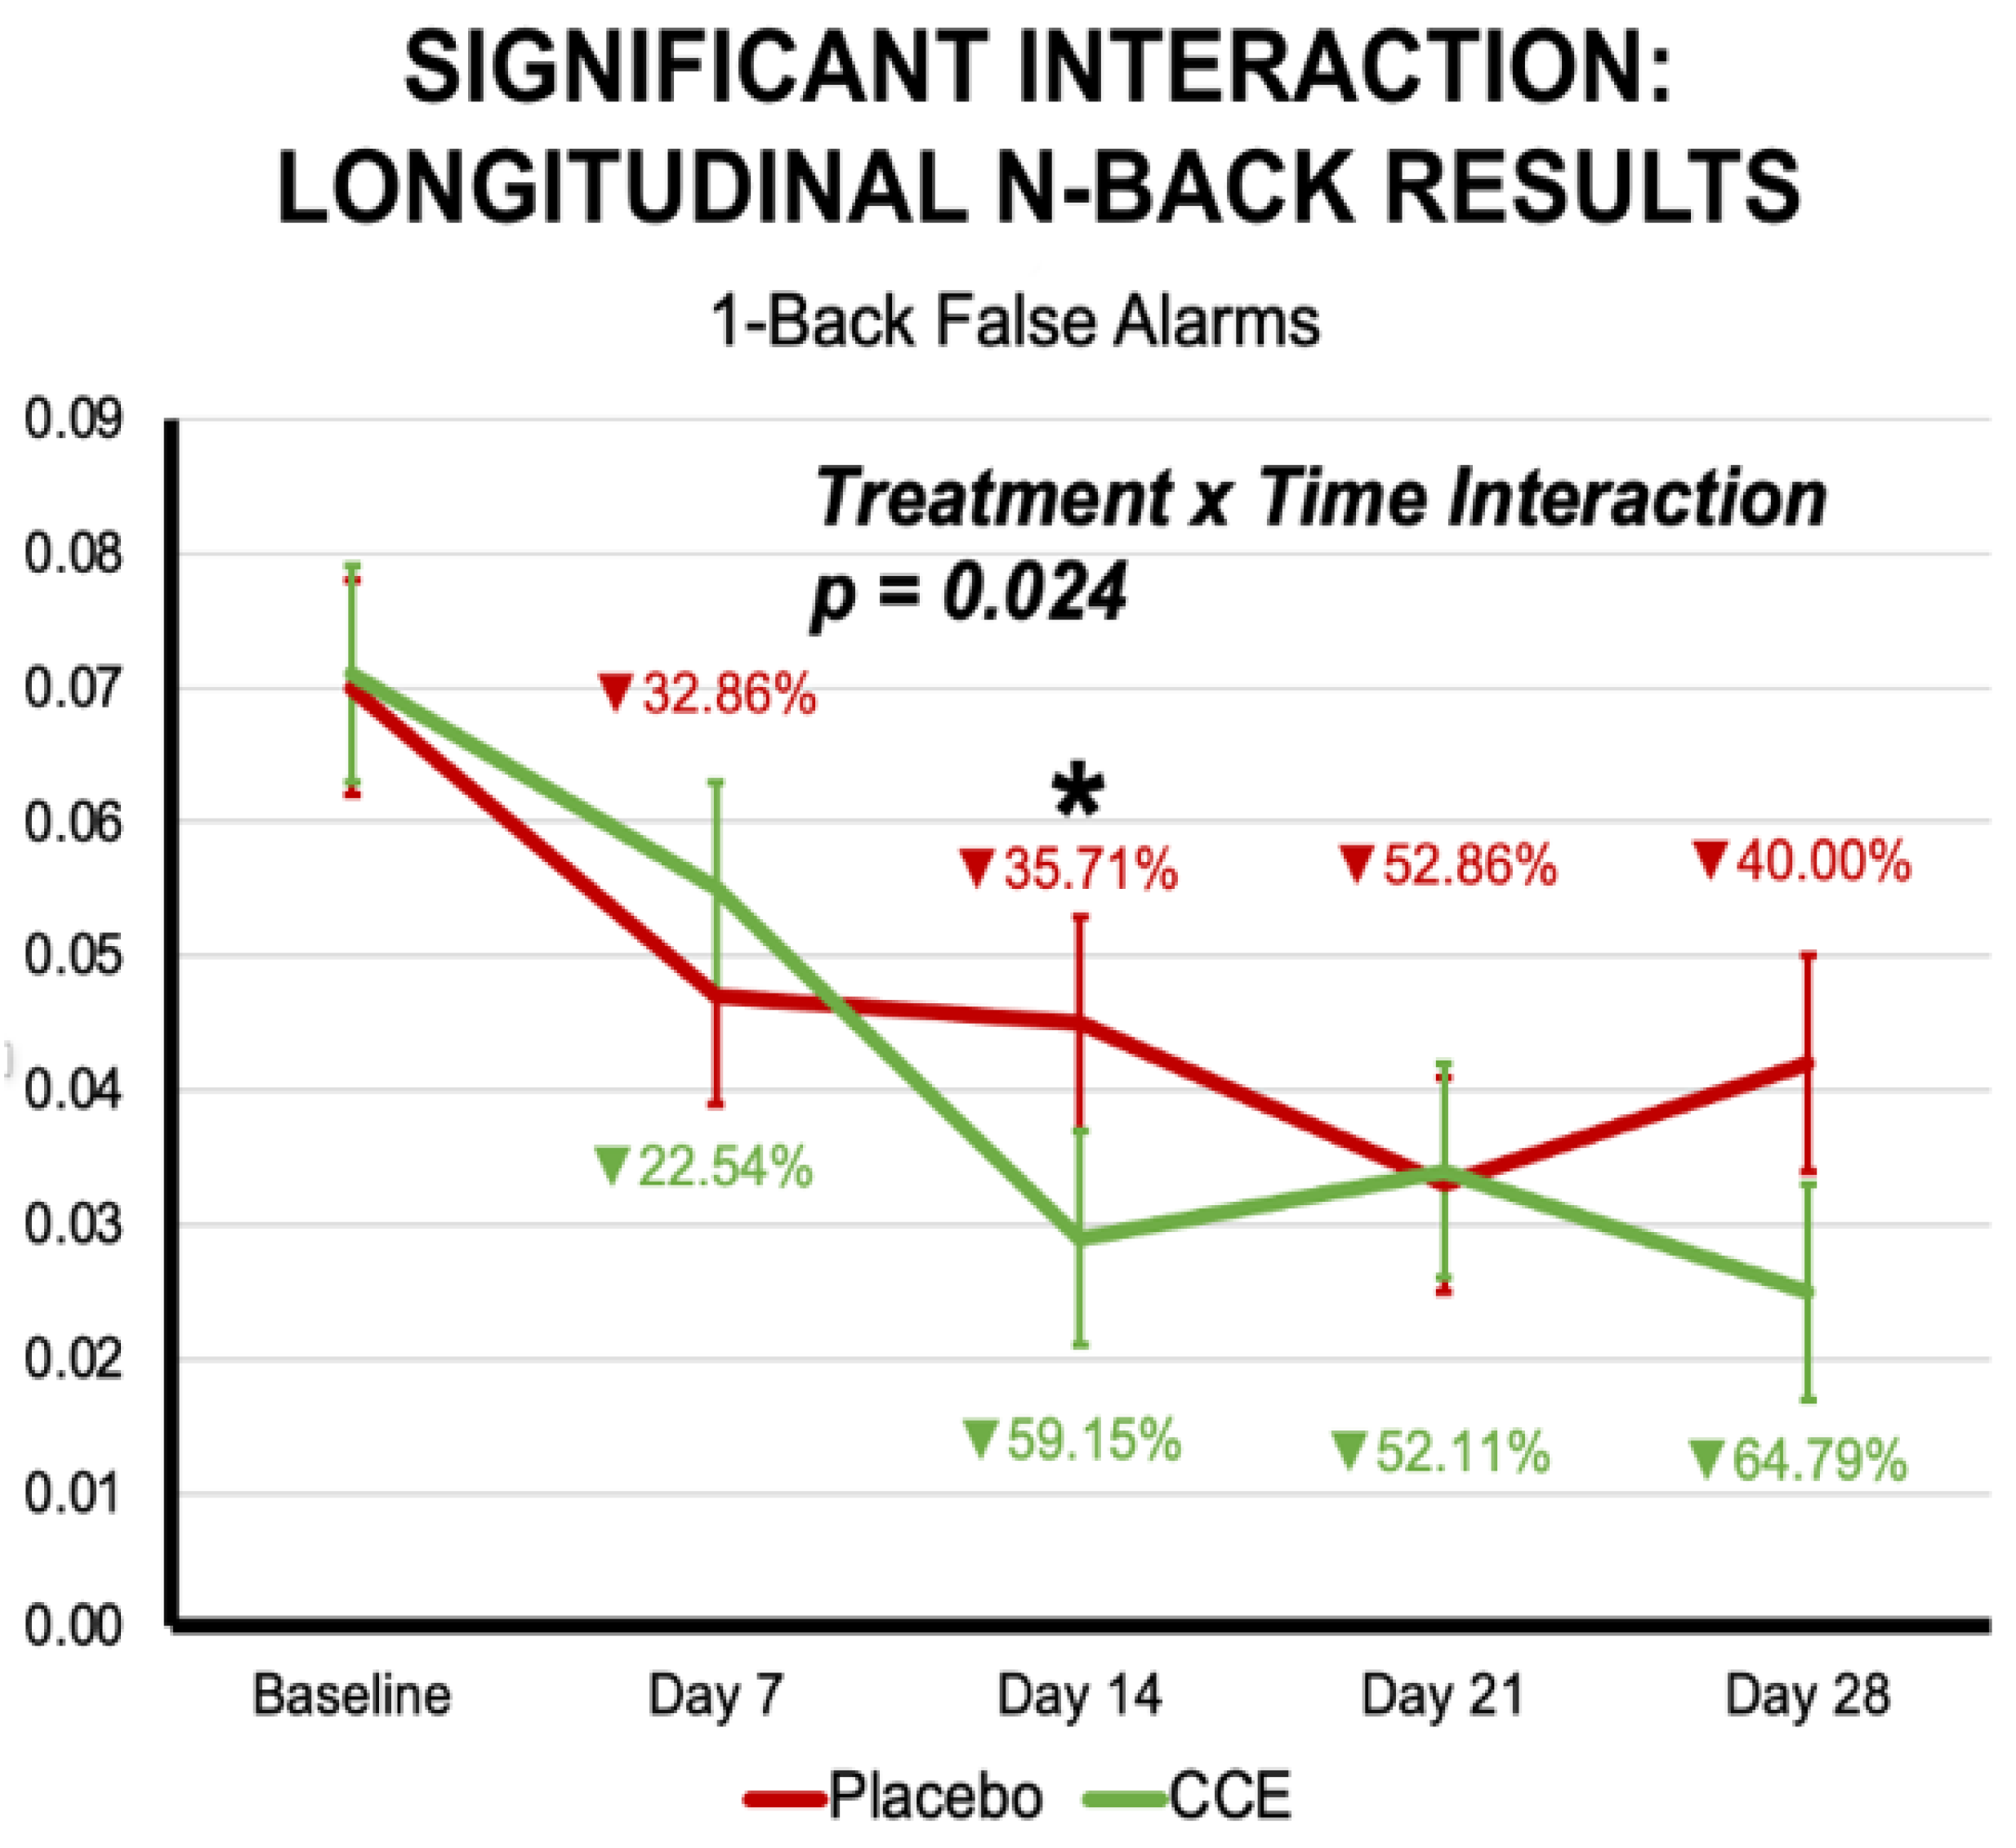
| Proportion of False Alarms 1-Back Trials | 0.320 | 0.572 | 1 | 196.861 | 8.678 | <0.001 | 2.825 | 0.024 | 4 | 612.677 |
| Omissions 1-Back Trials | 2.193 | 0.140 | 1 | 264.435 | 2.956 | 0.019 | 1.135 | 0.339 | 4 | 592.520 |
| Proportion Correct 2-Back Trials | 3.088 | 0.080 | 1 | 200.852 | 18.621 | <0.001 | 0.085 | 0.987 | 4 | 640.454 |
| Proportion Correct 2-Back Target Trials | 0.002 | 0.962 | 1 | 205.279 | 6.064 | <0.001 | 1.710 | 0.146 | 4 | 656.353 |
| Proportion Correct 2-Back Non-Target Trials | 6.237 | 0.013 | 1 | 203.483 | 13.407 | <0.001 | 0.577 | 0.679 | 4 | 621.606 |
| Proportion of False Alarms 2-Back Trials | 0.102 | 0.749 | 1 | 213.668 | 10.630 | <0.001 | 1.116 | 0.348 | 4 | 637.502 |
| Omissions 2-Back Trials | 8.833 | 0.003 | 1 | 179.915 | 4.630 | 0.001 | 0.731 | 0.571 | 4 | 589.298 |
| Reaction Time | ||||||||||
| N = 1 & N = 2 Correct Trials | 0.000 | 0.987 | 1 | 194.698 | 22.125 | <.001 | 0.527 | 0.716 | 4 | 658.257 |
| N = 1 & N = 2 Correct Target Trials | 0.364 | 0.547 | 1 | 196.034 | 14.803 | <.001 | 0.236 | 0.918 | 4 | 604.547 |
| N = 1 & N = 2 Correct Non-Target Trials | 0.001 | 0.971 | 1 | 193.120 | 24.577 | <.001 | 0.498 | 0.737 | 4 | 654.277 |
| 0-Back Correct Trials | 0.620 | 0.432 | 1 | 198.526 | 15.017 | <0.001 | 0.175 | 0.951 | 4 | 649.023 |
| 0-Back Correct Target Trials | 0.948 | 0.331 | 1 | 192.765 | 2.936 | 0.020 | 0.238 | 0.917 | 4 | 630.231 |
| 0-Back Correct Non-Target Trials | 0.566 | 0.453 | 1 | 199.570 | 17.907 | <0.001 | 0.252 | 0.909 | 4 | 644.080 |
| 1-Back Correct Trials | 0.062 | 0.803 | 1 | 191.793 | 19.437 | <0.001 | 0.713 | 0.583 | 4 | 650.419 |
| 1-Back Correct Target Trials | 0.195 | 0.659 | 1 | 192.608 | 10.939 | <0.001 | 0.443 | 0.777 | 4 | 617.025 |
| 1-Back Correct Non-Target Trials | 0.050 | 0.824 | 1 | 191.700 | 20.789 | <0.001 | 0.622 | 0.647 | 4 | 646.554 |
| 2-Back Correct Trials | 0.023 | 0.881 | 1 | 198.949 | 16.211 | <0.001 | 0.363 | 0.835 | 4 | 653.667 |
| 2-Back Correct Target Trials | 0.162 | 0.688 | 1 | 201.529 | 8.674 | <0.001 | 0.140 | 0.967 | 4 | 605.549 |
| 2-Back Correct Non-Target Trials | 0.046 | 0.830 | 1 | 196.271 | 18.693 | <0.001 | 0.369 | 0.831 | 4 | 650.948 |
| Effect of Treatment | Effect of Time | Treatment Time | Main Effect of Time & Interaction | |||||||
|---|---|---|---|---|---|---|---|---|---|---|
| F | p | Numerator df | Denominator df | F | p | F | p | Numerator df | Denominator df | |
| Accuracy | ||||||||||
| Proportion Correct Overall | 0.120 | 0.730 | 1 | 158.482 | 2.125 | 0.077 | 1.486 | 0.205 | 4 | 487.369 |
| Hit Rate | 0.014 | 0.905 | 1 | 153.627 | 1.756 | 0.137 | 1.642 | 0.162 | 4 | 463.622 |
| Commission Rate | 0.702 | 0.403 | 1 | 172.693 | 1.261 | 0.284 | 0.680 | 0.606 | 4 | 535.317 |
| Reaction Time | ||||||||||
| Mean Reaction Time Overall | 0.415 | 0.520 | 1 | 161.847 | 4.988 | <0.001 | 0.695 | 0.596 | 4 | 547.083 |
| Mean Hit Reaction Time | 0.371 | 0.543 | 1 | 161.681 | 5.180 | <0.001 | 0.664 | 0.617 | 4 | 547.055 |
| Mean Commission Reaction Time | 0.780 | 0.378 | 1 | 185.008 | 0.269 | 0.898 | 0.551 | 0.698 | 4 | 490.573 |
Disclaimer/Publisher’s Note: The statements, opinions and data contained in all publications are solely those of the individual author(s) and contributor(s) and not of MDPI and/or the editor(s). MDPI and/or the editor(s) disclaim responsibility for any injury to people or property resulting from any ideas, methods, instructions or products referred to in the content. |
© 2024 by the authors. Licensee MDPI, Basel, Switzerland. This article is an open access article distributed under the terms and conditions of the Creative Commons Attribution (CC BY) license (https://creativecommons.org/licenses/by/4.0/).
Share and Cite
Robinson, J.L.; Hunter, J.M.; Kern, M.; Rodas, M.; Jowers, J.; Robertson, J.; Wanalista, C. Whole Coffee Cherry Extract Improves Working Memory and Response Inhibition: Acute and Longitudinal Results from a Remote, Randomized, Double-Blind, Placebo-Controlled Clinical Trial. Nutrients 2024, 16, 2348. https://doi.org/10.3390/nu16142348
Robinson JL, Hunter JM, Kern M, Rodas M, Jowers J, Robertson J, Wanalista C. Whole Coffee Cherry Extract Improves Working Memory and Response Inhibition: Acute and Longitudinal Results from a Remote, Randomized, Double-Blind, Placebo-Controlled Clinical Trial. Nutrients. 2024; 16(14):2348. https://doi.org/10.3390/nu16142348
Chicago/Turabian StyleRobinson, Jennifer L., John M. Hunter, Megan Kern, Merlina Rodas, Jasmine Jowers, Jenna Robertson, and Caitlyn Wanalista. 2024. "Whole Coffee Cherry Extract Improves Working Memory and Response Inhibition: Acute and Longitudinal Results from a Remote, Randomized, Double-Blind, Placebo-Controlled Clinical Trial" Nutrients 16, no. 14: 2348. https://doi.org/10.3390/nu16142348
APA StyleRobinson, J. L., Hunter, J. M., Kern, M., Rodas, M., Jowers, J., Robertson, J., & Wanalista, C. (2024). Whole Coffee Cherry Extract Improves Working Memory and Response Inhibition: Acute and Longitudinal Results from a Remote, Randomized, Double-Blind, Placebo-Controlled Clinical Trial. Nutrients, 16(14), 2348. https://doi.org/10.3390/nu16142348


