
Body Mass Index Trends before and during the COVID-19 Pandemic in Primary School Students in Split-Dalmatia County, Croatia: A Retrospective Study

 , , ,
, , ,
Abstract
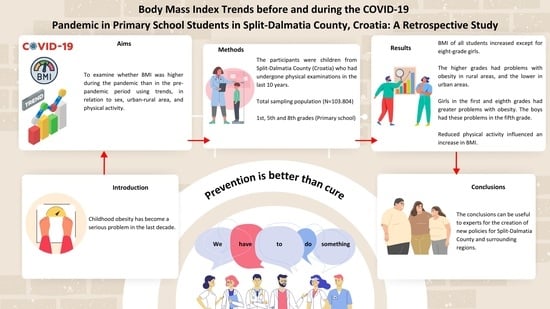
1. Introduction
2. Materials and Methods
2.1. Study Design
2.2. Participants
2.3. Data Collection and Description
2.4. Entry Variables
2.5. Statistical Analysis
3. Results
3.1. Comparing Pre-Pandemic (2012/2013–2019) and Pandemic Period (2020–2022) BMI
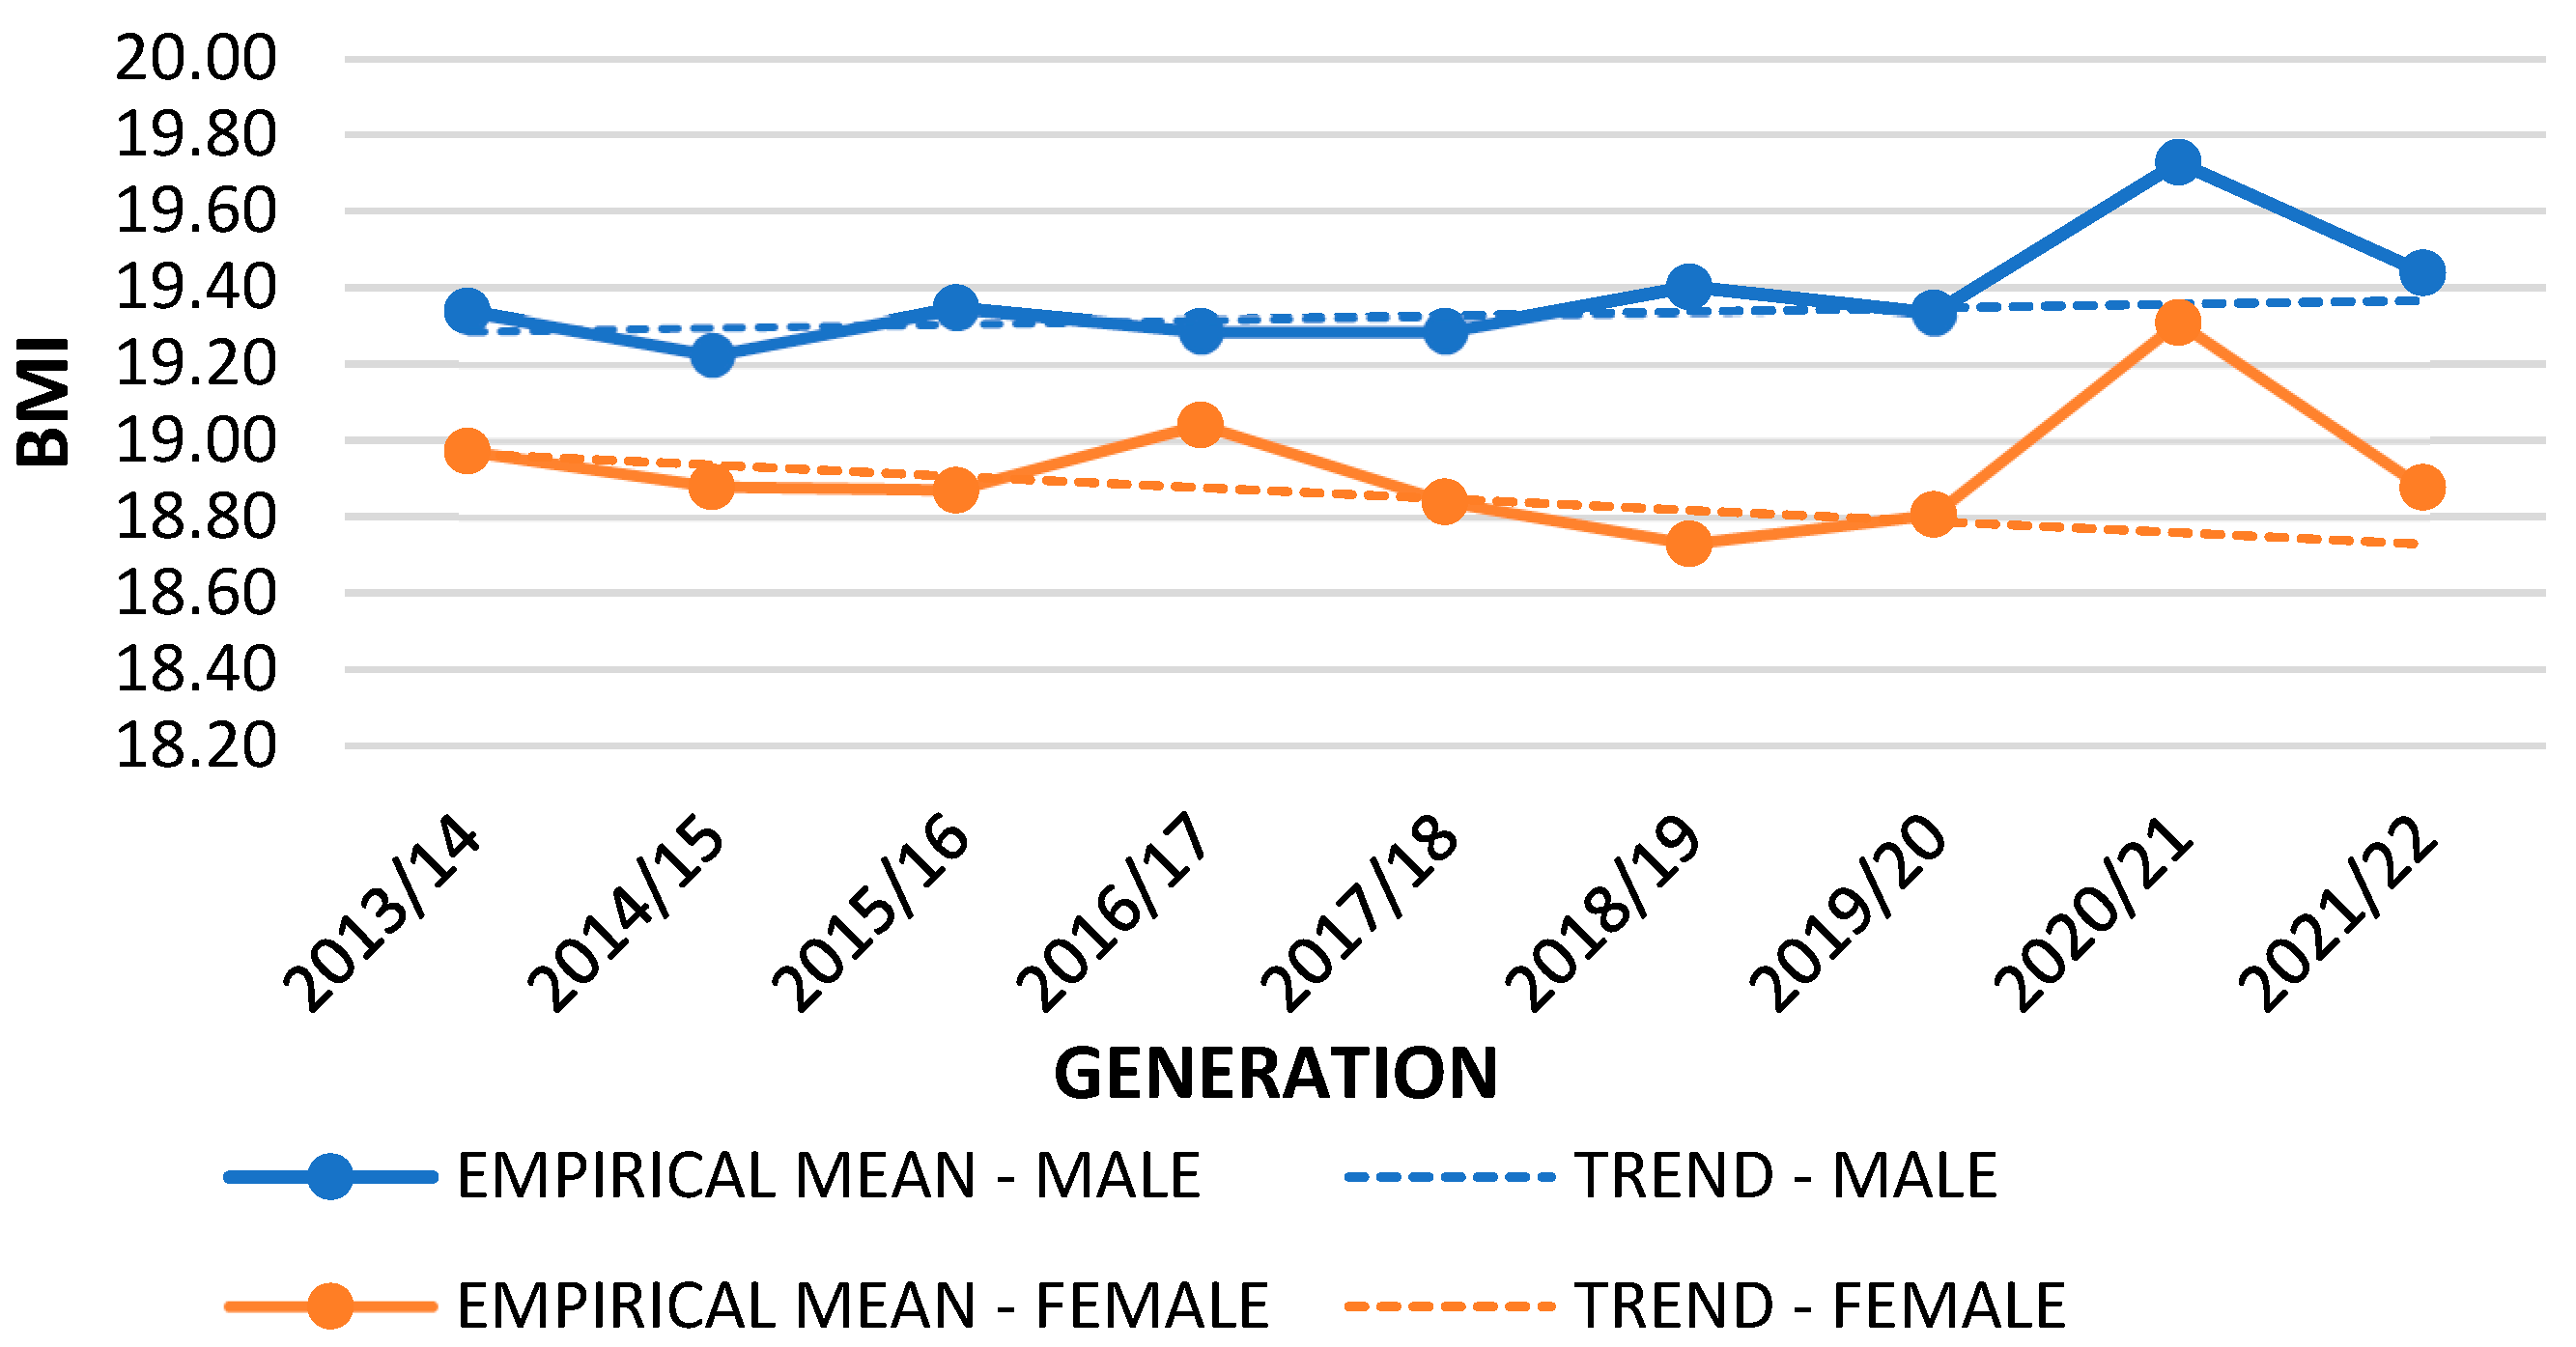
3.2. BMI Per Generations in the Last 10 Years
3.3. Urban–Rural and Sex Differences between BMI Categories
3.4. Differences between Physical Activity Status and BMI
4. Discussion
4.1. Trends in Mean BMI Values in the Pandemic Period Compared to the Pre-Pandemic Period
4.2. BMI Trends of Children in Split-Dalmatia County over a Period of 10 Years
4.3. Urban–Rural Differences in Relation to BMI Categories in Split-Dalmatia County in the Pre-Pandemic and Pandemic Periods
4.4. Sex Differences in Overweight and Obesity in Split-Dalmatia County in the Pre-Pandemic and Pandemic Periods
4.5. Physical Activity Status Differences in Relation to BMI in Split-Dalmatia County in the Pre-Pandemic and Pandemic Periods
4.6. Strengths and Limitations of the Study
4.7. Suggestions for Curbing the Prevalence of Overweight and Obesity
5. Conclusions
Supplementary Materials
Author Contributions
Funding
Institutional Review Board Statement
Informed Consent Statement
Data Availability Statement
Acknowledgments
Conflicts of Interest
References
- Coronado-Ferrer, S.; Ferrer-Sapena, A.; Aleixandre-Benavent, R.; Valderrama Zurián, J.C.; Cogollos, L.C. Global Trends in Scientific Research on Pediatric Obesity. Int. J. Environ. Res. Public Health 2022, 19, 1251. [Google Scholar] [CrossRef] [PubMed]
- Weihrauch-Blüher, S.; Wiegand, S. Risk Factors and Implications of Childhood Obesity. Curr. Obes. Rep. 2018, 7, 254–259. [Google Scholar] [CrossRef] [PubMed]
- Lee, E.Y.; Yoon, K.H. Epidemic obesity in children and adolescents: Risk factors and prevention. Front. Med. 2018, 12, 658–666. [Google Scholar] [CrossRef] [PubMed]
- Lanigan, J. Prevention of overweight and obesity in early life. Proc. Nutr. Soc. 2018, 77, 247–256. [Google Scholar] [CrossRef] [PubMed]
- Bučan Nenadić, D.; Kolak, E.; Selak, M.; Smoljo, M.; Radić, J.; Vučković, M.; Dropuljić, B.; Pijerov, T.; Babić Cikoš, D. Anthropometric Parameters and Mediterranean Diet Adherence in Preschool Children in Split-Dalmatia County, Croatia—Are They Related? Nutrients 2021, 13, 4252. [Google Scholar] [CrossRef] [PubMed]
- Garrido-Miguel, M.; Cavero-Redondo, I.; Álvarez-Bueno, C.; Rodríguez-Artalejo, F.; Moreno, L.A.; Ruiz, J.R.; Ahrens, W.; Martínez-Vizcaíno, V. Prevalence and Trends of Overweight and Obesity in European Children From 1999 to 2016: A Systematic Review and Meta-analysis. JAMA Pediatr. 2019, 173, e192430. [Google Scholar] [CrossRef] [PubMed]
- Nittari, G.; Scuri, S.; Petrelli, F.; Pirillo, I.; di Luca, N.M.; Grappasonni, I. Fighting obesity in children from European World Health Organization member states. Epidemiological data, medical-social aspects, and prevention programs. Clin. Ter. 2019, 170, e223–e230. [Google Scholar] [PubMed]
- Fang, K.; Mu, M.; Liu, K.; He, Y. Screen time and childhood overweight/obesity: A systematic review and meta-analysis. Child Care Health Dev. 2019, 45, 744–753. [Google Scholar] [CrossRef]
- Farpour-Lambert, N.J.; Baker, J.L.; Hassapidou, M.; Holm, J.C.; Nowicka, P.; O’Malley, G.; Weiss, R. Childhood Obesity Is a Chronic Disease Demanding Specific Health Care—A Position Statement from the Childhood Obesity Task Force (COTF) of the European Association for the Study of Obesity (EASO). Obes. Facts 2015, 8, 342–349. [Google Scholar] [CrossRef]
- Jabakhanji, S.B.; Boland, F.; Ward, M.; Biesma, R. Body Mass Index Changes in Early Childhood. J. Pediatr. 2018, 202, 106–114. [Google Scholar] [CrossRef]
- Halilagic, A.; Moschonis, G. The Effect of Growth Rate during Infancy on the Risk of Developing Obesity in Childhood: A Systematic Literature Review. Nutrients 2021, 13, 3449. [Google Scholar] [CrossRef] [PubMed]
- Xu, J.; Hardy, L.L.; Guo, C.Z.; Garnett, S.P. The trends and prevalence of obesity and morbid obesity among Australian school-aged children, 1985–2014. J. Paediatr. Child Health 2018, 54, 907–912. [Google Scholar] [CrossRef] [PubMed]
- Raufi, A.; Konstantinova, M.K. Prevalence of Overweight and Obesity in Children: Variation in Different Ethnicities, Age, and Sex in North Macedonia. Pril. Makedon. Akad. Nauk. Umet Odd. Med. Nauki 2022, 43, 23–31. [Google Scholar] [CrossRef] [PubMed]
- Shah, B.; Tombeau Cost, K.; Fuller, A.; Birken, C.S.; Anderson, L.N. Sex and gender differences in childhood obesity: Contributing to the research agenda. BMJ Nutr. Prev. Health 2020, 3, 387–390. [Google Scholar] [CrossRef] [PubMed]
- Musić Milanović, S.; Lang Morović, M.; Bukal, D.; Križan, H.; Buoncristiano, M.; Breda, J. Regional and sociodemographic determinants of the prevalence of overweight and obesity in children aged 7–9 years in Croatia. Acta Clin. Croat. 2020, 59, 303–311. [Google Scholar] [CrossRef] [PubMed]
- Kenđel Jovanović, G.; Dragaš Zubalj, N.; Klobučar Majanović, S.; Rahelić, D.; Rahelić, V.; Vučak Lončar, J.; Žeželj, S.P. The Outcome of COVID-19 Lockdown on Changes in Body Mass Index and Lifestyle among Croatian Schoolchildren: A Cross-Sectional Study. Nutrients 2021, 13, 3788. [Google Scholar] [CrossRef] [PubMed]
- Ujević, T.; Sporis, G.; Milanović, Z.; Pantelić, S.; Neljak, B. Differences between health-related physical fitness profiles of Croatian children in urban and rural areas. Coll. Antropol. 2013, 37, 75–80. [Google Scholar]
- Parrino, C.; Rossetti, P.; Baratta, R.; La Spina, N.; La Delfa, L.; Squatrito, S.; Vigneri, R.; Frittitta, L. Secular trends in the prevalence of overweight and obesity in Sicilian schoolchildren aged 11–13 years during the last decade. PLoS ONE 2012, 7, e34551. [Google Scholar] [CrossRef]
- Johnson, J.A.; Johnson, A.M. Urban-rural differences in childhood and adolescent obesity in the United States: A systematic review and meta-analysis. Child Obes. 2015, 11, 233–241. [Google Scholar] [CrossRef]
- Flattum, C.; Friend, S.; Horning, M.; Lindberg, R.; Beaudette, J.; Fulkerson, J.A. Family-focused obesity prevention program implementation in urban versus rural communities: A case study. BMC Public Health 2021, 21, 1915. [Google Scholar] [CrossRef]
- Cucinotta, D.; Vanelli, M. WHO Declares COVID-19 a Pandemic. Acta Bio-Med. Atenei Parm. 2020, 91, 157–160. [Google Scholar]
- Brooks, C.G.; Spencer, J.R.; Sprafka, J.M.; Roehl, K.A.; Ma, J.; Londhe, A.A.; He, F.; Cheng, A.; Brown, C.A.; Page, J. Pediatric BMI changes during COVID-19 pandemic: An electronic health record-based retrospective cohort study. eClinicalMedicine 2021, 38, 101026. [Google Scholar] [CrossRef] [PubMed]
- Chang, T.H.; Chen, Y.C.; Chen, W.Y.; Chen, C.Y.; Hsu, W.Y.; Chou, Y.; Chang, Y.-H. Weight Gain Associated with COVID-19 Lockdown in Children and Adolescents: A Systematic Review and Meta-Analysis. Nutrients 2021, 13, 3668. [Google Scholar] [CrossRef] [PubMed]
- Flaxman, S.; Mishra, S.; Gandy, A.; Unwin, H.J.T.; Mellan, T.A.; Coupland, H.; Whittaker, C.; Zhu, H.; Berah, T.; Eaton, J.W.; et al. Estimating the effects of non-pharmaceutical interventions on COVID-19 in Europe. Nature 2020, 584, 257–261. [Google Scholar] [CrossRef] [PubMed]
- Kalanj, K.; Marshall, R.; Karol, K.; Tiljak, M.K.; Orešković, S. The Impact of COVID-19 on Hospital Admissions in Croatia. Front. Public Health 2021, 9, 720948. [Google Scholar] [CrossRef] [PubMed]
- Croatian Government. Official Website of the Government for the Timely and Accurate Information about Coronavirus. Zagreb. 2023. Available online: https://www.koronavirus.hr/rezultati-pretrazivanja/20?q=online+nastava (accessed on 15 August 2023).
- Maggio, A.B.R.; Gal-Dudding, C.; Martin, X.; Chamay-Weber, C. Evaluation of the impact of the COVID-19 lockdown on BMI in children and adolescents with or without obesity. BMC Pediatr. 2022, 22, 509. [Google Scholar] [CrossRef]
- Jebeile, H.; Kelly, A.S.; O’Malley, G.; Baur, L.A. Obesity in children and adolescents: Epidemiology, causes, assessment, and management. Lancet Diabetes Endocrinol. 2022, 10, 351–365. [Google Scholar] [CrossRef]
- Filip, R.; Anchidin-Norocel, L.; Gheorghita, R.; Savage, W.K.; Dimian, M. Changes in Dietary Patterns and Clinical Health Outcomes in Different Countries during the SARS-CoV-2 Pandemic. Nutrients 2021, 13, 3612. [Google Scholar] [CrossRef]
- Vogel, M.; Geserick, M.; Gausche, R.; Beger, C.; Poulain, T.; Meigen, C.; Körner, A.; Keller, E.; Kiess, W.; Pfäffle, R. Age- and weight group-specific weight gain patterns in children and adolescents during the 15 years before and during the COVID-19 pandemic. Int. J. Obes. 2022, 46, 144–152. [Google Scholar] [CrossRef]
- Cole, T.J. The LMS method for constructing normalized growth standards. Eur. J. Clin. Nutr. 1990, 44, 45–60. [Google Scholar]
- Birch, L.; Perry, R.; Hunt, L.P.; Matson, R.; Chong, A.; Beynon, R.; Shield, J.P. What change in body mass index is associated with improvement in percentage body fat in childhood obesity? A meta-regression. BMJ Open 2019, 9, e028231. [Google Scholar] [CrossRef] [PubMed]
- Androutsos, O.; Perperidi, M.; Georgiou, C.; Chouliaras, G. Lifestyle Changes and Determinants of Children’s and Adolescents’ Body Weight Increase during the First COVID-19 Lockdown in Greece: The COV-EAT Study. Nutrients 2021, 13, 930. [Google Scholar] [CrossRef] [PubMed]
- Łuszczki, E.; Bartosiewicz, A.; Pezdan-Śliż, I.; Kuchciak, M.; Jagielski, P.; Oleksy, Ł.; Stolarczyk, A.; Dereń, K. Children’s Eating Habits, Physical Activity, Sleep, and Media Usage before and during COVID-19 Pandemic in Poland. Nutrients 2021, 13, 2447. [Google Scholar] [CrossRef] [PubMed]
- Stavridou, A.; Kapsali, E.; Panagouli, E.; Thirios, A.; Polychronis, K.; Bacopoulou, F.; Psaltopoulou, T.; Tsolia, M.; Sergentanis, T.N.; Tsitsika, A. Obesity in Children and Adolescents during COVID-19 Pandemic. Children 2021, 8, 135. [Google Scholar] [CrossRef] [PubMed]
- Ventura, P.S.; Ortigoza, A.F.; Castillo, Y.; Bosch, Z.; Casals, S.; Girbau, C.; Siurana, J.M.; Arce, A.; Torres, M.; Herrero, F.J. Children’s Health Habits and COVID-19 Lockdown in Catalonia: Implications for Obesity and Non-Communicable Diseases. Nutrients 2021, 13, 1657. [Google Scholar] [CrossRef] [PubMed]
- Sekulic, D.; Blazevic, M.; Gilic, B.; Kvesic, I.; Zenic, N. Prospective Analysis of Levels and Correlates of Physical Activity during COVID-19 Pandemic and Imposed Rules of Social Distancing; Gender Specific Study among Adolescents from Southern Croatia. Sustainability 2020, 12, 4072. [Google Scholar] [CrossRef]
- Pedišić, Ž.; Strika, M.; Matolić, T.; Sorić, M.; Šalaj, S.; Dujić, I.; Rakovac, M.; Radičević, B.; Podnar, H.; Greblo Jurakić, Z.; et al. Physical Activity of Children and Adolescents in Croatia: A Global Matrix 4.0 Systematic Review of Its Prevalence and Associated Personal, Social, Environmental, and Policy Factors. J. Phys. Act. Health 2023, 20, 487–499. [Google Scholar] [CrossRef]
- Palermi, S.; Vecchiato, M.; Pennella, S.; Marasca, A.; Spinelli, A.; De Luca, M.; De Martino, L.; Fernando, F.; Sirico, F.; Biffi, A. The Impact of the COVID-19 Pandemic on Childhood Obesity and Lifestyle—A Report from Italy. Pediatr. Rep. 2022, 14, 410–418. [Google Scholar] [CrossRef]
- Khanna, D.; Peltzer, C.; Kahar, P.; Parmar, M.S. Body Mass Index (BMI): A Screening Tool Analysis. Cureus 2022, 14, e22119. [Google Scholar] [CrossRef]
- Oniszczenko, W.; Stanisławiak, E. Association between sex and body mass index as mediated by temperament in a nonclinical adult sample. Eat Weight Disord. 2019, 24, 291–298. [Google Scholar] [CrossRef]
- Kumar, S.; Kelly, A.S. Review of Childhood Obesity: From Epidemiology, Etiology, and Comorbidities to Clinical Assessment and Treatment. Mayo Clin. Proc. 2017, 92, 251–265. [Google Scholar] [CrossRef] [PubMed]
- Agha, M.; Agha, R. The rising prevalence of obesity: Part A: Impact on public health. Int. J. Surg. Oncol. 2017, 2, e17. [Google Scholar] [CrossRef] [PubMed]
- Juresa, V.; Musil, V.; Tiljak, M.K. Growth charts for Croatian school children and secular trends in past twenty years. Coll. Antropol. 2012, 36 (Suppl. 1), 47–57. [Google Scholar] [CrossRef] [PubMed]
- Nacionalni Program Športa 2019–2026. Narodne Novine. 2019. Available online: https://narodne-novine.nn.hr/clanci/sluzbeni/2019_07_69_1394.html (accessed on 15 August 2023).
- Musić Milanović, S.; Lang Morović, M.; Križan, H. European Childhood Obesity Initiative, Croatia 2018/2019 (CroCOSI); Croatian Institute of Public Health: Zagreb, Croatia, 2021. [Google Scholar]
- Musić Milanović, S.; Lang Morović, M.; Markelić, M. Childhood Obesity Surveillance Initiative, Croatia 2015/2016 (CroCOSI); Croatian Institute of Public Health: Zagreb, Croatia, 2018. [Google Scholar]
- Jovančević, M.; Šakić, D.; Školnik-Popović, V.; Armano, G.; Oković, S. Results of body mass index measurements in children between 2 and 8 years of age in the Republic of Croatia. Paediatr. Croat. 2019, 63, 95–98. [Google Scholar]
- Jarnig, G.; Jaunig, J.; Kerbl, R.; Strenger, V.; Haeusler, G.; van Poppel, M.N.M. Acceleration in BMI gain following COVID-19 restrictions. A longitudinal study with 7- to 10-year-old primary school children. Pediatr. Obes. 2022, 17, e12890. [Google Scholar] [CrossRef] [PubMed]
- Weaver, R.G.; Hunt, E.T.; Armstrong, B.; Beets, M.W.; Brazendale, K.; Turner-McGrievy, G.; Pate, R.R.; Youngstedt, S.D.; Dugger, R.; Parker, H.; et al. COVID-19 Leads to Accelerated Increases in Children’s BMI z-Score Gain: An Interrupted Time-Series Study. Am. J. Prev. Med. 2021, 61, e161–e169. [Google Scholar] [CrossRef] [PubMed]
- Yang, Z.; Phung, H.; Hughes, A.M.; Sherwood, S.; Harper, E.; Kelly, P. Trends in overweight and obesity by socioeconomic status in Year 6 school children, Australian Capital Territory, 2006–2018. BMC Public Health 2019, 19, 1512. [Google Scholar] [CrossRef]
- Knapp, E.A.; Dong, Y.; Dunlop, A.L.; Aschner, J.L.; Stanford, J.B.; Hartert, T.; Teitelbaum, S.L.; Hudak, M.L.; Carroll, K.; O’connor, T.G.; et al. Changes in BMI During the COVID-19 Pandemic. Pediatrics 2022, 150, e2022056552. [Google Scholar] [CrossRef]
- Shakir, R.N.; Coates, A.M.; Olds, T.; Rowlands, A.; Tsiros, M.D. Not all sedentary behaviour is equal: Children’s adiposity and sedentary behaviour volumes, patterns and types. Obes. Res. Clin. Pract. 2018, 12, 506–512. [Google Scholar] [CrossRef]
- Stroebele, N.; McNally, J.; Plog, A.; Siegfried, S.; Hill, J.O. The association of self-reported sleep, weight status, and academic performance in fifth-grade students. J. Sch. Health 2013, 83, 77–84. [Google Scholar] [CrossRef]
- Chaput, J.P.; Tremblay, M.S.; Katzmarzyk, P.T.; Fogelholm, M.; Hu, G.; Maher, C.; Maia, J.; Olds, T.; Onywera, V.; Sarmiento, O.L.; et al. Sleep patterns and sugar-sweetened beverage consumption among children from around the world. Public Health Nutr. 2018, 21, 2385–2393. [Google Scholar] [CrossRef] [PubMed]
- Yılmaz, E.; Griffiths, M.D.; Kan, A. Development and Validation of Videogame Addiction Scale for Children (VASC). Int. J. Ment. Health Addict. 2017, 15, 869–882. [Google Scholar] [CrossRef] [PubMed]
- Koronavirus—Najnovije Preporuke. Hrvatski Zavod za Javno Zdravstvo. Available online: https://www.hzjz.hr/sluzba-epidemiologija-zarazne-bolesti/koronavirus-najnovije-preporuke/#gospodarstvo (accessed on 22 August 2023).
- Žuljević, M.F.; Jeličić, K.; Viđak, M.; Đogaš, V.; Buljan, I. Impact of the first COVID-19 lockdown on study satisfaction and burnout in medical students in Split, Croatia: A cross-sectional presurvey and postsurvey. BMJ Open 2021, 11, e049590. [Google Scholar] [CrossRef] [PubMed]
- Sigmund, E.; Sigmundová, D.; Badura, P.; Kalman, M.; Hamrik, Z.; Pavelka, J. Temporal Trends in Overweight and Obesity, Physical Activity and Screen Time among Czech Adolescents from 2002 to 2014: A National Health Behaviour in School-Aged Children Study. Int. J. Environ. Res. Public Health 2015, 12, 11848–11868. [Google Scholar] [CrossRef] [PubMed]
- Pavić Šimetin, I.; Žehaček Živković, M.; Belavić, A.; Ištvanović, A.; Mayer, D.; Musić Milanović, S.; Pejnović Franelić, I. Istraživanje o Zdravstvenom Ponašanju Djece, Health Behaviour in School-Aged Children—HBSC 2017/2018; Capak, K., Kaić-Rak, A., Eds.; Croatian Institute of Public Health: Zagreb, Croatia, 2020. [Google Scholar]
- Downing, K.L.; Hinkley, T.; Salmon, J.; Hnatiuk, J.A.; Hesketh, K.D. Do the correlates of screen time and sedentary time differ in preschool children? BMC Public Health 2017, 17, 285. [Google Scholar]
- Jones, R.A.; Hinkley, T.; Okely, A.D.; Salmon, J. Tracking physical activity and sedentary behavior in childhood: A systematic review. Am. J. Prev. Med. 2013, 44, 651–658. [Google Scholar] [CrossRef] [PubMed]
- Skoko, B.; Gluvačević, D.; Bogdanić, A. Croatia as a Sports Brand—Recognition of Croatian Sport and Athletes Among European Students. Commun. Manag. Rev. 2020, 5, 6–25. [Google Scholar] [CrossRef]
- Maffulli, N. At what age should a child begin regular continuous exercise at moderate or high intensity? West J. Med. 2000, 172, 413. [Google Scholar] [CrossRef][Green Version]
- Što Hrvatskom Sportu Donosi Novi “Suživot” s Turizmom? 18 July 2020. Available online: https://totalinfo.hr/otkrivamo-sto-hrvatskom-sportu-donosi-novi-suzivot-s-turizmom/ (accessed on 15 August 2023).
- Mendo-Lázaro, S.; Polo-Del-Río, M.I.; Amado-Alonso, D.; Iglesias-Gallego, D.; León-Del-Barco, B. Self-Concept in Childhood: The Role of Body Image and Sport Practice. Front. Psychol. 2017, 8, 853. [Google Scholar] [CrossRef]
- Navarro-Patón, R.; Mecías-Calvo, M.; Pueyo Villa, S.; Anaya, V.; Martí-González, M.; Lago-Ballesteros, J. Perceptions of the Body and Body Dissatisfaction in Primary Education Children According to Gender and Age. A Cross-Sectional Study. Int. J. Environ. Res. Public Health 2021, 18, 12460. [Google Scholar] [CrossRef]
- Hallal, P.C.; Andersen, L.B.; Bull, F.C.; Guthold, R.; Haskell, W.; Ekelund, U. Global physical activity levels: Surveillance progress, pitfalls, and prospects. Lancet 2012, 380, 247–257. [Google Scholar] [CrossRef] [PubMed]
- Bacil, E.D.A.; Mazzardo Júnior, O.; Rech, C.R.; Legnani, R.F.d.S.; de Campos, W. Physical activity and biological maturation: A systematic review. Rev. Paul Pediatr. Org. Soc. Pediatr. Sao Paulo 2015, 33, 114–121. [Google Scholar] [CrossRef] [PubMed]
- Loomba-Albrecht, L.A.; Styne, D.M. Effect of puberty on body composition. Curr. Opin. Endocrinol. Diabetes Obes. 2009, 16, 10–15. [Google Scholar] [CrossRef] [PubMed]
- Corr, M.; McSharry, J.; Murtagh, E.M. Adolescent Girls’ Perceptions of Physical Activity: A Systematic Review of Qualitative Studies. Am. J. Health Promot. 2019, 33, 806–819. [Google Scholar] [CrossRef] [PubMed]
- Eriksson, K.; Strimling, P. Gender differences in competitiveness and fear of failure help explain why girls have lower life satisfaction than boys in gender equal countries. Front. Psychol. 2023, 14, 1131837. [Google Scholar] [CrossRef]
- Sila, S.; Pavić, A.M.; Hojsak, I.; Ilić, A.; Pavić, I.; Kolaček, S. Comparison of Obesity Prevalence and Dietary Intake in School-Aged Children Living in Rural and Urban Area of Croatia. Prev. Nutr. Food Sci. 2018, 23, 282–287. [Google Scholar] [CrossRef]
- Contreras, D.A.; Martoccio, T.L.; Brophy-Herb, H.E.; Horodynski, M.; Peterson, K.E.; Miller, A.L.; Senehi, N.; Sturza, J.; Kaciroti, N.; Lumeng, J.C. Rural-urban differences in body mass index and obesity-related behaviors among low-income preschoolers. J. Public Health 2021, 43, e637–e644. [Google Scholar] [CrossRef]
- Badrić, M.; Prskalo, I. Participiranje tjelesne aktivnosti u slobodnom vremenu djece i mladih. Napredak 2011, 152, 479–494. [Google Scholar]
- Greco, E.; Meo, F.; Cedrone, F. Gender differences in childhood bmi z-score, alimentary behaviour and lifestyle in a sample of 9–11 children. Clin. Ter. 2020, 171, e425–e430. [Google Scholar]
- Qiu, N.; He, H.; Qiao, L.; Ding, Y.; Ji, S.; Guo, X.; Luo, J.; Luo, Z.; Li, Y.; Pang, H.; et al. Sex differences in changes in BMI and blood pressure in Chinese school-aged children during the COVID-19 quarantine. Int. J. Obes. 2021, 45, 2132–2136. [Google Scholar] [CrossRef]
- Mulugeta, W.; Hoque, L. Impact of the COVID-19 lockdown on weight status and associated factors for obesity among children in Massachusetts. Obes. Med. 2021, 22, 100325. [Google Scholar] [CrossRef] [PubMed]
- Boxberger, K.; Reimers, A.K. Parental Correlates of Outdoor Play in Boys and Girls Aged 0 to 12—A Systematic Review. Int. J. Environ. Res. Public Health 2019, 16, 190. [Google Scholar] [CrossRef] [PubMed]
- Council conclusions on the promotion of motor skills, physical and sport activities for children. Off. J. Eur. Union 2015, C417, 46–51.
- WHO. European Childhood Obesity Surveillance Initiative (COSI): Report on the Fourth Round of Data Collection, 2015–2017; WHO Regional Office for Europe: Copenhagen, Denmark, 2021. [Google Scholar]
- Europski Tjedan Mentalnog Zdravlja 2023. Novi CroCOSI Podaci Pokazuju Kako je Pandemija COVID-a Utjecala na Zdravlje i Navike Djece u Hrvatskoj. Hrvatski Zavod za Javno Zdravstvo. 2023. Available online: https://www.hzjz.hr/sluzba-promicanje-zdravlja/europski-tjedan-mentalnog-zdravlja-2023-novi-crocosi-podaci-pokazuju-kako-je-pandemija-COVID-a-utjecala-na-zdravlje-i-navike-djece-u-hrvatskoj/ (accessed on 10 December 2023).
- Physical Activity Factsheet—Croatia 2021. World Health Organization. 2021. Available online: https://cdn.who.int/media/docs/librariesprovider2/country-sites/physical-activity-factsheet---croatia-2021.pdf?sfvrsn=7468d668_1&download=true (accessed on 10 December 2023).


| Variable | |
|---|---|
| BMI | (means ± SD) |
| BMI total | 18.730 ± 3.711 |
| BMI pre-pandemic | 18.716 ± 3.678 |
| BMI during pandemic | 18.788 ± 3.843 |
| Sex | n (%) |
| Boys | 52,123 (50.2) |
| Girls | 51,681 (49.8) |
| Age group (years) | n (%) |
| 1st grade (5.9–7.3) | 36,361 (35.0) |
| 5th grade (10.4–12.0) | 29,950 (28.9) |
| 8th grade (13.4–15.0) | 37,493 (36.1) |
| Area of residence * | n (%) |
| Urban | 69,437 (66.9) |
| Rural | 34,367 (33.1) |
| BMI categories | n (%) |
| Underweight | 3006 (2.9) |
| Healthy weight | 68,870 (66.3) |
| Overweight | 17,610 (17.0) |
| Obesity | 14,318 (13.8) |
| Physical activity status | n (%) |
| Inactive | 40,297 (51.7) |
| Irregularly active | 2917 (3.7) |
| Active | 34,793 (44.6) |
| Sex | Generation | Empirical Mean | Trend Mean | N | df | t-Test | p | |
|---|---|---|---|---|---|---|---|---|
| 1st | Boys | 2020/2021 | 16.16 | 16.03 | 1888 | 3774 | 1.66 | 0.048 |
| 2021/2022 | 16.36 | 15.98 | 1949 | 3896 | 4.98 | <0.001 | ||
| Girls | 2020/2021 | 16.03 | 15.89 | 1839 | 3676 | 1.79 | 0.037 | |
| 2021/2022 | 16.25 | 15.85 | 1809 | 3616 | 5.02 | <0.001 | ||
| 5th | Boys | 2020/2021 | 19.73 | 19.36 | 1057 | 2112 | 2.29 | 0.011 |
| 2021/2022 | 19.44 | 19.37 | 1582 | 3162 | 0.00 | 0.050 | ||
| Girls | 2020/2021 | 19.31 | 18.76 | 973 | 1944 | 3.29 | <0.001 | |
| 2021/2022 | 18.88 | 18.73 | 1613 | 3224 | 1.24 | 0.108 | ||
| 8th | Boys | 2020/2021 | 21.11 | 20.88 | 1902 | 3802 | 1.91 | 0.028 |
| 2021/2022 | 20.93 | 20.92 | 1797 | 3592 | 0.10 | 0.460 | ||
| Girls | 2020/2021 | 20.97 | 21.30 | 1881 | 3760 | −3.02 | <0.001 | |
| 2021/2022 | 21.02 | 21.37 | 1953 | 3904 | −2.98 | <0.001 |
| Effect | df | F | p | |
|---|---|---|---|---|
| 1st | Intercept | 1 | 1,925,332.90 | <0.001 |
| Sex | 1 | 52.471 | <0.001 | |
| Generation | 8 | 11.831 | <0.001 | |
| Sex × Generation | 8 | 0.383 | 0.930 | |
| 5th | Intercept | 1 | 889,687.23 | <0.001 |
| Sex | 1 | 124.121 | <0.001 | |
| Generation | 8 | 3.977 | <0.001 | |
| Sex × Generation | 8 | 1.210 | 0.288 | |
| 8th | Intercept | 1 | 1,291,463.00 | <0.001 |
| Sex | 1 | 47.008 | <0.001 | |
| Generation | 9 | 5.764 | <0.001 | |
| Sex × Generation | 9 | 2.580 | 0.006 |
| Pre-Pandemic | During Pandemic | ||||||
|---|---|---|---|---|---|---|---|
| χ2 | df | p | χ2 | df | p | ||
| 1st | Urban–rural | 45.649 | 3 | <0.001 | 38.093 | 3 | <0.001 |
| 5th | 24.496 | 3 | <0.001 | 6.290 | 3 | 0.098 | |
| 8th | 19.038 | 3 | <0.001 | 14.686 | 3 | 0.002 | |
| 1st | Sex | 67.339 | 3 | <0.001 | 18.214 | 3 | <0.001 |
| 5th | 58.231 | 3 | <0.001 | 14.557 | 3 | 0.002 | |
| 8th | 89.186 | 3 | <0.001 | 1.960 | 3 | 0.581 | |
| Pre-Pandemic | During Pandemic | |||||
|---|---|---|---|---|---|---|
| df | F | p | df | F | p | |
| 1st | 2 | 3.409 | 0.033 | 2 | 1.056 | 0.348 |
| 5th | 2 | 19.057 | <0.001 | 2 | 4.683 | 0.009 |
| 8th | 2 | 28.851 | <0.001 | 2 | 4.268 | 0.014 |
Disclaimer/Publisher’s Note: The statements, opinions and data contained in all publications are solely those of the individual author(s) and contributor(s) and not of MDPI and/or the editor(s). MDPI and/or the editor(s) disclaim responsibility for any injury to people or property resulting from any ideas, methods, instructions or products referred to in the content. |
© 2023 by the authors. Licensee MDPI, Basel, Switzerland. This article is an open access article distributed under the terms and conditions of the Creative Commons Attribution (CC BY) license (https://creativecommons.org/licenses/by/4.0/).
Share and Cite
Androja, L.; Bavčević, T.; Jurčev Savičević, A.; Bavčević, D.; Ninčević, J.; Buljan, A.; Nonković, D.; Rodrigues, V.; Karin, Ž. Body Mass Index Trends before and during the COVID-19 Pandemic in Primary School Students in Split-Dalmatia County, Croatia: A Retrospective Study. Nutrients 2024, 16, 50. https://doi.org/10.3390/nu16010050
Androja L, Bavčević T, Jurčev Savičević A, Bavčević D, Ninčević J, Buljan A, Nonković D, Rodrigues V, Karin Ž. Body Mass Index Trends before and during the COVID-19 Pandemic in Primary School Students in Split-Dalmatia County, Croatia: A Retrospective Study. Nutrients. 2024; 16(1):50. https://doi.org/10.3390/nu16010050
Chicago/Turabian StyleAndroja, Luka, Tonči Bavčević, Anamarija Jurčev Savičević, Damir Bavčević, Jasna Ninčević, Anita Buljan, Diana Nonković, Vitor Rodrigues, and Željka Karin. 2024. "Body Mass Index Trends before and during the COVID-19 Pandemic in Primary School Students in Split-Dalmatia County, Croatia: A Retrospective Study" Nutrients 16, no. 1: 50. https://doi.org/10.3390/nu16010050
APA StyleAndroja, L., Bavčević, T., Jurčev Savičević, A., Bavčević, D., Ninčević, J., Buljan, A., Nonković, D., Rodrigues, V., & Karin, Ž. (2024). Body Mass Index Trends before and during the COVID-19 Pandemic in Primary School Students in Split-Dalmatia County, Croatia: A Retrospective Study. Nutrients, 16(1), 50. https://doi.org/10.3390/nu16010050