
Age-Dependent Effect of Calcitriol on Mouse Regulatory T and B Lymphocytes
 and
and
Abstract
:1. Introduction
2. Materials and Methods
2.1. Mice
2.2. Design of the Experiment
2.3. Tissue Preparation
2.4. Blood Morphological Parameter Analysis
2.5. ELISA Tests
2.6. Flow Cytometry Analyses
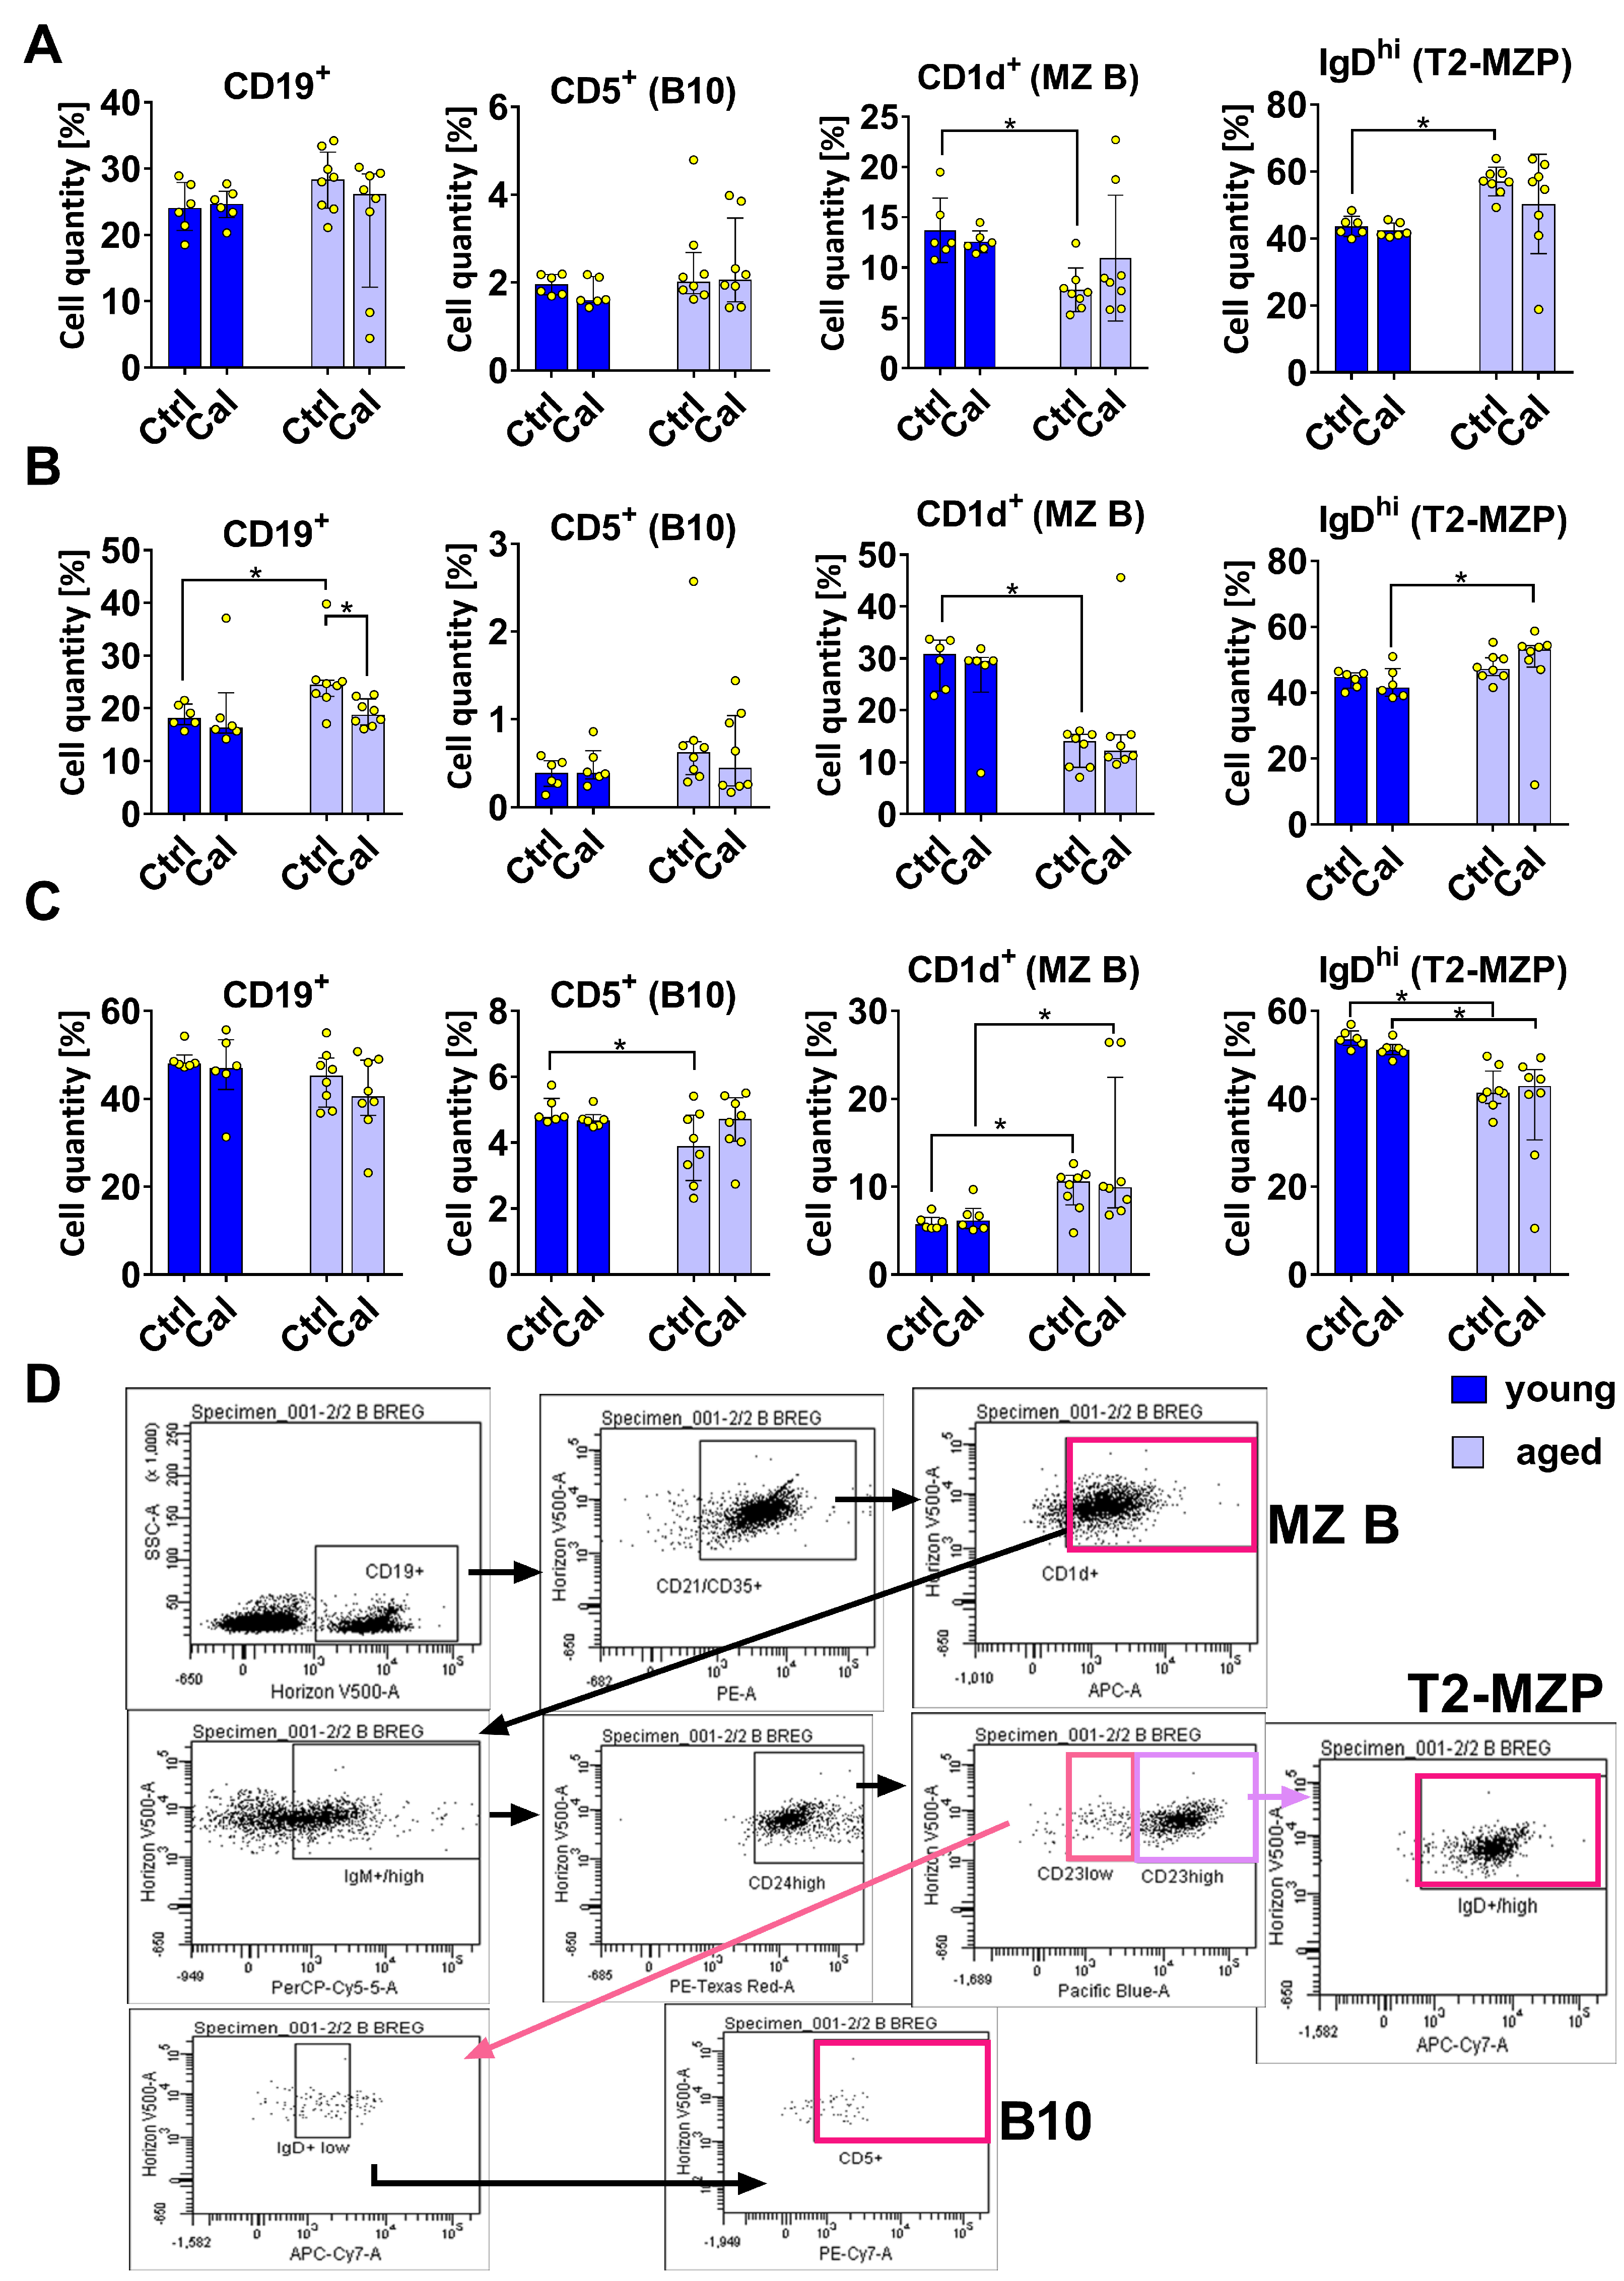
- MZB cells: CD19+ CD21/CD35+ CD1d+
- T2-MZP cells: CD19+ CD21/CD35+ CD1d+ IgMhi CD24hi CD23hi IgDhi
- B10 cells: CD19+ CD21/CD35+ CD1d+ IgMhi CD24hi CD23lo IgDlo CD5+
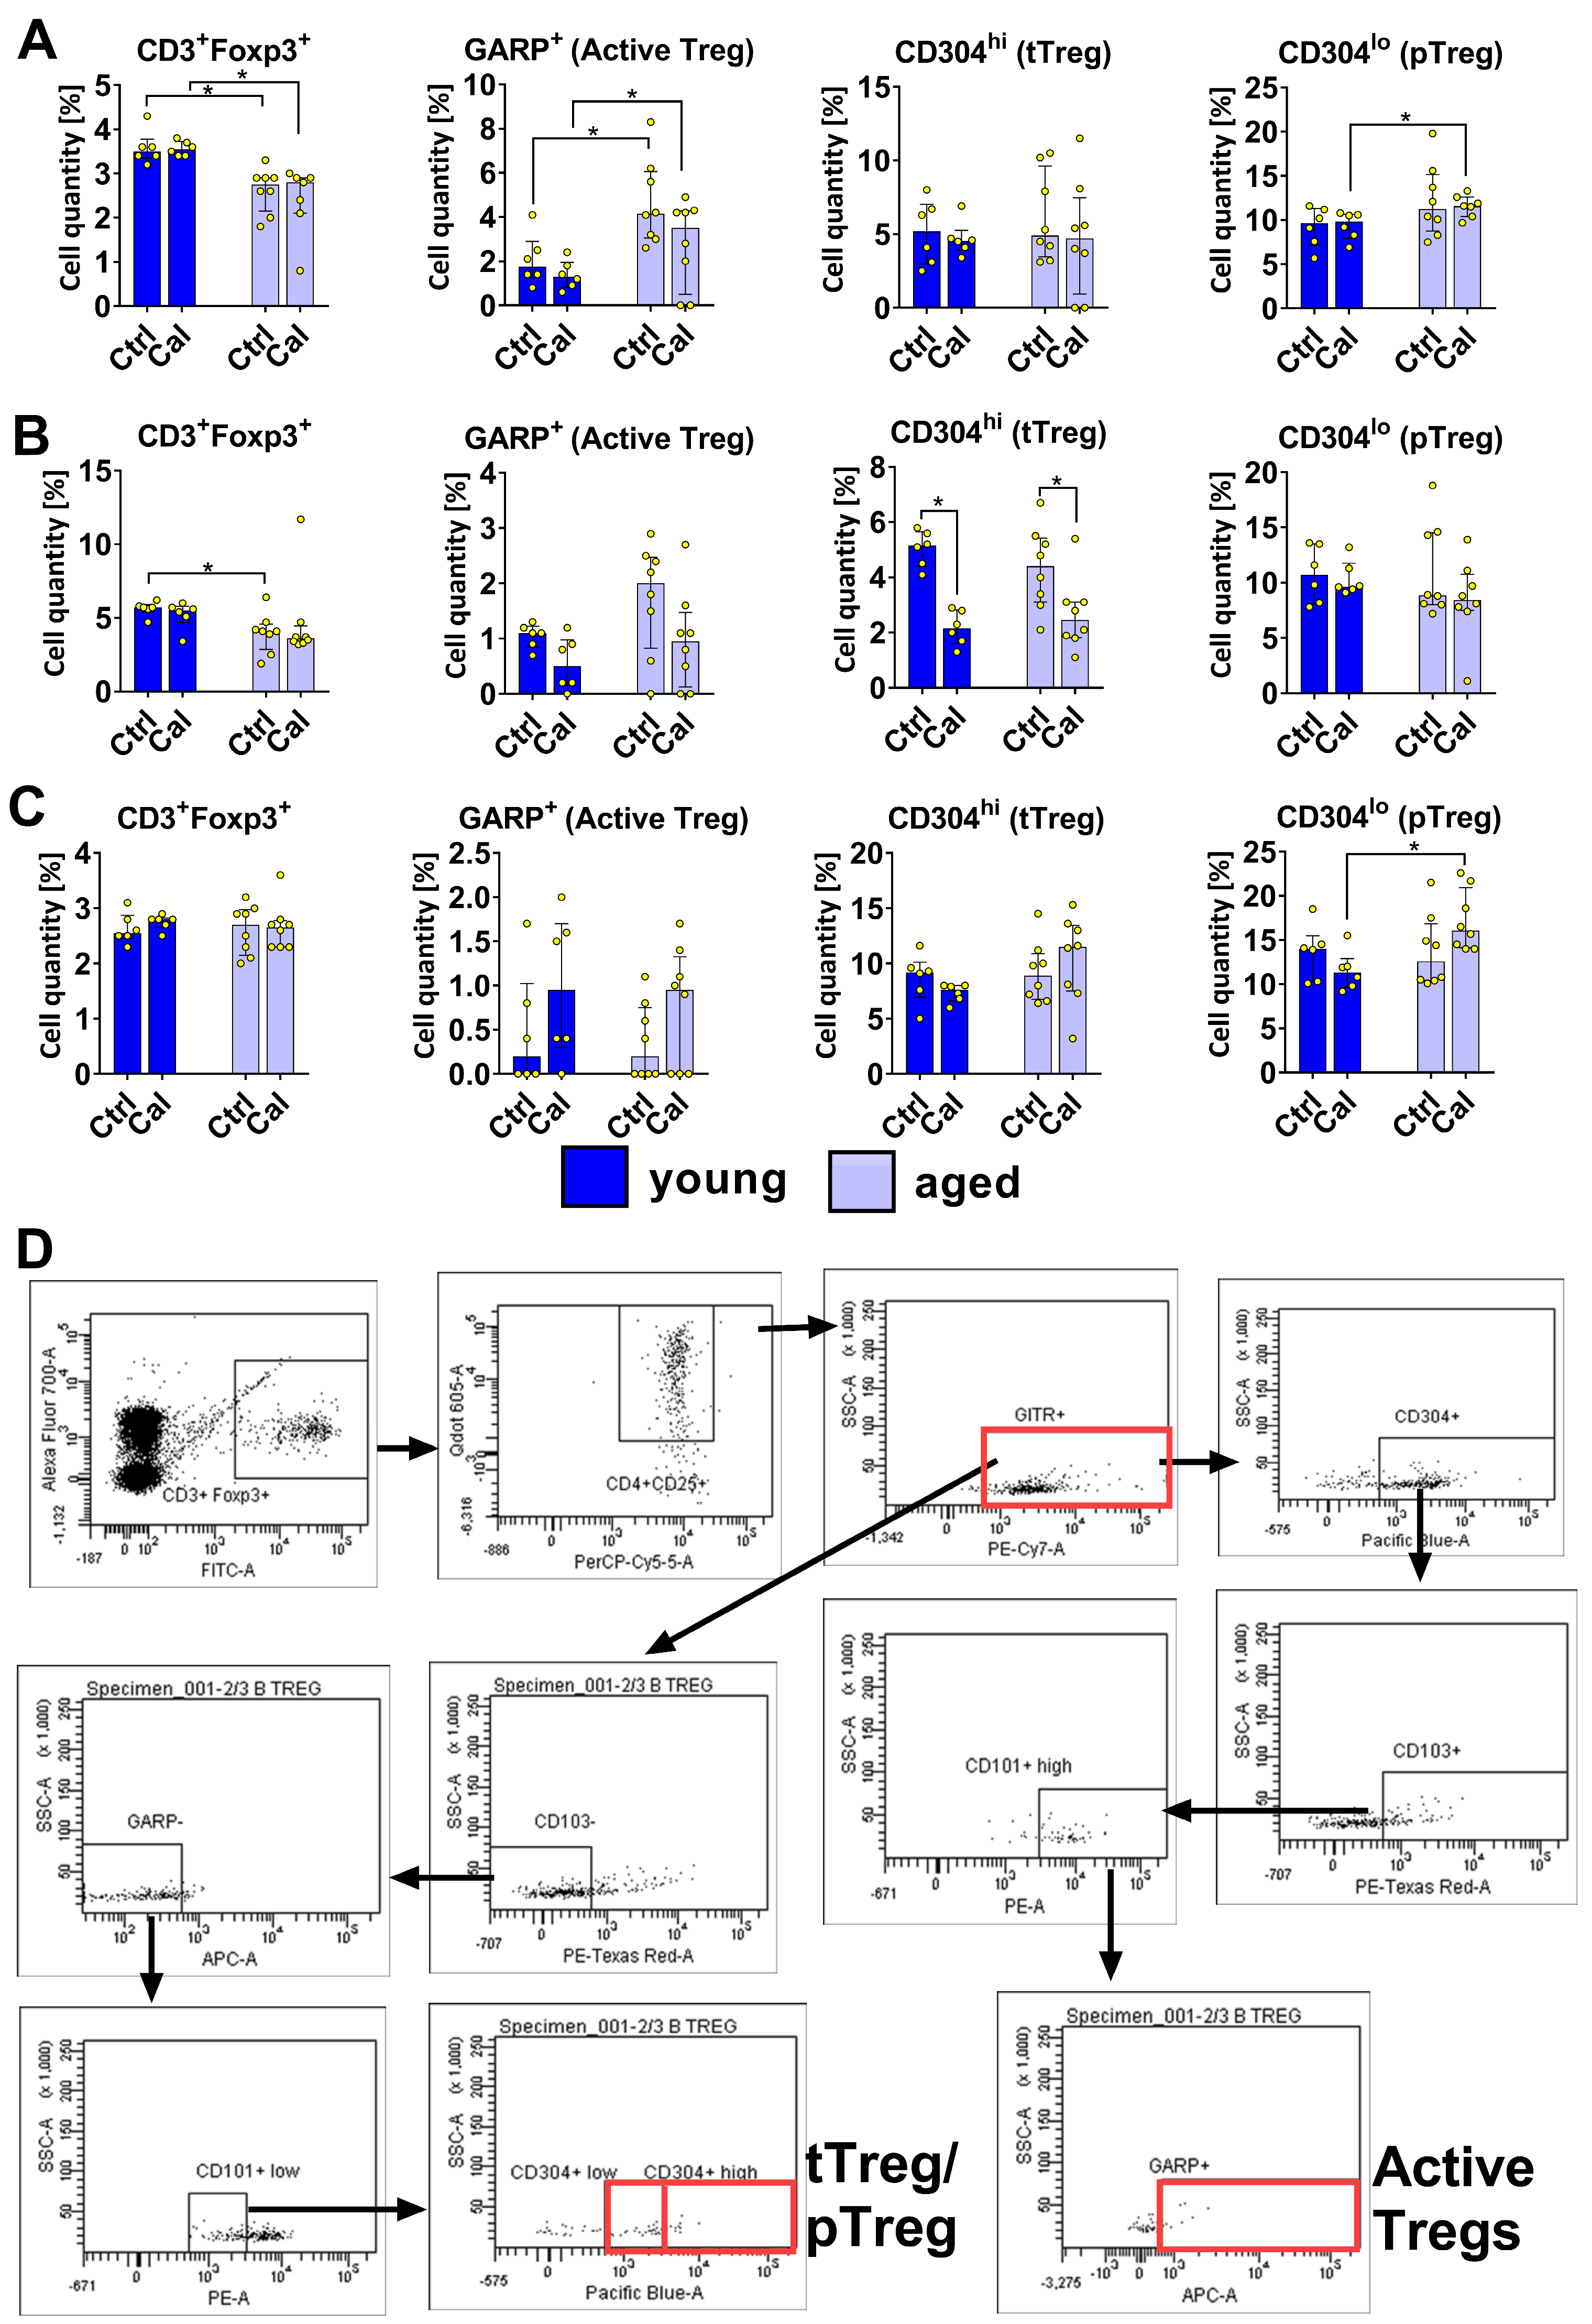
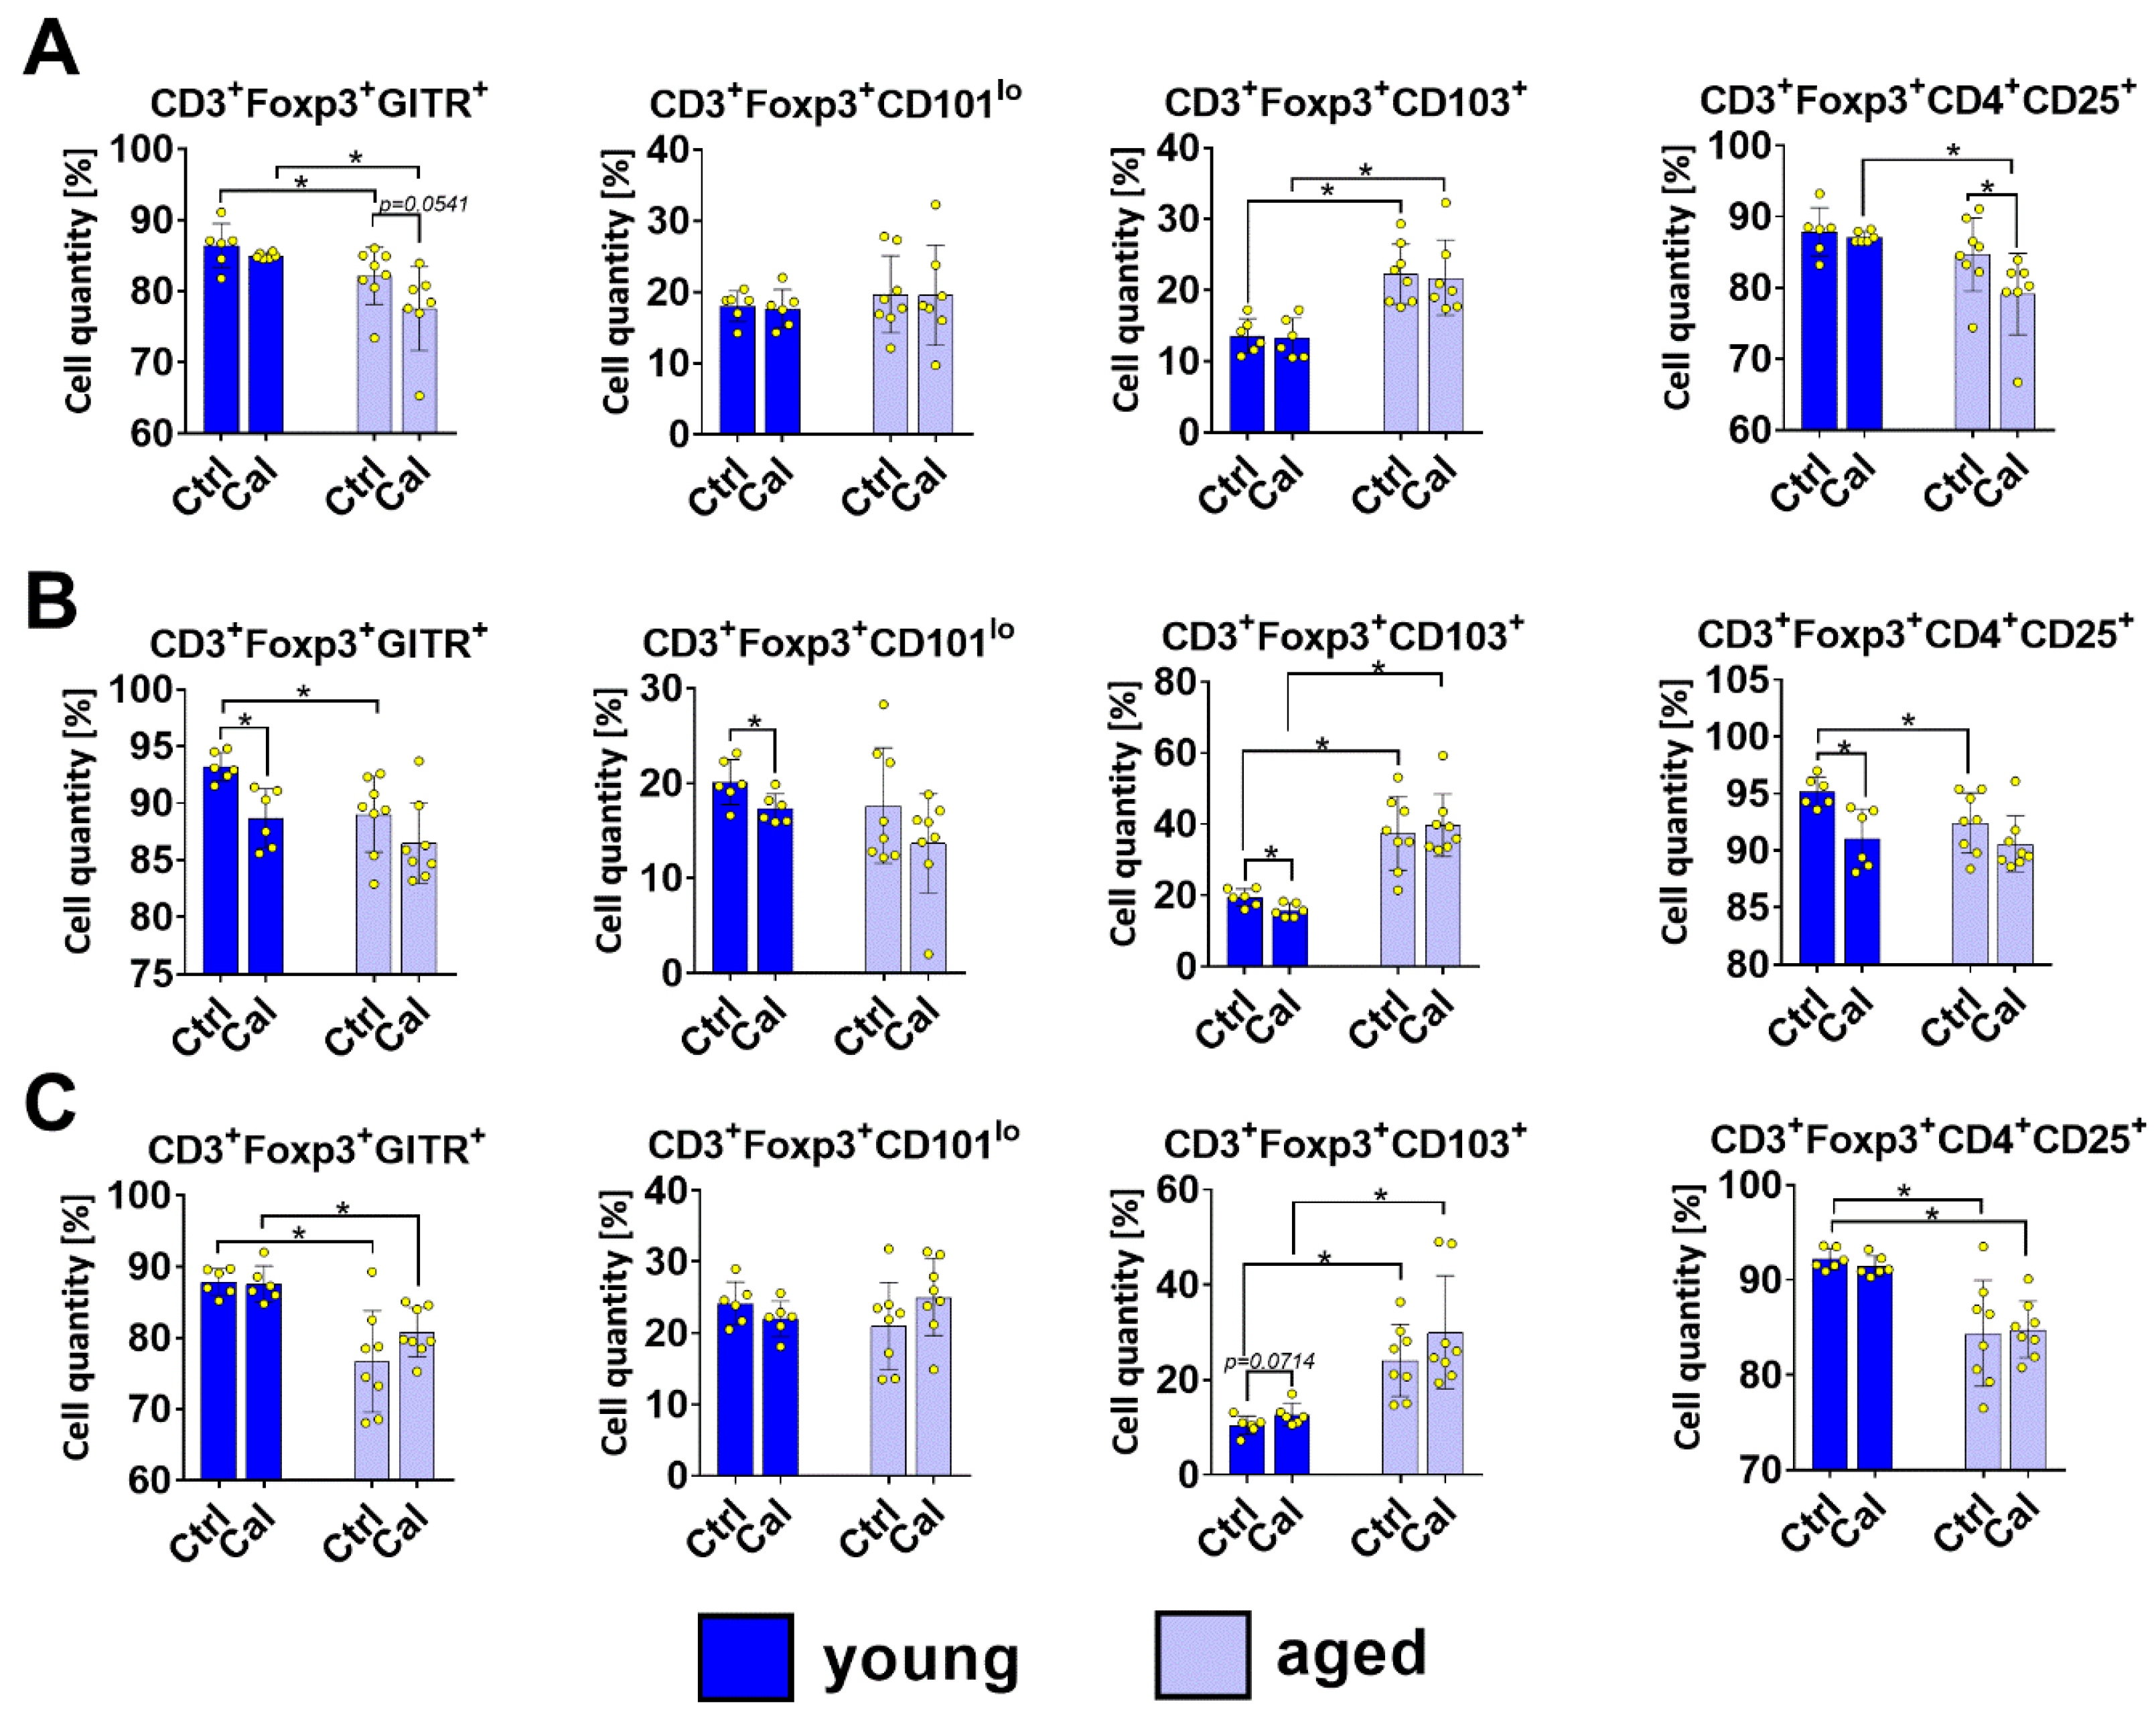
- tTregs (originating from CD4+ CD8+ thymic cells):CD3+ Foxp3+ CD4+ CD25+ GITR+ CD103− GARP− CD101low CD304high
- pTregs (from conventional TCD4+ Foxp3− cells):CD3+ Foxp3+ CD4+ CD25+ GITR+ CD103− GARP− CD101lo CD304lo
- Activated Tregs:CD3+ Foxp3+ CD4+ CD25+ GITR+ CD304+, CD103+ CD101hi GARP+.
- ○
- blood: T cells—young mice 3.6%, old mice 2.4%; B cells—young mice 24.2%, old mice 25%.
- ○
- lymph nodes: T cells—young mice 5.4%, old mice 4.7%; B cells—young mice 19.1%, old mice 21.1%.
- ○
- spleen: T cells—young mice 2.7%, old mice 2.6%; B cells—young mice 47.7%, old mice 42.8%.
2.7. Statistical Analyses
3. Results
3.1. Effect of Calcitriol on Bregs in Blood, Spleen, and LNs
3.2. Treg Subsets in Blood, LNs, and Spleen Cells of Young and Aged Mice Treated with Calcitriol
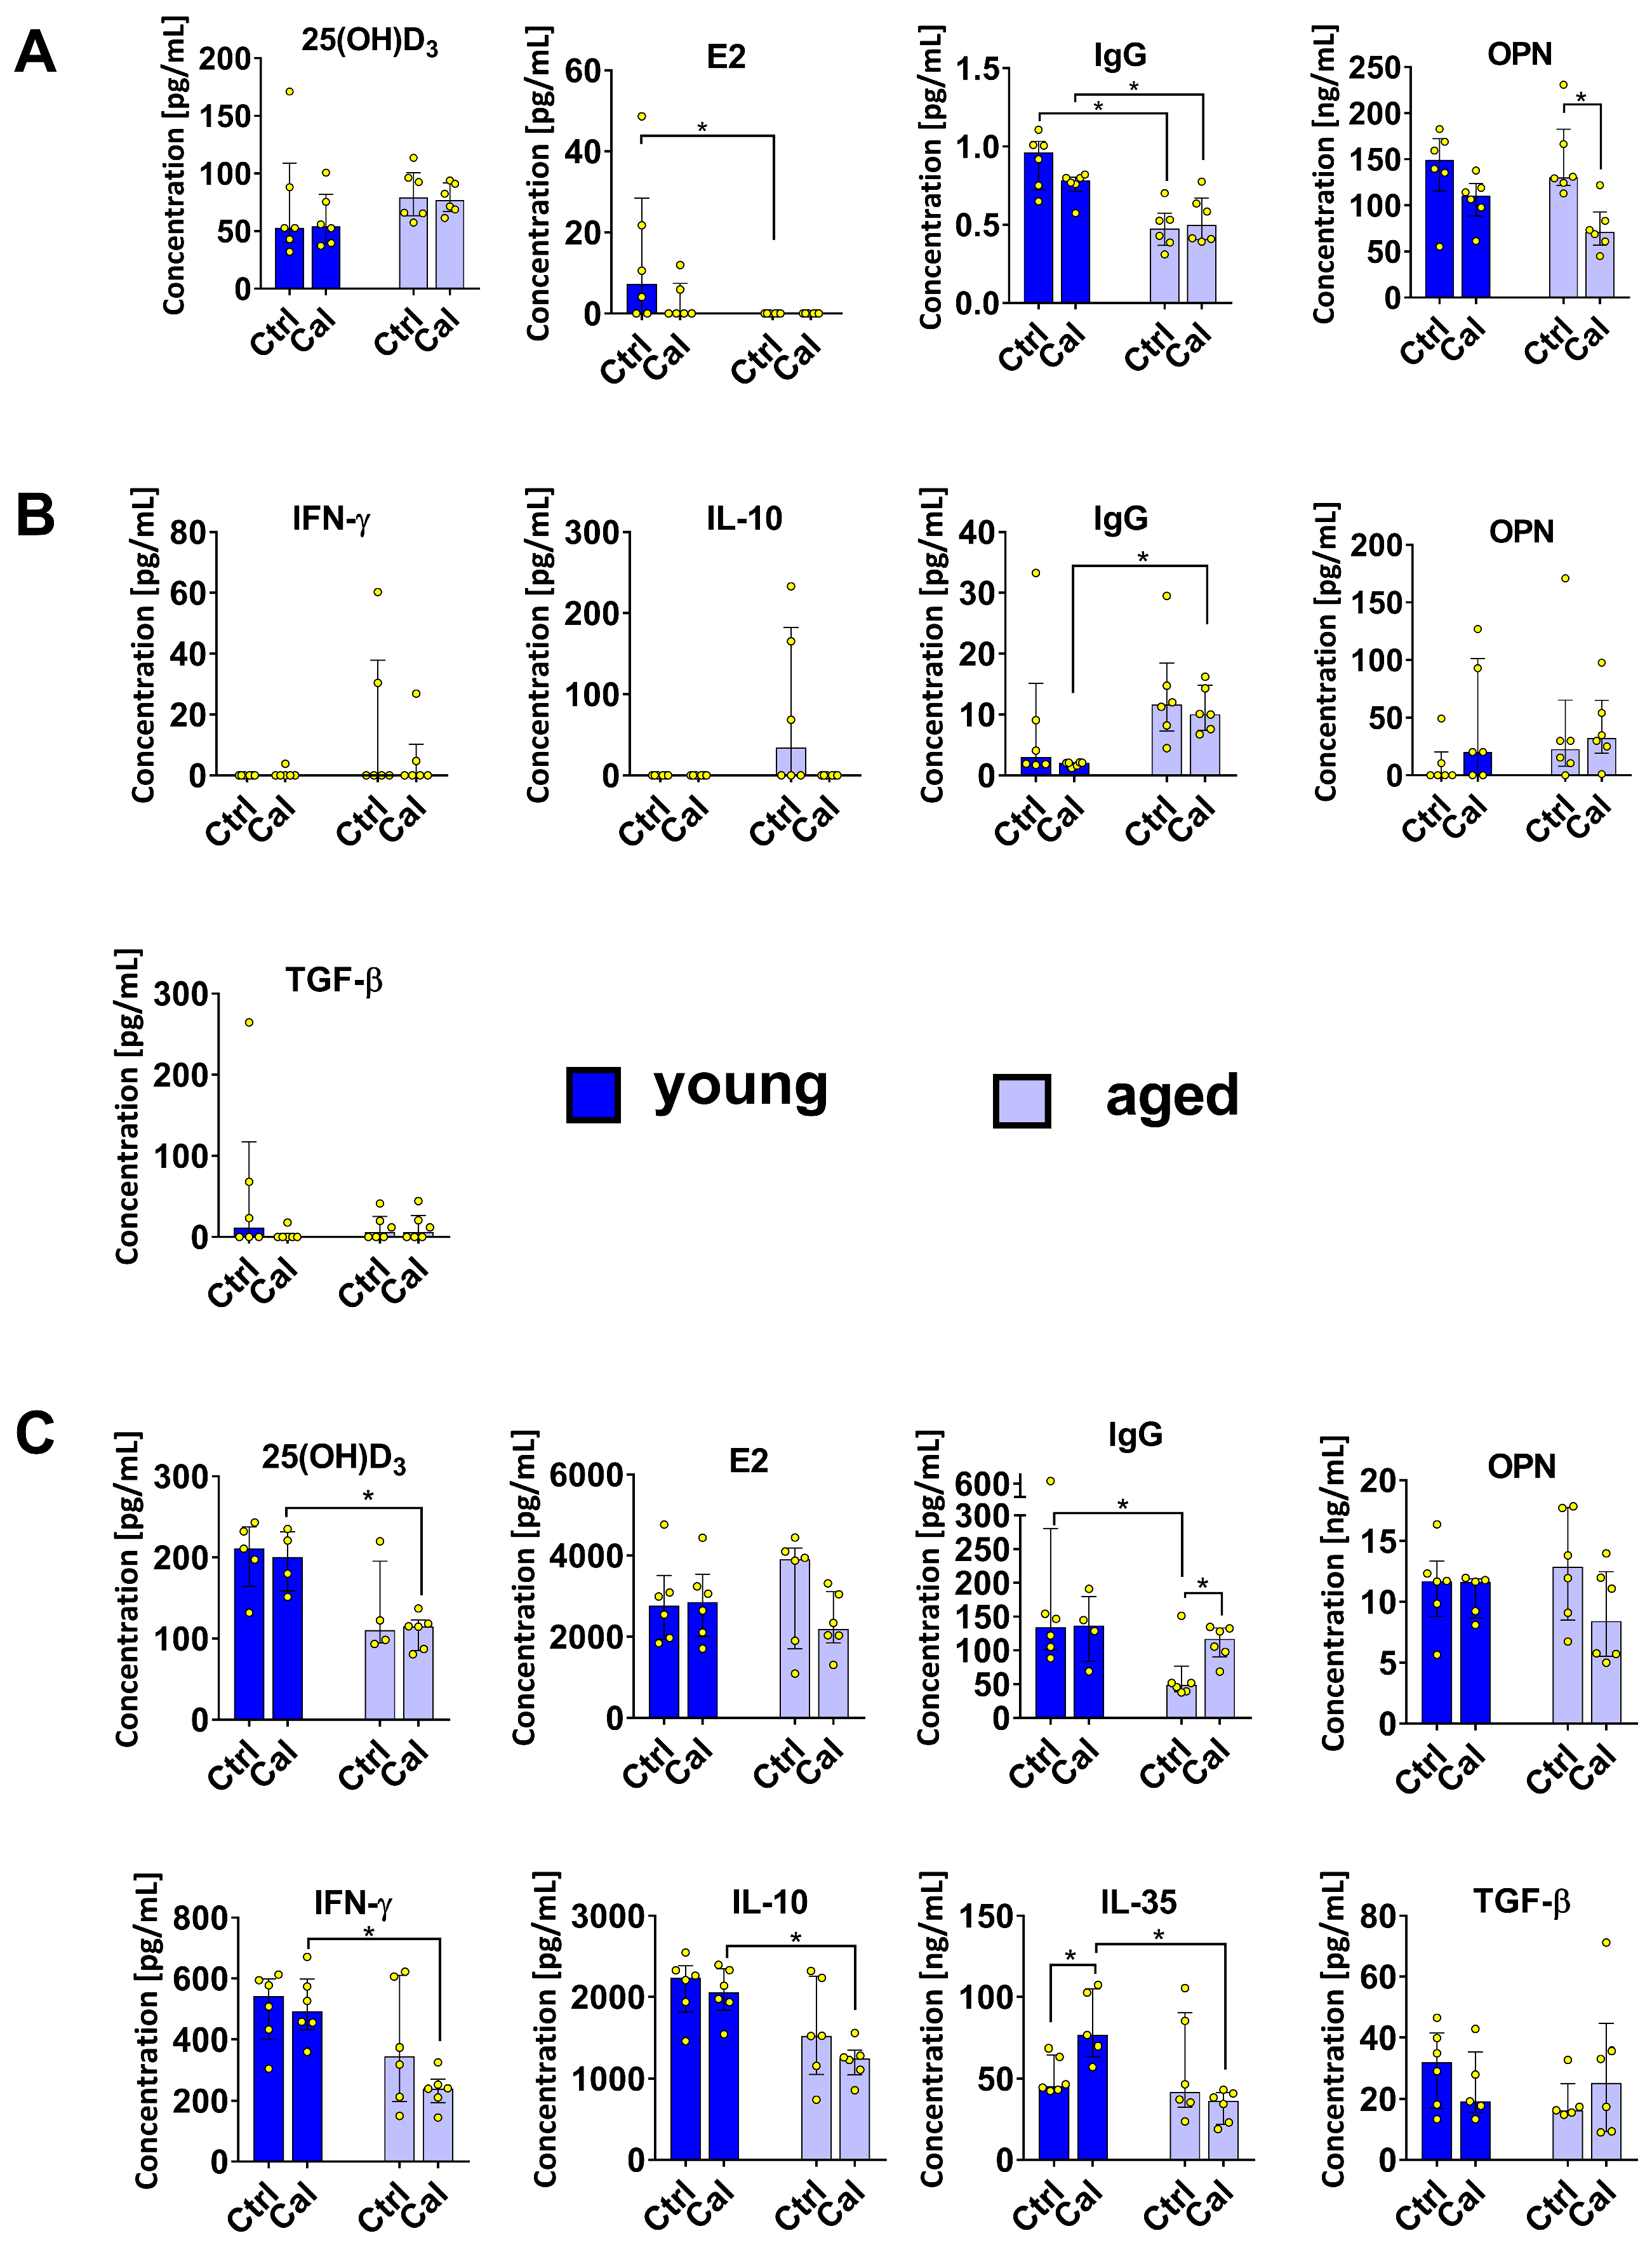
3.3. Cytokine Levels in Plasma and Splenocyte Culture Supernatants
3.4. Adipose Tissue from Young and Aged Mice Treated with Calcitriol
3.5. Blood Morphological Parameters and Body Weights of Mice
4. Discussion
5. Conclusions
Author Contributions
Funding
Institutional Review Board Statement
Informed Consent Statement
Data Availability Statement
Conflicts of Interest
References
- Kudlacek, S.; Willvonseder, R.; Stohlawetz, P.; Hahn, P.; Pietschmann, P. Immunology and aging. Aging Male 2000, 3, 137–142. [Google Scholar] [CrossRef] [PubMed]
- Kudlacek, S.; Jahandideh-Kazempour, S.; Graninger, W.; Willvonseder, R.; Pietschmann, P. Differential Expression of Various T Cell Surface Markers in Young and Elderly Subjects. Immunobiology 1995, 192, 198–204. [Google Scholar] [CrossRef] [PubMed]
- Frasca, D.; Blomberg, B.B. Adipose tissue inflammation induces B cell inflammation and decreases B cell function in aging. Front. Immunol. 2017, 8, 1003. [Google Scholar] [CrossRef] [PubMed]
- Darrigues, J.; van Meerwijk, J.P.M.; Romagnoli, P. Age-Dependent Changes in Regulatory T Lymphocyte Development and Function: A Mini-Review. Gerontology 2018, 64, 28–35. [Google Scholar] [CrossRef] [PubMed]
- Salminen, A.; Kaarniranta, K.; Kauppinen, A. Immunosenescence: The potential role of myeloid-derived suppressor cells (MDSC) in age-related immune deficiency. Cell. Mol. Life Sci. 2019, 76, 1901–1918. [Google Scholar] [CrossRef] [PubMed]
- Boucher, B.J. The problems of vitamin D insufficiency in older people. Aging Dis. 2012, 3, 313–329. [Google Scholar] [PubMed]
- Bouillon, R.; Garmyn, M.; Verstuyf, A.; Segaert, S.; Casteels, K.; Mathieu, C. Paracrine role for calcitriol in the immune system and skin creates new therapeutic possibilities for vitamin D analogs. Eur. J. Endocrinol. 1995, 133, 7–16. [Google Scholar] [CrossRef]
- Dimitrov, V.; Salehi-Tabar, R.; An, B.S.; White, J.H. Non-classical mechanisms of transcriptional regulation by the vitamin D receptor: Insights into calcium homeostasis, immune system regulation and cancer chemoprevention. J. Steroid Biochem. Mol. Biol. 2014, 144, 74–80. [Google Scholar] [CrossRef]
- Han, Y.-P.; Kong, M.; Zheng, S.; Ren, Y.; Zhu, L.; Shi, H.; Duan, Z. Vitamin D in liver diseases: From mechanisms to clinical trials. J. Gastroenterol. Hepatol. 2013, 28 (Suppl. S1), 49–55. [Google Scholar] [CrossRef]
- Overbergh, L.; Stoffels, K.; Waer, M.; Verstuyf, A.; Bouillon, R.; Mathieu, C. Immune Regulation of 25-Hydroxyvitamin D-1α-Hydroxylase in Human Monocytic THP1 Cells: Mechanisms of Interferon-γ-Mediated Induction. J. Clin. Endocrinol. Metab. 2006, 91, 3566–3574. [Google Scholar] [CrossRef]
- Rosser, E.C.; Mauri, C. Regulatory B Cells: Origin, Phenotype, and Function. Immunity 2015, 42, 607–612. [Google Scholar] [CrossRef] [PubMed]
- Drozdenko, G.; Scheel, T.; Heine, G.; Baumgrass, R.; Worm, M. Impaired T cell activation and cytokine production by calcitriol-primed human B cells. Clin. Exp. Immunol. 2014, 178, 364–372. [Google Scholar] [CrossRef] [PubMed]
- Boonstra, A.; Barrat, F.J.; Crain, C.; Heath, V.L.; Savelkoul, H.F.J.; O’garra, A. 1α,25-Dihydroxyvitamin D3 Has a Direct Effect on Naive CD4+ T Cells to Enhance the Development of Th2 Cells. J. Immunol. 2001, 167, 4974–4980. [Google Scholar] [CrossRef] [PubMed]
- Guillot, X.; Semerano, L.; Saidenberg-Kermanac’h, N.; Falgarone, G.; Boissier, M.-C. Vitamin D and inflammation. Jt. Bone Spine 2010, 77, 552–557. [Google Scholar] [CrossRef] [PubMed]
- Jeffery, L.E.; Burke, F.; Mura, M.; Zheng, Y.; Qureshi, O.S.; Hewison, M.; Walker, L.S.K.; Lammas, D.A.; Raza, K.; Sansom, D.M. 1,25-Dihydroxyvitamin D3 and IL-2 Combine to Inhibit T Cell Production of Inflammatory Cytokines and Promote Development of Regulatory T Cells Expressing CTLA-4 and FoxP3. J. Immunol. 2009, 183, 5458–5467. [Google Scholar] [CrossRef] [PubMed]
- Canfield, S.G.; Stebbins, M.J.; Morales, B.S.; Asai, S.W.; Vatine, G.D.; Svendsen, C.N.; Palecek, S.P.; Shusta, E.V. An isogenic blood-brain barrier model comprising brain endothelial cells, astrocytes, and neurons derived from human induced pluripotent stem cells. J. Neurochem. 2017, 140, 874–888. [Google Scholar] [CrossRef]
- Tukaj, S.; Bieber, K.; Witte, M.; Ghorbanalipoor, S.; Schmidt, E.; Zillikens, D.; Ludwig, R.J.; Kasperkiewicz, M. Calcitriol Treatment Ameliorates Inflammation and Blistering in Mouse Models of Epidermolysis Bullosa Acquisita. J. Investig. Dermatol. 2018, 138, 301–309. [Google Scholar] [CrossRef]
- Pawlik, A.; Anisiewicz, A.; Filip-Psurska, B.; Klopotowska, D.; Maciejewska, M.; Mazur, A.; Wietrzyk, J. Divergent effect of tacalcitol (PRI-2191) on Th17 cells in 4T1 tumor bearing young and old ovariectomized mice. Aging Dis. 2020, 11, 241–253. [Google Scholar] [CrossRef]
- Anisiewicz, A.; Pawlik, A.; Filip-Psurska, B.; Turlej, E.; Dzimira, S.; Milczarek, M.; Gdesz, K.; Papiernik, D.; Jarosz, J.; Kłopotowska, D.; et al. Unfavorable effect of calcitriol and its low-calcemic analogs on metastasis of 4T1 mouse mammary gland cancer. Int. J. Oncol. 2018, 52, 103–126. [Google Scholar] [CrossRef]
- Anisiewicz, A.; Filip-Psurska, B.; Pawlik, A.; Nasulewicz-Goldeman, A.; Piasecki, T.; Kowalski, K.; Maciejewska, M.; Jarosz, J.; Banach, J.; Papiernik, D.; et al. Calcitriol analogues decrease lung metastasis but impair bone metabolism in aged ovariectomized mice bearing 4T1 mammary gland tumours. Aging Dis. 2019, 10, 977–991. [Google Scholar] [CrossRef]
- Wang, W.; Fu, L.; Li, S.; Xu, Z.; Qiu, P.; Xu, T.-J.; Yang, W.; Zhang, Y.-B.; Xu, G.-M.; Lu, X.-D.; et al. Vitamin D insufficiency correlates with peripheral B10 cells in patients with pituitary tumours. Cell Biochem. Funct. 2017, 35, 254–259. [Google Scholar] [CrossRef] [PubMed]
- Pawlik, A.; Anisiewicz, A.; Filip-Psurska, B.; Nowak, M.; Turlej, E.; Trynda, J.; Banach, J.; Gretkierewicz, P.; Wietrzyk, J. Calcitriol and its analogs establish the immunosuppressive microenvironment that drives metastasis in 4T1 mouse mammary gland cancer. Int. J. Mol. Sci. 2018, 19, 2116. [Google Scholar] [CrossRef] [PubMed]
- DuPre´, S.A.; Redelman, D.; Hunter, K.W. The mouse mammary carcinoma 4T1: Characterization of the cellular landscape of primary tumours and metastatic tumour foci. Int. J. Exp. Pathol. 2007, 88, 351–360. [Google Scholar] [CrossRef]
- Scirka, B.; Szurek, E.; Pietrzak, M.; Rempala, G.; Kisielow, P.; Ignatowicz, L.; Miazek, A. Anti-GITR Antibody Treatment Increases TCR Repertoire Diversity of Regulatory but not Effector T Cells Engaged in the Immune Response against B16 Melanoma. Arch. Immunol. Ther. Exp. 2017, 65, 553–564. [Google Scholar] [CrossRef] [PubMed]
- Dooley, J.; Liston, A. Molecular control over thymic involution: From cytokines and microRNA to aging and adipose tissue. Eur. J. Immunol. 2012, 42, 1073–1079. [Google Scholar] [CrossRef]
- Thiault, N.; Darrigues, J.; Adoue, V.; Gros, M.; Binet, B.; Perals, C.; Leobon, B.; Fazilleau, N.; Joffre, O.P.; Robey, E.A.; et al. Peripheral regulatory T lymphocytes recirculating to the thymus suppress the development of their precursors. Nat. Immunol. 2015, 16, 628–634. [Google Scholar] [CrossRef]
- Knee, D.A.; Hewes, B.; Brogdon, J.L. Rationale for anti-GITR cancer immunotherapy. Eur. J. Cancer 2016, 67, 1–10. [Google Scholar] [CrossRef]
- Valzasina, B.; Guiducci, C.; Dislich, H.; Killeen, N.; Weinberg, A.D.; Colombo, M.P. Triggering of OX40 (CD134) on CD4+CD25+ T cells blocks their inhibitory activity: A novel regulatory role for OX40 and its comparison with GITR. Blood 2005, 105, 2845–2851. [Google Scholar] [CrossRef]
- Huehn, J.; Siegmund, K.; Lehmann, J.C.; Siewert, C.; Haubold, U.; Feuerer, M.; Debes, G.F.; Lauber, J.; Frey, O.; Przybylski, G.K.; et al. Developmental Stage, Phenotype, and Migration Distinguish Naive- and Effector/Memory-like CD4+ Regulatory T Cells. J. Exp. Med. 2004, 199, 303–313. [Google Scholar] [CrossRef]
- Franceschi, C.; Garagnani, P.; Parini, P.; Giuliani, C.; Santoro, A. Inflammaging: A new immune–metabolic viewpoint for age-related diseases. Nat. Rev. Endocrinol. 2018, 14, 576–590. [Google Scholar] [CrossRef]
- Fernandez, I.; Zeiser, R.; Karsunky, H.; Kambham, N.; Beilhack, A.; Soderstrom, K.; Negrin, R.S.; Engleman, E. CD101 Surface Expression Discriminates Potency among Murine FoxP3+ Regulatory T Cells. J. Immunol. 2007, 179, 2808–2814. [Google Scholar] [CrossRef] [PubMed]
- Kennedy, D.E.; Knight, K.L. Inhibition of B Lymphopoiesis by Adipocytes and IL-1–Producing Myeloid-Derived Suppressor Cells. J. Immunol. 2015, 195, 2666–2674. [Google Scholar] [CrossRef] [PubMed]
- Kennedy, D.E.; Knight, K.L. Inflammatory Changes in Bone Marrow Microenvironment Associated with Declining B Lymphopoiesis. J. Immunol. 2017, 198, 3471–3479. [Google Scholar] [CrossRef] [PubMed]
- Flores, R.R.; Clauson, C.L.; Cho, J.; Lee, B.C.; McGowan, S.J.; Baker, D.J.; Niedernhofer, L.J.; Robbins, P.D. Expansion of myeloid-derived suppressor cells with aging in the bone marrow of mice through a NF-κB-dependent mechanism. Aging Cell 2017, 16, 480–487. [Google Scholar] [CrossRef] [PubMed]
- Park, M.; Lee, S.; Kim, E.; Lee, E.; Park, S.; Kwok, S.; Cho, M. Myeloid-Derived Suppressor Cells Induce the Expansion of Regulatory B Cells and Ameliorate Autoimmunity in the Sanroque Mouse Model of Systemic Lupus Erythematosus. Arthritis Rheumatol. 2016, 68, 2717–2727. [Google Scholar] [CrossRef] [PubMed]
- Guinamard, R.; Okigaki, M.; Schlessinger, J.; Ravetch, J.V. Absence of marginal zone B cells in Pyk-2–deficient mice defines their role in the humoral response. Nat. Immunol. 2000, 1, 31–36. [Google Scholar] [CrossRef]
- Turner, V.M.; Mabbott, N.A. Ageing adversely affects the migration and function of marginal zone B cells. Immunology 2017, 151, 349–362. [Google Scholar] [CrossRef]
- Evans, J.G.; Chavez-Rueda, K.A.; Eddaoudi, A.; Meyer-Bahlburg, A.; Rawlings, D.J.; Ehrenstein, M.R.; Mauri, C. Novel Suppressive Function of Transitional 2 B Cells in Experimental Arthritis. J. Immunol. 2007, 178, 7868–7878. [Google Scholar] [CrossRef]
- Anisiewicz, A.; Pawlik, A.; Filip-Psurska, B.; Wietrzyk, J. Differential Impact of Calcitriol and Its Analogs on Tumor Stroma in Young and Aged Ovariectomized Mice Bearing 4T1 Mammary Gland Cancer. Int. J. Mol. Sci. 2020, 21, 6359. [Google Scholar] [CrossRef]
- Heine, G.; Niesner, U.; Chang, H.D.; Steinmeyer, A.; Zügel, U.; Zuberbier, T.; Radbruch, A.; Worm, M. 1,25-dihydroxyvitamin D3 promotes IL-10 production in human B cells. Eur.J Immunol 2008, 38, 2210–2218. [Google Scholar] [CrossRef]
- van Dam, A.D.; van Beek, L.; Pronk, A.C.; van den Berg, S.M.; Van den Bossche, J.; de Winther, M.P.J.; Koning, F.; van Kooten, C.; Rensen, P.C.N.; Boon, M.R.; et al. IgG is elevated in obese white adipose tissue but does not induce glucose intolerance via Fc3-receptor or complement. Int. J. Obes. 2018, 42, 260–269. [Google Scholar] [CrossRef] [PubMed]
- Cipolletta, D. Adipose tissue-resident regulatory T cells: Phenotypic specialization, functions and therapeutic potential. Immunology 2014, 142, 517–525. [Google Scholar] [CrossRef] [PubMed]
- Teymouri, M.; Pirro, M.; Fallarino, F.; Gargaro, M.; Sahebkar, A. IL-35, a hallmark of immune-regulation in cancer progression, chronic infections and inflammatory diseases. Int. J. Cancer 2018, 143, 2105–2115. [Google Scholar] [CrossRef] [PubMed]
- Song, M.; Ma, X. The immunobiology of interleukin-35 and its regulation and gene expression. Adv. Exp. Med. Biol. 2016, 941, 213–225. [Google Scholar] [PubMed]
- García-Hernández, M.; Rodríguez-Varela, E.; García-Jacobo, R.; la Torre, M.H.-D.; Uresti-Rivera, E.; González-Amaro, R.; Portales-Pérez, D. Frequency of regulatory B cells in adipose tissue and peripheral blood from individuals with overweight, obesity and normal-weight. Obes. Res. Clin. Pract. 2018, 12, 513–519. [Google Scholar] [CrossRef] [PubMed]
- DeFuria, J.; Belkina, A.C.; Jagannathan-Bogdan, M.; Snyder-Cappione, J.; Carr, J.D.; Nersesova, Y.R.; Markham, D.; Strissel, K.J.; Watkins, A.A.; Zhu, M.; et al. B cells promote inflammation in obesity and type 2 diabetes through regulation of T-cell function and an inflammatory cytokine profile. Proc. Natl. Acad. Sci. USA 2013, 110, 5133–5138. [Google Scholar] [CrossRef]
- Chang, P.L.; Prince, C.W. 1α,25-Dihydroxyvitamin D3 Stimulates Synthesis and Secretion of Nonphosphorylated Osteopontin (Secreted Phosphoprotein 1) in Mouse JB6 Epidermal Cells. Cancer Res. 1991, 51, 2144–2150. [Google Scholar]
- Chang, P.L.; Ridall, A.L.; Prince, C.W. Calcitriol regulation of osteopontin expression in mouse epidermal cells. Endocrinology 1994, 135, 863–869. [Google Scholar] [CrossRef]
- Lau, W.L.; Leaf, E.M.; Hu, M.C.; Takeno, M.M.; Kuro-O, M.; Moe, O.W.; Giachelli, C.M. Vitamin D receptor agonists increase klotho and osteopontin while decreasing aortic calcification in mice with chronic kidney disease fed a high phosphate diet. Kidney Int. 2012, 82, 1261–1270. [Google Scholar] [CrossRef]
- Kolb, A.; Kleeff, J.; Guweidhi, A.; Esposito, I.; Giese, N.; Adwan, H.; Giese, T.; Büchler, M.W.; Berger, M.; Friess, H. Osteopontin influences the invasiveness of pancreatic cancer cells and is increased in neoplastic and inflammatory conditions. Cancer Biol. Ther. 2005, 4, 740–746. [Google Scholar] [CrossRef]
- Li, Y.; Xie, Y.; Cui, D.; Ma, Y.; Sui, L.; Zhu, C.; Kong, H.; Kong, Y. Osteopontin promotes invasion, migration and epithelial-mesenchymal transition of human endometrial carcinoma cell HEC-1A through AKT and ERK1/2 signaling. Cell Physiol. Biochem. 2015, 37, 1503–1512. [Google Scholar] [CrossRef] [PubMed]
- Sangaletti, S.; Tripodo, C.; Sandri, S.; Torselli, I.; Vitali, C.; Ratti, C.; Botti, L.; Burocchi, A.; Porcasi, R.; Tomirotti, A.; et al. Osteopontin Shapes Immunosuppression in the Metastatic Niche. Cancer Res. 2014, 74, 4706–4719. [Google Scholar] [CrossRef] [PubMed]
- He, X.-J.; Ding, Y.; Xiang, W.; Dang, X.-Q. Roles of 1,25(OH)2D3 and Vitamin D Receptor in the Pathogenesis of Rheumatoid Arthritis and Systemic Lupus Erythematosus by Regulating the Activation of CD4+ T Cells and the PKCδ/ERK Signaling Pathway. Cell. Physiol. Biochem. 2016, 40, 743–756. [Google Scholar] [CrossRef] [PubMed]
- Guo, B.; Tumang, J.R.; Rothstein, T.L. B cell receptor crosstalk: B cells express osteopontin through the combined action of the alternate and classical BCR signaling pathways. Mol. Immunol. 2009, 46, 587–591. [Google Scholar] [CrossRef]
- Shevde, L.A.; Samant, R.S. Role of osteopontin in the pathophysiology of cancer. Matrix Biol. 2014, 37, 131–141. [Google Scholar] [CrossRef]
- Liu, J.; Xu, K.; Chase, M.; Ji, Y.; Logan, J.K.; Buchsbaum, R.J. Tiam1-regulated osteopontin in senescent fibroblasts contributes to the migration and invasion of associated epithelial cells. J. Cell Sci. 2012, 125, 376–386. [Google Scholar] [CrossRef]


| Determined Protein | Mark | Clone | Manufacturer |
|---|---|---|---|
| CD19 | Brilliant Violet 510 | 6D5 | Biolegend, San Diego, CA, USA |
| CD21/CD35 | PE | 7E9 | |
| CD1d (CD1.1, Ly-38) | Alexa Fluor 647 | 1B1 | |
| IgM | PerCP/Cy5.5 | RMM-1 | |
| IgD | APC/Fire 750 | 11-26c.2a | |
| CD23 | Brilliant Violet 421 | B3B4 | |
| CD24 | PE/Dazzle 594 | M1/69 | |
| CD5 | PE/Cy7 | 53-7.3 | |
| CD3 | Alexa Fluor 700 | 17A2 | |
| CD4 | PerCP/Cy5.5 | GK1.5 | |
| CD25 | Brilliant Violet 605 | PC61 | |
| CD357 (GITR) | PE/Cy7 | DTA-1 | |
| CD101 | PE | Moushi101 | Invitrogen, Carlsbad, CA, USA |
| CD103 | PE/Dazzle 594 | 2E7 | Biolegend, San Diego, CA, USA |
| CD304 (neuropilin-1) | Brilliant Violet 421 | 3E12 | |
| GARP | Alexa Fluor 647 | F011-5 |
Disclaimer/Publisher’s Note: The statements, opinions and data contained in all publications are solely those of the individual author(s) and contributor(s) and not of MDPI and/or the editor(s). MDPI and/or the editor(s) disclaim responsibility for any injury to people or property resulting from any ideas, methods, instructions or products referred to in the content. |
© 2023 by the authors. Licensee MDPI, Basel, Switzerland. This article is an open access article distributed under the terms and conditions of the Creative Commons Attribution (CC BY) license (https://creativecommons.org/licenses/by/4.0/).
Share and Cite
Śnieżewska, A.; Anisiewicz, A.; Gdesz-Birula, K.; Wietrzyk, J.; Filip-Psurska, B. Age-Dependent Effect of Calcitriol on Mouse Regulatory T and B Lymphocytes. Nutrients 2024, 16, 49. https://doi.org/10.3390/nu16010049
Śnieżewska A, Anisiewicz A, Gdesz-Birula K, Wietrzyk J, Filip-Psurska B. Age-Dependent Effect of Calcitriol on Mouse Regulatory T and B Lymphocytes. Nutrients. 2024; 16(1):49. https://doi.org/10.3390/nu16010049
Chicago/Turabian StyleŚnieżewska, Agata, Artur Anisiewicz, Katarzyna Gdesz-Birula, Joanna Wietrzyk, and Beata Filip-Psurska. 2024. "Age-Dependent Effect of Calcitriol on Mouse Regulatory T and B Lymphocytes" Nutrients 16, no. 1: 49. https://doi.org/10.3390/nu16010049
APA StyleŚnieżewska, A., Anisiewicz, A., Gdesz-Birula, K., Wietrzyk, J., & Filip-Psurska, B. (2024). Age-Dependent Effect of Calcitriol on Mouse Regulatory T and B Lymphocytes. Nutrients, 16(1), 49. https://doi.org/10.3390/nu16010049