

Evaluation of Dietary and Alcohol Drinking Patterns in Patients with Excess Body Weight in a Spanish Cohort: Impact on Cardiometabolic Risk Factors

 , , ,
, , , 
Abstract
1. Introduction
2. Materials and Methods
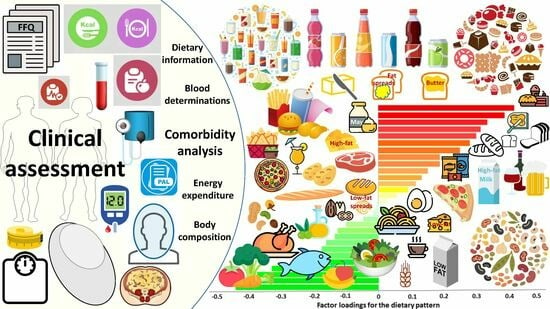
2.1. Patient Selection and Study Design
2.2. Anthropometry, Body Composition and Resting Energy Expenditure Determination
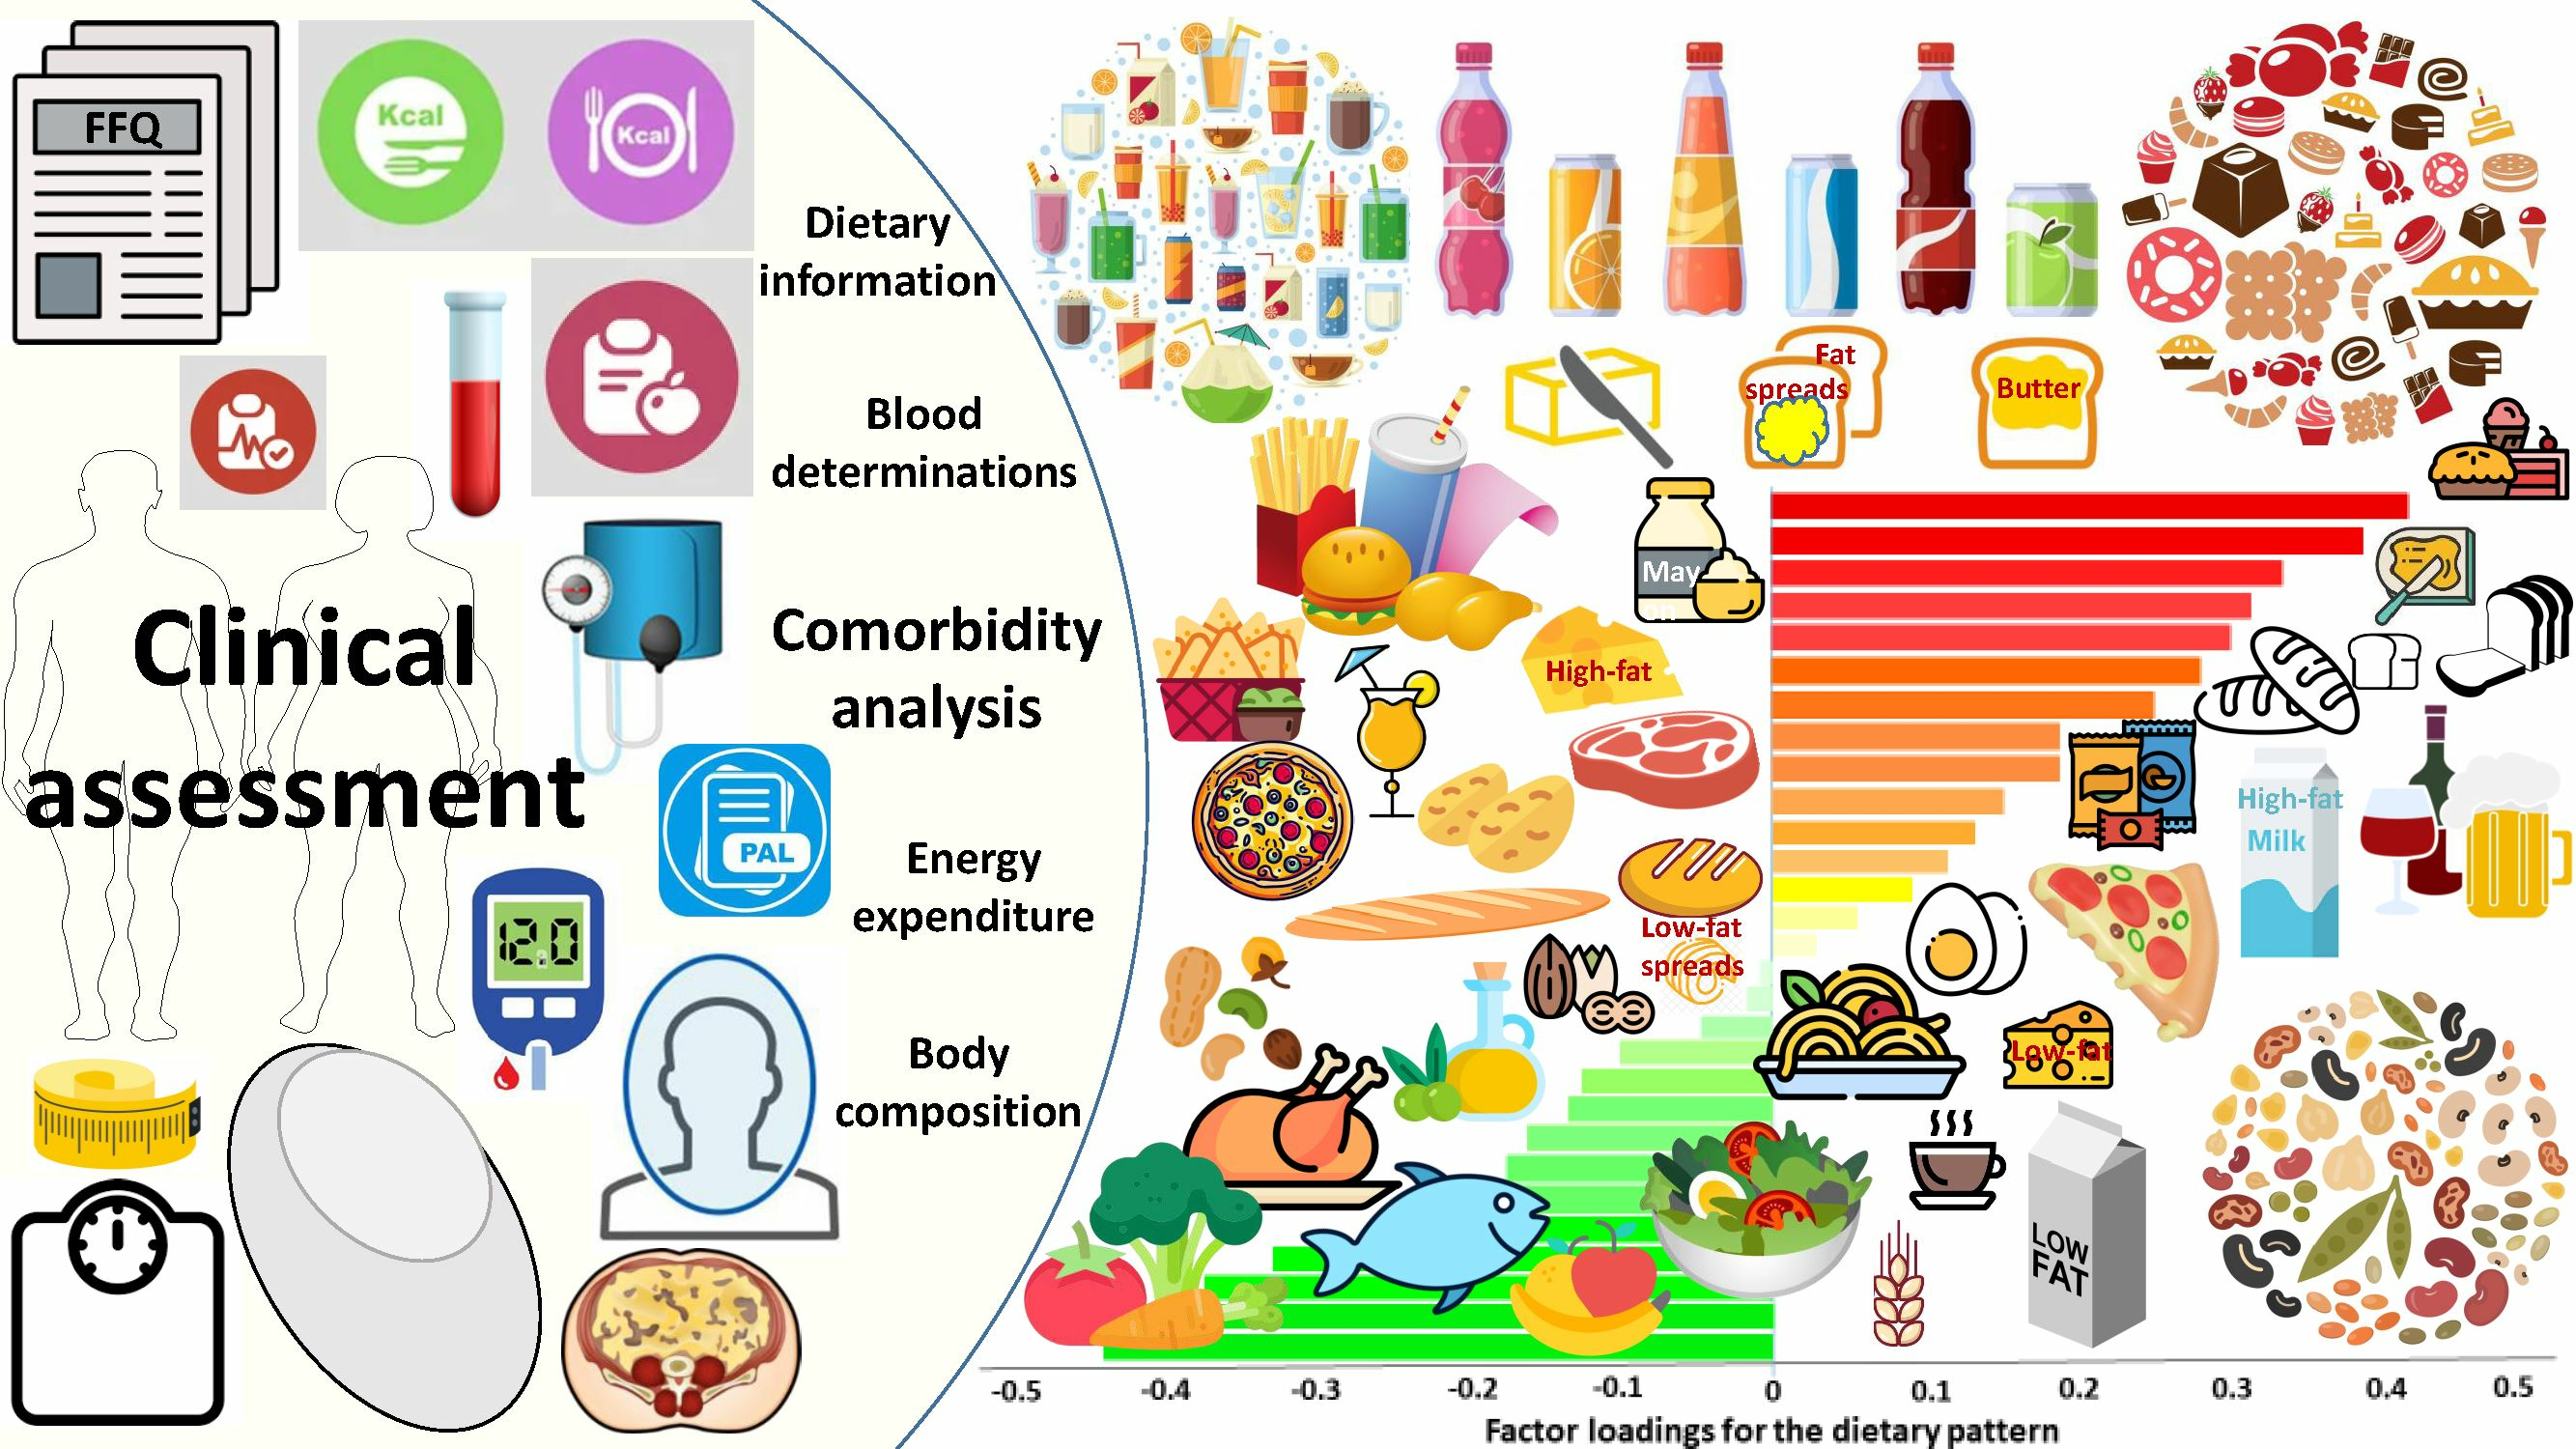
2.3. Dietetic History and Nutritional Information
2.4. Blood Analyses
2.5. Statistical Analyses
3. Results
3.1. Study Cohort Characteristics
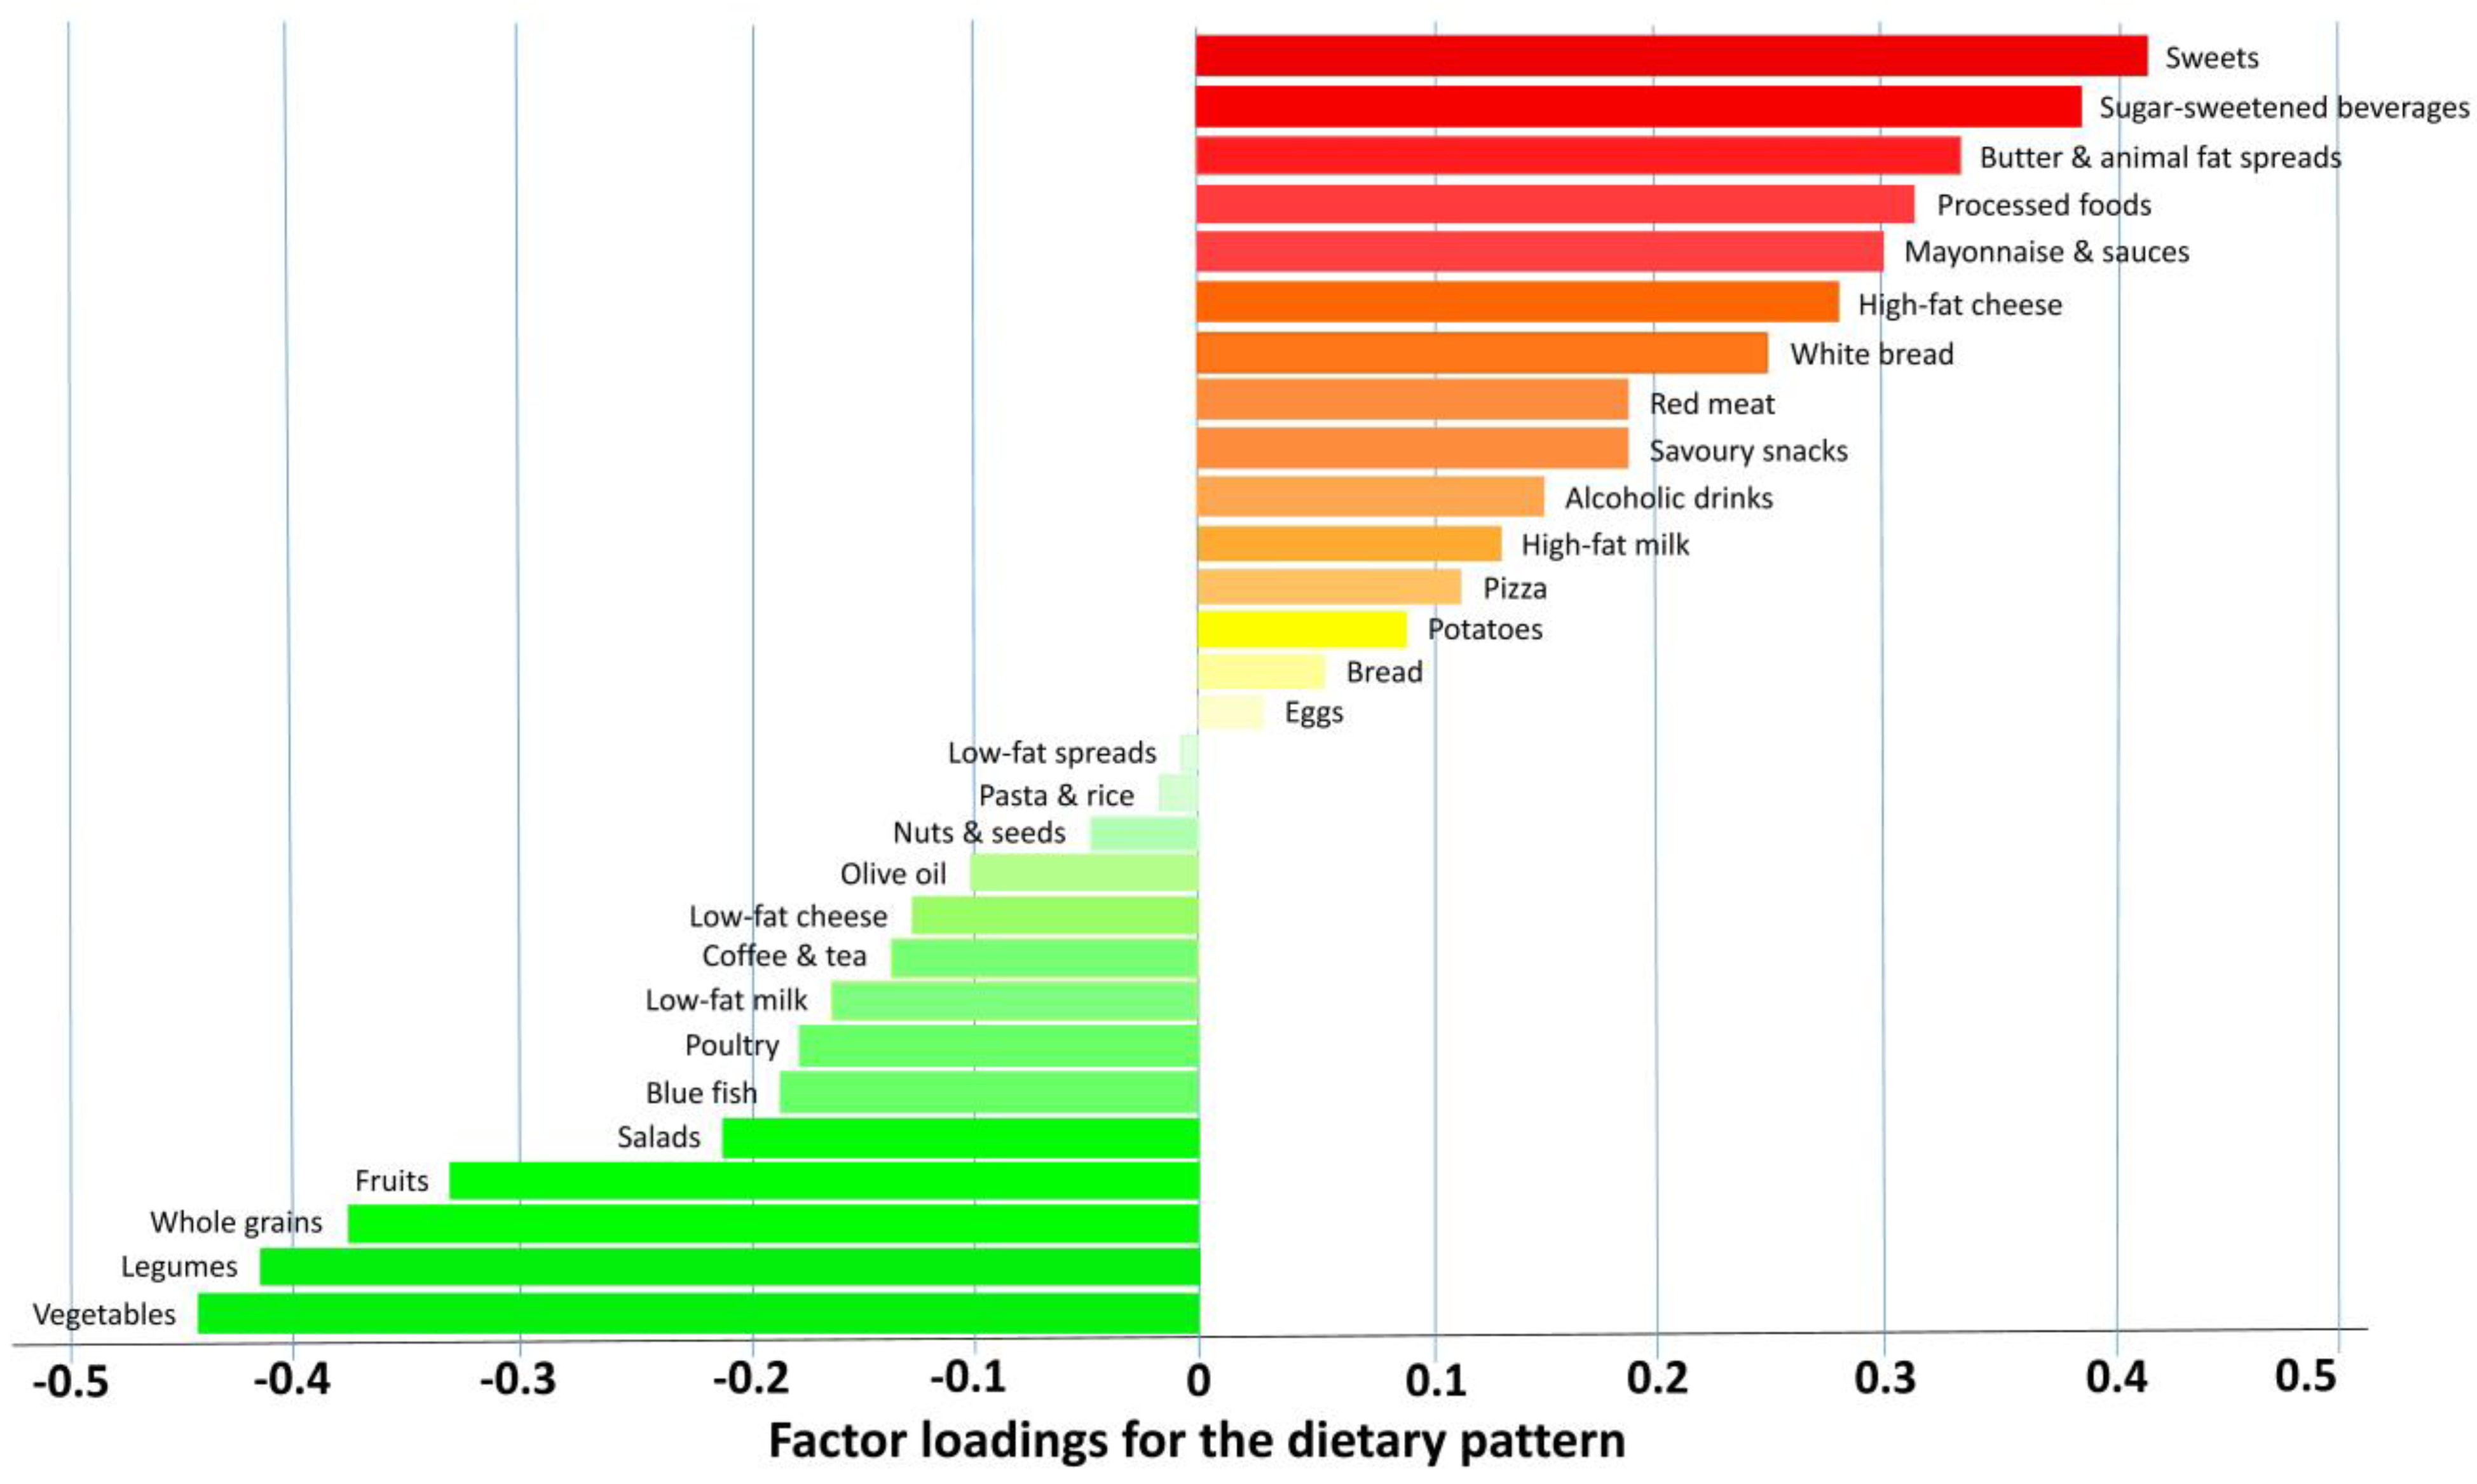
3.2. Energy Imbalance, Dietary and Drinking Patterns
4. Discussion
5. Conclusions
Author Contributions
Funding
Institutional Review Board Statement
Informed Consent Statement
Data Availability Statement
Acknowledgments
Conflicts of Interest
Abbreviations
References
- Frühbeck, G.; Gómez-Ambrosi, J. Control of body weight: A physiologic and transgenic perspective. Diabetologia 2003, 46, 143–172. [Google Scholar] [CrossRef]
- NCD Risk Factor Collaboration (NCD-RisC). Worldwide trends in body-mass index, underweight, overweight, and obesity from 1975 to 2016: A pooled analysis of 2416 population-based measurement studies in 128.9 million children, adolescents, and adults. Lancet 2017, 390, 2627–2642. [Google Scholar] [CrossRef] [PubMed]
- GBD 2017 Diet Collaborators. Health effects of dietary risks in 195 countries, 1990–2017: A systematic analysis for the Global Burden of Disease Study 2017. Lancet 2019, 393, 1958–1972. [Google Scholar] [CrossRef]
- GBD 2019 Diseases & Injuries-Collaborators. Global burden of 369 diseases and injuries in 204 countries and territories, 1990–2019: A systematic analysis for the Global Burden of Disease Study 2019. Lancet 2020, 396, 1204–1222. [Google Scholar] [CrossRef] [PubMed]
- Catalán, V.; Avilés-Olmos, I.; Rodríguez, A.; Becerril, S.; Fernández-Formoso, J.A.; Kiortsis, D.; Portincasa, P.; Gómez-Ambrosi, J.; Frühbeck, G. Time to consider the “exposome hypothesis” in the development of the obesity pandemic. Nutrients 2022, 14, 1597. [Google Scholar] [CrossRef]
- World Health Organization. Fact Sheet: Obesity and Overweight. Available online: http://www.who.int/mediacentre/factsheets/fs311/en/ (accessed on 9 June 2021).
- Gutiérrez-Fisac, J.L.; Guallar-Castillón, P.; León-Munoz, L.M.; Graciani, A.; Banegas, J.R.; Rodríguez-Artalejo, F. Prevalence of general and abdominal obesity in the adult population of Spain, 2008–2010: The ENRICA study. Obes. Rev. 2012, 13, 388–392. [Google Scholar] [CrossRef]
- Talukdar, D.; Seenivasan, S.; Cameron, A.J.; Sacks, G. The association between national income and adult obesity prevalence: Empirical insights into temporal patterns and moderators of the association using 40 years of data across 147 countries. PLoS ONE 2020, 15, e0232236. [Google Scholar] [CrossRef]
- Heymsfield, S.B.; Wadden, T.A. Mechanisms, pathophysiology, and management of obesity. N. Engl. J. Med. 2017, 376, 254–266. [Google Scholar] [CrossRef] [PubMed]
- Frühbeck, G.; Busetto, L.; Dicker, D.; Yumuk, V.; Goossens, G.H.; Hebebrand, J.; Halford, J.G.C.; Farpour-Lambert, N.J.; Blaak, E.E.; Woodward, E.; et al. The ABCD of obesity: An EASO Position Statement on a diagnostic term with clinical and scientific implications. Obes. Facts 2019, 12, 131–136. [Google Scholar] [CrossRef] [PubMed]
- de Heredia, F.P.; Gómez-Martínez, S.; Marcos, A. Obesity, inflammation and the immune system. Proc. Nutr. Soc. 2012, 71, 332–338. [Google Scholar] [CrossRef]
- Yárnoz-Esquiroz, P.; Olazarán, L.; Aguas-Ayesa, M.; Perdomo, C.M.; García-Goñi, M.; Silva, C.; Fernández-Formoso, J.A.; Escalada, J.; Montecucco, F.; Portincasa, P.; et al. ‘Obesities’: Position statement on a complex disease entity with multifaceted drivers. Eur. J. Clin. Investig. 2022, 52, e13811. [Google Scholar] [CrossRef] [PubMed]
- Cooremans, K.; Geuens, M.; Pandelaere, M. Cross-national investigation of the drivers of obesity: Re-assessment of past findings and avenues for the future. Appetite 2017, 114, 360–367. [Google Scholar] [CrossRef] [PubMed]
- Mozaffarian, D. The White House Conference on hunger, nutrition, and health—A new national strategy. N. Engl. J. Med. 2022, 387, 2014–2017. [Google Scholar] [CrossRef] [PubMed]
- Perdomo, C.M.; Frühbeck, G.; Escalada, J. Impact of nutritional changes on nonalcoholic fatty liver disease. Nutrients 2019, 11, 677. [Google Scholar] [CrossRef]
- Perdomo, C.M.; Cohen, R.V.; Sumithran, P.; Clément, K.; Frühbeck, G. Contemporary medical, device, and surgical therapies for obesity in adults. Lancet 2023, 401, 1116–1130. [Google Scholar] [CrossRef] [PubMed]
- Hill, J.O.; Wyatt, H.R.; Peters, J.C. Energy balance and obesity. Circulation 2012, 126, 126–132. [Google Scholar] [CrossRef]
- Shan, Z.; Wang, F.; Li, Y.; Baden, M.Y.; Bhupathiraju, S.N.; Wang, D.D.; Sun, Q.; Rexrode, K.M.; Rimm, E.B.; Qi, L.; et al. Healthy eating patterns and risk of total and cause-specific mortality. JAMA Intern. Med. 2023, 183, 142–153. [Google Scholar] [CrossRef]
- Hall, K.D.; Heymsfield, S.B.; Kemnitz, J.W.; Klein, S.; Schoeller, D.A.; Speakman, J.R. Energy balance and its components: Implications for body weight regulation. Am. J. Clin. Nutr. 2012, 95, 989–994. [Google Scholar] [CrossRef]
- Soares, M.J.; Müller, M.J. Resting energy expenditure and body composition: Critical aspects for clinical nutrition. Eur. J. Clin. Nutr. 2018, 72, 1208–1214. [Google Scholar] [CrossRef]
- Kenny, G.P.; Notley, S.R.; Gagnon, D. Direct calorimetry: A brief historical review of its use in the study of human metabolism and thermoregulation. Eur. J. Appl. Physiol. 2017, 117, 1765–1785. [Google Scholar] [CrossRef]
- Westerterp, K.R. Exercise, energy expenditure and energy balance, as measured with doubly labelled water. Proc. Nutr. Soc. 2018, 77, 4–10. [Google Scholar] [CrossRef] [PubMed]
- Lam, Y.Y.; Ravussin, E. Indirect calorimetry: An indispensable tool to understand and predict obesity. Eur. J. Clin. Nutr. 2017, 71, 318–322. [Google Scholar] [CrossRef] [PubMed]
- Biltoft-Jensen, A.; Matthiessen, J.; Hess Ygil, K.; Christensen, T. Defining energy-dense, nutrient-poor food and drinks and estimating the amount of discretionary energy. Nutrients 2022, 14, 1477. [Google Scholar] [CrossRef]
- Gomez-Ambrosi, J.; Gallego-Escuredo, J.M.; Catalan, V.; Rodriguez, A.; Domingo, P.; Moncada, R.; Valenti, V.; Salvador, J.; Giralt, M.; Villarroya, F.; et al. FGF19 and FGF21 serum concentrations in human obesity and type 2 diabetes behave differently after diet- or surgically-induced weight loss. Clin. Nutr. 2017, 36, 861–868. [Google Scholar] [CrossRef] [PubMed]
- Fields, D.A.; Higgins, P.B.; Radley, D. Air-displacement plethysmography: Here to stay. Curr. Opin. Clin. Nutr. Metab. Care 2005, 8, 624–629. [Google Scholar] [CrossRef] [PubMed]
- Gomez-Ambrosi, J.; Gonzalez-Crespo, I.; Catalan, V.; Rodriguez, A.; Moncada, R.; Valenti, V.; Romero, S.; Ramirez, B.; Silva, C.; Gil, M.J.; et al. Clinical usefulness of abdominal bioimpedance (ViScan) in the determination of visceral fat and its application in the diagnosis and management of obesity and its comorbidities. Clin. Nutr. 2018, 37, 580–589. [Google Scholar] [CrossRef] [PubMed]
- Johansson, G.; Westerterp, K.R. Assessment of the physical activity level with two questions: Validation with doubly labeled water. Int. J. Obes. 2008, 32, 1031–1033. [Google Scholar] [CrossRef] [PubMed]
- Wrieden, W.L.; Barton, K.L.; Cochrane, L.; Adamson, A.J. Calculation and Collation of Typical Food Portion Sizes for Adults Aged 19–64 and Older People Aged 65 and Over; Final Technical Report to the Food Standards Agency; Food Standards Agency: London, UK, 2006; Volume 5. [Google Scholar]
- Kennedy, G.; Ballard, T.; Dop, M.E. Guidelines for Measuring Household and Individual Dietary Diversity; Food and Agriculture Organization of the United Nations: Rome, Italy, 2013. [Google Scholar]
- Hu, F.B. Dietary pattern analysis: A new direction in nutritional epidemiology. Curr. Opin. Lipidol. 2002, 13, 3–9. [Google Scholar] [CrossRef] [PubMed]
- Newby, P.K.; Tucker, K.L. Empirically derived eating patterns using factor or cluster analysis: A review. Nutr. Rev. 2004, 62, 177–203. [Google Scholar] [CrossRef] [PubMed]
- Hoffmann, K.; Schulze, M.B.; Schienkiewitz, A.; Nöthlings, U.; Boeing, H. Application of a new statistical method to derive dietary patterns in nutritional epidemiology. Am. J. Epidemiol. 2004, 159, 935–944. [Google Scholar] [CrossRef]
- Lazarova, S.V.; Jessri, M. Associations between dietary patterns and cardiovascular disease risk in Canadian adults: A comparison of partial least squares, reduced rank regression, and the simplified dietary pattern technique. Am. J. Clin. Nutr. 2022, 116, 362–377. [Google Scholar] [CrossRef] [PubMed]
- Carter, J.L.; Lewington, S.; Piernas, C.; Bradbury, K.; Key, T.J.; Jebb, S.A.; Arnold, M.; Bennett, D.; Clarke, R. Reproducibility of dietary intakes of macronutrients, specific food groups, and dietary patterns in 211 050 adults in the UK Biobank study. J. Nutr. Sci. 2019, 8, e34. [Google Scholar] [CrossRef] [PubMed]
- Frühbeck, G.; Catalán, V.; Rodríguez, A.; Ramírez, B.; Becerril, S.; Salvador, J.; Colina, I.; Gómez-Ambrosi, J. Adiponectin-leptin ratio is a functional biomarker of adipose tissue inflammation. Nutrients 2019, 11, 454. [Google Scholar] [CrossRef]
- Frühbeck, G.; Alonso, R.; Marzo, F.; Santidrián, S. A modified method for the indirect quantitative analysis of phytate in foodstuffs. Anal. Biochem. 1995, 225, 206–212. [Google Scholar] [CrossRef] [PubMed]
- Moreno-Navarrete, J.M.; Escote, X.; Ortega, F.; Serino, M.; Campbell, M.; Michalski, M.C.; Laville, M.; Xifra, G.; Luche, E.; Domingo, P.; et al. A role for adipocyte-derived lipopolysaccharide-binding protein in inflammation- and obesity-associated adipose tissue dysfunction. Diabetologia 2013, 56, 2524–2537. [Google Scholar] [CrossRef] [PubMed]
- Katz, A.; Nambi, S.S.; Mather, K.; Baron, A.D.; Follmann, D.A.; Sullivan, G.; Quon, M.J. Quantitative insulin sensitivity check index: A simple, accurate method for assessing insulin sensitivity in humans. J. Clin. Endocrinol. Metab. 2000, 85, 2402–2410. [Google Scholar] [CrossRef]
- Matthews, D.R.; Hosker, J.P.; Rudenski, A.S.; Naylor, B.A.; Treacher, D.F.; Turner, R.C. Homeostasis model assessment: Insulin resistance and β-cell function from fasting plasma glucose and insulin concentrations in man. Diabetologia 1985, 28, 412–419. [Google Scholar] [CrossRef] [PubMed]
- Gayoso-Diz, P.; Otero-González, A.; Rodriguez-Alvarez, M.X.; Gude, F.; García, F.; De Francisco, A.; Quintela, A.G. Insulin resistance (HOMA-IR) cut-off values and the metabolic syndrome in a general adult population: Effect of gender and age: EPIRCE cross-sectional study. BMC Endocr. Disord. 2013, 13, 47. [Google Scholar] [CrossRef]
- Tahapary, D.L.; Pratisthita, L.B.; Fitri, N.A.; Marcella, C.; Wafa, S.; Kurniawan, F.; Rizka, A.; Tarigan, T.J.E.; Harbuwono, D.S.; Purnamasari, D.; et al. Challenges in the diagnosis of insulin resistance: Focusing on the role of HOMA-IR and Tryglyceride/glucose index. Diabetes Metab. Syndr. Obes. 2022, 16, 102581. [Google Scholar] [CrossRef] [PubMed]
- Sabater, M.; Moreno-Navarrete, J.M.; Ortega, F.J.; Pardo, G.; Salvador, J.; Ricart, W.; Frühbeck, G.; Fernández-Real, J.M. Circulating pigment epithelium-derived factor levels are associated with insulin resistance and decrease after weight loss. J. Clin. Endocrinol. Metab. 2010, 95, 4720–4728. [Google Scholar] [CrossRef]
- Catalán, V.; Gómez-Ambrosi, J.; Rodríguez, A.; Ramírez, B.; Rotellar, F.; Valentí, V.; Silva, C.; Gil, M.J.; Fernández-Real, J.M.; Salvador, J.; et al. Increased levels of calprotectin in obesity are related to macrophage content: Impact on inflammation and effect of weight loss. Mol. Med. 2011, 17, 1157–1167. [Google Scholar] [CrossRef] [PubMed]
- Rodríguez, A.; Gómez-Ambrosi, J.; Catalán, V.; Rotellar, F.; Valentí, V.; Silva, C.; Mugueta, C.; Pulido, M.R.; Vázquez, R.; Salvador, J.; et al. The ghrelin O-acyltransferase-ghrelin system reduces TNF-α-induced apoptosis and autophagy in human visceral adipocytes. Diabetologia 2012, 55, 3038–3050. [Google Scholar] [CrossRef] [PubMed]
- Muruzábal, F.J.; Frühbeck, G.; Gómez-Ambrosi, J.; Archanco, M.; Burrell, M.A. Immunocytochemical detection of leptin in non-mammalian vertebrate stomach. Gen. Comp. Endocrinol. 2002, 128, 149–152. [Google Scholar] [CrossRef] [PubMed]
- Smith, A.D.; Emmett, P.M.; Newby, P.K.; Northstone, K. Dietary patterns obtained through principal components analysis: The effect of input variable quantification. Br. J. Nutr. 2013, 109, 1881–1891. [Google Scholar] [CrossRef] [PubMed]
- Lemon, S.C.; Rosal, M.C.; Zapka, J.; Borg, A.; Andersen, V. Contributions of weight perceptions to weight loss attempts: Differences by body mass index and gender. Body Image 2009, 6, 90–96. [Google Scholar] [CrossRef] [PubMed]
- Pagoto, S.L.; Schneider, K.L.; Oleski, J.L.; Luciani, J.M.; Bodenlos, J.S.; Whited, M.C. Male inclusion in randomized controlled trials of lifestyle weight loss interventions. Obesity 2012, 20, 1234–1239. [Google Scholar] [CrossRef] [PubMed]
- Calder, P.C.; Ahluwalia, N.; Brouns, F.; Buetler, T.; Clement, K.; Cunningham, K.; Esposito, K.; Jönsson, L.S.; Kolb, H.; Lansink, M.; et al. Dietary factors and low-grade inflammation in relation to overweight and obesity. Br. J. Nutr. 2011, 106, S5–S78. [Google Scholar] [CrossRef]
- Maimaitiyiming, M.; Yang, H.; Zhou, L.; Zhang, X.; Cai, Q.; Wang, Y. Associations between an obesity-related dietary pattern and incidence of overall and site-specific cancers: A prospective cohort study. BMC Med. 2023, 21, 251. [Google Scholar] [CrossRef]
- Maimaitiyiming, M.; Yang, H.; Li, H.; Xu, C.; Li, S.; Zhou, L.; Zhang, X.; Wang, Y. The association of obesity-related dietary patterns and main food groups derived by reduced-rank regression with cardiovascular diseases incidence and all-cause mortality: Findings from 116,711 adults. Eur. J. Nutr. 2023, 62, 2605–2619. [Google Scholar] [CrossRef]
- Dicken, S.J.; Batterham, R.L. The role of diet quality in mediating the association between ultra-processed food intake, obesity and health-related outcomes: A review of prospective cohort studies. Nutrients 2021, 14, 23. [Google Scholar] [CrossRef]
- White, A.M. Gender differences in the epidemiology of alcohol use and related harms in the United States. Alcohol Res. 2020, 40, 1–3. [Google Scholar] [CrossRef]
- Mannisto, S.; Uusitalo, K.; Roos, E.; Fogelholm, M.; Pietinen, P. Alcohol beverage drinking, diet and body mass index in a cross-sectional survey. Eur. J. Clin. Nutr. 1997, 51, 326–332. [Google Scholar] [CrossRef] [PubMed]
- Kleiner, K.D.; Gold, M.S.; Frost-Pineda, K.; Lenz-Brunaman, B.; Perri, M.G.; Jacobs, W.S. Body mass index and alcohol use. J. Addict. Dis. 2004, 23, 105–118. [Google Scholar] [CrossRef]
- Volkow, N.D.; Michaelides, M.; Baler, R. The neuroscience of drug reward and addiction. Physiol. Rev. 2019, 99, 2115–2140. [Google Scholar] [CrossRef] [PubMed]
- Leibowitz, S.F. Regulation and effects of hypothalamic galanin: Relation to dietary fat, alcohol ingestion, circulating lipids and energy homeostasis. Neuropeptides 2005, 39, 327–332. [Google Scholar] [CrossRef]
- Karatayev, O.; Barson, J.R.; Carr, A.J.; Baylan, J.; Chen, Y.W.; Leibowitz, S.F. Predictors of ethanol consumption in adult Sprague-Dawley rats: Relation to hypothalamic peptides that stimulate ethanol intake. Alcohol 2010, 44, 323–334. [Google Scholar] [CrossRef] [PubMed][Green Version]
- MacKillop, J.; Agabio, R.; Feldstein Ewing, S.W.; Heilig, M.; Kelly, J.F.; Leggio, L.; Lingford-Hughes, A.; Palmer, A.A.; Parry, C.D.; Ray, L.; et al. Hazardous drinking and alcohol use disorders. Nat. Rev. Dis. Primers 2022, 8, 80. [Google Scholar] [CrossRef] [PubMed]
- Marcos, A.; Serra-Majem, L.; Pérez-Jiménez, F.; Pascual, V.; Tinahones, F.J.; Estruch, R. Moderate consumption of beer and its effects on cardiovascular and metabolic health: An updated review of recent scientific evidence. Nutrients 2021, 13, 879. [Google Scholar] [CrossRef]
- Piano, M.R.; Thur, L.A.; Hwang, C.L.; Phillips, S.A. Effects of alcohol on the cardiovascular system in women. Alcohol Res. 2020, 40, 12. [Google Scholar] [CrossRef] [PubMed]
- Breslow, R.A.; Smothers, B.A. Drinking patterns and body mass index in never smokers: National Health Interview Survey, 1997–2001. Am. J. Epidemiol. 2005, 161, 368–376. [Google Scholar] [CrossRef]
- Kerr, W.C.; Greenfield, T.K.; Tujague, J.; Brown, S.E. A drink is a drink? Variation in the amount of alcohol contained in beer, wine and spirits drinks in a US methodological sample. Alcohol. Clin. Exp. Res. 2005, 29, 2015–2021. [Google Scholar] [CrossRef] [PubMed]
- Kerr, W.C.; Greenfield, T.K.; Tujague, J. Estimates of the mean alcohol concentration of the spirits, wine, and beer sold in the United States and per capita consumption: 1950 to 2002. Alcohol. Clin. Exp. Res. 2006, 30, 1583–1591. [Google Scholar] [CrossRef] [PubMed]
- Tujague, J.; Kerr, W.C. Energy intake estimates of respondent-measured alcoholic beverages. Alcohol Alcohol. 2009, 44, 34–41. [Google Scholar] [CrossRef] [PubMed]
- Lukasiewicz, E.; Mennen, L.I.; Bertrais, S.; Arnault, N.; Preziosi, P.; Galan, P.; Hercberg, S. Alcohol intake in relation to body mass index and waist-to-hip ratio: The importance of type of alcoholic beverage. Public Health Nutr. 2005, 8, 315–320. [Google Scholar] [CrossRef] [PubMed]
- Pirola, R.C.; Lieber, C.S. The energy cost of the metabolism of drugs, including ethanol. Pharmacology 1972, 7, 185–196. [Google Scholar] [CrossRef]
- Kromhout, D. Energy and macronutrient intake in lean and obese middle-aged men (the Zutphen study). Am. J. Clin. Nutr. 1983, 37, 295–299. [Google Scholar] [CrossRef] [PubMed]
- Butler, J.L.; Gordon-Larsen, P.; Steffen, L.M.; Shikany, J.M.; Jacobs, D.R.J.; Popkin, B.M.; Poti, J.M. Associations of 5-year changes in alcoholic beverage intake with 5-year changes in waist circumference and BMI in the Coronary Artery Risk Development in Young Adults (CARDIA) study. PLoS ONE 2023, 18, e0281722. [Google Scholar] [CrossRef] [PubMed]
- Room, R. Measuring drinking patterns: The experience of the last half century. J. Subst. Abus. 2000, 12, 23–31. [Google Scholar] [CrossRef]
- Rasaei, N.; Hosseininasab, D.; Shiraseb, F.; Gholami, F.; Noori, S.; Ghaffarian-Ensaf, R.; Daneshzad, E.; Clark, C.C.T.; Mirzaei, K. The association between healthy beverage index and healthy and unhealthy obesity phenotypes among obese women: A cross-sectional study. Int. J. Clin. Pract. 2022, 2022, 7753259. [Google Scholar] [CrossRef]
- Newby, P.K.; Muller, D.; Hallfrisch, J.; Qiao, N.; Andres, R.; Tucker, K.L. Dietary patterns and changes in body mass index and waist circumference in adults. Am. J. Clin. Nutr. 2003, 77, 1417–1425. [Google Scholar] [CrossRef] [PubMed]
- Villegas, R.; Yang, G.; Gao, Y.T.; Cai, H.; Li, H.; Zheng, W.; Shu, X.O. Dietary patterns are associated with lower incidence of type 2 diabetes in middle-aged women: The Shanghai Women’s Health Study. Int. J. Epidemiol. 2010, 39, 889–899. [Google Scholar] [CrossRef] [PubMed]
- Ng, M.; Fleming, T.; Robinson, M.; Thomson, B.; Graetz, N.; Margono, C.; Mullany, E.C.; Biryukov, S.; Abbafati, C.; Abera, S.F.; et al. Global, regional, and national prevalence of overweight and obesity in children and adults during 1980–2013: A systematic analysis for the Global Burden of Disease Study 2013. Lancet 2014, 384, 766–781. [Google Scholar] [CrossRef] [PubMed]
- Kimokoti, R.W.; Millen, B.E. Nutrition for the prevention of chronic diseases. Med. Clin. N. Am. 2016, 100, 1185–1198. [Google Scholar] [CrossRef]
- Sweetman, A.K.; Carter, J.; Perez-Cornago, A.; Gao, M.; Jebb, S.A.; Piernas, C. Dietary pattern adherence in association with changes in body composition and adiposity measurements in the UK Biobank study. Obes. Res. Clin. Pract. 2023, 17, 233–241. [Google Scholar] [CrossRef] [PubMed]
- Bergmann, M.M.; Schutze, M.; Steffen, A.; Boeing, H.; Halkjaer, J.; Tjonneland, A.; Travier, N.; Agudo, A.; Slimani, N.; Rinaldi, S.; et al. The association of lifetime alcohol use with measures of abdominal and general adiposity in a large-scale European cohort. Eur. J. Clin. Nutr. 2011, 65, 1079–1087. [Google Scholar] [CrossRef] [PubMed]
- Casazza, K.; Brown, A.; Astrup, A.; Bertz, F.; Baum, C.; Brown, M.B.; Dawson, J.; Durant, N.; Dutton, G.; Fields, D.A.; et al. Weighing the evidence of common beliefs in obesity research. Crit. Rev. Food Sci. Nutr. 2015, 55, 2014–2053. [Google Scholar] [CrossRef] [PubMed]
- Bellisle, F.; McDevitt, R.; Prentice, A.M. Meal frequency and energy balance. Br. J. Nutr. 1997, 77 (Suppl. S1), S57–S70. [Google Scholar] [CrossRef] [PubMed]
- Bellisle, F. Edograms: Recording the microstructure of meal intake in humans-a window on appetite mechanisms. Int. J. Obes. 2020, 44, 2347–2357. [Google Scholar] [CrossRef] [PubMed]
- Theis, D.R.Z.; White, M. Is Obesity Policy in England Fit for Purpose? Analysis of Government Strategies and Policies, 1992–2020. Milbank Q. 2021, 99, 126–170. [Google Scholar] [CrossRef]


| Variables | Mean ± SEM (n = 200) |
|---|---|
| Sex (males/females) | 56/144 |
| Age (years) | 38 ± 12 |
| BMI (kg/m2) | 32.2 ± 3.5 |
| Body fat (%) | 40.0 ± 4.3 |
| Visceral adiposity (a.u.) | 13.9 ± 3.7 |
| WC (cm) | 97 ± 15 |
| Systolic BP (mm Hg) | 131 ± 16 |
| Diastolic BP (mm Hg) | 85 ± 10 |
| Glucose (mg/dL) | 98 ± 17 |
| Insulin (μU/mL) | 11.9 ± 3.5 |
| HOMA-IR | 2.87 ± 0.91 |
| QUICKI | 0.330 ±0.044 |
| Triglycerides (mg/dL) | 103 ± 10 |
| Total cholesterol (mg/dL) | 208 ± 22 |
| HDL-cholesterol (mg/dL) | 53 ± 8 |
| LDL-cholesterol (mg/dL) | 130 ± 9 |
| Free fatty acids (mEq/L) | 0.5 ± 0.1 |
| Creatinine (mg/dL) | 0.80 ± 0.11 |
| Uric acid (mg/dL) | 4.5 ± 0.2 |
| Urea (mg/dL) | 12.4 ± 1.3 |
| ALT (UI/L) | 19 ± 7 |
| AST (UI/L) | 25 ± 8 |
| AP (UI/L) | 66 ± 9 |
| GGT (UI/L) | 28 ± 9 |
| Leptin (ng/mL) | 36.5 ± 6.1 |
| Adiponectin (μg/mL) | 6.7 ± 2.1 |
| Osteopontin (ng/mL) | 68.8 ± 9.4 |
| Lipocalin 2 (ng/mL) | 70.2 ± 3.6 |
| Tenascin C (ng/mL) | 63.1 ± 3.7 |
| YKL-40 (ng/mL) | 36.0 ± 4.4 |
| TNF-α (pg/mL) | 6.37 ± 3.52 |
| MCP-1 (pg/mL) | 486 ± 200 |
| IL-1β (pg/mL) | 5.15 ± 1.02 |
| IL-4 (ng/mL) | 3.41 ± 1.18 |
| IL-6 (pg/mL) | 4.42 ± 0.79 |
| IL-8 (pg/mL) | 4.31 ± 1.25 |
| IL-10 (pg/mL) | 6.52 ± 2.38 |
| IL-32 (pg/L) | 10.5 ± 2.3 |
| CRP (mg/L) | 5.3 ± 2.7 |
| vW Factor Ag (%) | 133 ± 28 |
| Homocysteine (μmol/L) | 8.72 ± 0.79 |
| Fibrinogen (mg/dL) | 286 ± 25 |
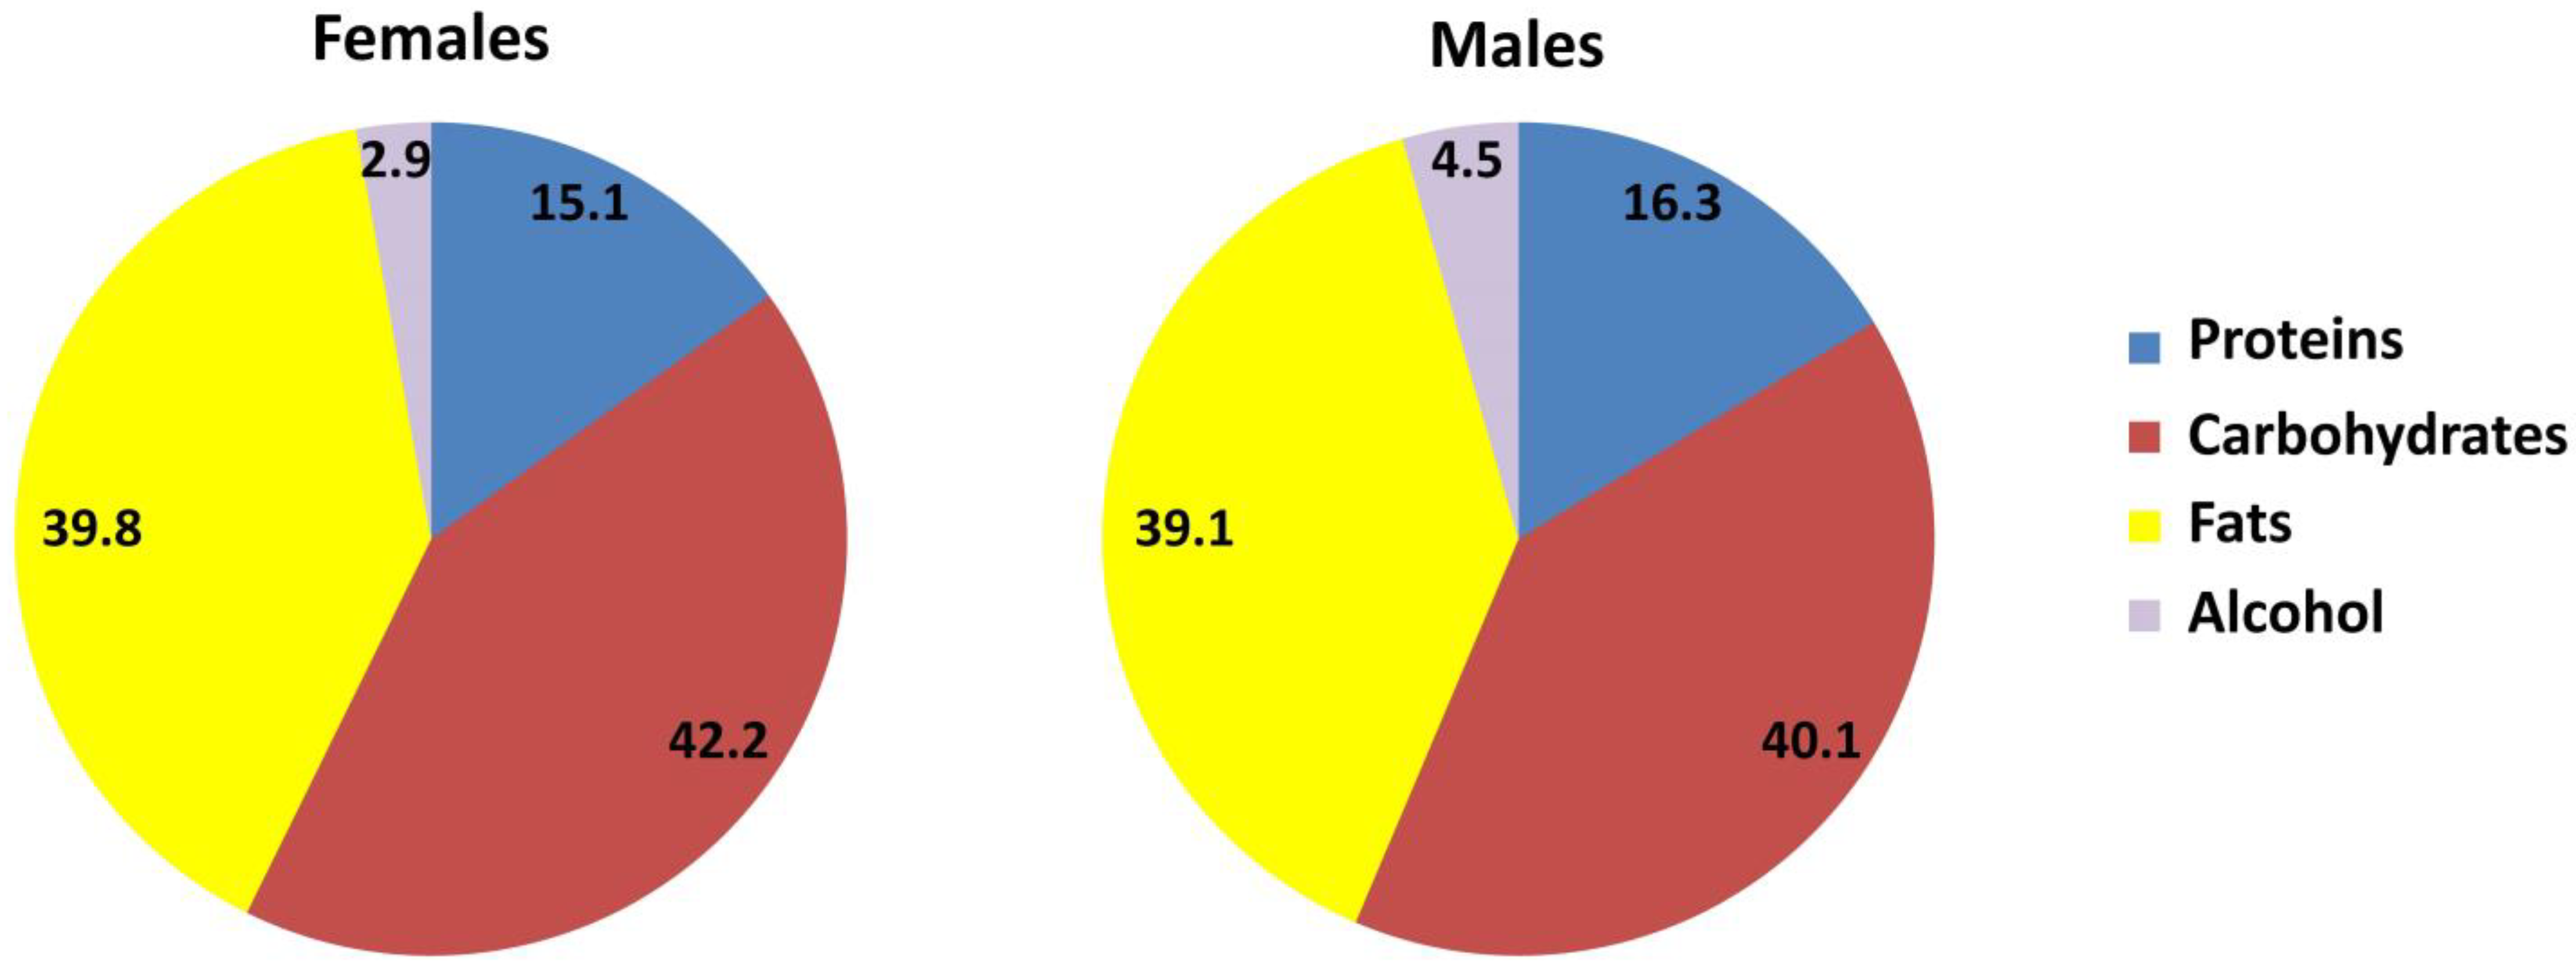
| Energy | Females | Males | Stat. Sign. | ||||
|---|---|---|---|---|---|---|---|
| Mean | Minimum | Maximum | Mean | Minimum | Maximum | ||
| Total energy intake (TEI) (kcal/d) | 2252 | 1219 | 3562 | 2494 | 1915 | 4158 | * |
| EI from alcohol (kcal/d) | 73 | 0 | 430 | 96 | 0 | 482 | * |
| EI from alc. (% of total) | 2.9 | 0 | 12.1 | 4.5 | 0 | 15.4 | * |
| Type of Beverage | Females Frequency (Drinks/Week) | Males Frequency (Drinks/Week) | Stat. Sign. | ||||
|---|---|---|---|---|---|---|---|
| (%) | <1 | 5–7 | (%) | <1 | 5–7 | ||
| Beer | 18.8 | 23.7 | 13.8 # | 41.0 | 48.0 § | 38.6 | * |
| Wine | 69.3 § | 52.6 § | 79.4 § | 46.3 | 31.6 | 51.0 § | * |
| Distillates | 11.9 | 23.7 | 6.9 # | 12.7 § | 20.3 § | 10.5 # | ns |
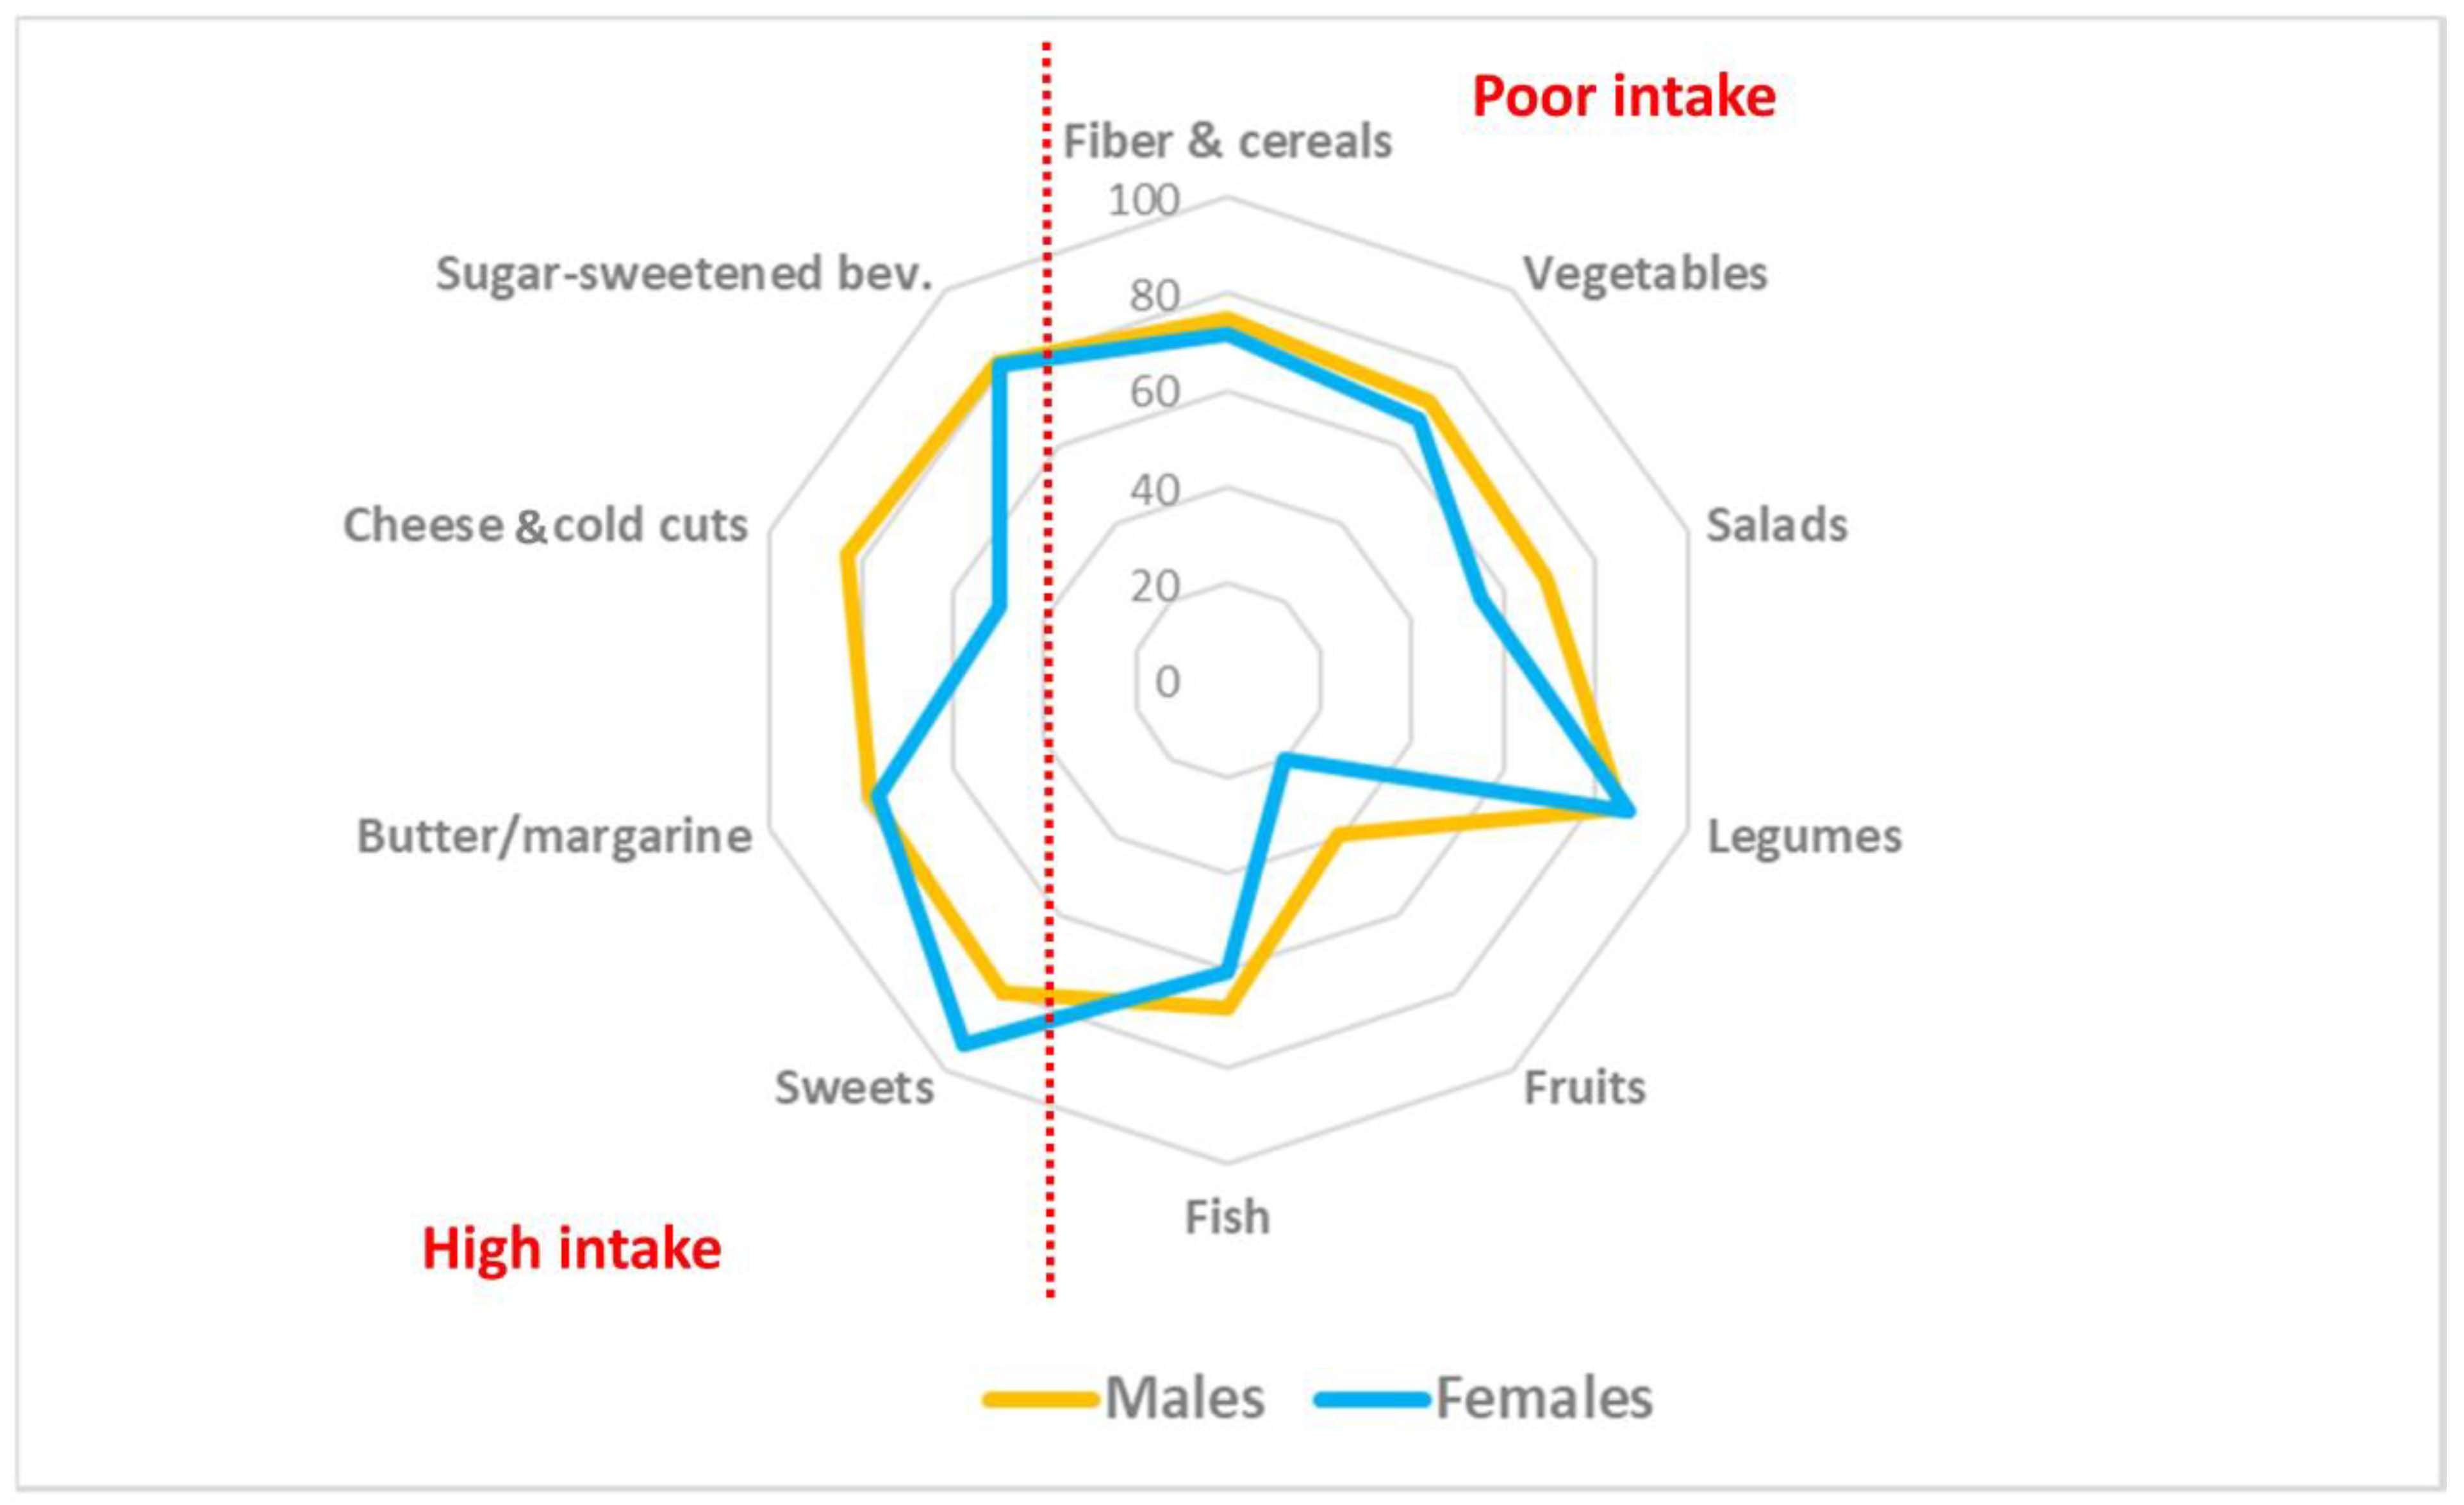
| Diet Poor in | Females Freq. (Drinks/Week) | Males Freq. (Drinks/Week) | Stat. Sign. | ||||
|---|---|---|---|---|---|---|---|
| (%) | <1 | 5–7 | (%) | <1 | 5–7 | ||
| Fib. and cer. | 71.4 § | 70.2 | 79.5 | 74.8 § | 76.3 | 65.8 | ns |
| Vegetables | 66.8 § | 61.3 | 72.0 | 71.0 § | 74.8 | 53.7 # | ns |
| Salads | 55.2 § | 57.5 | 53.1 | 69.4 § | 68.6 | 63.1 | * |
| Legumes | 87.3 § | 85.4 | 89.6 | 85.3 § | 88.7 | 83.6 | ns |
| Fruits | 20.0 | 15.2 | 24.1 # | 39.2 | 39.0 | 38.5 | * |
| Fish | 60.2 | 63.6 | 57.8 | 68.1 | 67.8 | 60.0 | ns |
| Diet High in | Females Fre. (Drinks/Week) | Males Freq. (Drinks/Week) | Stat. Sign. | ||||
|---|---|---|---|---|---|---|---|
| (%) | <1 | 5–7 | (%) | <1 | 5–7 | ||
| Sweets | 93.1 § | 92.4 | 91.7 | 79.6 § | 80.3 | 82.1 | * |
| Solid fats | 76.5 | 75.3 | 77.2 | 77.8 | 79.0 | 75.4 | ns |
| Ch./cold mts | 49.9 § | 50.6 § | 48.8 § | 83.4 § | 81.2 | 84.7 | * |
| Sug.-sw. bev. | 80.7 § | 80.2 | 81.0 | 81.2 § | 80.3 | 83.6 | ns |
Disclaimer/Publisher’s Note: The statements, opinions and data contained in all publications are solely those of the individual author(s) and contributor(s) and not of MDPI and/or the editor(s). MDPI and/or the editor(s) disclaim responsibility for any injury to people or property resulting from any ideas, methods, instructions or products referred to in the content. |
© 2023 by the authors. Licensee MDPI, Basel, Switzerland. This article is an open access article distributed under the terms and conditions of the Creative Commons Attribution (CC BY) license (https://creativecommons.org/licenses/by/4.0/).
Share and Cite
Aguas-Ayesa, M.; Yárnoz-Esquiroz, P.; Olazarán, L.; Perdomo, C.M.; García-Goñi, M.; Andrada, P.; Escalada, J.; Silva, C.; Marcos, A.; Frühbeck, G. Evaluation of Dietary and Alcohol Drinking Patterns in Patients with Excess Body Weight in a Spanish Cohort: Impact on Cardiometabolic Risk Factors. Nutrients 2023, 15, 4824. https://doi.org/10.3390/nu15224824
Aguas-Ayesa M, Yárnoz-Esquiroz P, Olazarán L, Perdomo CM, García-Goñi M, Andrada P, Escalada J, Silva C, Marcos A, Frühbeck G. Evaluation of Dietary and Alcohol Drinking Patterns in Patients with Excess Body Weight in a Spanish Cohort: Impact on Cardiometabolic Risk Factors. Nutrients. 2023; 15(22):4824. https://doi.org/10.3390/nu15224824
Chicago/Turabian StyleAguas-Ayesa, Maite, Patricia Yárnoz-Esquiroz, Laura Olazarán, Carolina M. Perdomo, Marta García-Goñi, Patricia Andrada, Javier Escalada, Camilo Silva, Ascensión Marcos, and Gema Frühbeck. 2023. "Evaluation of Dietary and Alcohol Drinking Patterns in Patients with Excess Body Weight in a Spanish Cohort: Impact on Cardiometabolic Risk Factors" Nutrients 15, no. 22: 4824. https://doi.org/10.3390/nu15224824
APA StyleAguas-Ayesa, M., Yárnoz-Esquiroz, P., Olazarán, L., Perdomo, C. M., García-Goñi, M., Andrada, P., Escalada, J., Silva, C., Marcos, A., & Frühbeck, G. (2023). Evaluation of Dietary and Alcohol Drinking Patterns in Patients with Excess Body Weight in a Spanish Cohort: Impact on Cardiometabolic Risk Factors. Nutrients, 15(22), 4824. https://doi.org/10.3390/nu15224824