
Association between Sugar-Sweetened Beverage Consumption and the Risk of the Metabolic Syndrome: A Systematic Review and Meta-Analysis

 , ,
, ,
Abstract
1. Introduction
2. Materials and Methods
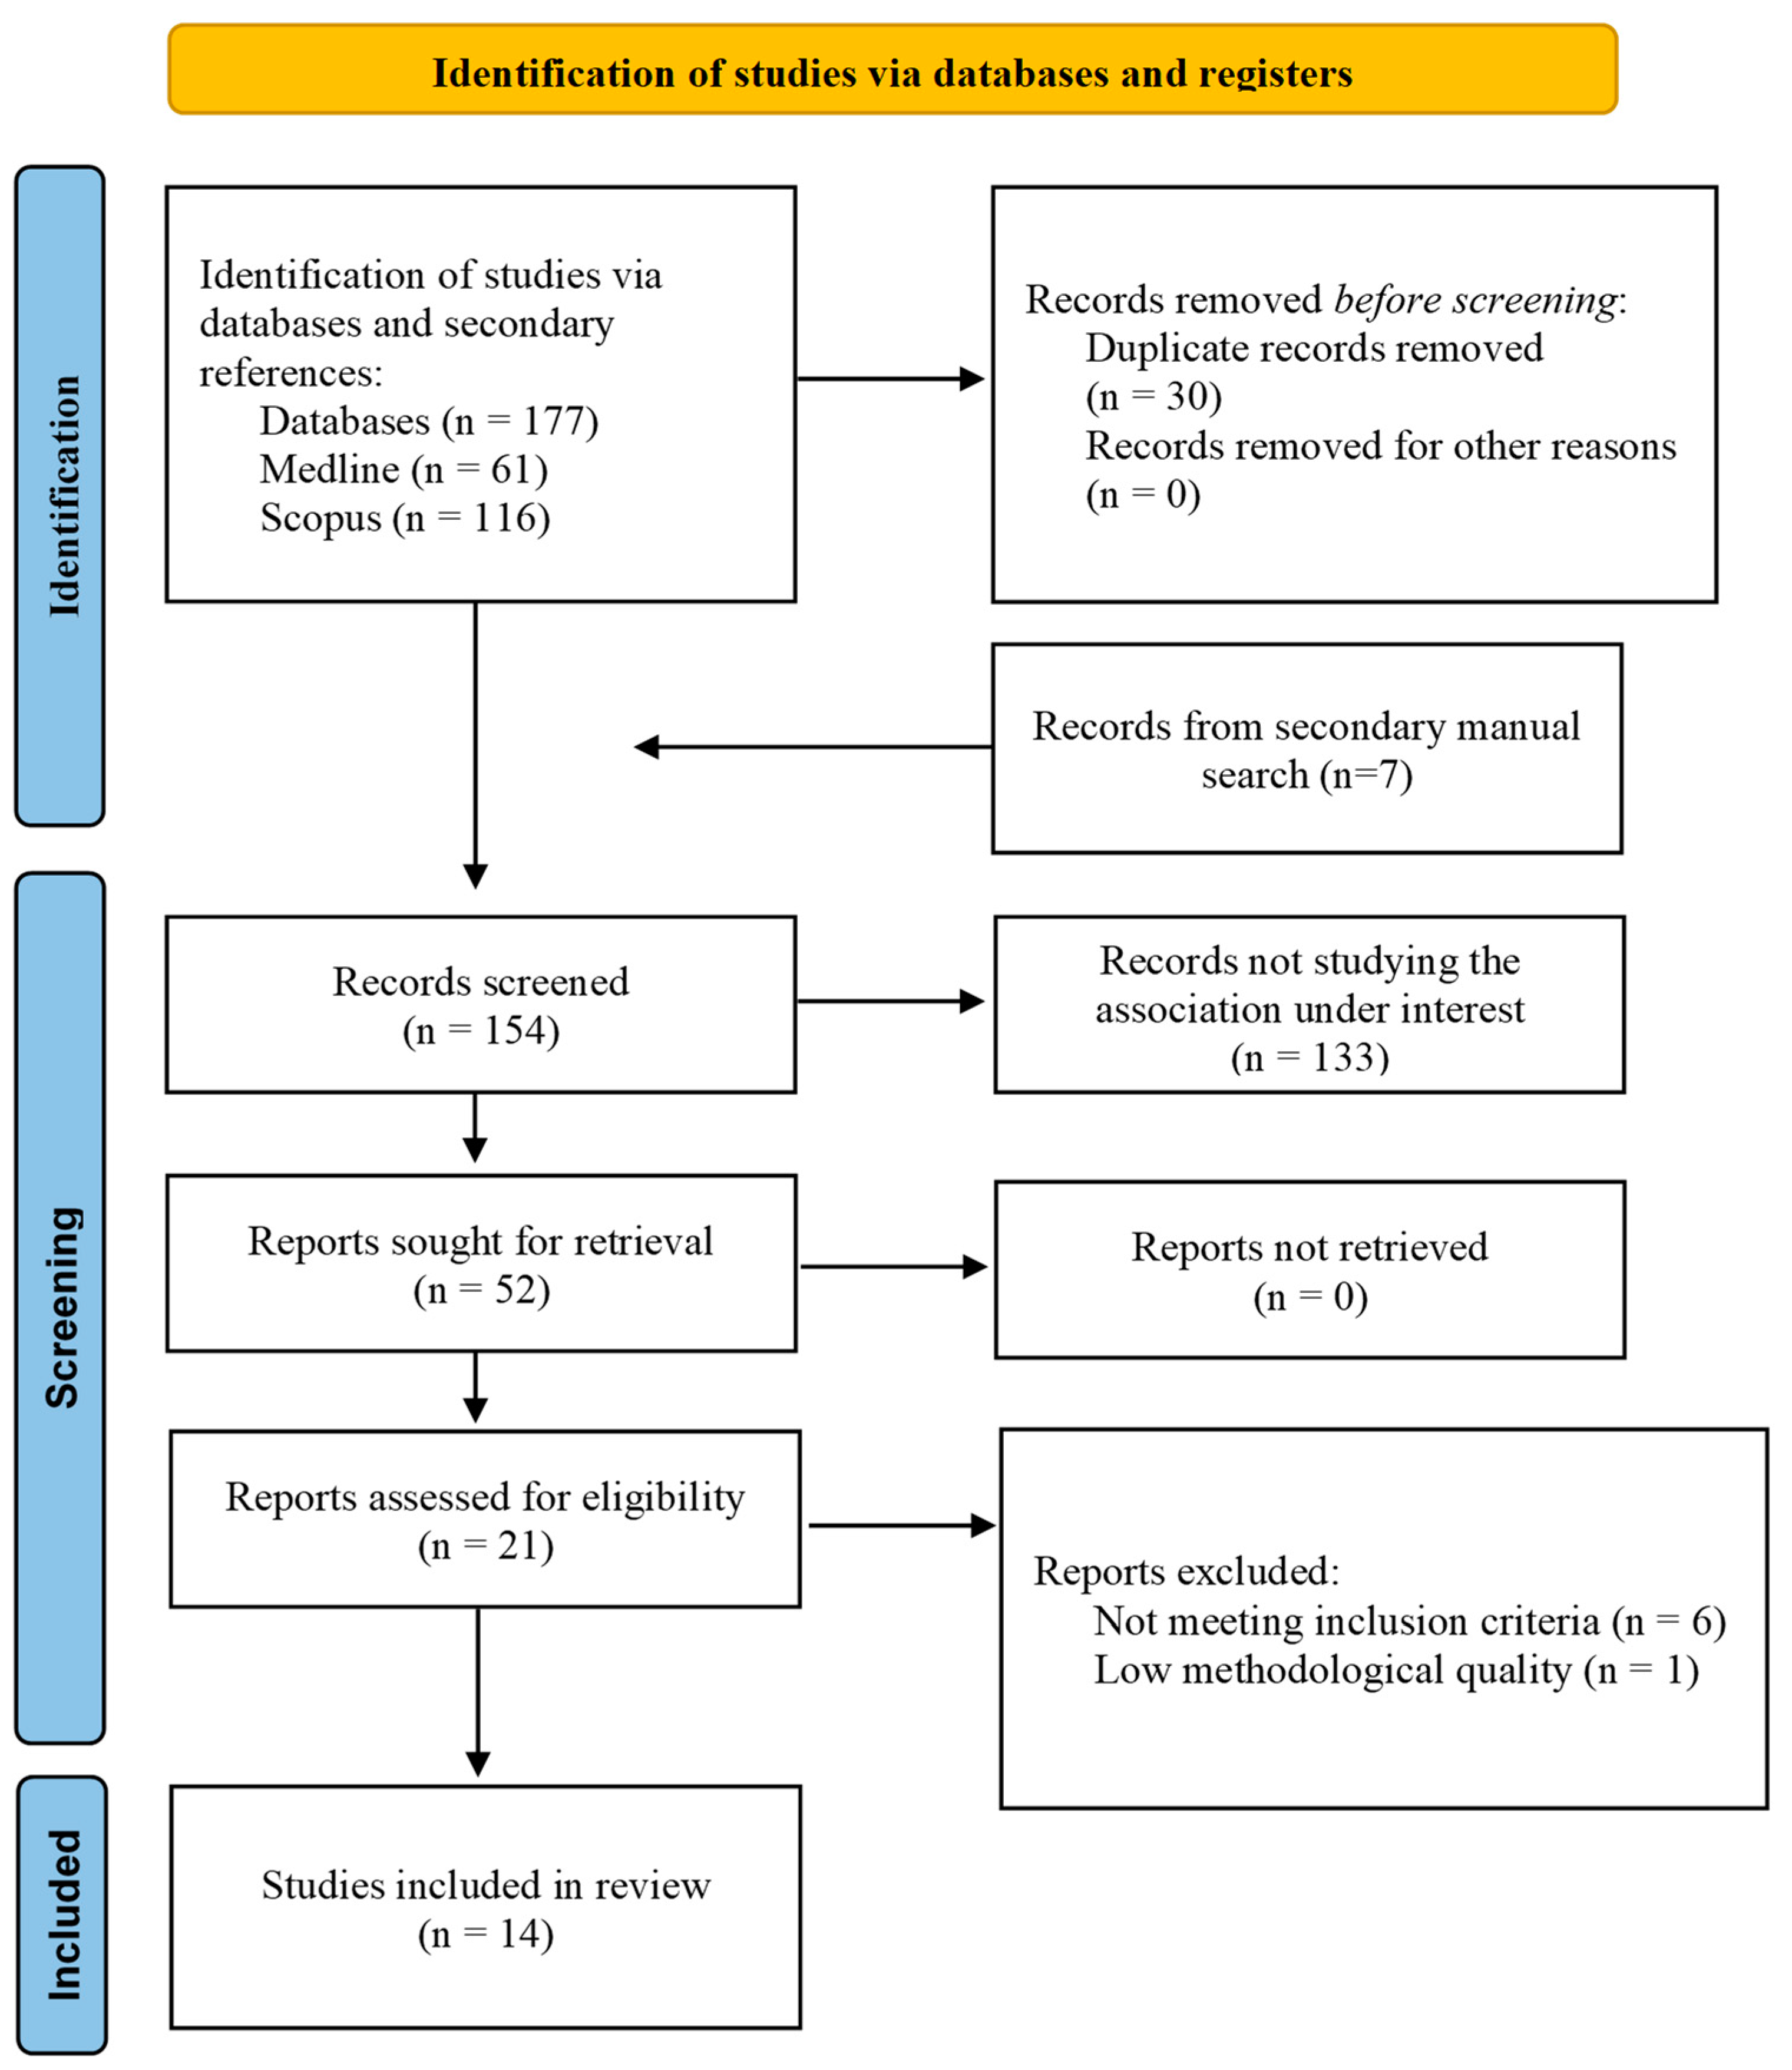
2.1. Data Sources and SEARCHES
2.2. Study Selection
2.3. Data Extraction and Quality Assessment
2.4. Statistical Methods/Analysis
3. Results
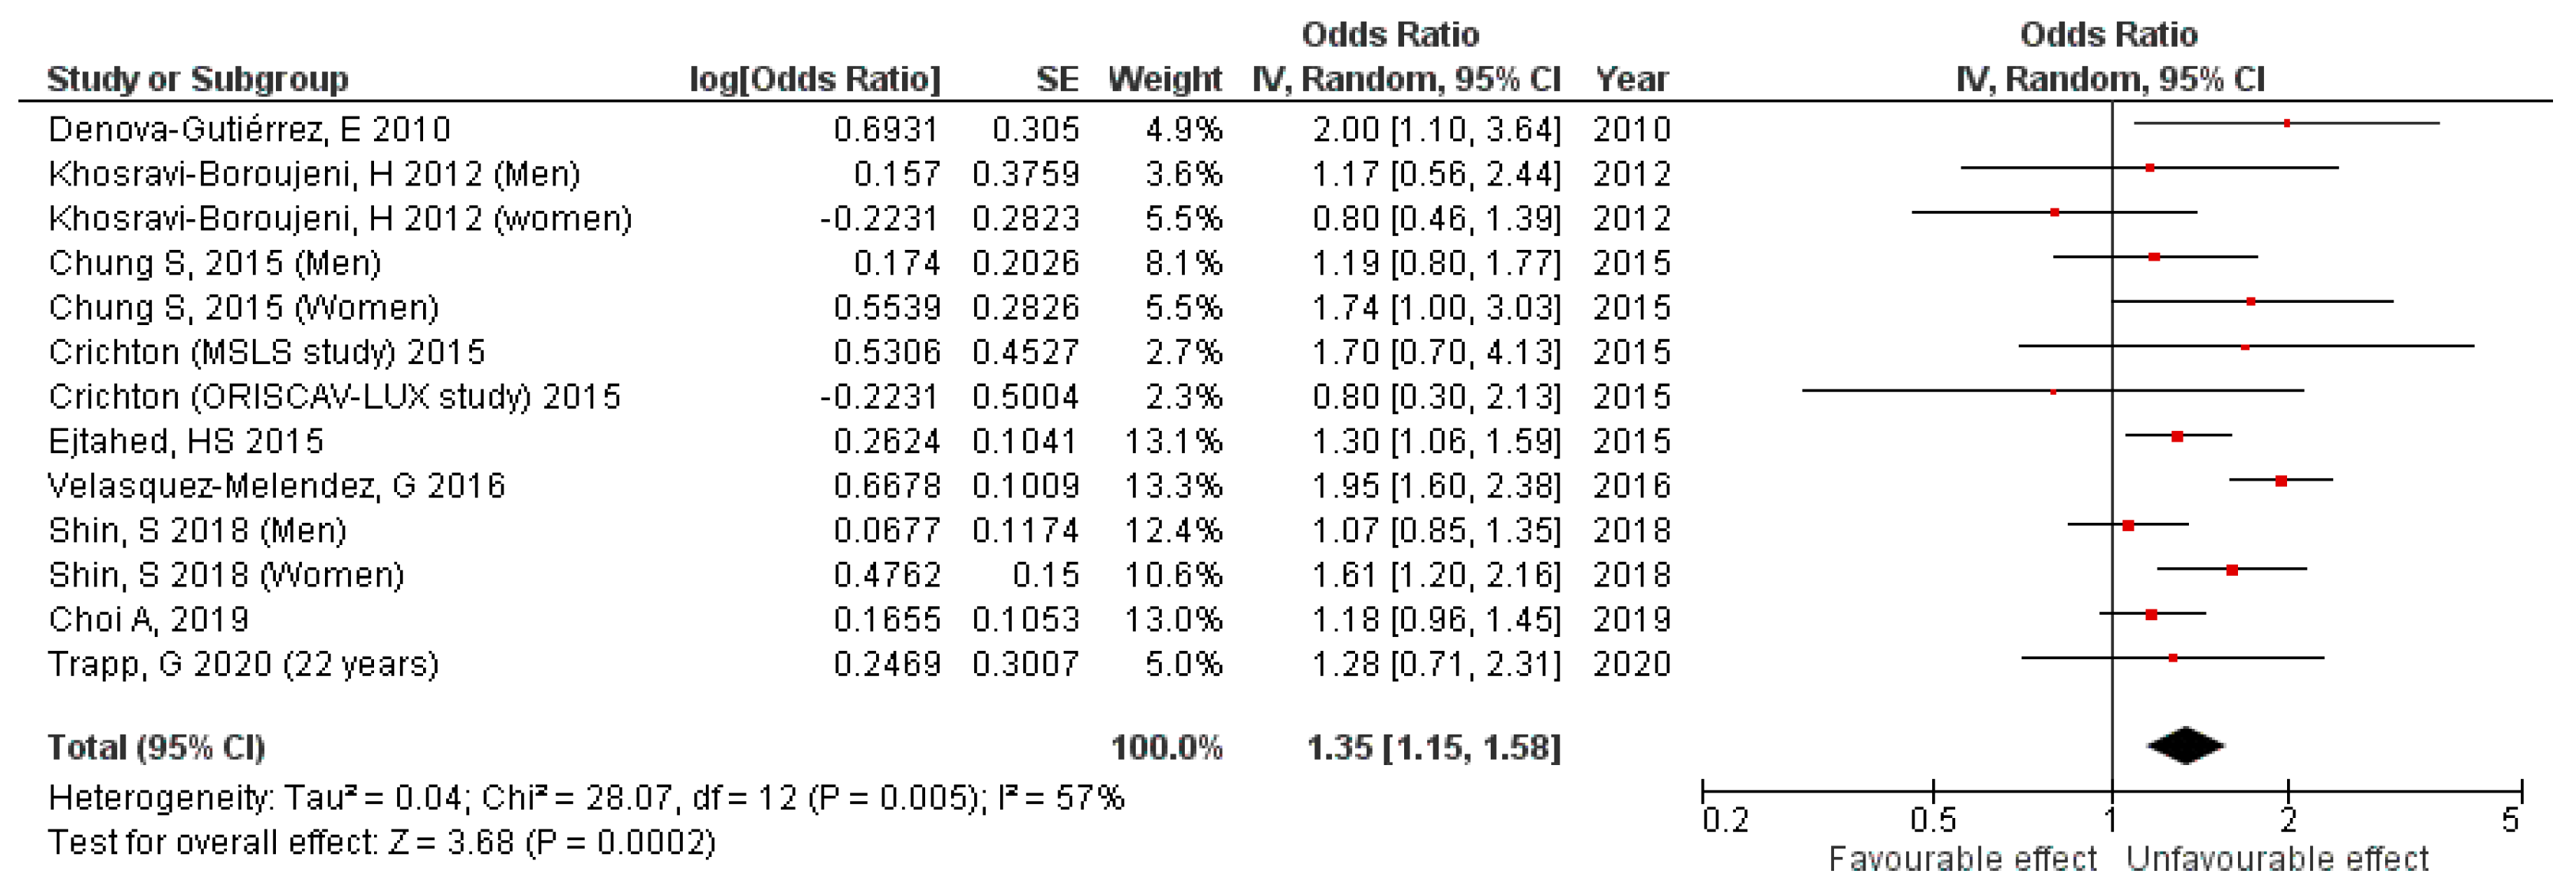
3.1. Cross-Sectional Studies Results
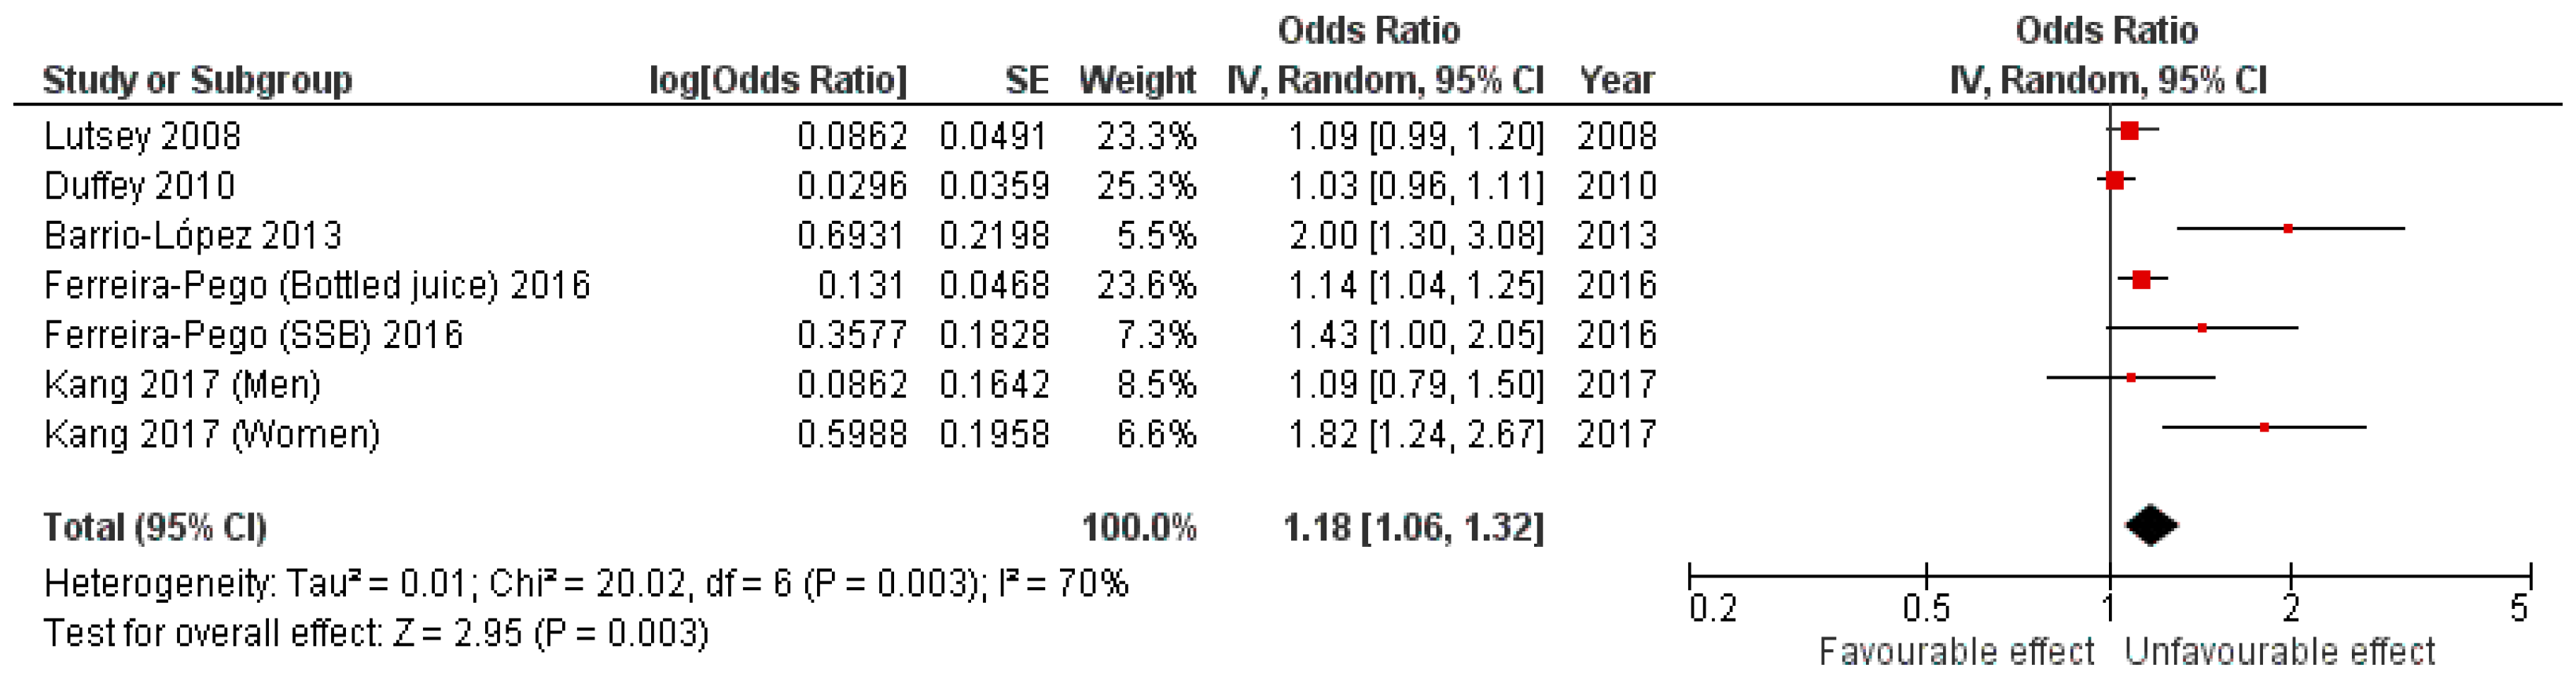
3.2. Cohort Studies Results
4. Discussion
5. Conclusions
Supplementary Materials
Author Contributions
Funding
Institutional Review Board Statement
Informed Consent Statement
Data Availability Statement
Conflicts of Interest
References
- Grundy, S.M.; Cleeman, J.I.; Daniels, S.R.; Donato, K.A.; Eckel, R.H.; Franklin, B.A.; Gordon, D.J.; Krauss, R.M.; Savage, P.J.; Smith, S.C.; et al. Diagnosis and Management of the Metabolic Syndrome. Circulation 2005, 112, 2735–2752. [Google Scholar] [CrossRef] [PubMed]
- National Cholesterol Education Program (US). Third Report of the National Cholesterol Education Program (NCEP) Expert Panel on Detection, Evaluation, and Treatment of High Blood Cholesterol in Adults (Adult Treatment Panel III) Final Report. Circulation 2002, 106, 3143. [Google Scholar] [CrossRef]
- Alberti, K.G.M.M.; Eckel, R.H.; Grundy, S.M.; Zimmet, P.Z.; Cleeman, J.I.; Donato, K.A.; Fruchart, J.-C.; James, W.P.T.; Loria, C.M.; Smith, S.C. Harmonizing the Metabolic Syndrome. Circulation 2009, 120, 1640–1645. [Google Scholar] [CrossRef]
- Cuesta, M.; Fuentes, M.; Rubio, M.; Bordiu, E.; Barabash, A.; Garcia De La Torre, N.; Rojo-Martinez, G.; Valdes, S.; Soriguer, F.; Vendrell, J.J.; et al. Incidence and Regression of Metabolic Syndrome in a Representative Sample of the Spanish Population: Results of the Cohort Di@ Bet. Es Study. BMJ Open Diab. Res. Care 2020, 8, 23. [Google Scholar] [CrossRef]
- Scuteri, A.; Laurent, S.; Cucca, F.; Cockcroft, J.; Cunha, P.G.; Mañas, L.R.; Raso, F.U.M.; Muiesan, M.L.; Ryliškyte, L.; Rietzschel, E.; et al. The metabolic syndrome across europe—Different clusters of risk factors. Eur. J. Prev. Cardiol. 2015, 22, 486. [Google Scholar] [CrossRef] [PubMed]
- Magnitud y Manejo Del Síndrome Metabólico En España En 2008–2010: Estudio ENRICA. Available online: https://www.revespcardiol.org/es-pdf-S0300893213004533 (accessed on 27 October 2022).
- Noubiap, J.J.; Nansseu, J.R.; Lontchi-Yimagou, E.; Nkeck, J.R.; Nyaga, U.F.; Ngouo, A.T.; Tounouga, D.N.; Tianyi, F.-L.; Foka, A.J.; Ndoadoumgue, A.L.; et al. Geographic Distribution of Metabolic Syndrome and Its Components in the General Adult Population: A Meta-Analysis of Global Data from 28 Million Individuals. Diabetes Res. Clin. Pract. 2022, 188, 109924. [Google Scholar] [CrossRef] [PubMed]
- Saklayen, M. The Global Epidemic of the Metabolic Syndrome. Curr. Hypertens. Rep. 2018, 20, 12. [Google Scholar] [CrossRef]
- Get the Facts: Added Sugars|Nutrition|CDC. Available online: https://www.cdc.gov/nutrition/data-statistics/added-sugars.html?CDC_AA_refVal=https%3A%2F%2Fwww.cdc.gov%2Fnutrition%2Fdata-statistics%2Fknow-your-limit-for-added-sugars.html (accessed on 27 October 2022).
- World Health Organization. Guideline: Sugars Intake for Adults and Children; World Health Organization: Geneva, Switzerland, 2015; ISBN 978-92-4-154902-8.
- Ruanpeng, D.; Thongprayoon, C.; Cheungpasitporn, W.; Harindhanavudhi, T. Sugar and Artificially Sweetened Beverages Linked to Obesity: A Systematic Review and Meta-Analysis. Qjm Int. J. Med. 2017, 110, 513–520. [Google Scholar] [CrossRef]
- Hirahatake, K.M.; Jacobs, D.R.; Shikany, J.M.; Jiang, L.; Wong, N.D.; Steffen, L.M.; Odegaard, A.O. Cumulative Intake of Artificially Sweetened and Sugar-Sweetened Beverages and Risk of Incident Type 2 Diabetes in Young Adults: The Coronary Artery Risk Development in Young Adults (CARDIA) Study. Am. J. Clin. Nutr. 2019, 110, 733–741. [Google Scholar] [CrossRef]
- Malik, V.S.; Hu, F.B. Sugar-Sweetened Beverages and Cardiometabolic Health: An Update of the Evidence. Nutrients 2019, 11, 1840. [Google Scholar] [CrossRef]
- Neelakantan, N.; Park, S.H.; Chen, G.C.; van Dam, R.M. Sugar-Sweetened Beverage Consumption, Weight Gain, and Risk of Type 2 Diabetes and Cardiovascular Diseases in Asia: A Systematic Review. Nutr. Rev. 2022, 80, 50–67. [Google Scholar] [CrossRef] [PubMed]
- Ejtahed, H.S.; Bahadoran, Z.; Mirmiran, P.; Azizi, F. Sugar-Sweetened Beverage Consumption Is Associated with Metabolic Syndrome in Iranian Adults: Tehran Lipid and Glucose Study. Endocrinol. Metab. 2015, 30, 334–342. [Google Scholar] [CrossRef] [PubMed]
- Shin, S.; Kim, S.-A.; Ha, J.; Lim, K. Sugar-Sweetened Beverage Consumption in Relation to Obesity and Metabolic Syndrome among Korean Adults: A Cross-Sectional Study from the 2012–2016 Korean National Health and Nutrition Examination Survey (KNHANES). Nutrients 2018, 10, 1467. [Google Scholar] [CrossRef] [PubMed]
- Kang, Y.; Kim, J. Soft Drink Consumption Is Associated with Increased Incidence of the Metabolic Syndrome Only in Women. Br. J. Nutr. 2017, 117, 315–324. [Google Scholar] [CrossRef] [PubMed]
- Lutsey, P.L.; Steffen, L.M.; Stevens, J. Dietary Intake and the Development of the Metabolic Syndrome: The Atherosclerosis Risk in Communities Study. Circulation 2008, 117, 754–761. [Google Scholar] [CrossRef] [PubMed]
- Duffey, K.J.; Gordon-Larsen, P.; Steffen, L.M.; Jacobs, D.R.; Popkin, B.M. Drinking Caloric Beverages Increases the Risk of Adverse Cardiometabolic Outcomes in the Coronary Artery Risk Development in Young Adults (CARDIA) Study. Am. J. Clin. Nutr. 2010, 92, 954–959. [Google Scholar] [CrossRef] [PubMed]
- Malik, V.S.; Popkin, B.M.; Bray, G.A.; Després, J.P.; Willett, W.C.; Hu, F.B. Sugar-Sweetened Beverages and Risk of Metabolic Syndrome and Type 2 Diabetes: A Meta-Analysis. Diabetes Care 2010, 33, 2477–2483. [Google Scholar] [CrossRef]
- Narain, A.; Kwok, C.S.; Mamas, M.A. Soft Drinks and Sweetened Beverages and the Risk of Cardiovascular Disease and Mortality: A Systematic Review and Meta-Analysis. Int. J. Clin. Pract. 2016, 70, 791–805. [Google Scholar] [CrossRef]
- Zhang, X.; Li, X.; Liu, L.; Hong, F.; Zhao, H.; Chen, L.; Zhang, J.; Jiang, Y.; Zhang, J.; Luo, P. Dose-Response Association between Sugar- And Artificially Sweetened Beverage Consumption and the Risk of Metabolic Syndrome: A Meta-Analysis of Population-Based Epidemiological Studies. Public Health Nutr. 2021, 24, 3892–3904. [Google Scholar] [CrossRef]
- Higgins, J.; Green, S. (Eds.) Cochrane Handbook for Systematic Reviews of Interventions Version 5.1.0; The Cochrane Collaboration: London, UK, 2011. [Google Scholar]
- Stroup, D.F.; Berlin, J.A.; Morton, S.C.; Olkin, I.; Williamson, G.D.; Rennie, D.; Moher, D.; Becker, B.J.; Sipe, T.A.; Thacker, S.B.; et al. Meta-Analysis of Observational Studies in EpidemiologyA Proposal for Reporting. JAMA 2000, 283, 2008–2012. [Google Scholar] [CrossRef]
- Moher, D.; Liberati, A.; Tetzlaff, J.; Altman, D.G. PRISMA Group Preferred Reporting Items for Systematic Reviews and Meta-Analyses: The PRISMA Statement. PLoS Med. 2009, 6, e1000097. [Google Scholar] [CrossRef] [PubMed]
- Joanna Briggs Institute Critical-Appraisal-Tools—Critical Appraisal Tools|JBI. Available online: https://jbi.global/critical-appraisal-tools (accessed on 28 March 2022).
- Egger, M.; Smith, G.D.; Schneider, M.; Minder, C. Bias in Meta-Analysis Detected by a Simple, Graphical Test. BMJ 1997, 315, 629–634. [Google Scholar] [CrossRef] [PubMed]
- Choi, A.; Ha, K.; Joung, H.; Song, Y.J. Frequency of Consumption of Whole Fruit, Not Fruit Juice, Is Associated with Reduced Prevalence of Obesity in Korean Adults. J. Acad. Nutr. Diet. 2019, 119, 1842–1851.e2. [Google Scholar] [CrossRef] [PubMed]
- Chung, S.; Ha, K.; Lee, H.S.; Kim, C.I.; Joung, H.; Paik, H.Y.; Song, Y.J. Soft Drink Consumption Is Positively Associated with Metabolic Syndrome Risk Factors Only in Korean Women: Data from the 2007–2011 Korea National Health and Nutrition Examination Survey. Metabolism 2015, 64, 1477–1484. [Google Scholar] [CrossRef] [PubMed]
- Denova-Gutiérrez, E.; Talavera, J.O.; Huitrón-Bravo, G.; Méndez-Hernández, P.; Salmerón, J. Sweetened Beverage Consumption and Increased Risk of Metabolic Syndrome in Mexican Adults. Public Health Nutr. 2010, 13, 835–842. [Google Scholar] [CrossRef] [PubMed]
- Khosravi-Boroujeni, H.; Sarrafzadegan, N.; Mohammadifard, N.; Alikhasi, H.; Sajjadi, F.; Asgari, S.; Esmaillzadeh, A. Consumption of Sugar-Sweetened Beverages in Relation to the Metabolic Syndrome among Iranian Adults. Obes. Facts 2012, 5, 527–537. [Google Scholar] [CrossRef] [PubMed]
- Trapp, G.; Hurworth, M.; Jacoby, P.; Christian, H.; Ambrosini, G.; Oddy, W.; Straker, L.; Mori, T.; Beilin, L.; Allen, K. Energy Drink Intake and Metabolic Syndrome: A Prospective Investigation in Young Adults. Nutr. Metab. Cardiovasc. Dis. 2020, 30, 1679–1684. [Google Scholar] [CrossRef]
- Velasquez-Melendez, G.; Molina, M.d.C.B.; Benseñor, I.M.; Cardoso, L.O.; de Fonseca, M.J.M.; Moreira, A.D.; Pereira, T.S.S.; Barreto, S.M. Sweetened Soft Drinks Consumption Is Associated with Metabolic Syndrome: Cross-Sectional Analysis from the Brazilian Longitudinal Study of Adult Health (ELSA-Brasil). J. Am. Coll. Nutr. 2017, 36, 99–107. [Google Scholar] [CrossRef]
- Crichton, G.; Alkerwi, A.; Elias, M. Diet Soft Drink Consumption Is Associated with the Metabolic Syndrome: A Two Sample Comparison. Nutrients 2015, 7, 3569. [Google Scholar] [CrossRef]
- Barrio-Lopez, M.T.; Martinez-Gonzalez, M.A.; Fernandez-Montero, A.; Beunza, J.J.; Zazpe, I.; Bes-Rastrollo, M. Prospective Study of Changes in Sugar-Sweetened Beverage Consumption and the Incidence of the Metabolic Syndrome and Its Components: The SUN Cohort. Br. J. Nutr. 2013, 110, 1722–1731. [Google Scholar] [CrossRef]
- Ferreira-Pêgo, C.; Babio, N.; Bes-Rastrollo, M.; Corella, D.; Estruch, R.; Ros, E.; Fitó, M.; Lluís, S.M.L.; Arós, F.; Fiol, M.; et al. Frequent Consumption of Sugar- and Artificially Sweetened Beverages and Natural and Bottled Fruit Juices Is Associated with an Increased Risk of Metabolic Syndrome in a Mediterranean Population at High Cardiovascular Disease Risk. J. Nutr. 2016, 146, 1528–1536. [Google Scholar] [CrossRef] [PubMed]
- Dhingra, R.; Sullivan, L.; Jacques, P.F.; Wang, T.J.; Fox, C.S.; Meigs, J.B.; D’Agostino, R.B.; Gaziano, J.M.; Vasan, R.S. Soft Drink Consumption and Risk of Developing Cardiometabolic Risk Factors and the Metabolic Syndrome in Middle-Aged Adults in the Community. Circulation 2007, 116, 480–488. [Google Scholar] [CrossRef] [PubMed]
- Pan, A.; Hu, F.B. Effects of Carbohydrates on Satiety: Differences between Liquid and Solid Food. Curr. Opin. Clin. Nutr. Metab. Care 2011, 14, 385–390. [Google Scholar] [CrossRef] [PubMed]
- Nomura, K.; Yamanouchi, T. The Role of Fructose-Enriched Diets in Mechanisms of Nonalcoholic Fatty Liver Disease. J. Nutr. Biochem. 2012, 23, 203–208. [Google Scholar] [CrossRef] [PubMed]
- Malik, V.S.; Hu, F.B. Fructose and Cardiometabolic Health What the Evidence from Sugar-Sweetened Beverages Tells Us. J. Am. Coll. Cardiol. 2015, 66, 1615–1624. [Google Scholar] [CrossRef]
- Basciano, H.; Federico, L.; Adeli, K. Fructose, Insulin Resistance, and Metabolic Dyslipidemia. Nutr. Metab. 2005, 2, 5. [Google Scholar] [CrossRef]
- Roy, D.; Myle‘, M.; Perreault, M.; Marette, A. Insulin Stimulation of Glucose Uptake in Skeletal Muscles and Adipose Tissues in Vivo Is NO Dependent. Am. J. Physiol. Metab. 1998, 274, E692–E699. [Google Scholar] [CrossRef]
- Tappy, L.; Rosset, R.; Petersen, O.; Gonzalez, J. The Journal of Physiology Health Outcomes of a High Fructose Intake: The Importance of Physical Activity. Authors. J. Physiol. 2019, 597, 3561–3571. [Google Scholar] [CrossRef]
- Esposito, K.; Nappo, F.; Marfella, R.; Giugliano, G.; Giugliano, F.; Ciotola, M.; Quagliaro, L.; Ceriello, A.; Giugliano, D. Inflammatory Cytokine Concentrations Are Acutely Increased by Hyperglycemia in Humans Role of Oxidative Stress. Circulation 2002, 106, 2067–2072. [Google Scholar] [CrossRef]
- Song, F.; Parekh, S.; Hooper, L.; Loke, Y.K.; Ryder, J.; Sutton, A.J.; Hing, C.; Kwok, C.S.; Pang, C.; Harvey, I. Dissemination and Publication of Research Findings: An Updated Review of Related Biases. Health Technol. Assess 2010, 14, 1–220. [Google Scholar] [CrossRef]
- Sterne, J.A.C.; Egger, M.; Smith, G.D. Systematic Reviews in Health Care Investigating and Dealing with Publication and Other Biases in Meta-Analysis. BMJ 2001, 323, 101–105. [Google Scholar] [CrossRef] [PubMed]
- Sterne, J.A.C.; Gavaghan, D.; Egger, M. Publication and Related Bias in Meta-Analysis: Power of Statistical Tests and Prevalence in the Literature. J. Clin. Epidemiol. 2000, 53, 1119–1129. [Google Scholar] [CrossRef] [PubMed]


| PubMed | ((“sugar sweetened beverages”[MeSH Terms] OR (“sugar sweetened”[All Fields] AND “beverages”[All Fields]) OR “sugar sweetened beverages”[All Fields] OR (“sugar”[All Fields] AND “sweetened”[All Fields] AND “soft”[All Fields] AND “drinks”[All Fields]) OR “sugar sweetened soft drinks”[All Fields] OR (“fruit and vegetable juices”[MeSH Terms] OR (“fruit”[All Fields] AND “vegetable”[All Fields] AND “juices”[All Fields]) OR “fruit and vegetable juices”[All Fields] OR (“fruit”[All Fields] AND “juices”[All Fields]) OR “fruit juices”[All Fields]) OR (“energy drinks”[MeSH Terms] OR (“energy”[All Fields] AND “drinks”[All Fields]) OR “energy drinks”[All Fields]) OR (“milkshake”[All Fields] OR “milkshakes”[All Fields])) AND (“metabolic syndrome”[MeSH Terms]) AND ((“english”[Language] OR “spanish”[Language]) AND “adult”[MeSH Terms])) AND ((english[Filter] OR spanish[Filter]) AND (alladult[Filter])). |
| SCOPUS | TITLE-ABS-KEY (“sugar sweetened soft drinks” OR “fruit juices” OR “energy drinks” OR “milkshakes”) OR INDEXTERMS (“sugar sweetened beverages” OR “fruit and vegetable juices” OR “energy drinks”) AND INDEXTERMS (“metabolic syndrome”) AND (LIMIT-TO (SRCTYPE, “j”)) AND (LIMIT-TO (DOCTYPE, “ar”)) AND (LIMIT-TO (LANGUAGE, “English”) OR LIMIT-TO (LANGUAGE, “Spanish”)). |
| Author (Year) | Country | Age Range (y) | Sex | Characteristics of Subjects | Sample Size | Exposure | Exposure Categories | Dietary Assessment | Diagnosis Criteria for the Metabolic Syndrome (Number of Events) | OR (95%CI) for Highest vs. Lowest Intake | Adjustment for Confounders | Quality Score (JBI Criteria Not Met) |
|---|---|---|---|---|---|---|---|---|---|---|---|---|
| Denova-Gutiérrez et al. (2010) [30] | Mexico | 20–70 y | M-W | Participants from the Health Workers Cohort Study in the Mexican states of Morelos and Mexico | 5240 participants (1488 men and 3752 women) | SSB: colas, flavored sodas, flavored water with sugar and diet colas | 0 servings/day,1 serving/day, 1–2 servings/day, 2 servings/day | FFQ. | NCEP ATP III (cut-off for plasma glucose level of ≥5.6 mmol/L) | 2.0 (1.10, 3.64) p value (not shown) | Age, sex, BMI, weight change within past year, physical activity, energy intake, alcohol intake, SFA intake, PUFA intake, trans fatty acid intake, smoking, and place of residence | 8/8 Included |
| Khosravi-Boroujeni et al. (2012) [31] | Iran | >19 y | M-W (stratified) | Participants from the Isfahan Healthy Heart Program (IHHP) | 1752 participants (782 men and 970 women) | SSB: soft drinks plus artificially sweetened fruit juices | <1 time/week, 1–3 times/week, ≥times/week | FFQ | ATP III. | SSB: Men: 1.17 (0.56–2.44) p = 0.57 SSB: Women: 0.80 (0.46–1.39) p = 0.59 | Age, BMI, smoking, physical activity, total energy intake, dietary intake of meat, grains, pulses, fruit, vegetable, dairy, HVOs, and non-HVOs | 8/8 Included |
| Chung et al. (2015) [29] | South Korea | ≥30 y | M-F (stratified) | Participants from the 2007–2011 Korea National Health and Nutrition Examination Survey (KNHANES) | 13,972 participants (5432 men, and 8540 women) | Soft drinks | Rarely, ≤1 time/month, 2–3 times/month, 1 time/week, 2–3 times/week, ≥4 times/week | Dietary questionnaire and 24-h dietary recall | NCEP ATP III, [waist circumference (WHO ethnicity-specific cut-off values for the Asian population) ≥90 cm for men and 80 cm for women] | Men: 1.19 (0.80–1.77), p = 0.7890 Women: 1.74 (1.00–3.03), p < 0.0001 | Age, sex, family income, education, current smoking status, physical activity total, energy intake, and alcohol intake | 8/8 Included |
| Crichton et al. (2015) [34] | USA and Luxemburg | 23–98 y (MSLS), 18–69 y (ORISCAV-LUX) | M-W | Participants from MSLS study and ORISCAV-LUX study | 2126 participants (803 from MSLS and 1323 from ORISCAV-LUX) | Soft drinks | Non-consumers, one per day, two or more per day | FFQ | NCEP ATP III. (n in MSLS = 353) (n in ORISCAV-LUX = 346) | MSLS: 1.7 (0.7–4.5), p > 0.05 ORISCAV-LUX: 0.8 (0.3–1.8), p = 0.05 | Age, sex, education, smoking, physical activity, total energy intake, alcohol intake, intake of vegetables, fruit, grains, meat, and diet soft drinks | 8/8 Included |
| Ejtahed et al. (2015) [15] | Iran | 19–70 y | M-W | Participants from the fourth phase of TLGS (from 2009 to 2011) | 5852 participants (2516 men and 3336 women) | SSB: soft drinks plus and bottle fruit juices | Using quartile cutoffs (<6.7, from 6.7 to 21.8, from 21.9 to 57.1, >57.1 g/day). Participants with dietary SSB intakes <6.7 g/day were considered as the reference group | FFQ | NCEP ATP III | 1.3 (1.06–1.59) p = 0.03 | Age, sex, education, smoking, physical activity, and total energy intake | 8/8 Included |
| Velasquez-Melendez et al. (2016) [33] | Brazil | 35–74 y | M-W | Participants from the ELSA-Brasil study | 8826 participants (3950 men, and 4876 women) | Soft drinks | <0.1 serving/day, 0.1 to <0.4 serving/day, 0.4 to <1 serving/day, and ≥1 serving/day | Beverage frequency questionnaire | NCEP ATP III. (n = 1314) | 1.95 (1.60–2.38) p < 0.001 | Age, sex, income, education, smoking, physical activity, energy intake, alcohol intake, and daily consumption of fruit and vegetables | 8/8 Included |
| Shin et al. (2018) [16] | South Korea | 35–65 y | M-W (stratified) | Participants from the 2012–2016 KNHANES. | 12,112 participants (5308 men, and 6804 women) | SSB: soda beverages, fruit juices and sweetened rice drinks | Non-SSB drinkers, ≤2 times/week, 3–6 times/week, and ≥1 times/day | FFQ | NCEP ATP III, [waist circumference (WHO ethnicity-specific cut-off values for the Asian population) ≥90 cm for men and 80 cm for women] (n in men = 1717) (n in women = 1518) | Men: 1.07 (0.85–1.35) p = 0.0989 Women: 1.61 (1.20–2.16) p = 0.0003 | Age, family income, educational, energy intake, alcohol intake, smoking status, and physical activity | 8/8 Included |
| Choi et al. (2019) [28] | South Korea | 19–74 y | M-W | Participants from the KNHANES study | 10,460 participants (4082 men and 6378 women) | Fruit juices. | Rarely, from 1 to 3 times/month, and ≥1 time/week | FFQ | NCEP ATP III, [waist circumference (World Health Organization ethnicity-specific cut-off values for the Asian population) ≥90 cm for men and 80 cm for women] | 1.18 (0.96–1.45) p = 0.1161 | Age, sex, family income, education, BMI, smoking, physical activity, total energy intake, alcohol intake, sugar intake from processed food, dietary pattern 1, and dietary pattern 2 | 8/8 Included |
| Trapp et al. (2020) [32] | Australia | 20 y and 22 y | M-W | Participants from the Raine Study Generation 2 | 2353 participants (1236 of 20 y, and 1117 of 22 y) | Energy drinks | none/rare (never to ≤once/month); occasional (>once/month to <once/week); frequent (≥once/week) | Self-reported questionnaire | International Diabetes Foundation (n after 20 y = 73) (n after 22 y = 92) | 20 y: 1.11 0.57–2.19), p > 0.05 22 y: 1.28 (0.71–2.31), p > 0.05 | Sex, family income, mother’s education, education, smoking, physical activity, energy intake, alcohol intake, and dietary pattern | 7/8 (JBI: 2) Included |
| Dhingra et al. (2007) [37] | USA | Adults | M-W | Participants from the Framingham Offspring Study | 8997 participants (4126 men and 4871 women) | Soft drinks. | From 1 to 6 soft drink/week, ≥1 soft drink/day | FFQ. | NCEP ATP III. (n = 2777) | 1.81 (1.28–2.56) | Age, sex, physical activity, smoking, energy intake, dietary intake of SFA, trans fat, fiber, magnesium, and glycemic index | 5/8 (JBI: 3, 4, 8) Excluded |
| Author (Year) | Country | Age Range (y) | Sex | Characteristics of Subjects | Sample Size | Follow-Up | Exposure | Exposure Categories | Dietary Assessment | Diagnosis Criteria for the Metabolic Syndrome (Number of Events) | OR (95%CI) for Highest vs. Lowest Intake | Adjustment for Confounders | Quality Score (JBI Criteria Not Met) |
|---|---|---|---|---|---|---|---|---|---|---|---|---|---|
| Lutsey et al. (2008) [18] | USA | 45–64 y | M-W | Participants from ARIC study | 9514 participants (4197 men and 5317 women) | 9-year-follow-up | SSBs | Tertiles of beverage consumption (T1 considered as reference) | FFQ. | American Heart Association guidelines (n = 3782) | 1.09 (0.99–1.19), p = 0.07 | Age, sex, center, race, education, smoking, physical activity, energy intake, consumption of meat, dairy, fruit and vegetables, whole grains, and refined grains | 9/11 (JBI: 9, 10) Included |
| Duffey et al. (2010) [19] | USA | 18–30 y | M-W | Participants from de Coronary Artery Risk Development in Young Adults (CARDIA) study | 3596 participants. | Data were used from exam years 0 (1985–1986, baseline), 7 (1992–1993), and 20 (2005–2006) | SSBs | Quartiles of beverage consumption (average of years 0 and 7) | FFQ. | ATP III. (n = 459) | 1.03 (0.96, 1.11), p = 0.401 | Age, sex, CARDIA center race, weight, smoking, physical activity, energy intake, alcohol intake, energy from low-fat milk, whole-fat milk, and fruit juices | 9/11 (JBI: 9, 10) Included |
| Barrio-Lopez et al. (2013) [34] | Spain | >18 | M-W | Participants from The Seguimiento Universidad de Navarra (SUN) Project | 8157 participants. | 6-year-follow-up | SSBs: sugar-sweetened carbonated colas and fruit-flavored carbonated sugar soft drinks | Quintiles of change in beverage consumption (quintile 1 for those participants who decreased most of their consumption and quintile 5 for those participants who increased most of their consumption), considering the first quintile as the reference category | FFQ. | The International Diabetes Federation, the American Heart Association, and National Heart, Lung, and Blood Institute (n = 361) | 2.0 (1.30, 3.08), p = 0.038 | Age, sex, BMI, smoking, physical activity, energy intake, alcohol intake, soft drink consumption, consumption of red meat, French fries, fast food, and adherence to the Mediterranean dietary pattern | 10/11 (JBI: 10) Included |
| Ferreira-Pêgo et al. (2016) [36] | Spain | Men aged 55–80 y, and women aged 60–80 y | M-W | Patients from the PREDIMED study. | 1868 participants | October 2003 to June 2009 | SSBs and bottled fruit juices | <1 serving/week, 1–5 servings/week, >5 servings/week. | FFQ | The International Diabetes Federation, the American Heart Association, and National Heart, Lung, and Blood Institute (n for SSBs = 936) (n for bottled fruit juices = 944) | SSBs: 1.43 (1.00, 2.05), p = 0.27 Bottled fruit juices: 1.14 (1.04, 1.25), p = 0.31 | Age, sex, intervention group, BMI, smoking, physical activity, cumulative energy intake, alcohol intake, alcohol squared in grams per day, cumulative mean consumption of vegetables, legumes, fruit, cereals, meat, fish, bakery, dairy products, olive oil, and nuts, and MetS components at baseline | 9/11 (JBI: 9, 10) Included |
| Kang et al. (2017) [17] | South Korea | 50–69 y | M-W (stratified) | Participants from KoGES cohort study | 5797 participants (3027 men and 2770 women) | 10-year-follow-up | Soft drinks | none or rarely, <1 serving/week, ≥1 serving/week to <4 servings/week and ≥4 servings/week | FFQ | NCEP ATP III. (n in men = 1046) (n in women =1083) | Men: 1.09 (0.79, 1.50), p = 0.9531 Women: 1.82 (1.24, 2.67), p < 0.001 | Age, income, education, BMI, smoking physical activity, energy intake, alcohol intake, percentage of fat, fiber intake, and the presence of diseases | 9/11 (JBI: 9, 10) Included |
| Dhingra et al. (2007) [37] | USA | Adults | M-W | Participants from Framingham Offspring Study from the fourth through the seventh (1998–2001) examination cycles | 6039 participants (2569 men and 3470 women) | 4-year-follow-up | Soft drinks | From 1 to 6 soft drink/week, ≥1 soft drink/day | FFQ. | NCEP ATP III. (n = 1150) | 1.29 (0.98–1.70) p value (not shown) | Age, sex, smoking, physical activity, energy intake, dietary intake of SFA, trans fat, fiber, magnesium, and glycemic index | 7/11 (JBI: 2, 3 9, 10) Excluded |
Disclaimer/Publisher’s Note: The statements, opinions and data contained in all publications are solely those of the individual author(s) and contributor(s) and not of MDPI and/or the editor(s). MDPI and/or the editor(s) disclaim responsibility for any injury to people or property resulting from any ideas, methods, instructions or products referred to in the content. |
© 2023 by the authors. Licensee MDPI, Basel, Switzerland. This article is an open access article distributed under the terms and conditions of the Creative Commons Attribution (CC BY) license (https://creativecommons.org/licenses/by/4.0/).
Share and Cite
Muñoz-Cabrejas, A.; Guallar-Castillón, P.; Laclaustra, M.; Sandoval-Insausti, H.; Moreno-Franco, B. Association between Sugar-Sweetened Beverage Consumption and the Risk of the Metabolic Syndrome: A Systematic Review and Meta-Analysis. Nutrients 2023, 15, 430. https://doi.org/10.3390/nu15020430
Muñoz-Cabrejas A, Guallar-Castillón P, Laclaustra M, Sandoval-Insausti H, Moreno-Franco B. Association between Sugar-Sweetened Beverage Consumption and the Risk of the Metabolic Syndrome: A Systematic Review and Meta-Analysis. Nutrients. 2023; 15(2):430. https://doi.org/10.3390/nu15020430
Chicago/Turabian StyleMuñoz-Cabrejas, Ainara, Pilar Guallar-Castillón, Martín Laclaustra, Helena Sandoval-Insausti, and Belén Moreno-Franco. 2023. "Association between Sugar-Sweetened Beverage Consumption and the Risk of the Metabolic Syndrome: A Systematic Review and Meta-Analysis" Nutrients 15, no. 2: 430. https://doi.org/10.3390/nu15020430
APA StyleMuñoz-Cabrejas, A., Guallar-Castillón, P., Laclaustra, M., Sandoval-Insausti, H., & Moreno-Franco, B. (2023). Association between Sugar-Sweetened Beverage Consumption and the Risk of the Metabolic Syndrome: A Systematic Review and Meta-Analysis. Nutrients, 15(2), 430. https://doi.org/10.3390/nu15020430