
Association of Vitamin D Genetic Risk Score with Noncommunicable Diseases: A Systematic Review


Abstract
:1. Introduction
2. Methods
2.1. Registration of Protocol and Reporting
2.2. Literature Searches
2.3. Eligibility Criteria
- Studied the association between the calculated low vitamin D GRS and diabetes, cancer, chronic respiratory diseases, or cardiovascular disorders.
- Calculated a genetic risk score (GRS) using selected low vitamin D level-related SNPs.
- Measured at least one of the following NCD parameters (metabolic parameters such as blood lipids and fasting blood glucose (FBG), BMI, west circumference (WC), body fat percentage (BFP), insulin, or others like glucose, glycated hemoglobin (HbA1c), blood pressure, along with dietary intake analysis, etc.)
- Calculated the GRS with SNPs not related to vitamin D deficiency.
- Studied the genetic predisposition to NCDs at the level of individual SNPs rather than collectively.
- Studied SNPs that are associated with high vitamin D levels.
- Were published as a review, book, protocol, guideline, or animal study.
2.4. Study Selection
2.5. Quality Control Assessment
2.6. Data Extraction
3. Results
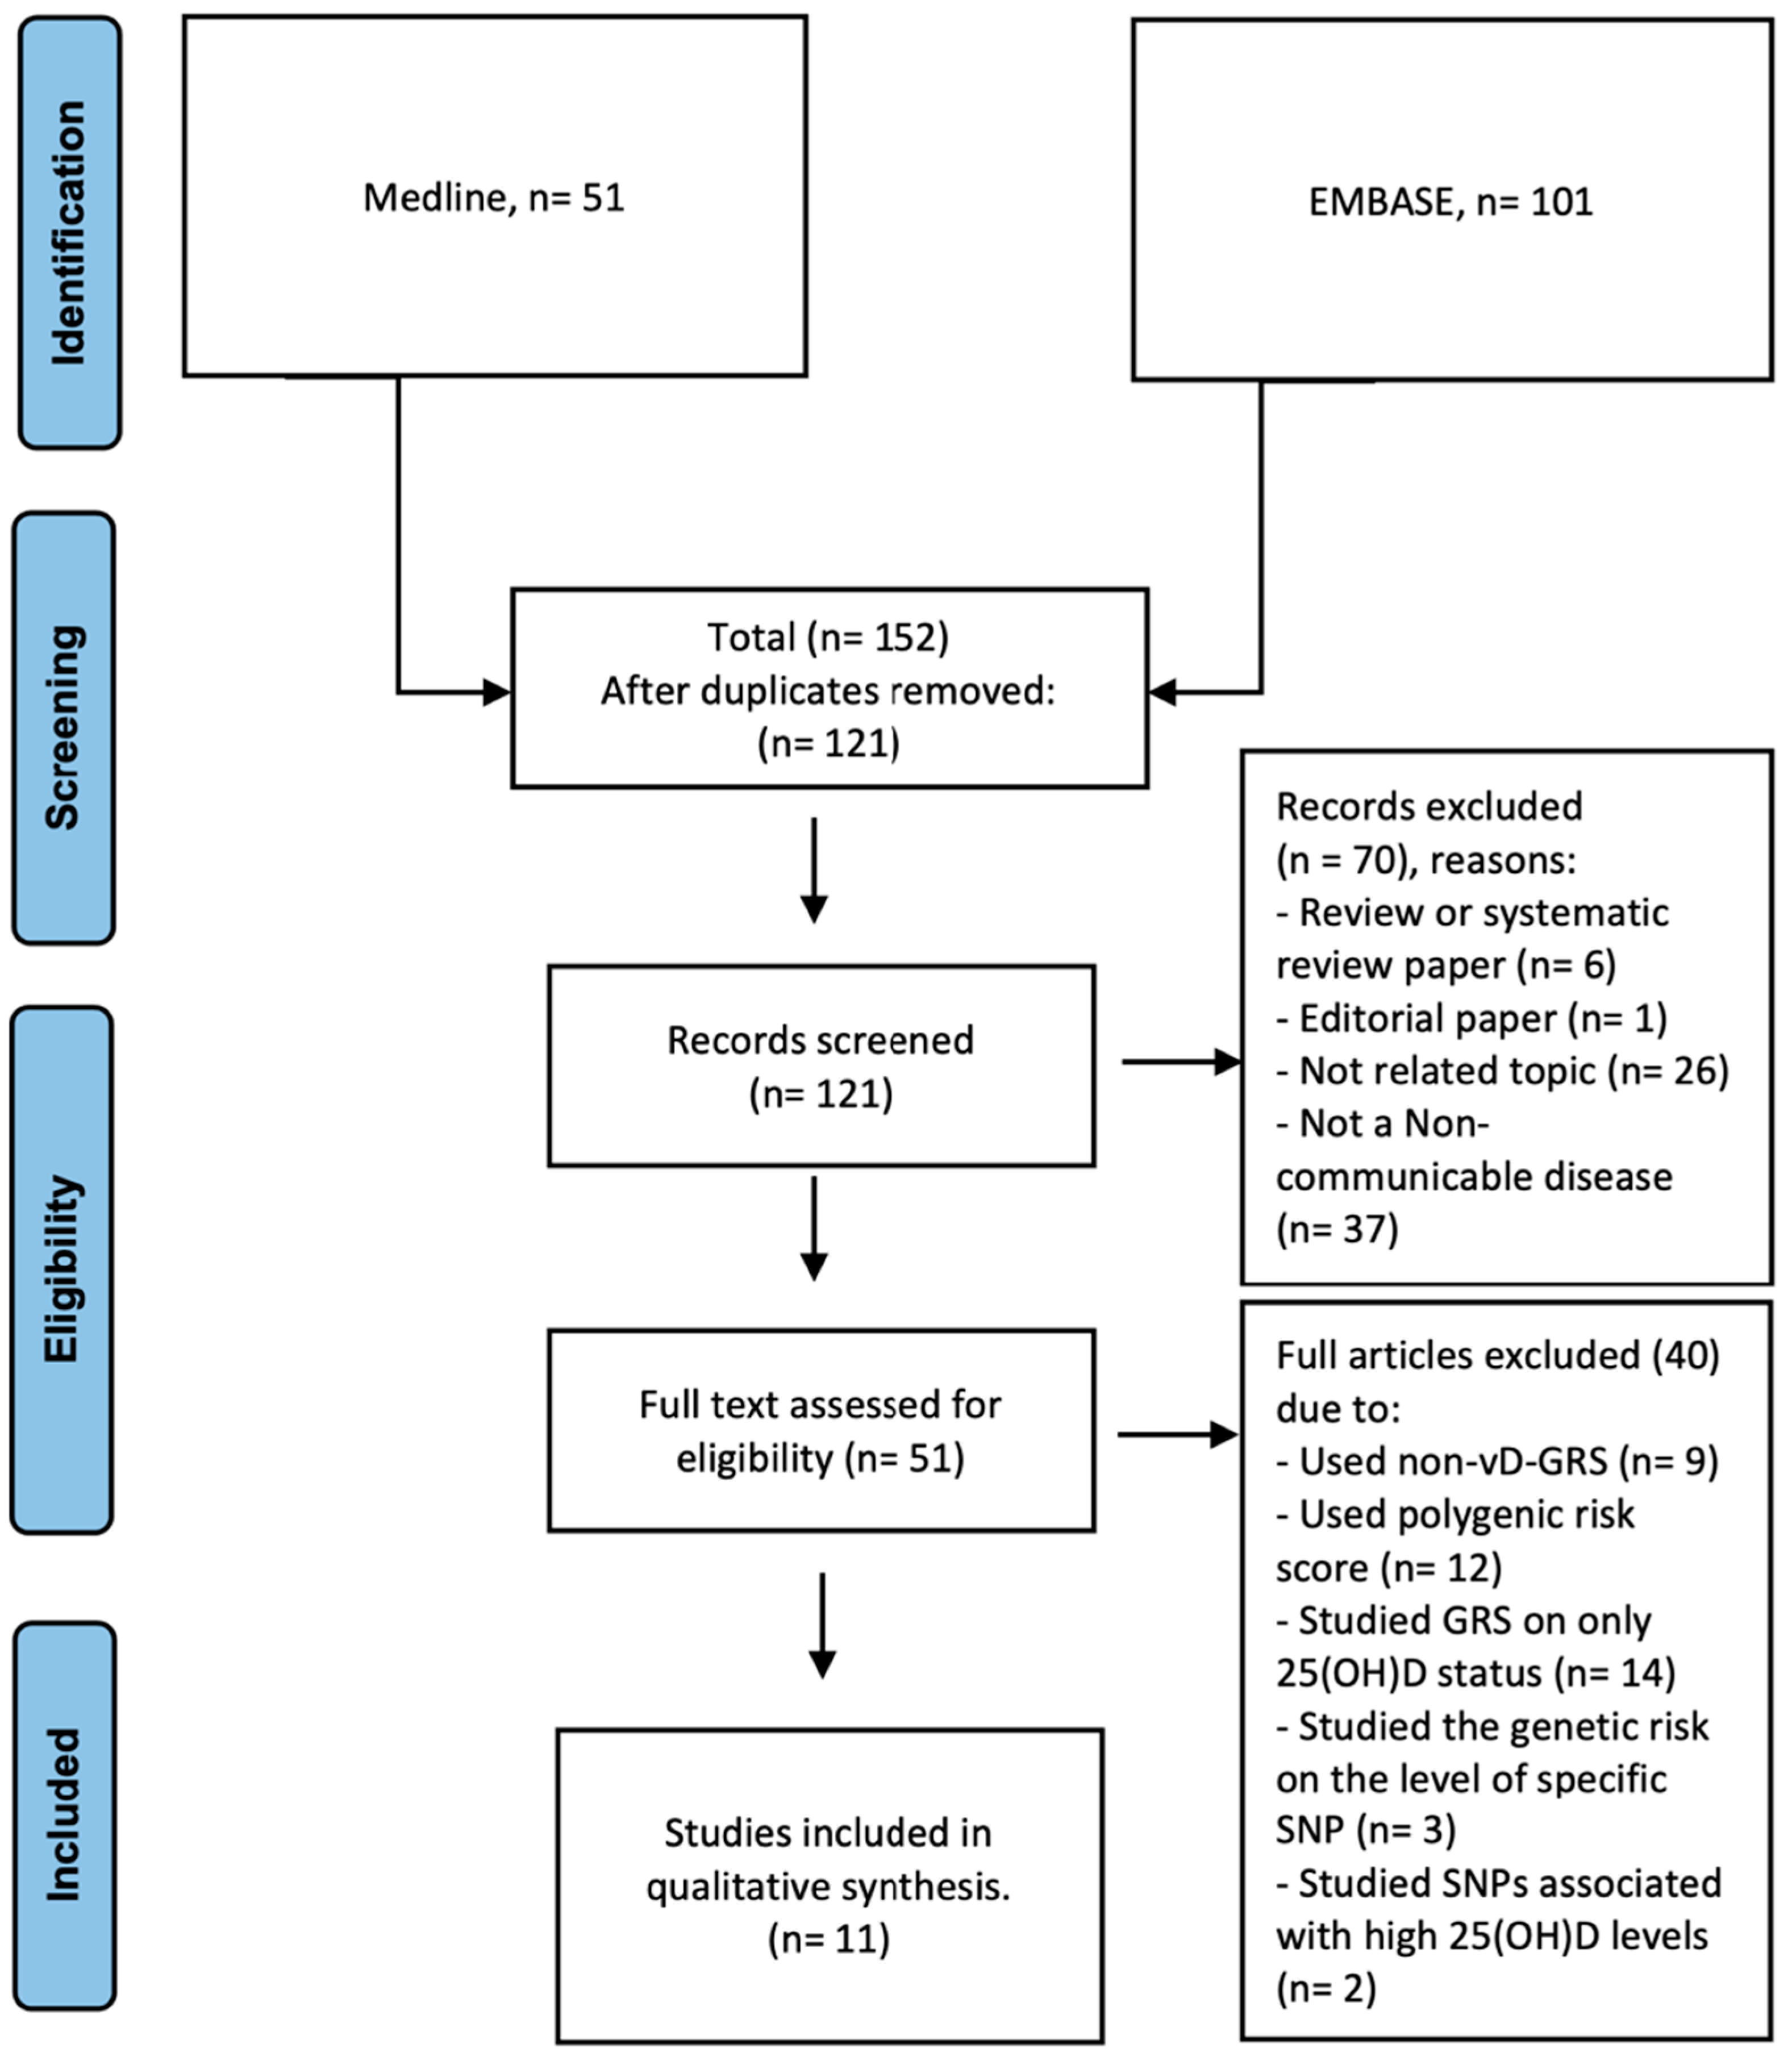
3.1. Search Outcome
3.2. Quality of the Eligible Studies
3.3. Characteristics of the Included Studies
3.4. Genetic Risk Score Characteristics
3.5. Vitamin D Genetic Risk Score Association with Metabolic Traits/Diseases
3.6. Vitamin D Genetic Risk Score Association with Cancer
3.7. Vitamin D Genetic Risk Score Association with Cardiovascular Diseases

| First Author, Year [Ref] | Number of SNPs Selected | Gene Symbol (Rsnumber of SNPs Selected) | Reference Studies of SNPs | VD-GRS Computation | VD-GRS Construction Criteria | Association Model | Non-Genetic Covariates the Model Was Adjusted for | Outcome Indicators | Main Significant Findings |
|---|---|---|---|---|---|---|---|---|---|
| Section A|Description of the vitamin D genetic risk score used for studies examining metabolic syndrome | |||||||||
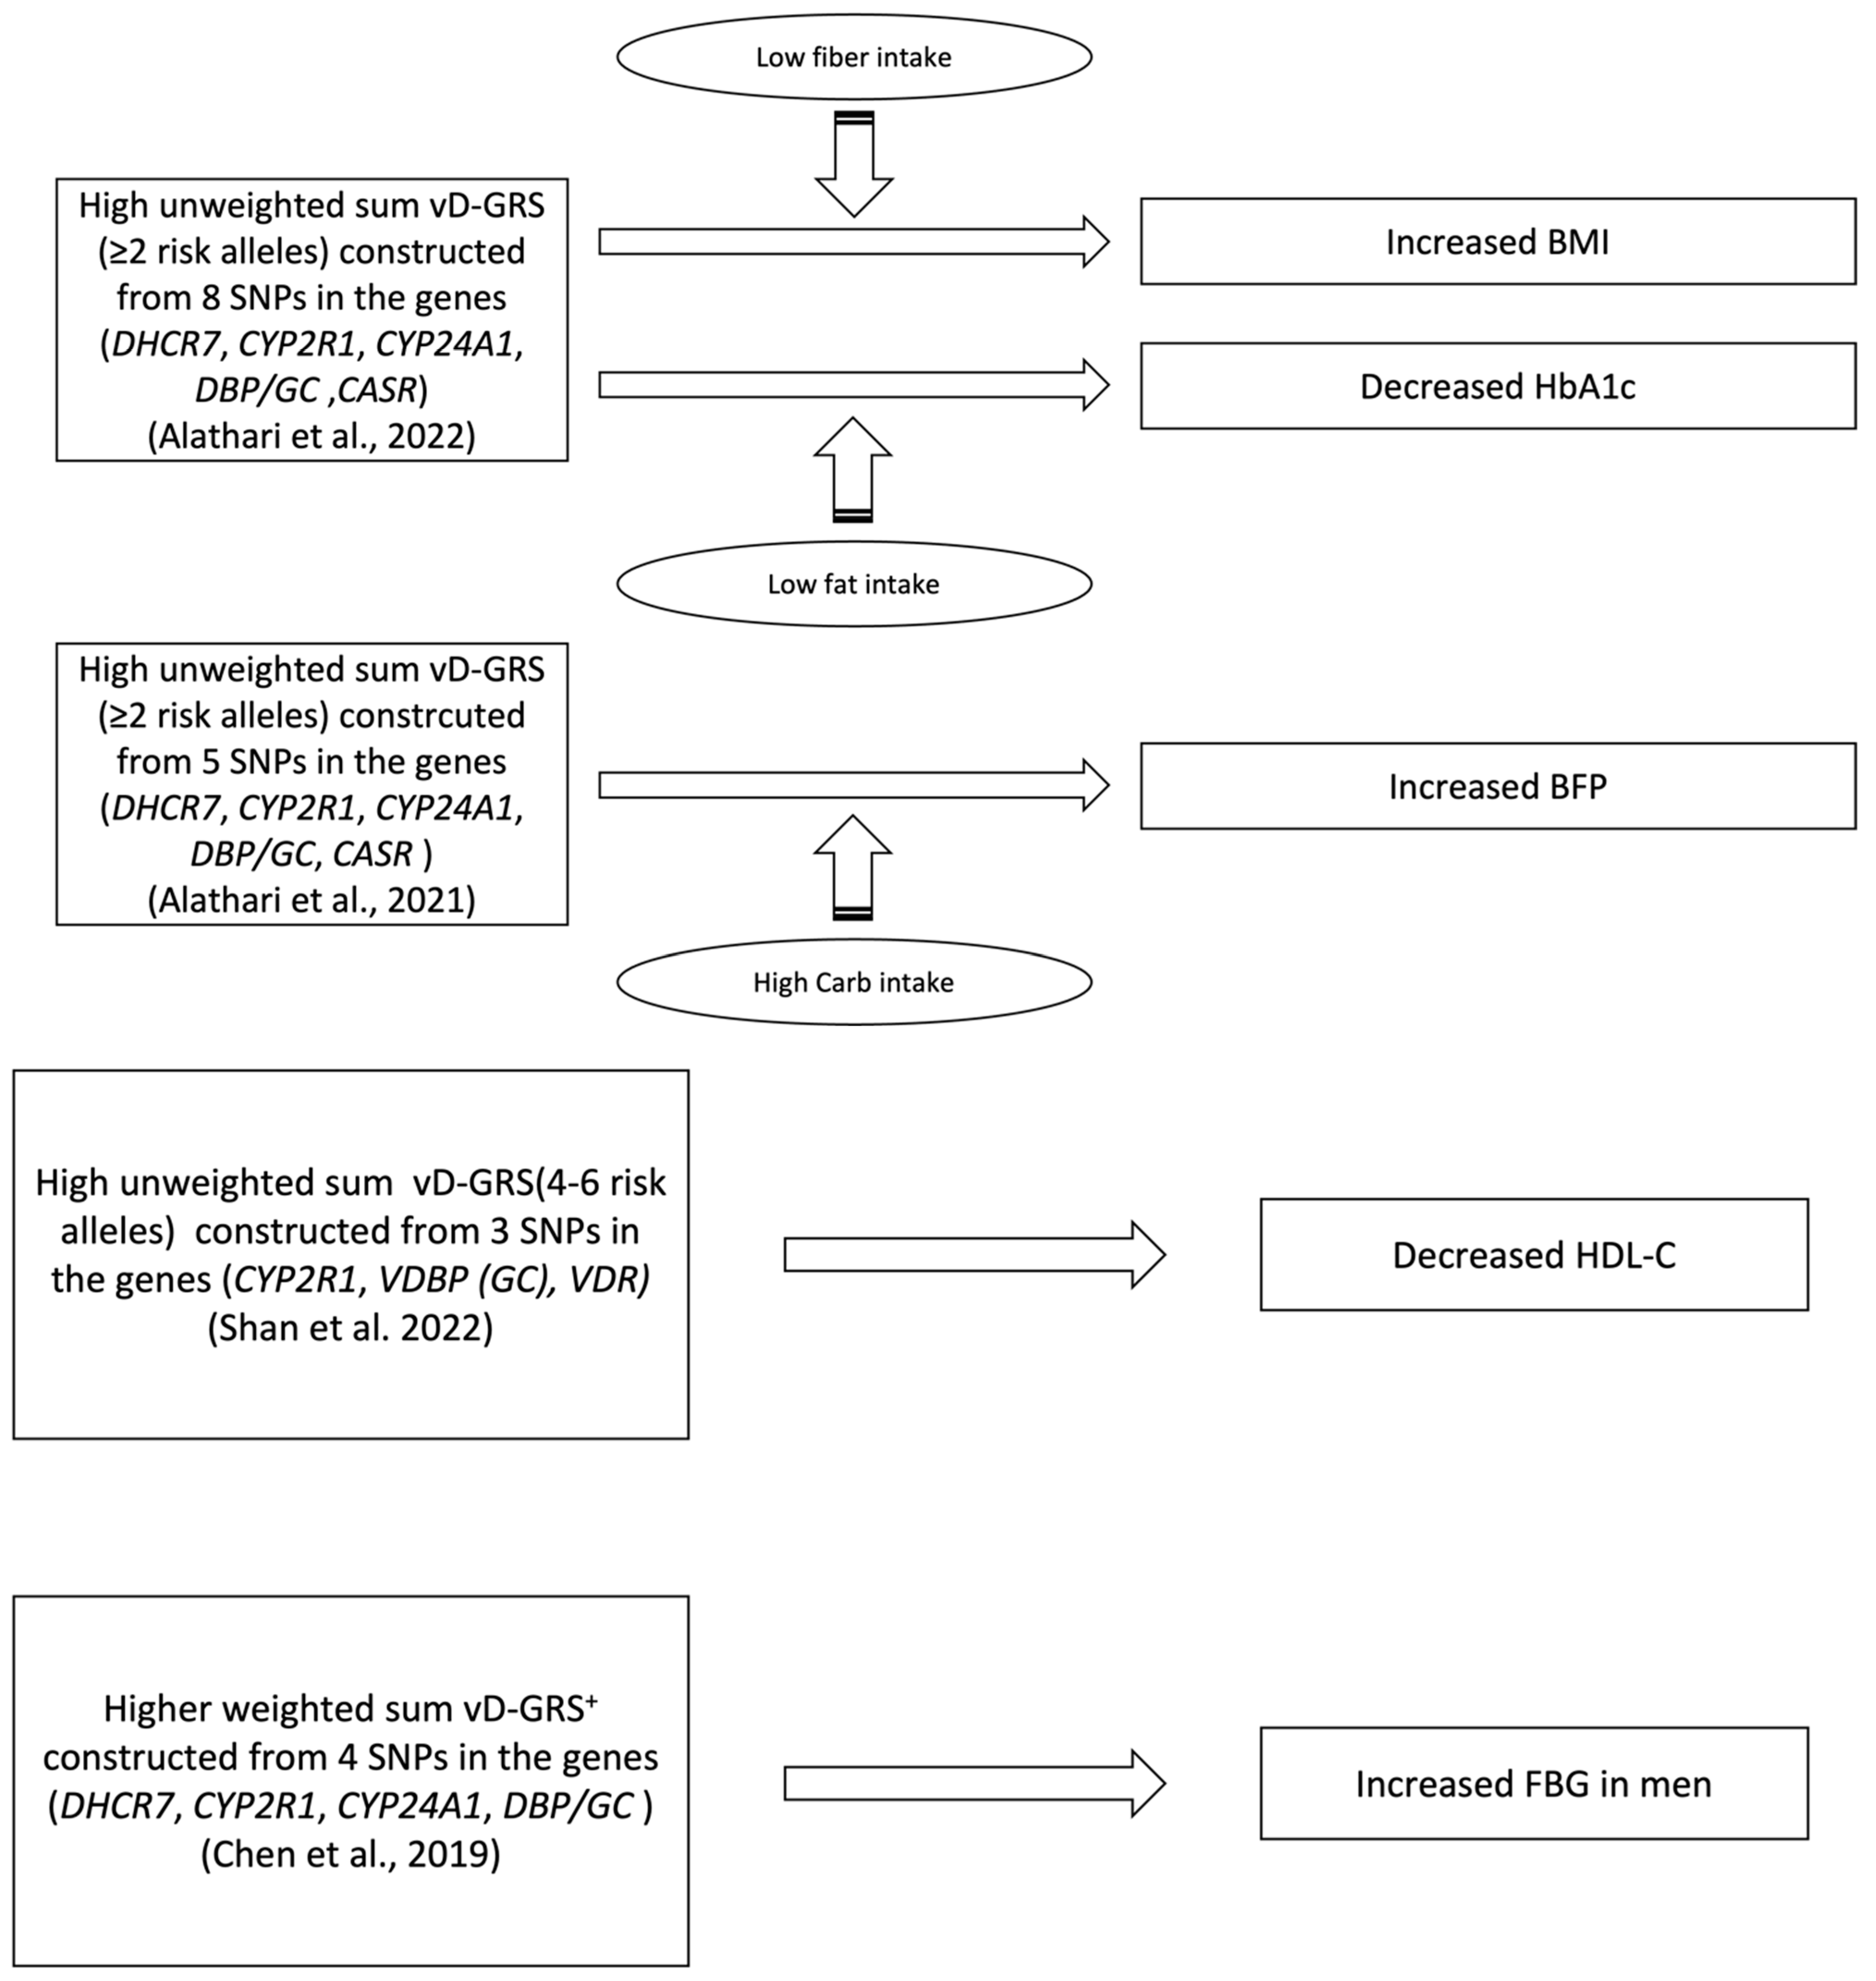
| Shan et al., 2022 [40] | 3 | CYP2R1 (rs12794714) GC (rs2282679) VDR (rs2228570) | Previous studies findings [55,56,57], GWAS, candidate SNPs | Unweighted, Simple Count | Summation of risk alleles of each SNP (range from 0 to 6 risk alleles | Linear regression model | Season, district, area type, latitude, age, BMI, PTH, P, ALT, CRE, IL-6, and hs-CRP | MetS’s Components (BMI, WC, SBP, DBP, TG, HDL-C, and FBG) | * ↑ vD-GRS w\ ↓ HDL-C (p = 0.003) |
| Alathari et al., 2022 [41] | 8 | DHCR7 (rs12785878) CYP2R1 (rs12794714, rs10741657) CYP24A1 (rs6013897) DBP/GC (rs2282679) CASR (rs1801725) VDR (rs2228570, rs7975232) | Previous studies findings [27,29,53,58,59,60,61,62,63,64], GWAS, candidate SNPs | Unweighted, Simple Count | Summation of risk alleles of each SNP (range from 0 to 6 risk alleles). Risk allele scores were then divided by the median of 2 | General linear models with interaction analysis when needed | Age, gender, and BMI (when BMI was not an outcome), and total energy intake (only in the nutrient–GRS interaction analysis) | Biochemical and clinical metabolic outcomes (BMI and HbA1c) mediated or not by dietary intake | * ↑ vD-GRS x ↓ fiber intake (≤16.2 g/day) w\ ↑ BMI (Pinteraction = 0.020\ p = 0.010) * ↑ vD-GRS x ↓ fat intake (≤36.5 g/day) OR SFA w\ ↓ HbA1c (Pinteraction = 0.029\ p = 0.049) OR (Pinteraction = 0.044\ p = 0.049) respectively. |
| Alathari et al., 2021 [45] | 5 | DHCR7 (rs12785878) CYP2R1 (rs12794714) CYP24A1 (rs6013897) DBP/GC (rs2282679) CASR (rs1801725) | Previous studies findings [53,59,60,61,62,63,65,66,67], GWAS, candidate SNPs | Unweighted, Simple Count | Summation of risk alleles of each SNP (range from 0 to 6 risk alleles). Risk allele scores were then divided by the median of 2 | Linear regression models with interaction analysis when needed | Age, BMI, location, and total energy intake. | Anthropometric and biochemical outcomes (BMI, WC, BFP, 25(OH)D, glucose, HbA1c, FBG, total cholesterol, HDL-c, LDL-c, and TG) | * ↑ vD-GRS x ↑ carbohydrate intake (mean ± SD: 319 g/d ± 46) w\ ↑ BFP (Pinteraction = 0.049\ p = 0.016) |
| Chen et al., 2019 [42] | 4 | DHCR7 (rs12785878) DBP/GC (rs2282679) CYP24A1 (rs6013897) CYP2R1 (rs1074165) | Mendelian Randomization study containing Asian participants [52] | Weighted, additive genetic model | Each SNP was coded 0–2 based on the number of effect alleles and then multiplied by the β value, followed by summing the four values. | Linear regression models and logistic regression | Age, sex, urban/rural residence, economic status, current smoking, WC, diabetes, hypertension, HDL-C | Biochemical and clinical metabolic outcomes (blood lipids, BP, FBG) Metabolic syndrome prevalence Anthropometric measurement (WC) | * ↑ VD-GRS w\ ↑ FBG (p = 0.003) for men |
| Wang et al., 2020 [44] | 4 | DHCR7 (rs12785878) DBP/GC (rs2282679) CYP24A1 (rs6013897) CYP2R1 (rs1074165) | Genome-wide association study on 25(OH)D [53] | Weighted, additive genetic model | Each SNP was coded 0–2 based on the number of effect alleles and weighted based on its effect size | linear and logistic regression analyses | Age, sex, urban/rural residence, economic status, current smoking, BMI, hypertension, HDL-C, LDL-C, TG and season variation (for | Biochemical and clinical metabolic outcomes (FPG, HbA1c, BMI, TG, HDL, LDL, Glycemic status, Type 2 diabetes, Prediabetes, Hypertension) | No association between the genetic risk score and any of the cardiometabolic markers. |
| Lopez-Mayorg et al., 2020 [43] | Mendelian randomization | GC (rs4588 and rs12512631) CYP2R1 (rs10741657 and rs10500804) | Previous studies from OPUS cohort and previous reported GWAS studies [53,68,69] | Unweighted, Simple Count | Three categories with increasing numbers of risk alleles (0–2, 3–5nd 6–8) calculated as the sum of the number of risk alleles | Linear and multiple linear regression models | Age, sex, parental education, entered puberty (yes/no), fat mass index and moderate-to-vigorous physical activity | Cardiometabolic markers (SBP, DBP, insulin, HDL-C, and TG) | No association between the genetic risk score and any of the cardiometabolic markers |
| Section B|Description of the studies focusing on vitamin D genetic risk score in association with cancer | |||||||||
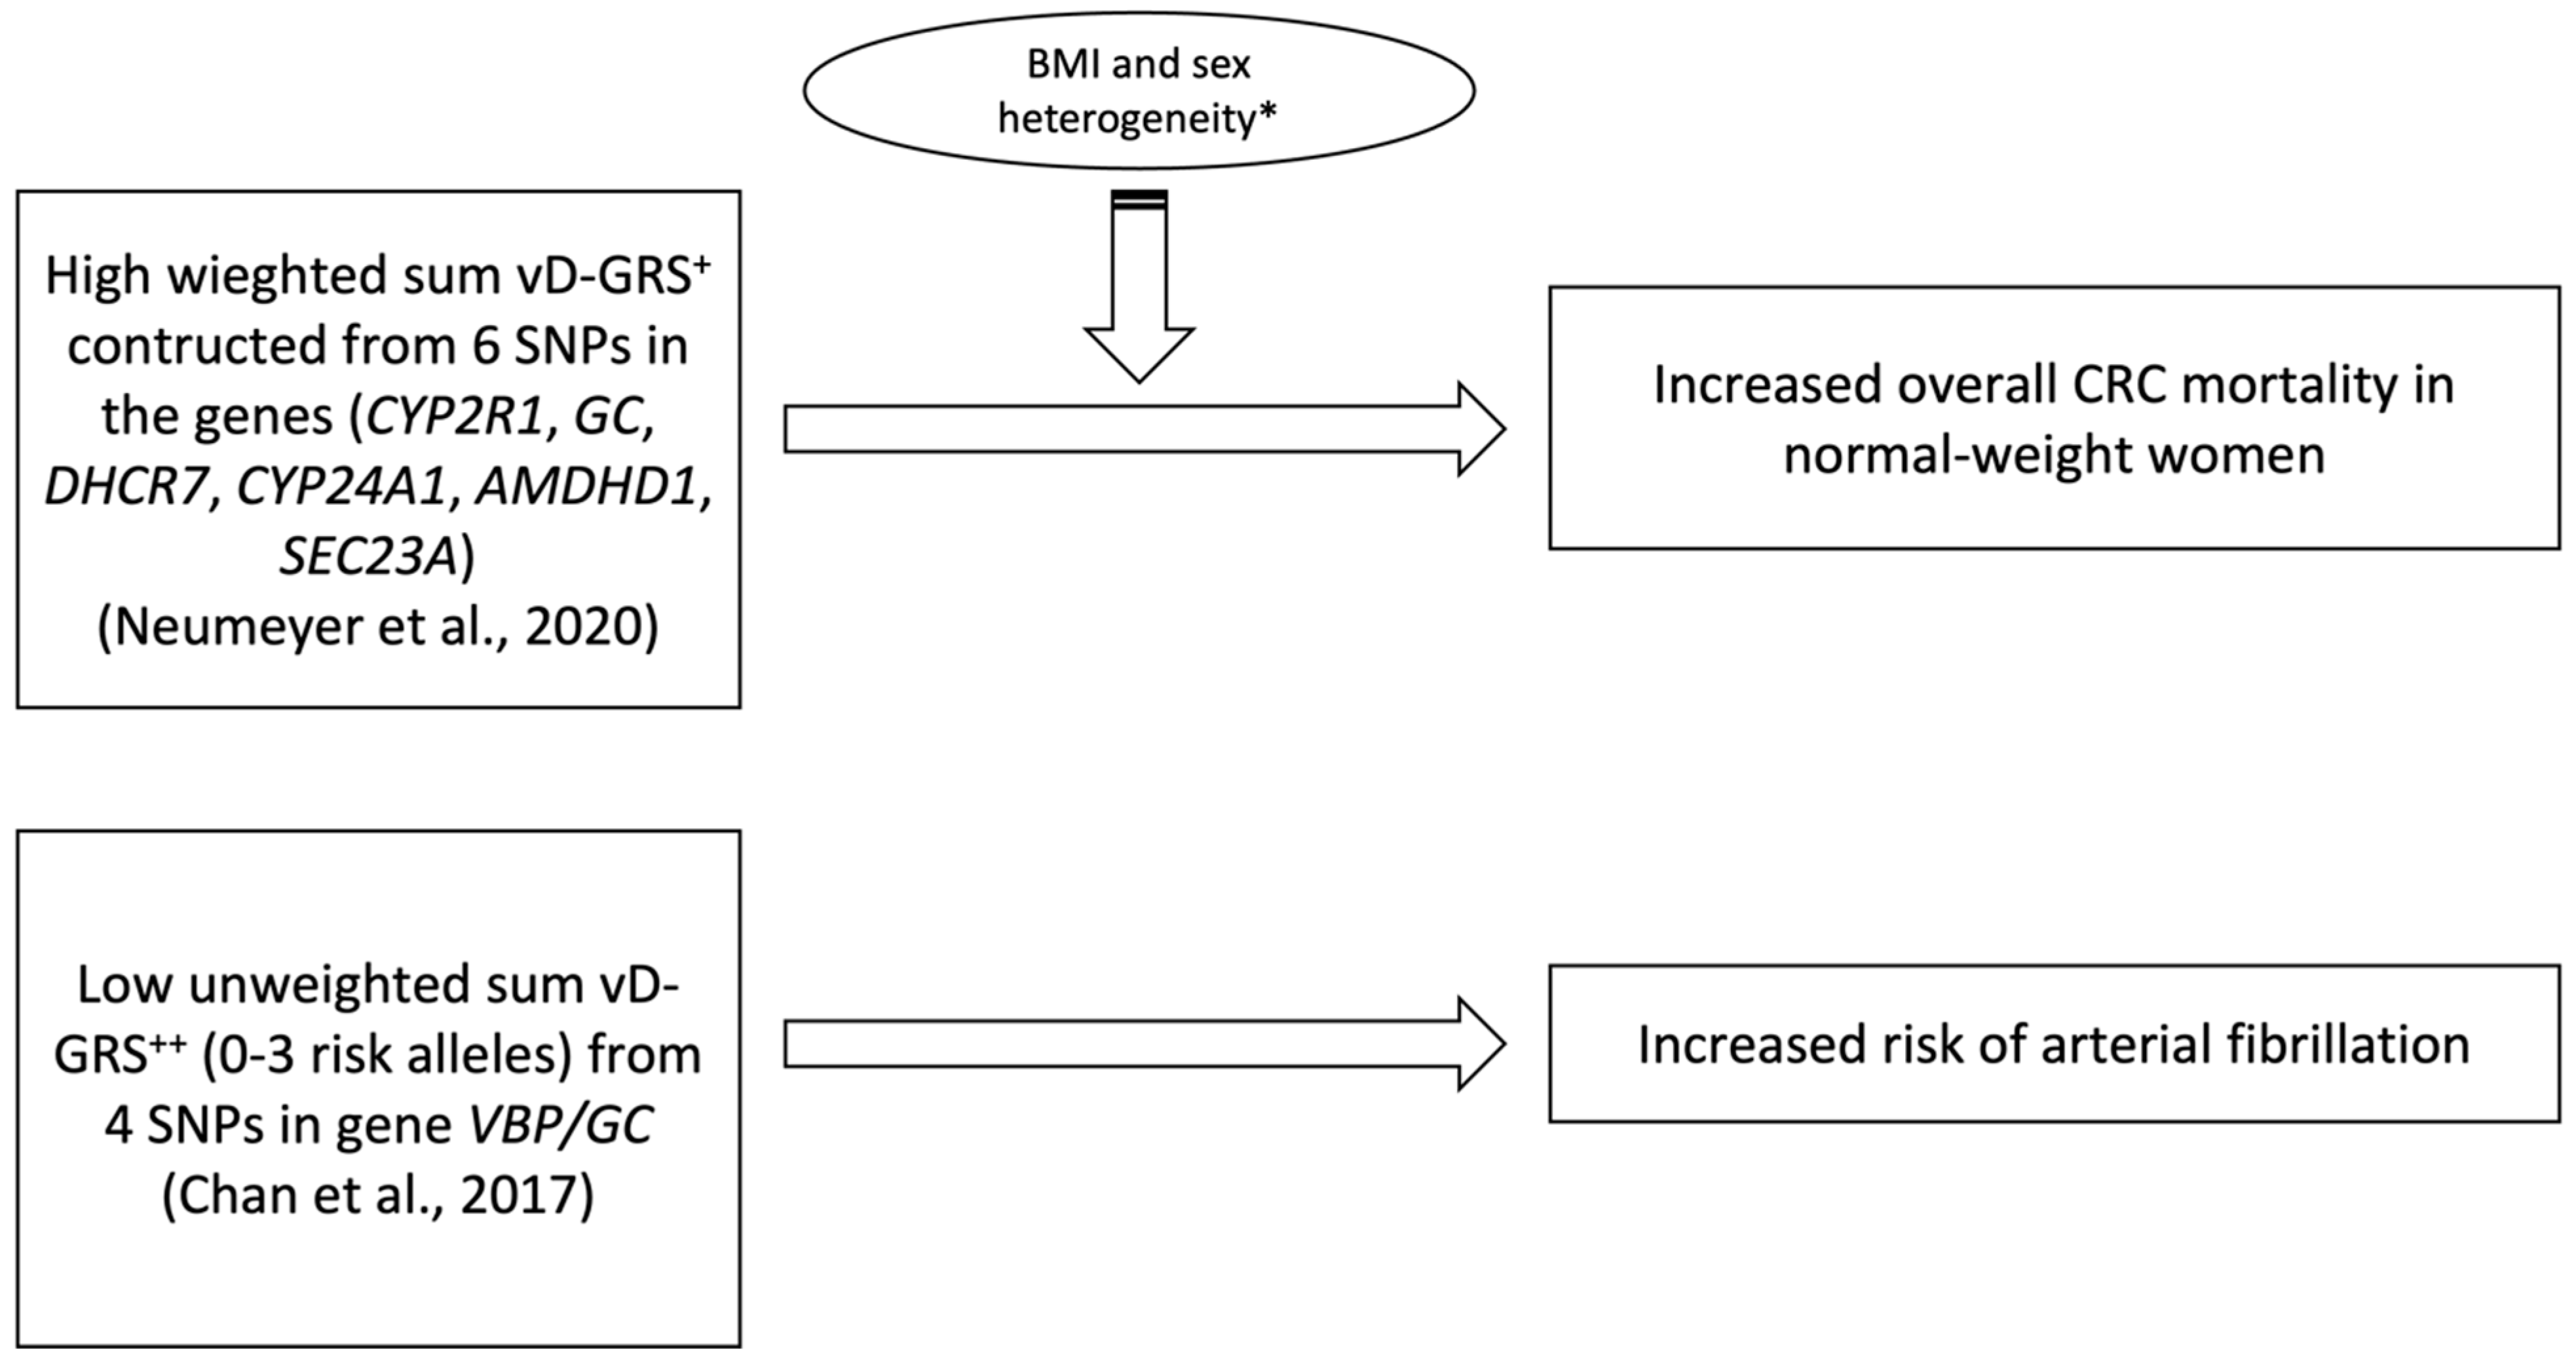
| Neumeyer et al., 2020 [48] | 6 | GC (rs2282679) CYP2R1 (rs10741657) DHCR7 (rs12785878) CYP24A1 (rs6013897) AMDHD1 (rs10745742) SEC23A (rs8018720) | GWAS of European populations [53,54] | Weighted, additive genetic model | Sum of number of vitamin D decreasing alleles weighted based on its effect size | Cox proportional hazard models | Age, sex and principal components (PCs) of genetic ancestry | 25(OH)D levels Overall survival Disease progression (time to progression) Tumor response | * ↑ vD-GRS w\ ↑ overall mortality in normal weight (p = 0.02) women (p = 0.01) |
| Yuan et al., 2020 [50] | 5 | GC (rs2282679) CYP2R1 (rs1993116) DHCR7 (rs12785878) CYP24A1 (rs6013897) NADSYN1 (rs11234027) | HapMap project | Weighted, additive genetic model | Each SNP was coded 0–2 based on the number of effect alleles and weighted based on its effect size | Cox proportional hazards regression | Age, sex, race/ethnicity, ECOG performance status, number of metastatic sites, and treatment arm | Cancer incidence Cancer Mortality Breast Cancer incidence Colorectal Cancer incidence Lung Cancer incidence Total incidence | No significant associations were found |
| Hiraki et al., 2013 [49] | 4 | GC (rs2282679) CYP2R1 (rs10741657) DHCR7/NADSYN1 (rs12785878) CYP24A1 (rs6013897) | GWAS of European populations | Unweighted, Simple Count | Summing the number of risk alleles yielding a possible range of 0-8 alleles | Generalized regression method [70] | Family history of CRC, BMI, NSAID use, alcohol use, dietary calcium, folate and red meat intake, sedentary status, and hormone replacement therapy | Colorectal Cancer Risk | No significant associations were found |
| Section C|Description of the studies focusing on vitamin D genetic risk score in association with cardiovascular diseases | |||||||||
| Chan et al., 2017 [47] | 4 | VBP/GC (rs4588 rs2282679, rs7041, rs1155563 | Prior GWAS | Unweighted, Simple Count | linear continuous 0–8 constructed based on the summation method | Univariable and multivariable logistic regression | Age, gender, BMI, smoking, hypertension, diabetes mellitus, systolic/diastolic BP, triglycerides, LDL/HDL-c, creatinine, use of lipid-lowering drugs, and seasonal variation of recruitment | BMI, diabetes, renal function, diastolic BP and LDL-C, beta-blockers, angiotensin-converting enzyme inhibitors/angio-tensin receptor blockers, and lipid-lowering drugs | * ↑ vD-GRS w\ ↓ risk of arterial fibrillation |
| Magnus et al., 2018 [46] | 4 | DHCR7 (rs12785878) DBP/GC (rs2282679) CYP24A1 (rs6013897) CYP2R1 (rs1074165) | Prior GWAS studies [53,71] | Weighted, additive genetic model | Sum of number of vitamin D decreasing alleles weighted based on its effect size | Multivariable regression analysis | Gestational week of blood sampling and seven principal components to account for population stratification | hypertension gestational hypertension or pre-eclampsia | No consistent evidence of any associations of the tested GRSs with gestational hypertension or pre-eclampsia |

4. Discussion
5. Conclusions
Author Contributions
Funding
Institutional Review Board Statement
Informed Consent Statement
Data Availability Statement
Acknowledgments
Conflicts of Interest
Abbreviations
| VD-GRS | vitamin D genetic risk score. |
| GWAS | genome wide association studies. |
| SNP | single nucleotide polymorphism. |
| MetS | metabolic syndrome. |
| BMI | body mass index. |
| PTH | parathyroid hormone. |
| P | phosphorus. |
| ALT | alanine aminotransferase. |
| CRE | creatinine; IL-6: interleukin 6. |
| hs-CRP | C-reactive protein. |
| WC | waist circumference. |
| BP | blood pressure. |
| SBP | systolic blood pressure. |
| DBP | diastolic blood pressure. |
| TG | triglyceride. |
| HDL-C | high-density lipoprotein cholesterol. |
| FBG | fasting blood glucose. |
| HbA1c | glycated hemoglobin. |
| SFA | saturated fatty acids. |
| BFP | body fat percentage. |
| LDL-C | low-density lipoprotein cholesterol. |
| CRC | colorectal cancer. |
| NSAIDs | non-steroidal anti-inflammatory drugs. |
References
- Kramer, A. An Overview of the Beneficial Effects of Exercise on Health and Performance. Adv. Exp. Med. Biol. 2020, 1228, 3–22. [Google Scholar]
- Bommer, C.; Sagalova, V.; Heesemann, E.; Manne-Goehler, J.; Atun, R.; Bärnighausen, T.; Davies, J.; Vollmer, S. Global Economic Burden of Diabetes in Adults: Projections From 2015 to 2030. Diabetes Care 2018, 41, 963–970. [Google Scholar] [CrossRef]
- Saklayen, M.G. The Global Epidemic of the Metabolic Syndrome. Curr. Hypertens. Rep. 2018, 20, 12. [Google Scholar] [CrossRef]
- Esposito, K.; Chiodini, P.; Colao, A.; Lenzi, A.; Giugliano, D. Metabolic syndrome and risk of cancer: A systematic review and meta-analysis. Diabetes Care 2012, 35, 2402–2411. [Google Scholar] [CrossRef]
- Bellou, V.; Belbasis, L.; Tzoulaki, I.; Evangelou, E. Risk factors for type 2 diabetes mellitus: An exposure-wide umbrella review of meta-analyses. PLoS ONE 2018, 13, e0194127. [Google Scholar] [CrossRef]
- Mottillo, S.; Filion, K.B.; Genest, J.; Joseph, L.; Pilote, L.; Poirier, P.; Rinfret, S.; Schiffrin, E.L.; Eisenberg, M.J. The Metabolic Syndrome and Cardiovascular Risk: A Systematic Review and Meta-Analysis. J. Am. Coll. Cardiol. 2010, 56, 1113–1132. [Google Scholar] [CrossRef]
- O’Neill, S.; O’Driscoll, L. Metabolic syndrome: A closer look at the growing epidemic and its associated pathologies. Obes. Rev. 2015, 16, 1–12. [Google Scholar] [CrossRef]
- Taheri, E.; Saedisomeolia, A.; Djalali, M.; Qorbani, M.; Civi, M.M. The relationship between serum 25-hydroxy vitamin D concentration and obesity in type 2 diabetic patients and healthy subjects. J. Diabetes Metab. Disord. 2012, 11, 16. [Google Scholar] [CrossRef]
- Legarth, C.; Grimm, D.; Wehland, M.; Bauer, J.; Krüger, M. The impact of vitamin D in the treatment of essential hypertension. Int. J. Mol. Sci. 2018, 19, 455. [Google Scholar] [CrossRef]
- Moukayed, M.; Grant, W.B. Linking the metabolic syndrome and obesity with vitamin D status: Risks and opportunities for improving cardiometabolic health and well-being. Diabetes Metab. Syndr. Obes. 2019, 12, 1437–1447. [Google Scholar] [CrossRef]
- Zhang, D. Effect of vitamin D on blood pressure and hypertension in the general population: An update meta-analysis of cohort studies and randomized controlled trials. Prev. Chronic Dis. 2020, 17, E03. [Google Scholar] [CrossRef] [PubMed]
- Medrano, M.; Carrillo-Cruz, E.; Montero, I.; Perez-Simon, J. Vitamin D: Effect on haematopoiesis and immune system and clinical applications. Int. J. Mol. Sci. 2018, 19, 2663. [Google Scholar] [CrossRef]
- Kuznia, S.; Zhu, A.; Akutsu, T.; Buring, J.E., Jr.; Cook, N.R.; Chen, L.-J.; Cheng, T.-Y.D.; Hantunen, S.; Lee, I.-M.; Manson, J.E.; et al. Efficacy of vitamin D3 supplementation on cancer mortality: Systematic review and individual patient data meta-analysis of randomised controlled trials. Ageing Res. Rev. 2023, 87, 101923. [Google Scholar] [CrossRef] [PubMed]
- Chandler, P.D.; Chen, W.Y.; Ajala, O.N.; Hazra, A.; Cook, N.; Bubes, V.; Lee, I.-M.; Giovannucci, E.L.; Willett, W.; Buring, J.E.; et al. Effect of Vitamin D3 Supplements on Development of Advanced Cancer: A Secondary Analysis of the VITAL Randomized Clinical Trial. JAMA Netw. Open 2020, 3, e2025850. [Google Scholar] [CrossRef]
- Gnagnarella, P.; Muzio, V.; Caini, S.; Raimondi, S.; Martinoli, C.; Chiocca, S.; Miccolo, C.; Bossi, P.; Cortinovis, D.; Chiaradonna, F.; et al. Vitamin D Supplementation and Cancer Mortality: Narrative Review of Observational Studies and Clinical Trials. Nutrients 2021, 13, 3285. [Google Scholar] [CrossRef]
- Marcotorchino, J.; Gouranton, E.; Romier, B.; Tourniaire, F.; Astier, J.; Malezet, C.; Amiot, M.-J.; Landrier, J.-F. Vitamin D reduces the inflammatory response and restores glucose uptake in adipocytes. Mol. Nutr. Food Res. 2012, 56, 1771–1782. [Google Scholar] [CrossRef]
- Amrein, K.; Scherkl, M.; Hoffmann, M.; Neuwersch-Sommeregger, S.; Köstenberger, M.; Berisha, A.T.; Martucci, G.; Pilz, S.; Malle, O. Vitamin D deficiency 2.0: An update on the current status worldwide. Eur. J. Clin. Nutr. 2020, 74, 1498–1513. [Google Scholar] [CrossRef] [PubMed]
- Vimaleswaran, K.S.; Berry, D.J.; Lu, C.; Tikkanen, E.; Pilz, S.; Hiraki, L.T.; Cooper, J.D.; Dastani, Z.; Li, R.; Houston, D.K.; et al. Causal relationship between obesity and vitamin D status: Bi-directional Mendelian randomization analysis of multiple cohorts. PLoS Med. 2013, 10, e1001383. [Google Scholar] [CrossRef]
- Bahrami, A.; Berry, D.J.; Lu, C.; Tikkanen, E.; Pilz, S.; Hiraki, L.T.; Cooper, J.D.; Dastani, Z.; Li, R.; Houston, D.K.; et al. Genetic and epigenetic factors influencing vitamin D status. J. Cell. Physiol. 2018, 233, 4033–4043. [Google Scholar] [CrossRef]
- Kuan, V.; Martineau, A.R.; Griffiths, C.J.; Hyppönen, E.; Walton, R. DHCR7 mutations linked to higher vitamin D status allowed early human migration to northern latitudes. BMC Evol. Biol. 2013, 13, 144. [Google Scholar] [CrossRef]
- Berry, D.J.; Vimaleswaran, K.S.; Whittaker, J.C.; Hingorani, A.D.; Hyppönen, E. Evaluation of genetic markers as instruments for Mendelian randomization studies on vitamin D. PLoS ONE 2012, 7, e37465. [Google Scholar] [CrossRef]
- Vimaleswaran, K.S.; The Genetic Investigation of Anthropometric Traits (GIANT) Consortium; Cavadino, A.; Berry, D.J.; Whittaker, J.C.; Power, C.; Järvelin, M.-R.; Hyppönen, E. Genetic association analysis of vitamin D pathway with obesity traits. Int. J. Obes. 2013, 37, 1399–1406. [Google Scholar] [CrossRef] [PubMed]
- Abbas, M.A. Physiological functions of Vitamin D in adipose tissue. J. Steroid Biochem. Mol. Biol. 2017, 165 Pt B, 369–381. [Google Scholar] [CrossRef]
- Molin, A.; Baudoin, R.; Kaufmann, M.; Souberbielle, J.C.; Ryckewaert, A.; Vantyghem, M.C.; Eckart, P.; Bacchetta, J.; Deschenes, G.; Kesler-Roussey, G.; et al. CYP24A1 Mutations in a Cohort of Hypercalcemic Patients: Evidence for a Recessive Trait. J. Clin. Endocrinol. Metab. 2015, 100, E1343–E1352. [Google Scholar] [CrossRef] [PubMed]
- Bikle, D.D.; Schwartz, J. Vitamin D Binding Protein, Total and Free Vitamin D Levels in Different Physiological and Pathophysiological Conditions. Front. Endocrinol. 2019, 10, 317. [Google Scholar] [CrossRef] [PubMed]
- Kongsbak, M.; Levring, T.B.; Egeisler, C.; von Essen, M.R. The vitamin d receptor and T cell function. Front. Immunol. 2013, 4, 148. [Google Scholar] [CrossRef]
- Jiang, X.; Kiel, D.P.; Kraft, P. The genetics of vitamin D. Bone 2019, 126, 59–77. [Google Scholar] [CrossRef]
- Fetahu, I.S.; Hummel, D.M.; Manhardt, T.; Aggarwal, A.; Baumgartner-Parzer, S.; Kállay, E. Regulation of the calcium-sensing receptor expression by 1,25-dihydroxyvitamin D3, interleukin-6, and tumor necrosis factor alpha in colon cancer cells. J. Steroid Biochem. Mol. Biol. 2014, 144 Pt A, 228–231. [Google Scholar] [CrossRef]
- Krasniqi, E.; Boshnjaku, A.; Wagner, K.-H.; Wessner, B. Association between Polymorphisms in Vitamin D Pathway-Related Genes, Vitamin D Status, Muscle Mass and Function: A Systematic Review. Nutrients 2021, 13, 3109. [Google Scholar] [CrossRef]
- Shekhar, H.U.; Chakraborty, S.; Mannoor, K.; Sarker, A.H. Recent Advances in Understanding the Role of Genomic and Epigenomic Factors in Noncommunicable Diseases. BioMed Res. Int. 2019, 2019, 1649873. [Google Scholar] [CrossRef] [PubMed]
- Sud, A.; Kinnersley, B.; Houlston, R.S. Genome-wide association studies of cancer: Current insights and future perspectives. Nat. Rev. Cancer 2017, 17, 692–704. [Google Scholar] [CrossRef]
- MacArthur, J.; Bowler, E.; Cerezo, M.; Gil, L.; Hall, P.; Hastings, E.; Junkins, H.; McMahon, A.; Milano, A.; Morales, J.; et al. The new NHGRI-EBI Catalog of published genome-wide association studies (GWAS Catalog). Nucleic Acids Res. 2017, 45, D896–D901. [Google Scholar] [CrossRef] [PubMed]
- Xin, J.; Chu, H.; Ben, S.; Ge, Y.; Shao, W.; Zhao, Y.; Wei, Y.; Ma, G.; Li, S.; Gu, D.; et al. Evaluating the effect of multiple genetic risk score models on colorectal cancer risk prediction. Gene 2018, 673, 174–180. [Google Scholar] [CrossRef]
- Hiraki, L.T.; Joshi, A.D.; Ng, K.; Fuchs, C.S.; Ma, J.; Hazra, A.; Peters, U.; Karlson, E.W.; Giovannucci, E.; Kraft, P.; et al. Joint effects of colorectal cancer susceptibility loci, circulating 25-hydroxyvitamin D and risk of colorectal cancer. PLoS ONE 2014, 9, e92212. [Google Scholar] [CrossRef] [PubMed]
- Igo, R.P., Jr.; Kinzy, T.G.; Bailey, J.N.C. Genetic Risk Scores. Curr. Protoc. Hum. Genet. 2019, 104, e95. [Google Scholar] [CrossRef]
- World Health Organization. Noncommunicable Diseases. 2022. Available online: https://www.who.int/news-room/fact-sheets/detail/noncommunicable-diseases (accessed on 20 April 2023).
- Stang, A. Critical evaluation of the Newcastle-Ottawa scale for the assessment of the quality of nonrandomized studies in meta-analyses. Eur. J. Epidemiol. 2010, 25, 603–605. [Google Scholar] [CrossRef] [PubMed]
- Sohani, Z.N.; Meyre, D.; de Souza, R.J.; Joseph, P.G.; Gandhi, M.; Dennis, B.B.; Norman, G.; Anand, S.S. Assessing the quality of published genetic association studies in meta-analyses: The quality of genetic studies (Q-Genie) tool. BMC Genet. 2015, 16, 50. [Google Scholar] [CrossRef] [PubMed]
- Page, M.J.; McKenzie, J.E.; Bossuyt, P.M.; Boutron, I.; Hoffmann, T.C.; Mulrow, C.D.; Shamseer, L.; Tetzlaff, J.M.; Akl, E.A.; Brennan, S.E.; et al. The PRISMA 2020 statement: An updated guideline for reporting systematic reviews. Int. J. Surg. 2021, 88, 105906. [Google Scholar] [CrossRef] [PubMed]
- Shan, X.; McKenzie, J.E.; Bossuyt, P.M.; Boutron, I.; Hoffmann, T.C.; Mulrow, C.D.; Shamseer, L.; Tetzlaff, J.M.; Akl, E.A.; Brennan, S.E.; et al. Association of Serum 25(OH)D with Metabolic Syndrome in Chinese Women of Childbearing Age. Nutrients 2022, 14, 2301. [Google Scholar] [CrossRef]
- Alathari, B.E.; Nyakotey, D.A.; Bawah, A.-M.; Lovegrove, J.A.; Annan, R.A.; Ellahi, B.; Vimaleswaran, K.S. Interactions between Vitamin D Genetic Risk and Dietary Factors on Metabolic Disease-Related Outcomes in Ghanaian Adults. Nutrients 2022, 14, 2301. [Google Scholar] [CrossRef]
- Chen, C.; Chen, Y.; Weng, P.; Xia, F.; Li, Q.; Zhai, H.; Wang, N.; Lu, Y. Association of 25-hydroxyvitamin D with cardiometabolic risk factors and metabolic syndrome: A mendelian randomization study. Nutr. J. 2019, 18, 61. [Google Scholar] [CrossRef] [PubMed]
- Lopez-Mayorga, A.; Hauger, H.; Petersen, R.A.; Vogel, U.; Damsgaard, C.T.; Lauritzen, L. Vitamin D-related genes and cardiometabolic markers in healthy children: A Mendelian randomisation study. Br. J. Nutr. 2020, 123, 1138–1147. [Google Scholar] [CrossRef]
- Wang, N.; Wang, C.; Chen, X.; Wan, H.; Chen, Y.; Chen, C.; Han, B.; Lu, Y. Vitamin D, prediabetes and type 2 diabetes: Bidirectional Mendelian randomization analysis. Eur. J. Nutr. 2020, 59, 1379–1388. [Google Scholar] [CrossRef]
- Alathari, B.E.; Aji, A.S.; Ariyasra, U.; Sari, S.R.; Tasrif, N.; Yani, F.F.; Sudji, I.R.; Lovegrove, J.A.; Lipoeto, N.I.; Vimaleswaran, K.S. Interaction between Vitamin D-Related Genetic Risk Score and Carbohydrate Intake on Body Fat Composition: A Study in Southeast Asian Minangkabau Women. Nutrients 2021, 13, 326. [Google Scholar] [CrossRef]
- Magnus, M.C.; Miliku, K.; Bauer, A.; Engel, S.M.; Felix, J.F.; Jaddoe, V.W.V.; A Lawlor, D.; London, S.J.; Magnus, P.; McGinnis, R.; et al. Vitamin D and risk of pregnancy related hypertensive disorders: Mendelian randomisation study. BMJ 2018, 361, k2167. [Google Scholar] [CrossRef] [PubMed]
- Chan, Y.H.; Yiu, K.-H.; Hai, J.J.; Chan, P.-H.; Lam, T.-H.; Cowling, B.J.; Sham, P.-C.; Lau, C.-P.; Lam, K.S.-L.; Siu, C.-W.; et al. Genetically deprived vitamin D exposure predisposes to atrial fibrillation. Europace 2017, 19 (Suppl. 4), iv25–iv31. [Google Scholar] [CrossRef]
- Neumeyer, S.; Butterbach, K.; Banbury, B.L.; Berndt, S.I.; Campbell, P.T.; Chlebowski, R.T.; Chan, A.T.; Giovannucci, E.L.; Joshi, A.D.; Ogino, S.; et al. Genetic Predictors of Circulating 25-Hydroxyvitamin D and Prognosis after Colorectal Cancer. Cancer Epidemiol. Biomark. Prev. 2020, 29, 1128–1134. [Google Scholar] [CrossRef] [PubMed]
- Hiraki, L.T.; Qu, C.; Hutter, C.M.; Baron, J.A.; Berndt, S.I.; Bézieau, S.; Brenner, H.; Caan, B.J.; Casey, G.; Chang-Claude, J.; et al. Genetic predictors of circulating 25-hydroxyvitamin d and risk of colorectal cancer. Cancer Epidemiol. Biomark. Prev. 2013, 22, 2037–2046. [Google Scholar] [CrossRef] [PubMed]
- Yuan, C.; Renfro, L.; Ambadwar, P.B.; Ou, F.-S.; McLeod, H.L.; Innocenti, F.; Meyerhardt, J.A.; Wolpin, B.M.; Goldberg, R.M.; Grothey, A.; et al. Influence of genetic variation in the vitamin D pathway on plasma 25-hydroxyvitamin D(3) levels and survival among patients with metastatic colorectal cancer. Cancer Causes Control. 2019, 30, 757–765. [Google Scholar] [CrossRef]
- Xu, M.; Huang, Y.; Xie, L.; Peng, K.; Ding, L.; Lin, L.; Wang, P.; Hao, M.; Chen, Y.; Sun, Y.; et al. Diabetes and Risk of Arterial Stiffness: A Mendelian Randomization Analysis. Diabetes 2016, 65, 1731–1740. [Google Scholar] [CrossRef]
- Cuellar-Partida, G.; Williams, K.M.; Yazar, S.; A Guggenheim, J.; Hewitt, A.W.; Williams, C.; Wang, J.J.; Kho, P.-F.; Saw, S.M.; Cheng, C.-Y.; et al. Genetically low vitamin D concentrations and myopic refractive error: A Mendelian randomization study. Int. J. Epidemiol. 2017, 46, 1882–1890. [Google Scholar] [CrossRef]
- Wang, T.J.; Zhang, F.; Richards, J.B.; Kestenbaum, B.; van Meurs, J.B.; Berry, D.; Kiel, D.P.; Streeten, E.A.; Ohlsson, C.; Koller, D.L.; et al. Common genetic determinants of vitamin D insufficiency: A genome-wide association study. Lancet 2010, 376, 180–188. [Google Scholar] [CrossRef]
- Jiang, X.; O’Reilly, P.F.; Aschard, H.; Hsu, Y.-H.; Richards, J.B.; Dupuis, J.; Ingelsson, E.; Karasik, D.; Pilz, S.; Berry, D.; et al. Genome-wide association study in 79,366 European-ancestry individuals informs the genetic architecture of 25-hydroxyvitamin D levels. Nat. Commun. 2018, 9, 260. [Google Scholar] [CrossRef]
- Lu, L.; Sheng, H.; Li, H.; Gan, W.; Liu, C.; Zhu, J.; Loos, R.J.F.; Lin, X. Associations between common variants in GC and DHCR7/NADSYN1 and vitamin D concentration in Chinese Hans. Hum. Genet. 2012, 131, 505–512. [Google Scholar] [CrossRef]
- Arabi, A.; Khoueiry-Zgheib, N.; Awada, Z.; Mahfouz, R.; Al-Shaar, L.; Hoteit, M.; Rahme, M.; Baddoura, R.; Halabi, G.; Singh, R.; et al. CYP2R1 polymorphisms are important modulators of circulating 25-hydroxyvitamin D levels in elderly females with vitamin insufficiency, but not of the response to vitamin D supplementation. Osteoporos. Int. 2017, 28, 279–290. [Google Scholar] [CrossRef]
- Yao, P.; Sun, L.; Lu, L.; Ding, H.; Chen, X.; Tang, L.; Xu, X.; Liu, G.; Hu, Y.; Ma, Y.; et al. Effects of Genetic and Nongenetic Factors on Total and Bioavailable 25(OH)D Responses to Vitamin D Supplementation. J. Clin. Endocrinol. Metab. 2016, 102, 100–110. [Google Scholar] [CrossRef]
- Tuncel, G.; Temel, S.G.; Ergoren, M.C. Strong association between VDR FokI (rs2228570) gene variant and serum vitamin D levels in Turkish Cypriots. Mol. Biol. Rep. 2019, 46, 3349–3355. [Google Scholar] [CrossRef]
- Foucan, L.; Vélayoudom-Céphise, F.-L.; Larifla, L.; Armand, C.; Deloumeaux, J.; Fagour, C.; Plumasseau, J.; Portlis, M.-L.; Liu, L.; Bonnet, F.; et al. Polymorphisms in GC and NADSYN1 Genes are associated with vitamin D status and metabolic profile in Non-diabetic adults. BMC Endocr. Disord. 2013, 13, 36. [Google Scholar] [CrossRef]
- Xu, X.; Mao, J.; Zhang, M.; Liu, H.; Li, H.; Lei, H.; Han, L.; Gao, M. Vitamin D Deficiency in Uygurs and Kazaks Is Associated with Polymorphisms in CYP2R1 and DHCR7/NADSYN1 Genes. Med. Sci. Monit. 2015, 21, 1960–1968. [Google Scholar]
- Zhang, Y.; Wang, X.; Liu, Y.; Qu, H.; Qu, S.; Wang, W.; Ren, L. The GC, CYP2R1 and DHCR7 genes are associated with vitamin D levels in northeastern Han Chinese children. Swiss Med. Wkly. 2012, 142, w13636. [Google Scholar] [CrossRef]
- Elkum, N.; Alkayal, F.; Noronha, F.; Ali, M.M.; Melhem, M.; Al-Arouj, M.; Bennakhi, A.; Behbehani, K.; Alsmadi, O.; Abubaker, J. Vitamin D insufficiency in Arabs and South Asians positively associates with polymorphisms in GC and CYP2R1 genes. PLoS ONE 2014, 9, e113102. [Google Scholar] [CrossRef] [PubMed]
- Kwak, S.Y.; Park, C.Y.; Jo, G.; Kim, O.Y.; Shin, M.-J. Association among genetic variants in the vitamin D pathway and circulating 25-hydroxyvitamin D levels in Korean adults: Results from the Korea National Health and Nutrition Examination Survey 2011–2012. Endocr. J. 2018, 65, 881–891. [Google Scholar] [CrossRef] [PubMed]
- Hibler, E.A.; Hu, C.; Jurutka, P.W.; Martinez, M.E.; Jacobs, E.T. Polymorphic variation in the GC and CASR genes and associations with vitamin D metabolite concentration and metachronous colorectal neoplasia. Cancer Epidemiol. Biomark. Prev. 2012, 21, 368–375. [Google Scholar] [CrossRef]
- Grzegorzewska, A.E.; Frycz, B.A.; Świderska, M.; Niepolski, L.; Mostowska, A.; Jagodziński, P.P. Calcium-sensing receptor gene (CASR) polymorphisms and CASR transcript level concerning dyslipidemia in hemodialysis patients: A cross-sectional study. BMC Nephrol. 2019, 20, 436. [Google Scholar] [CrossRef]
- Grzegorzewska, A.E.; Bednarski, D.; Świderska, M.; Mostowska, A.; Jagodziński, P.P. The Calcium-Sensing Receptor Gene Polymorphism rs1801725 and Calcium-Related Phenotypes in Hemodialysis Patients. Kidney Blood Press. Res. 2018, 43, 719–734. [Google Scholar] [CrossRef]
- Rooney, M.R.; Pankow, J.S.; Sibley, S.D.; Selvin, E.; Reis, J.P.; Michos, E.D.; Lutsey, P.L. Serum calcium and incident type 2 diabetes: The Atherosclerosis Risk in Communities (ARIC) study. Am. J. Clin. Nutr. 2016, 104, 1023–1029. [Google Scholar] [CrossRef]
- Petersen, R.A.; Larsen, L.H.; Damsgaard, C.T.; Sørensen, L.B.; Hjorth, M.F.; Andersen, R.; Tetens, I.; Krarup, H.; Ritz, C.; Astrup, A.; et al. Common genetic variants are associated with lower serum 25-hydroxyvitamin D concentrations across the year among children at northern latitudes. Br. J. Nutr. 2017, 117, 829–838. [Google Scholar] [CrossRef] [PubMed]
- Nissen, J.; Rasmussen, L.B.; Ravn-Haren, G.; Andersen, E.W.; Hansen, B.; Andersen, R.; Mejborn, H.; Madsen, K.H.; Vogel, U. Common variants in CYP2R1 and GC genes predict vitamin D concentrations in healthy Danish children and adults. PLoS ONE 2014, 9, e89907. [Google Scholar] [CrossRef]
- Tosteson, T.D.; Buzas, J.S.; Demidenko, E.; Karagas, M. Power and sample size calculations for generalized regression models with covariate measurement error. Stat. Med. 2003, 22, 1069–1082. [Google Scholar] [CrossRef] [PubMed]
- Ahn, J.; Yu, K.; Stolzenberg-Solomon, R.; Simon, K.C.; McCullough, M.L.; Gallicchio, L.; Jacobs, E.J.; Ascherio, A.; Helzlsouer, K.; Jacobs, K.B.; et al. Genome-wide association study of circulating vitamin D levels. Hum. Mol. Genet. 2010, 19, 2739–2745. [Google Scholar] [CrossRef] [PubMed]
- Milaneschi, Y.; Peyrot, W.J.; Nivard, M.G.; Mbarek, H.; Boomsma, D.I.; Penninx, B.W. A role for vitamin D and omega-3 fatty acids in major depression? An exploration using genomics. Transl. Psychiatry 2019, 9, 219. [Google Scholar] [CrossRef]
- Trumbo, P.; Schlicker, S.; Yates, A.A.; Poos, M.; Food and Nutrition Board of the Institute of Medicine, The National Academies. Dietary reference intakes for energy, carbohydrate, fiber, fat, fatty acids, cholesterol, protein and amino acids. J. Am. Diet. Assoc. 2002, 102, 1621–1630. [Google Scholar] [CrossRef]
- Sallinen, R.J.; Dethlefsen, O.; Ruotsalainen, S.; Mills, R.D.; A Miettinen, T.; E Jääskeläinen, T.; Lundqvist, A.; Kyllönen, E.; Kröger, H.; I Karppinen, J.; et al. Genetic Risk Score for Serum 25-Hydroxyvitamin D Concentration Helps to Guide Personalized Vitamin D Supplementation in Healthy Finnish Adults. J. Nutr. 2021, 151, 281–292. [Google Scholar] [CrossRef]
- Cheung, C.L.; Lau, K.-S.; Sham, P.-C.; Tan, K.C.; Kung, A.W. Genetic variant in vitamin D binding protein is associated with serum 25-hydroxyvitamin D and vitamin D insufficiency in southern Chinese. J. Hum. Genet. 2013, 58, 749–751. [Google Scholar] [CrossRef]
- Fiamenghi, V.I.; Mello, E.D. Vitamin D deficiency in children and adolescents with obesity: A meta-analysis. J. Pediatr. 2021, 97, 273–279. [Google Scholar] [CrossRef]
- Lee, H.; Bae, S.; Yoon, Y. Anti-adipogenic effects of 1,25-dihydroxyvitamin D3 are mediated by the maintenance of the wingless-type MMTV integration site/β-catenin pathway. Int. J. Mol. Med. 2012, 30, 1219–1224. [Google Scholar] [CrossRef]
- Kong, J.; Li, Y.C. Molecular mechanism of 1,25-dihydroxyvitamin D3 inhibition of adipogenesis in 3T3-L1 cells. Am. J. Physiol. Endocrinol. Metab. 2006, 290, E916–E924. [Google Scholar] [CrossRef] [PubMed]
- Mitri, J.; Muraru, M.D.; Pittas, A.G. Vitamin D and type 2 diabetes: A systematic review. Eur. J. Clin. Nutr. 2011, 65, 1005–1015. [Google Scholar] [CrossRef]
- Grimnes, G.; Figenschau, Y.; Almås, B.; Jorde, R. Vitamin D, insulin secretion, sensitivity, and lipids: Results from a case-control study and a randomized controlled trial using hyperglycemic clamp technique. Diabetes 2011, 60, 2748–2757. [Google Scholar] [CrossRef]
- Sung, C.C.; Liao, M.-T.; Lu, K.-C.; Wu, C.-C. Role of vitamin D in insulin resistance. J. Biomed. Biotechnol. 2012, 2012, 634195. [Google Scholar] [CrossRef] [PubMed]
- Mineo, C.; Shaul, P.W. Novel biological functions of high-density lipoprotein cholesterol. Circ. Res. 2012, 111, 1079–1090. [Google Scholar] [CrossRef]
- Saheb Sharif-Askari, F.; Sharif-Askari, N.S.; Halwani, R.; Abusnana, S.; Hamoudi, R.; Sulaiman, N. Low Vitamin D Serum Level Is Associated with HDL-C Dyslipidemia and Increased Serum Thrombomodulin Levels of Insulin-Resistant Individuals. Diabetes Metab. Syndr. Obes. 2020, 13, 1599–1607. [Google Scholar] [CrossRef]
- Zhang, W.; Yi, J.; Liu, D.; Wang, Y.; Jamilian, P.; Gaman, M.-A.; Prabahar, K.; Fan, J. The effect of vitamin D on the lipid profile as a risk factor for coronary heart disease in postmenopausal women: A meta-analysis and systematic review of randomized controlled trials. Exp. Gerontol. 2022, 161, 111709. [Google Scholar] [CrossRef]
- Surdu, A.M.; Pînzariu, O.; Ciobanu, D.-M.; Negru, A.-G.; Căinap, S.-S.; Lazea, C.; Iacob, D.; Săraci, G.; Tirinescu, D.; Borda, I.M.; et al. Vitamin D and Its Role in the Lipid Metabolism and the Development of Atherosclerosis. Biomedicines 2021, 9, 172. [Google Scholar] [CrossRef]
- Autier, P.; Boniol, M.; Pizot, C.; Mullie, P. Vitamin D status and ill health: A systematic review. Lancet Diabetes Endocrinol. 2014, 2, 76–89. [Google Scholar] [CrossRef]
- Man, J.; Zhang, T.; Yin, X.; Chen, H.; Zhang, Y.; Zhang, X.; Chen, J.; Yang, X.; Lu, M. Spatiotemporal Trends of Colorectal Cancer Mortality Due to Low Physical Activity and High Body Mass Index from 1990 to 2019: A Global, Regional and National Analysis. Front. Med. 2021, 8, 800426. [Google Scholar] [CrossRef]
- Nuri Faruk, A.; Mehmet, A.; Tahsin, Ö. Body Mass Index and Colorectal Cancer. In Body-Mass Index and Health; Emel, Ö.A., Ed.; IntechOpen: Rijeka, Croatia, 2018; p. 5. [Google Scholar]
- Bikle, D.D. Vitamin D and cancer: The promise not yet fulfilled. Endocrine 2014, 46, 29–38. [Google Scholar] [CrossRef]
- McMullan, C.J.; Borgi, L.; Curhan, G.C.; Fisher, N.; Forman, J.P. The effect of vitamin D on renin-angiotensin system activation and blood pressure: A randomized control trial. J. Hypertens. 2017, 35, 822–829. [Google Scholar] [CrossRef]
- Gembillo, G.; Siligato, R.; Amatruda, M.; Conti, G.; Santoro, D. Vitamin D and Glomerulonephritis. Medicina 2021, 57, 186. [Google Scholar] [CrossRef] [PubMed]
- Khatib, R.; Joseph, P.; Briel, M.; Yusuf, S.; Healey, J. Blockade of the renin-angiotensin-aldosterone system (RAAS) for primary prevention of non-valvular atrial fibrillation: A systematic review and meta analysis of randomized controlled trials. Int. J. Cardiol. 2013, 165, 17–24. [Google Scholar] [CrossRef]
- Liu, X.; Wang, W.; Tan, Z.; Zhu, X.; Liu, M.; Wan, R.; Hong, K. The relationship between vitamin D and risk of atrial fibrillation: A dose-response analysis of observational studies. Nutr. J. 2019, 18, 73. [Google Scholar] [CrossRef] [PubMed]

| Section A|Newcastle-Ottawa Quality Assessment Scale Criteria for Cross-Sectional Studies | ||||||||||||
| Study | Selection | Comparability | Outcome | Final Quality score | ||||||||
| Representativeness of the cases | Sample size | Non-included subjects | The potential confounders were investigated using subgroup analysis or multivariable analysis | Assessment of the outcome | Statistical test | |||||||
| Shan et al., 2022 [40] | * | * | * | ** | * | - | 6—Moderate | |||||
| Alathari et al., 2022 [41] | * | - | * | ** | * | * | 6—Moderate | |||||
| Alathari et al., 2021 [45] | * | - | * | ** | * | * | 6—Moderate | |||||
| Section B|Newcastle-Ottawa Quality Assessment Scale Criteria for Cohort Studies | ||||||||||||
| study | Selection | Comparability | Outcome | Final Quality score | ||||||||
| Representativeness of the exposed cohort | Comparability of cohorts based on the design or analysis | Ascertainment of exposure | Demonstration that outcome of interest was not present at start of study | Comparability of cohorts based on the design or analysis | Assessment of the outcome | Was follow up long enough for outcomes to occur? | Adequacy of follow up of cohorts | |||||
| Neumeyer et al., 2020 [48] | * | * | * | * | ** | ** | * | * | 9—Very Good | |||
| Yuan et al., 2020 [50] | * | * | * | * | ** | ** | * | * | 9—Very Good | |||
| Section C|Newcastle-Ottawa Quality Assessment Scale Criteria for Case–Control Studies | ||||||||||||
| study | Selection | Comparability | Exposure | Final Quality score | ||||||||
| Is the case definition adequate? | Representativeness of the cases | Selection of controls | Definition of controls | Comparability of cases and controls on the basis of the design or analysis | Assessment of the exposure | Same method of ascertainment for cases and controls | Non-Response rate | |||||
| Hiraki et al., 2013 [49] | * | * | * | * | * | * | * | N\A | 7—Good | |||
| Chan et al., 2017 [47] | * | * | * | * | * | * | * | N\A | 7—Good | |||
| Section D|Quality of Genetic Association Studies (Q-Genie) for Mendelian Randomization Studies | ||||||||||||
| Study | Rationale for study | Selection and definition of outcome of interest | Selection and comparability of comparison groups | Technical classification of the exposure | Non-technical classification of the exposure | Other sources of bias | Sample size and power | A priori planning of analyses | Statistical methods and control for confounding | Testing of assumptions and inferences for genetic analyses | Appropriateness of inferences drawn from results | Final Quality score |
| Chen et al., 2019 [42] | 5 | 5 | N\A | 4 | 5 | 2 | 6 | 6 | 5 | 3 | 6 | 48—Good |
| Wang et al., 2020 [44] | 6 | 5 | N\A | 4 | 2 | 2 | 6 | 6 | 6 | 4 | 5 | 46—Good |
| Lopez-Mayorg et al., 2020 [43] | 4 | 6 | N\A | 5 | 2 | 3 | 3 | 6 | 3 | 4 | 5 | 41—Good |
| Magnus et al., 2018 [46] | 6 | 6 | N\A | 6 | 4 | 3 | 5 | 6 | 6 | 5 | 5 | 52—Good |
| First Author, Year [Ref] | Study Design | Study Population | Population Description | Cohort Name | Number of Study Participants | Age (y, Range) | % Female | Outcome Phenotype Studied |
|---|---|---|---|---|---|---|---|---|
| Shan et al., 2022 [40] | Cross-sectional | Chinese | Non-diabetic women of childbearing age | 2015 Chinese Adult Chronic Disease and Nutrition Surveillance (CCDNS) | 1505 | 18–44 | 100 | Metabolic Syndrome |
| Alathari et al., 2022 [41] | Cross-sectional | West African Ghanaian | Healthy Adults | Genetics of Obesity and Nutrition in Ghana (GONG) | 302 | 25–60 | ~58.28 | Obesity and type 2 diabetes |
| Alathari et al., 2021 [45] | Cross-sectional | Southeast Asian Minangkabau Indonesian | Healthy | Minangkabau Indonesia Study on Nutrition and Genetics (MINANG) | 110 | 25–60 | 100 | Metabolic diseases |
| Chen et al., 2019 [42] | Mendelian Randomization | Eastern Chinese | General population with detailed metabolic profiles measured | Survey on Prevalence in East China for Metabolic Diseases and Risk Factors (SPECT-China) | 10,655 | 18–93 | 60 | Metabolic Syndrome |
| Wang et al., 2020 [44] | Mendelian Randomization | Eastern Chinese | General population with detailed metabolic profiles measured | Survey on Prevalence in East China for Metabolic Diseases and Risk Factors (SPECT-China) | 10,655 | 18–93 | 60 | Type 2 Diabetes Pre-diabetes |
| Lopez-Mayorg et al., 2020 [43] | Mendelian randomization | Danish | Healthy Schoolchildren | OPUS School Meal Study | 699 | 8–11 | 47 | Metabolic Syndrome |
| Neumeyer et al., 2020 [48] | Prospective Cohort | European populations | CRC patients | International Survival Analysis in Colorectal Cancer Consortium (ISACC) | 7657 | - | 54.6 | Colorectal Cancer Survival |
| Yuan et al., 2020 [50] | Prospective Cohort | European populations | Patients with previously untreated mCRC | North Central Cancer Treatment Group (NCCTG) trial N9741 | 535 | - | - | Metastatic Colorectal Cancer Survival |
| Hiraki et al., 2013 [49] | Case–Control | European population | Controls without colorectal adenocarcinoma Cases with colorectal adenocarcinoma | 13 studies within Genetics and Epidemiology of Colorectal Cancer Consortium (GECCO) and Colon Cancer Family Registry (CCFR) | A total of 10,061 cases and 12,768 controls | - | 53 | Breast Cancer Colorectal Cancer Lung Cancer |
| Chan et al., 2017 [47] | Case–Control | Chinese | Controls without AF and cases with AF | Chinese clinical cohort of cardiac outpatients with stable coronary artery disease. | A total of 156 cases and 1019 controls | 60.4–79.2 | Cases: 30 Control: 25 | Atrial Fibrillation |
| Magnus et al., 2018 [46] | Mendelian Randomization | European population | Patients with gestational hypertension or pre-eclampsia | Avon Longitudinal Study of Parents and Children (ALSPAC) and the Generation R Study | 7389 | - | 100 | Pregnancy-related Hypertensive Disorders |
| Vitamin D-GRS SNPs | |||||||||||||||||
|---|---|---|---|---|---|---|---|---|---|---|---|---|---|---|---|---|---|
| Studies/Gene (SNP) | DHCR7 (rs12785878) | CYP2R1 (rs12794714) | CYP2R1 (rs10741657) | CYP2R1 (rs10500804) | CYP2R1 (rs1993116) | CYP24A1 (rs6013897) | DBP/GC (rs2282679) | GC (rs7041) | GC (rs12512631) | GC (rs3755967) | GC (rs4588) | VDR (rs2228570) | VDR (rs7975232) | AMDHD1 (rs10745742) | SEC23A (rs8018720) | CASR (rs1801725) | NADSYN1 (rs11234027) |
| Shan et al., 2022 [40] | ✔ | ✔ | ✔ | ||||||||||||||
| Alathari et al., 2022 [41] | ✔ | ✔ | ✔ | ✔ | ✔ | ✔ | ✔ | ✔ | |||||||||
| Alathari et al., 2021 [45] | ✔ | ✔ | ✔ | ✔ | ✔ | ||||||||||||
| Chen et al., 2019 [42] | ✔ | ✔ | ✔ | ✔ | |||||||||||||
| Wang et al., 2020 [44] | ✔ | ✔ | ✔ | ✔ | |||||||||||||
| Lopez-Mayorg et al., 2020 [43] | ✔ | ✔ | ✔ | ✔ | |||||||||||||
| Neumeyer et al., 2020 [48] | ✔ | ✔ | ✔ | ✔ | ✔ | ✔ | |||||||||||
| Yuan et al., 2020 [50] | ✔ | ✔ | ✔ | ✔ | ✔ | ||||||||||||
| Hiraki et al., 2013 [49] | ✔ | ✔ | ✔ | ✔ | |||||||||||||
| Chan et al., 2017 [47] | ✔ | ✔ | ✔ | ✔ | |||||||||||||
| Magnus et al., 2018 [46] | ✔ | ✔ | ✔ | ✔ | |||||||||||||
Disclaimer/Publisher’s Note: The statements, opinions and data contained in all publications are solely those of the individual author(s) and contributor(s) and not of MDPI and/or the editor(s). MDPI and/or the editor(s) disclaim responsibility for any injury to people or property resulting from any ideas, methods, instructions or products referred to in the content. |
© 2023 by the authors. Licensee MDPI, Basel, Switzerland. This article is an open access article distributed under the terms and conditions of the Creative Commons Attribution (CC BY) license (https://creativecommons.org/licenses/by/4.0/).
Share and Cite
Almaghrbi, H.; Al-Shafai, M.; Al-Asmakh, M.; Bawadi, H. Association of Vitamin D Genetic Risk Score with Noncommunicable Diseases: A Systematic Review. Nutrients 2023, 15, 4040. https://doi.org/10.3390/nu15184040
Almaghrbi H, Al-Shafai M, Al-Asmakh M, Bawadi H. Association of Vitamin D Genetic Risk Score with Noncommunicable Diseases: A Systematic Review. Nutrients. 2023; 15(18):4040. https://doi.org/10.3390/nu15184040
Chicago/Turabian StyleAlmaghrbi, Heba, Mashael Al-Shafai, Maha Al-Asmakh, and Hiba Bawadi. 2023. "Association of Vitamin D Genetic Risk Score with Noncommunicable Diseases: A Systematic Review" Nutrients 15, no. 18: 4040. https://doi.org/10.3390/nu15184040
APA StyleAlmaghrbi, H., Al-Shafai, M., Al-Asmakh, M., & Bawadi, H. (2023). Association of Vitamin D Genetic Risk Score with Noncommunicable Diseases: A Systematic Review. Nutrients, 15(18), 4040. https://doi.org/10.3390/nu15184040