
Influence of Vitamin D on the Incidence of Metabolic Syndrome and Hormonal Balance in Patients with Polycystic Ovary Syndrome

 , ,
, ,  , , ,
, , ,
Abstract
1. Introduction
2. Materials and Methods
2.1. Participation in the Study
- women diagnosed with polycystic ovary syndrome (80 patients)—PCOS group.
- women menstruating regularly, without features of androgenization, in whom polycystic ovary syndrome was excluded (40 patients).
2.2. Research Methodology
2.2.1. Anthropometric Measurements and Gynaecological Examination
2.2.2. Laboratory Tests
2.3. Statistical Analysis
3. Results
3.1. Characteristics of the Group
3.2. Comparison of Anthropometric Results in the Female Subjects
3.3. Comparison of Concentrations of Selected Hormones in the Women Studied
3.4. Vitamin D 25(OH)
4. Discussion
5. Conclusions
Author Contributions
Funding
Institutional Review Board Statement
Informed Consent Statement
Data Availability Statement
Conflicts of Interest
References
- Linus Pauling Institute, Oregon State University. Vitamin D; Linus Pauling Institute, Oregon State University: Corvallis, OR, USA, 11 February 2021. [Google Scholar]
- Adorini, L.; Penna, G. Control of autoimmune diseases by the vitamin D endocrine system. Nat. Clin. Pract. Rheumatol. 2008, 4, 404–412. [Google Scholar] [CrossRef]
- Autier, P.; Gandini, S. Vitamin D supplementation and total mortality: A meta-analysis of randomized controlled trials. Arch. Intern. Med. 2007, 167, 1730–1737. [Google Scholar] [CrossRef]
- Ginde, A.A.; Mansbach, J.M.; Camargo, C.A. Association between Serum 25-hydroxyvitamin D level and upper respiratory tract infection in the Third National Health and Nutrition Examination Survey. Arch. Intern. Med. 2009, 169, 384–390. [Google Scholar] [CrossRef] [PubMed]
- Nazarian, S.; St. Peter, J.V.; Boston, R.C.; Jones, S.A.; Mariash, C.N. Vitamin D3 supplementation improves insulin sensitivity in subjects with impaired fasting glucose Shaban. Transl. Res. 2011, 158, 276–281. [Google Scholar] [CrossRef] [PubMed]
- Deleskog, A.; Hilding, A.; Brismar, K.; Hamsten, A.; Efendic, S.; Östenson, C.G. Low serum 25-hydroxyvitamin D level predicts progression to type 2 diabetes in individuals with prediabetes but not with normal glucose tolerance. Diabetologia 2012, 55, 1668–1678. [Google Scholar] [CrossRef] [PubMed]
- Li, Y.C.; Kong, J.; Wei, M.; Chen, Z.-F.; Liu, S.Q.; Cao, L.-P. 1,25-Dihydroxyvitamin D3 is a negative endocrine regulator of the renin-angiotensin system. J. Clin. Investig. 2002, 110, 229–238. [Google Scholar] [CrossRef]
- He, C.; Lin, Z.; Robb, S.W.; Ezeamama, A.E. Serum vitamin d levels and polycystic ovary syndrome: A systematic review and meta-analysis. Nutrients 2015, 7, 4555–4577. [Google Scholar] [CrossRef] [PubMed]
- Walsh, J.S.; Bowles, S.; Evans, A.L. Vitamin D in obesity. Curr. Opin. Endocrinol. Diabetes Obes. 2017, 24, 389–394. [Google Scholar] [CrossRef]
- Płudowski, P.; Ducki, C.; Konstantynowicz, J.; Jaworski, M. Vitamin D status in Poland. Pol. Arch. Med. Wewn. 2016, 126, 530–539. [Google Scholar] [CrossRef]
- Krul-Poel, Y.H.M.; Koenders, P.P.; Steegers-Theunissen, R.P.; Boekel, E.T.; Ter Wee, M.M.; Louwers, Y.; Lips, P.; Laven, J.S.E.; Simsek, S. Vitamin D and metabolic disturbances in polycystic ovary syndrome (PCOS): A cross-sectional study. PLoS ONE 2018, 13, e0204748. [Google Scholar] [CrossRef]
- Mishra, S.; Das, A.K.; Das, S. Hypovitaminosis D and associated cardiometabolic risk in women with PCOS. J. Clin. Diagn. Res. 2016, 10, BC01. [Google Scholar] [CrossRef]
- Romanowski, M.D.; Parolin, M.B.; Freitas, A.C.T.; Piazza, M.J.; Basso, J.; Urbanetz, A.A. Prevalence of non-alcoholic fatty liver disease in women with polycystic ovary syndrome and its correlation with metabolic syndrome. Arq. Gastroenterol. 2015, 52, 117–123. [Google Scholar] [CrossRef] [PubMed]
- Krentowska, A.; Łebkowska, A.; Jacewicz-Święcka, M.; Hryniewicka, J.; Leśniewska, M.; Adamska, A.; Kowalska, I. Metabolic syndrome and the risk of cardiovascular complications in young patients with different phenotypes of polycystic ovary syndrome. Endocrine 2021, 72, 400–410. [Google Scholar] [CrossRef] [PubMed]
- Muscogiuri, G.; Policola, C.; Prioletta, A.; Sorice, G.; Mezza, T.; Lassandro, A.; Della Casa, S.; Pontecorvi, A.; Giaccari, A. Low levels of 25(OH)D and insulin-resistance: 2 unrelated features or a cause-effect in PCOS? Clin. Nutr. 2012, 31, 476–480. [Google Scholar] [CrossRef] [PubMed]
- Blum, M.; Dolnikowski, G.; Seyoum, E.; Harris, S.S.; Booth, S.L.; Peterson, J.; Saltzman, E.; Dawson-Hughes, B. Vitamin D3 in fat tissue. Endocrine 2008, 33, 90–94. [Google Scholar] [CrossRef]
- Panidis, D.; Balaris, C.; Farmakiotis, D.; Rousso, D.; Kourtis, A.; Balaris, V.; Katsikis, I.; Zournatzi, V.; Diamanti-Kandarakis, E. Serum parathyroid hormone concentrations are increased in women with polycystic ovary syndrome. Clin. Chem. 2005, 51, 1691–1697. [Google Scholar] [CrossRef]
- Savastano, S.; Valentino, R.; Di Somma, C.; Orio, F.; Pivonello, C.; Passaretti, F.; Brancato, V.; Formisano, P.; Colao, A.; Beguinot, F.; et al. Serum 25-Hydroxyvitamin D Levels, phosphoprotein enriched in diabetes gene product (PED/PEA-15) and leptin-to-adiponectin ratio in women with PCOS. Nutr. Metab. 2011, 8, 84. [Google Scholar] [CrossRef]
- Hahn, S.; Haselhorst, U.; Tan, S.; Quadbeck, B.; Schmidt, M.; Roesler, S.; Kimmig, R.; Mann, K.; Janssen, O. Low serum 25-hydroxyvitamin D concentrations are associated with insulin resistance and obesity in women with polycystic ovary syndrome. Exp. Clin. Endocrinol. Diabetes 2006, 114, 577–583. [Google Scholar] [CrossRef]
- Tsakova, A.D.; Gateva, A.T.; Kamenov, Z.A. 25(OH) vitamin D levels in premenopausal women with polycystic ovary syndrome and/or obesity. Int. J. Vitam. Nutr. Res. 2012, 82, 399–404. [Google Scholar] [CrossRef]
- Lind, L.; Pollare, T.; Hvarfner, A.; Lithell, H.; Sørensen, O.H.; Ljunghall, S. Long-term treatment with active vitamin D (alphacalcidol) in middle-aged men with impaired glucose tolerance. Effects on insulin secretion and sensitivity, glucose tolerance and blood pressure. Diabetes Res. 1989, 11, 141–147. [Google Scholar]
- Zhao, J.F.; Li, B.X.; Zhang, Q. Vitamin D improves levels of hormonal, oxidative stress and inflammatory parameters in polycystic ovary syndrome: A meta-analysis study. Ann. Palliat. Med. 2021, 10, 169–183. [Google Scholar] [CrossRef] [PubMed]
- Earl, F.; Umed, A.; Lisa, M. Concentrations of serum vitamin D and the metabolic syndrome among US adults. Diabetes Care 2005, 28, 1228–1230. [Google Scholar]
- EWehr, E.; Pilz, S.; Schweighofer, N.; Giuliani, A.; Kopera, D.; Pieber, T.R.; Obermayer-Pietsch, B. Association of hypovitaminosis D with metabolic disturbances in polycystic ovary syndrome. Eur. J. Endocrinol. 2009, 161, 575–582. [Google Scholar] [CrossRef]
- Akbari, M.; Ostadmohammadi, V.; Lankarani, K.B.; Tabrizi, R.; Kolahdooz, F.; Heydari, S.T.; Kavari, S.H.; Mirhosseini, N.; Mafi, A.; Dastorani, M.; et al. The Effects of Vitamin D Supplementation on Biomarkers of Inflammation and Oxidative Stress among Women with Polycystic Ovary Syndrome: A Systematic Review and Meta-Analysis of Randomized Controlled Trials. Horm. Metab. Res. 2018, 50, 271–279. [Google Scholar] [CrossRef]
- Mansournia, M.A.; Ostadmohammadi, V.; Doosti-Irani, A.; Ghayour-Mobarhan, M.; Ferns, G.; Akbari, H.; Ghaderi, A.; Talari, H.R.; Asemi, Z. The Effects of Vitamin D Supplementation on Biomarkers of Inflammation and Oxidative Stress in Diabetic Patients: A Systematic Review and Meta-Analysis of Randomized Controlled Trials. Horm. Metab. Res. 2018, 50, 429–440. [Google Scholar] [CrossRef]


| n | % | p | |
|---|---|---|---|
| PCOS | 21 | 26.3 | 0.015 |
| Control | 3 | 7.5 |
| Group | Median | Q1 | Q3 | p |
|---|---|---|---|---|
| Waist circumference (cm) | ||||
| PCOS | 85.50 | 71.50 | 100.50 | 0.001 |
| Control | 72.00 | 68.00 | 81.50 | |
| WHR | ||||
| PCOS | 0.82 | 0.73 | 0.89 | 0.001 |
| Control | 0.74 | 0.70 | 0.81 | |
| BMI (kg/m2) | ||||
| PCOS | 26.05 | 17.70 | 42.00 | 0.000 |
| Control | 22.65 | 18.80 | 41.20 | |
| Systolic pressure (mmHg) | ||||
| PCOS | 125.50 | 119.00 | 133.50 | 0.001 |
| Control | 119.00 | 110.00 | 125.50 | |
| Diastolic pressure (mmHg) | ||||
| PCOS | 81.00 | 72.00 | 86.00 | 0.044 |
| Control | 76.00 | 72.00 | 81.50 |
| PCOS | Control | ||||
|---|---|---|---|---|---|
| Waist circumference | n | % | n | % | p |
| <80 cm | 30 | 37.5 | 29 | 72.5 | 0.000 |
| >80 cm | 50 | 62.5 | 11 | 27.5 | |
| BMI | |||||
| <18.5 kg/m2 | 1 | 1.3 | 0 | 0 | 0.011 |
| 18.5–24.99 kg/m2 | 34 | 42.5 | 31 | 77.5 | |
| 25.0–29.99 kg/m2 | 21 | 26.3 | 6 | 15.0 | |
| 30.0–34.99 kg/m2 | 15 | 18.8 | 1 | 2.5 | |
| 35.0–39.99 kg/m2 | 7 | 8.8 | 1 | 2.5 | |
| >40.0 kg/m2 | 2 | 2.5 | 1 | 2.5 | |
| Blood pressure | |||||
| <130/85 mmHg | 41 | 51.3 | 32 | 80.0 | 0.002 |
| ≥130/85 mmHg | 39 | 48.8 | 8 | 20.0 |
| Group | Median | Q1 | Q3 | p | |
|---|---|---|---|---|---|
| TSH (mU/mL) | PCOS | 1.69 | 1.18 | 2.28 | 0.413 |
| Control | 1.59 | 1.17 | 2.05 | ||
| FT4 (ng/dL) | PCOS | 1.19 | 1.02 | 1.31 | 0.228 |
| Control | 1.22 | 1.03 | 1.34 | ||
| PRL (ng/mL) | PCOS | 10.60 | 7.66 | 16.61 | 0.978 |
| Control | 10.85 | 8.21 | 16.55 | ||
| FSH (mU/mL) | PCOS | 5.96 | 4.58 | 6.80 | 0.399 |
| Control | 5.49 | 4.48 | 6.54 | ||
| LH (mU/mL) | PCOS | 8.56 | 6.07 | 13.01 | 0.000 |
| Control | 6.09 | 4.40 | 8.22 | ||
| E2 (ng/mL) | PCOS | 40.95 | 30.33 | 51.90 | 0.709 |
| Control | 41.55 | 27.75 | 65.37 | ||
| T (ng/mL) | PCOS | 0.43 | 0.32 | 0.66 | 0.000 |
| Control | 0.34 | 0.26 | 0.43 | ||
| DHEAS04 (μg/dL) | PCOS | 253.00 | 199.50 | 358.00 | 0.184 |
| Control | 244.50 | 185.00 | 298.40 | ||
| 17(OH)P (ng/mL) | PCOS | 1.10 | 0.91 | 1.51 | 0.001 |
| Control | 0.91 | 0.73 | 1.09 | ||
| SHBG (nmol/L) | PCOS | 38.56 | 28.20 | 68.90 | 0.000 |
| Control | 70.95 | 52.70 | 107.60 | ||
| Androstendione (ng/mL) | PCOS | 2.99 | 2.21 | 3.95 | 0.000 |
| Control | 2.19 | 1.96 | 2.39 | ||
| FAI | PCOS | 4.34 | 2.03 | 6.57 | 0.000 |
| Control | 1.85 | 0.75 | 2.32 |
| PCOS | Control | ||||
|---|---|---|---|---|---|
| TSH | n | % | n | % | p |
| <0.51 mU/mL | 1 | 1.3 | 2 | 5.0 | 0.285 |
| 0.51–4.3 mU/mL | 77 | 96.3 | 38 | 95.0 | |
| >4.3 mU/mL | 2 | 2.5 | 0 | 0 | |
| FT4 | n | % | n | % | |
| <0.93 ng/dL | 12 | 15.0 | 3 | 7.5 | 0.411 |
| 0.93–1.7 ng/dL | 66 | 82.5 | 35 | 87.5 | |
| >1.7 ng/dL | 2 | 2.5 | 2 | 5.0 | |
| PRL | n | % | n | % | |
| <4.79 ng/mL | 3 | 3.8 | 3 | 7.5 | 0.247 |
| 4.79–23.3 ng/mL | 69 | 86.3 | 36 | 90.0 | |
| >23.3 ng/mL | 8 | 10.0 | 1 | 2.5 | |
| FSH | n | % | n | % | |
| <3.5 mU/mL | 6 | 7.5 | 5 | 12.5 | 0.371 |
| 3.5–12.5 mU/mL | 74 | 92.5 | 35 | 87.5 | |
| LH | n | % | n | % | |
| <2.4 mU/mL | 4 | 5.0 | 6 | 15.0 | 0.002 |
| 2.4–12.6 mU/mL | 55 | 68.8 | 33 | 82.5 | |
| >12.6 mU/mL | 21 | 26.3 | 1 | 2.5 | |
| E2 | n | % | n | % | |
| <12.5 ng/mL | 2 | 2.5 | 3 | 7.5 | 0.375 |
| 12.5–166 ng/mL | 77 | 96.3 | 36 | 90.0 | |
| >166 ng/mL | 1 | 1.3 | 1 | 2.5 | |
| T | n | % | n | % | |
| <0.06 ng/dL | 0 | 0 | 1 | 2.5 | 0.034 |
| 0.06–0.82 ng/dL | 71 | 88.8 | 39 | 97.5 | |
| >0.82 ng/dL | 9 | 11.3 | 0 | 0 | |
| DHEA SO4 | n | % | n | % | |
| Below normal (for age) | 0 | 0 | 1 | 2.5 | 0.011 |
| Standard (for age) | 67 | 83.8 | 39 | 97.5 | |
| Above standard (for age) | 13 | 16.3 | 0 | 0 | |
| 17(OH)P | n | % | n | % | |
| 0.1–1.4 ng/mL | 56 | 70.0 | 36 | 90.0 | 0.014 |
| >1.4 ng/mL | 24 | 30.0 | 4 | 10.0 | |
| SHGB | n | % | n | % | |
| <32.4 nmol/mL | 30 | 37.5 | 0 | 0 | 0.000 |
| 32.4–128 nmol/mL | 46 | 57.5 | 34 | 85.0 | |
| >128 nmol/mL | 4 | 5.0 | 6 | 15.0 | |
| Androstendione | n | % | n | % | |
| 0.4–3.4 ng/mL | 54 | 67.5 | 40 | 100 | 0.000 |
| >3.4 ng/mL | 26 | 32.5 | 0 | 0 |
| Vitamin D 25(OH) (ng/mL) | Group | Median | Q1 | Q3 | p |
|---|---|---|---|---|---|
| PCOS | 22.50 | 11.95 | 28.95 | 0.238 | |
| Control | 23.45 | 16.30 | 29.15 |
| PCOS | Control | p | |||
|---|---|---|---|---|---|
| Vitamin D 25(OH) | % | n | % | n | 0.563 |
| <20 ng/mL | 42.5 | 34 | 35 | 14 | |
| 20–30 ng/mL | 35 | 28 | 45 | 18 | |
| 30–50 ng/mL | 22.5 | 18 | 20 | 8 |
| PCOS | Control | |||
|---|---|---|---|---|
| Parameter | R Spearmana | p | R Spearmana | p |
| Metabolic syndrome | −0.30 | 0.008 | −0.24 | 0.138 |
| TSH (mU/mL) | −0.02 | 0.871 | 0.00 | 0.992 |
| FT4 [(ng/dL) | 0.02 | 0.876 | 0.04 | 0.806 |
| PRL (ng/mL) | −0.21 | 0.058 | −0.04 | 0.815 |
| FSH (mU/mL) | 0.03 | 0.761 | −0.02 | 0.913 |
| LH (mU/mL) | 0.03 | 0.780 | −0.07 | 0.686 |
| E2 (ng/mL) | −0.05 | 0.688 | −0.15 | 0.350 |
| T (ng/mL) | −0.08 | 0.479 | −0.03 | 0.849 |
| DHEAS04 | 0.01 | 0.915 | 0.08 | 0.602 |
| 17(OH)P (ng/mL) | −0.04 | 0.706 | 0.07 | 0.657 |
| SHBG (nmol/L) | 0.36 | 0.001 | −0.25 | 0.115 |
| Androstendione (ng/mL) | −0.11 | 0.332 | 0.04 | 0.826 |
| FAI | −0.29 | 0.008 | 0.05 | 0.740 |
| Waist circumference | −0.27 | 0.014 | −0.26 | 0.108 |
| WHR | −0.23 | 0.042 | −0.21 | 0.198 |
| BMI | −0.27 | 0.014 | −0.17 | 0.291 |
| Systolic pressure (mmHg) | −0.30 | 0.006 | −0.09 | 0.592 |
| Diastolic pressure (mmHg) | −0.27 | 0.015 | −0.28 | 0.079 |
| Parameter | Evaluation | OR | −95% CI | 95% CI | p |
|---|---|---|---|---|---|
| Vitamin D | −0.078 | 0.93 | 0.88 | 0.98 | 0.005 |
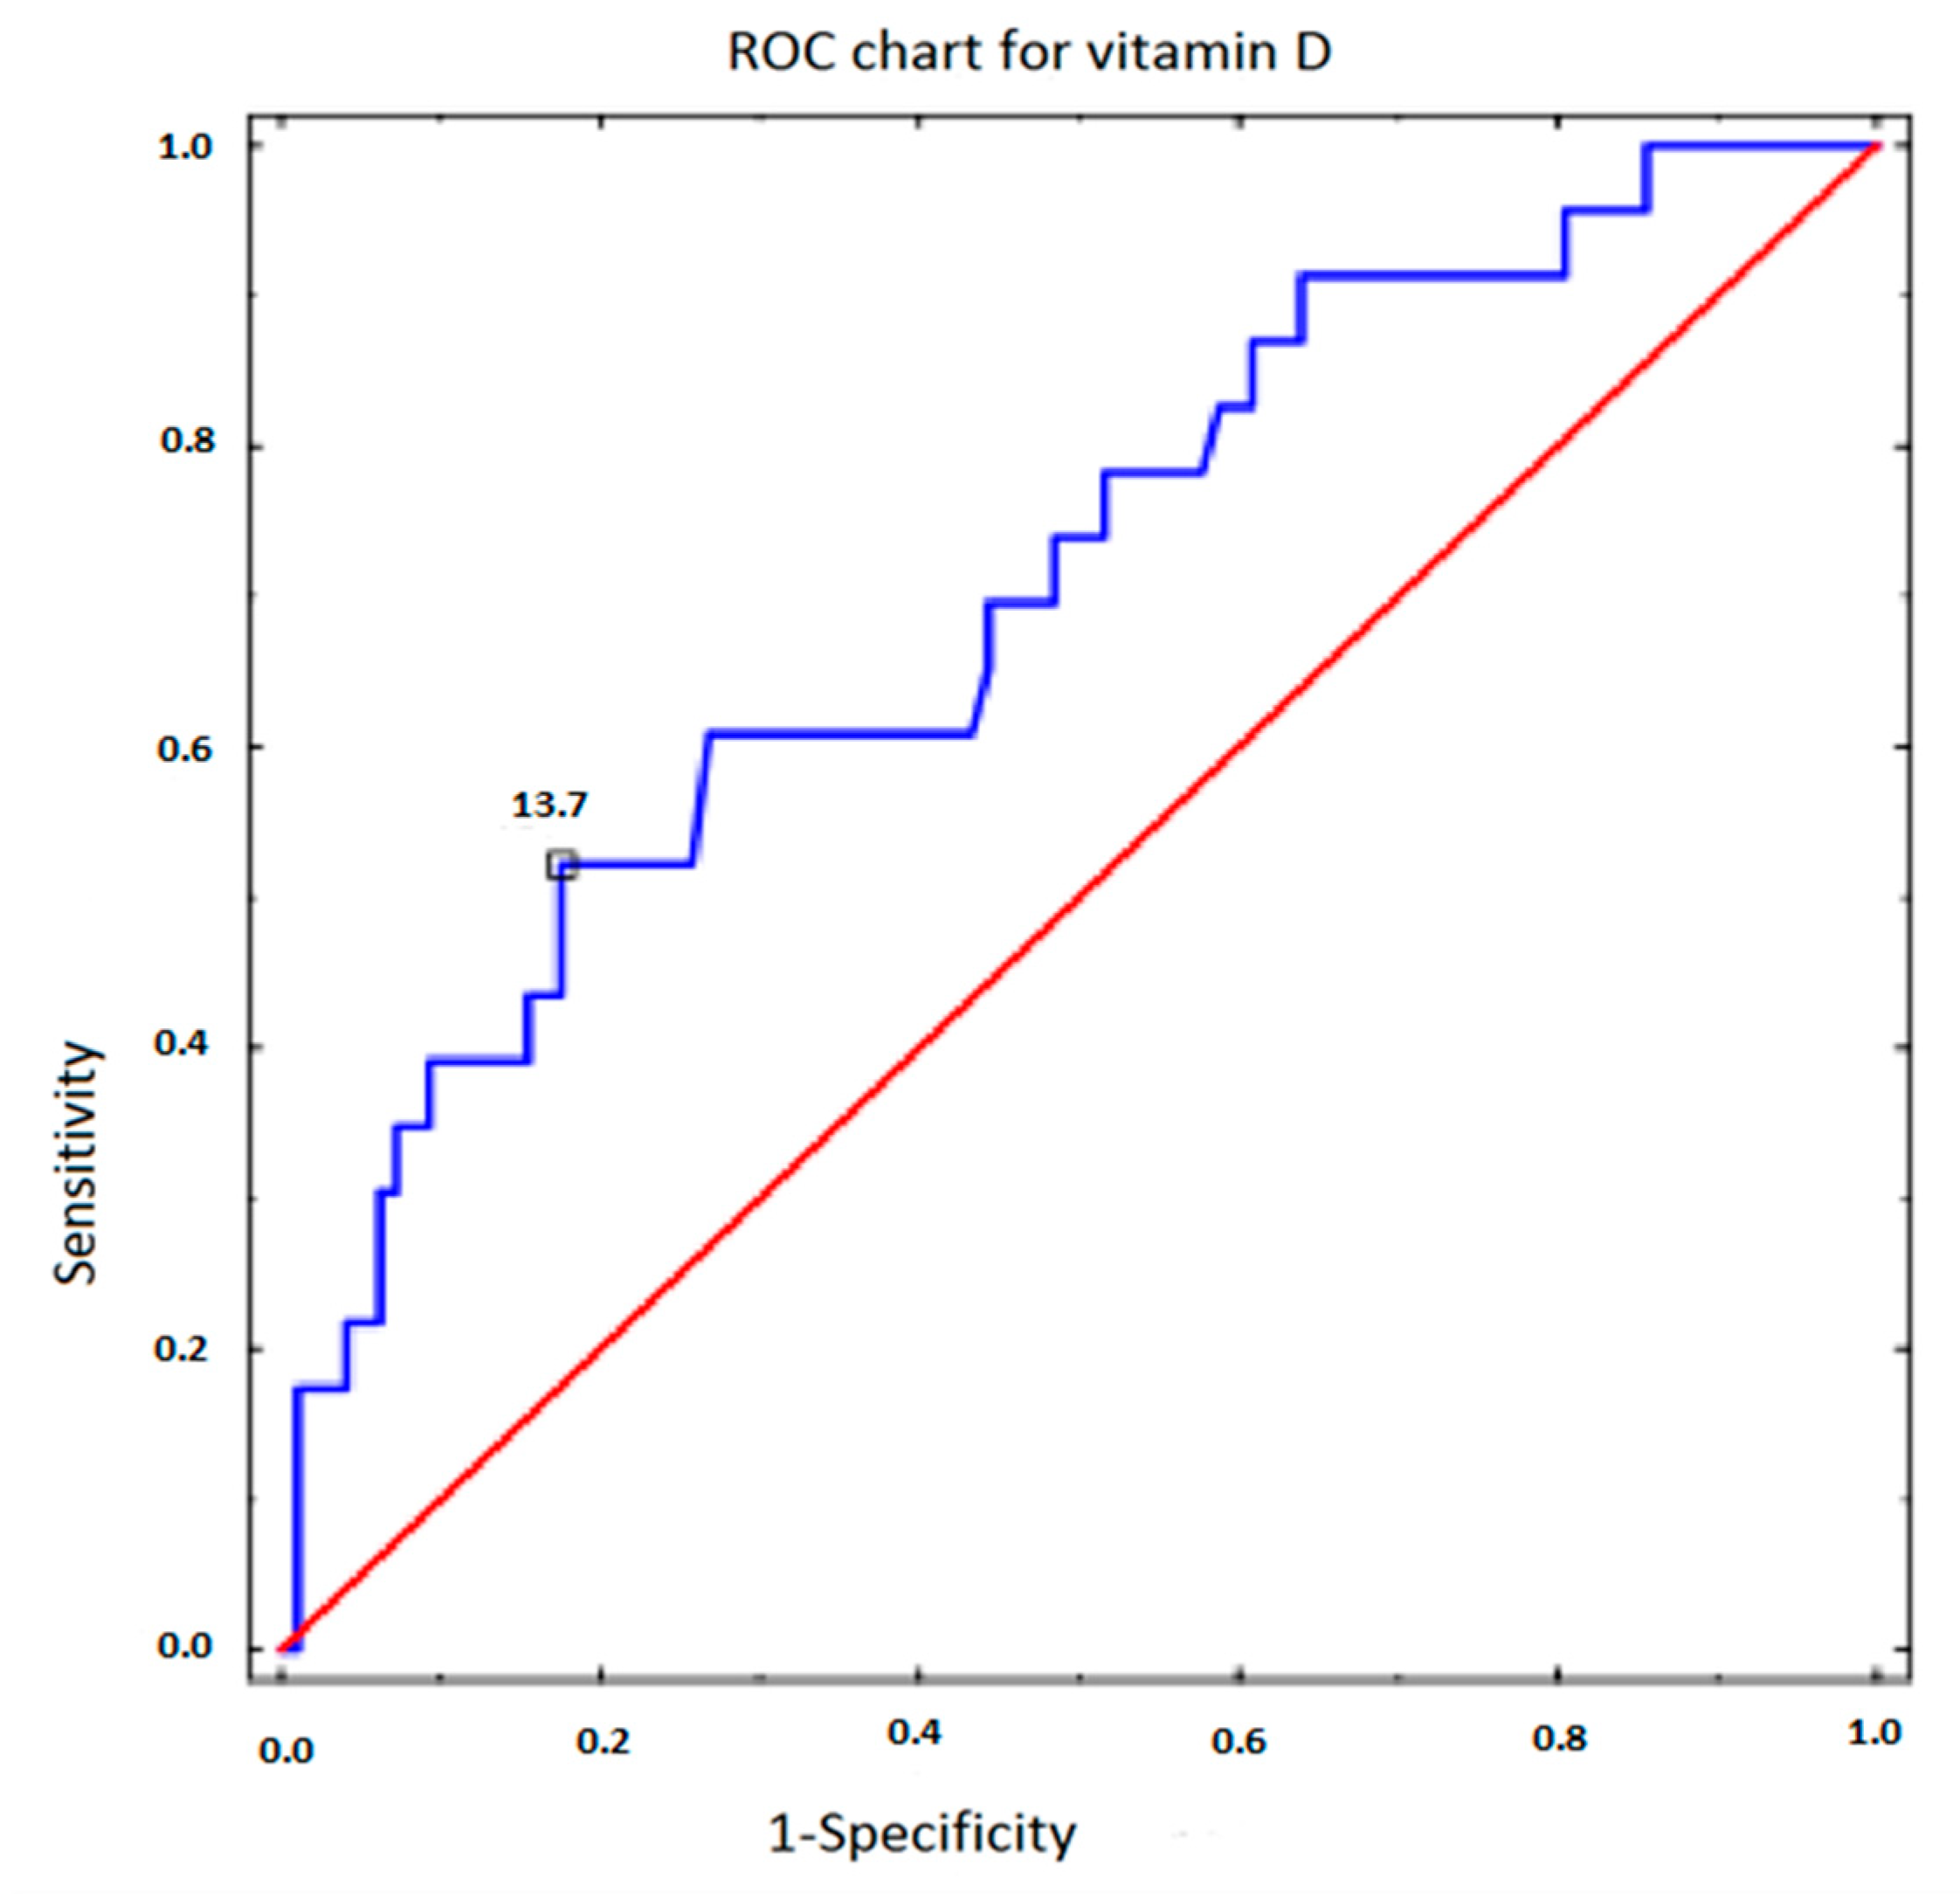
| Parameter | Sensitivity | Specificity | AUC | p |
|---|---|---|---|---|
| Vitamin D | 0.522 | 0.825 | 0.706 | 0.001 |
Disclaimer/Publisher’s Note: The statements, opinions and data contained in all publications are solely those of the individual author(s) and contributor(s) and not of MDPI and/or the editor(s). MDPI and/or the editor(s) disclaim responsibility for any injury to people or property resulting from any ideas, methods, instructions or products referred to in the content. |
© 2023 by the authors. Licensee MDPI, Basel, Switzerland. This article is an open access article distributed under the terms and conditions of the Creative Commons Attribution (CC BY) license (https://creativecommons.org/licenses/by/4.0/).
Share and Cite
Lejman-Larysz, K.; Golara, A.; Baranowska, M.; Kozłowski, M.; Guzik, P.; Szydłowska, I.; Nawrocka-Rutkowska, J.; Sowińska-Przepiera, E.; Cymbaluk-Płoska, A.; Brodowska, A. Influence of Vitamin D on the Incidence of Metabolic Syndrome and Hormonal Balance in Patients with Polycystic Ovary Syndrome. Nutrients 2023, 15, 2952. https://doi.org/10.3390/nu15132952
Lejman-Larysz K, Golara A, Baranowska M, Kozłowski M, Guzik P, Szydłowska I, Nawrocka-Rutkowska J, Sowińska-Przepiera E, Cymbaluk-Płoska A, Brodowska A. Influence of Vitamin D on the Incidence of Metabolic Syndrome and Hormonal Balance in Patients with Polycystic Ovary Syndrome. Nutrients. 2023; 15(13):2952. https://doi.org/10.3390/nu15132952
Chicago/Turabian StyleLejman-Larysz, Katarzyna, Anna Golara, Marta Baranowska, Mateusz Kozłowski, Paweł Guzik, Iwona Szydłowska, Jolanta Nawrocka-Rutkowska, Elżbieta Sowińska-Przepiera, Aneta Cymbaluk-Płoska, and Agnieszka Brodowska. 2023. "Influence of Vitamin D on the Incidence of Metabolic Syndrome and Hormonal Balance in Patients with Polycystic Ovary Syndrome" Nutrients 15, no. 13: 2952. https://doi.org/10.3390/nu15132952
APA StyleLejman-Larysz, K., Golara, A., Baranowska, M., Kozłowski, M., Guzik, P., Szydłowska, I., Nawrocka-Rutkowska, J., Sowińska-Przepiera, E., Cymbaluk-Płoska, A., & Brodowska, A. (2023). Influence of Vitamin D on the Incidence of Metabolic Syndrome and Hormonal Balance in Patients with Polycystic Ovary Syndrome. Nutrients, 15(13), 2952. https://doi.org/10.3390/nu15132952