
Cardiovascular Response to Intravenous Glucose Injection during Hemodialysis with Assessment of Entropy Alterations

 , , , ,
  , and
, and 
Abstract
1. Introduction
2. Materials and Methods
2.1. Study Group
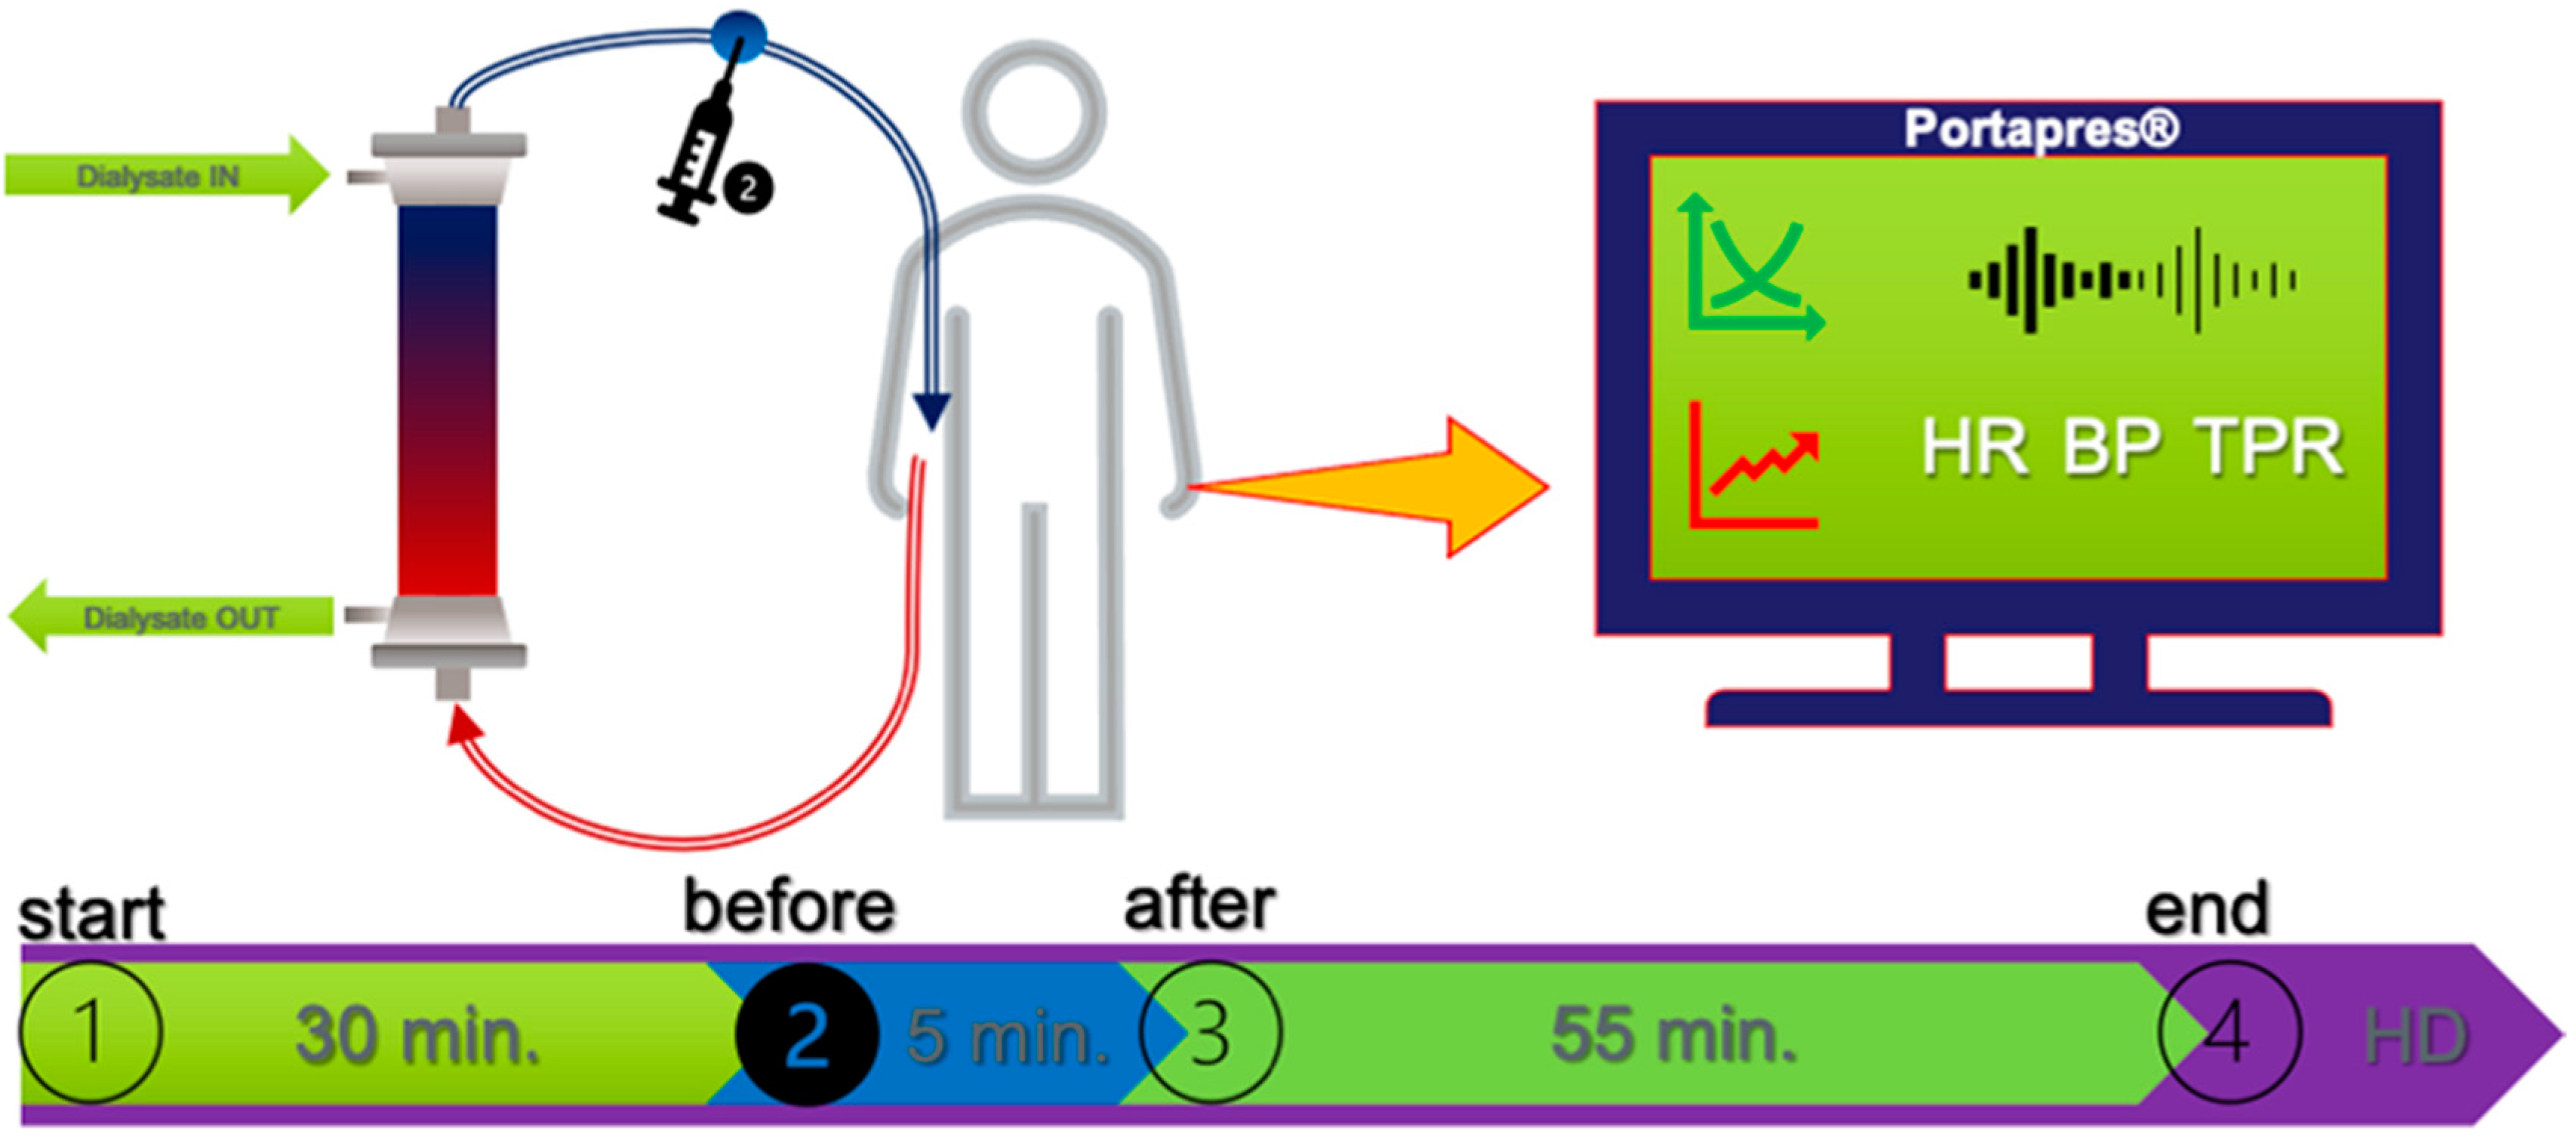
2.2. Study Protocol
2.3. Data Preparation and Analysis
2.4. Statistical Analysis
3. Results
4. Discussion
5. Conclusions
Author Contributions
Funding
Institutional Review Board Statement
Informed Consent Statement
Data Availability Statement
Conflicts of Interest
References
- Hoshide, S.; Cheng, H.M.; Huang, Q.; Park, S.; Park, C.G.; Chen, C.H.; Wang, J.G.; Kario, K. Characteristics on the Management of Hypertension in as a Morning Hypertension Discussion Group (COME Asia MHDG). Role of ambulatory blood pressure monitoring for the management of hypertension in Asian populations. J. Clin. Hypertens. 2017, 19, 1240–1245. [Google Scholar] [CrossRef] [PubMed]
- Kubota, Y.; Chen, L.Y.; Whitsel, E.A.; Folsom, A.R. Heart rate variability and lifetime risk of cardiovascular disease: The Atherosclerosis Risk in Communities Study. Ann. Epidemiol. 2017, 27, 619–625. [Google Scholar] [CrossRef] [PubMed]
- Vinik, A.I.; Casellini, C.; Parson, H.K.; Colberg, S.R.; Nevoret, M.L. Cardiac Autonomic Neuropathy in Diabetes: A Predictor of Cardiometabolic Events. Front. Neurosci. 2018, 12, 591. [Google Scholar] [CrossRef]
- Chen, S.C.; Huang, J.C.; Tsai, Y.C.; Mai, H.C.; Chen, J.H.; Kuo, P.L.; Chang, J.M.; Hwang, S.J.; Chen, H.C. Heart Rate Variability Change Before and After Hemodialysis is Associated with Overall and Cardiovascular Mortality in Hemodialysis. Sci. Rep. 2016, 6, 20597. [Google Scholar] [CrossRef] [PubMed][Green Version]
- Benichou, T.; Pereira, B.; Mermillod, M.; Tauveron, I.; Pfabigan, D.; Maqdasy, S.; Dutheil, F. Heart rate variability in type 2 diabetes mellitus: A systematic review and meta-analysis. PLoS ONE 2018, 13, e0195166. [Google Scholar] [CrossRef] [PubMed]
- Converse, R.L., Jr.; Jacobsen, T.N.; Toto, R.D.; Jost, C.M.; Cosentino, F.; Fouad-Tarazi, F.; Victor, R.G. Sympathetic overactivity in patients with chronic renal failure. N. Engl. J. Med. 1992, 327, 1912–1918. [Google Scholar] [CrossRef]
- Ortiz, A.; Covic, A.; Fliser, D.; Fouque, D.; Goldsmith, D.; Kanbay, M.; Mallamaci, F.; Massy, Z.A.; Rossignol, P.; Vanholder, R.; et al. Board of the EURECA-m Working Group of ERA-EDTA. Epidemiology, contributors to, and clinical trials of mortality risk in chronic kidney failure. Lancet 2014, 383, 1831–1843. [Google Scholar] [CrossRef]
- Lal, C.; Kaur, M.; Jaryal, A.K.; Deepak, K.K.; Bhowmik, D.; Agarwal, S.K. Reduced Baroreflex Sensitivity, Decreased Heart Rate Variability with Increased Arterial Stiffness in Predialysis. Indian J. Nephrol. 2017, 27, 446–451. [Google Scholar] [CrossRef]
- Converse, R.L., Jr.; Jacobsen, T.N.; Jost, C.M.; Toto, R.D.; Grayburn, P.A.; Obregon, T.M.; Fouad-Tarazi, F.; Victor, R.G. Paradoxical withdrawal of reflex vasoconstriction as a cause of hemodialysis-induced hypotension. J. Clin. Investig. 1992, 90, 1657–1665. [Google Scholar] [CrossRef]
- Pelosi, G.; Emdin, M.; Carpeggiani, C.; Morales, M.A.; Piacenti, M.; Dattolo, P.; Cerrai, T.; Macerata, A.; L’abbate, A.; Maggiore, Q. Impaired sympathetic response before intradialytic hypotension: A study based on spectral analysis of heart rate and pressure variability. Clin. Sci. 1999, 96, 23–31. [Google Scholar] [CrossRef]
- Rubinger, D.; Backenroth, R.; Sapoznikov, D. Sympathetic nervous system function and dysfunction in chronic hemodialysis patients. Semin. Dial. 2013, 26, 333–343. [Google Scholar] [CrossRef] [PubMed]
- Chan, C.T.; Hanly, P.; Gabor, J.; Picton, P.; Pierratos, A.; Floras, J.S. Impact of nocturnal hemodialysis on the variability of heart rate and duration of hypoxemia during sleep. Kidney Int. 2004, 65, 661–665. [Google Scholar] [CrossRef] [PubMed]
- Pincus, S.M.; Viscarello, R.R. Approximate entropy: A regularity measure for fetal heart rate analysis. Obstet. Gynecol. 1992, 79, 249–255. [Google Scholar] [PubMed]
- Shin, D.G.; Yoo, C.S.; Yi, S.H.; Bae, J.H.; Kim, Y.J.; Park, J.S.; Hong, G.R. Prediction of paroxysmal atrial fibrillation using nonlinear analysis of the R-R interval dynamics before the spontaneous onset of atrial fibrillation. Circ. J. 2006, 70, 94–99. [Google Scholar] [CrossRef] [PubMed]
- Julián, M.; Alcaraz, R.; Rieta, J.J. Comparative assessment of nonlinear metrics to quantify organization-related events in surface electrocardiograms of atrial fibrillation. Comput. Biol. Med. 2014, 48, 66–76. [Google Scholar] [CrossRef] [PubMed]
- Liu, C.; Liu, C.; Shao, P.; Li, L.; Sun, X.; Wang, X.; Liu, F. Comparison of different threshold values r for approximate entropy: Application to investigate the heart rate variability between heart failure and healthy control groups. Physiol. Meas. 2011, 32, 167–180. [Google Scholar] [CrossRef] [PubMed]
- Schneditz, D.; Niemczyk, L.; Niemczyk, S. Modeling of insulin secretion and insulin mass balance during hemodialysis in patients with and without type 2 diabetes. Biocybern. Biomed. Eng. 2021, 41, 391–401. [Google Scholar] [CrossRef]
- Niemczyk, L.; Schneditz, D.; Wojtecka, A.; Szamotulska, K.; Smoszna, J.; Niemczyk, S. Glucose tolerance in patients with and without type 2 diabetes mellitus during hemodialysis. Diabetes Res. Clin. Pract. 2021, 173, 108694. [Google Scholar] [CrossRef]
- Schneditz, D.; Niemczyk, L.; Wojtecka, A.; Szamotulska, K.; Niemczyk, S. Hemodilution with hypertonic glucose in patients with and without type-2 diabetes mellitus during hemodialysis. Nutrients 2022, in press. [Google Scholar]
- Niemczyk, L.; Romejko, K.; Szamotulska, K.; Schneditz, D.; Niemczyk, S. Does the glucose injection prevent the decline of blood pressure during hemodialysis? Changes of hemodynamic parameters after intradialytic glucose injection. Nutrients 2022, in press. [Google Scholar]
- Bandt, C.; Pompe, B. Permutation entropy: A natural complexity measure for time series. Phys. Rev. Lett. 2002, 88, 174102. [Google Scholar] [CrossRef] [PubMed]
- Azami, H.; Escudero, J. Amplitude-aware permutation entropy: Illustration in spike detection and signal segmentation. Comput. Methods Programs Biomed. 2016, 128, 40–51. [Google Scholar] [CrossRef] [PubMed]
- Liu, L.; Zhi, Z.; Zhang, H.; Guo, Q.; Peng, Y.; Liu, D. Related Entropy Theories Application in Condition Monitoring of Rotating Machineries. Entropy 2019, 21, 1061. [Google Scholar] [CrossRef]
- Cooke, W.H.; Hoag, J.B.; Crossman, A.A.; Kuusela, T.A.; Tahvanainen, K.U.; Eckberg, D.L. Human responses to upright tilt: A window on central autonomic integration. J. Physiol. 1999, 517, 617–628. [Google Scholar] [CrossRef] [PubMed]
- Graff, B.; Graff, G.; Kaczkowska, A. Entropy measures of heart rate variability for short ECG datasets in patients with congestive heart failure. Acta Phys. Pol. B 2012, 5, 153–158. [Google Scholar]
- Graff, B.; Graff, G.; Makowiec, D.; Kaczkowska, A.; Wejer, D.; Budrejko, S.; Kozłowski, D.; Narkiewicz, K. Entropy Measures in the Assessment of Heart Rate Variability in Patients with Cardiodepressive Vasovagal Syncope. Entropy 2015, 17, 1007–1022. [Google Scholar] [CrossRef]
- Wolf, M.M.; Varigos, G.A.; Hunt, D.; Sloman, J.G. Sinus arrhythmia in acute myocardial infarction. Med. J. Aust. 1978, 2, 52–53. [Google Scholar] [CrossRef]
- Mylonopoulou, M.; Tentolouris, N.; Antonopoulos, S.; Mikros, S.; Katsaros, K.; Melidonis, A.; Sevastos, N.; Katsilambros, N. Heart rate variability in advanced chronic kidney disease with or without diabetes: Midterm effects of the initiation of chronic haemodialysis therapy. Nephrol. Dial. Transplant. 2010, 25, 3749–3754. [Google Scholar] [CrossRef]
- Rubinger, D.; Revis, N.; Pollak, A.; Luria, M.H.; Sapoznikov, D. Predictors of haemodynamic instability and heart rate variability during haemodialysis. Nephrol. Dial. Transplant. 2004, 19, 2053–2060. [Google Scholar] [CrossRef]
- Tong, Y.Q.; Hou, H.M. Alteration of heart rate variability parameters in nondiabetic hemodialysis patients. Am. J. Nephrol. 2007, 27, 63–69. [Google Scholar] [CrossRef]
- Giordano, M.; Manzella, D.; Paolisso, G.; Caliendo, A.; Varricchio, M.; Giordano, C. Differences in heart rate variability parameters during the post-dialytic period in type II diabetic and non-diabetic ESRD patients. Nephrol. Dial. Transplant. 2001, 16, 566–573. [Google Scholar] [CrossRef] [PubMed]
- Wen, T.L.; Chung-Kwe, W.; Yang, I.F.; Yang, T.F. Relationship between electrolytes and heart rate variability parameters in end-stage renal failure patients before and after hemodialysis. Anatol. J. Cardiol. 2007, 7, 142–144. [Google Scholar]
- Ferrario, M.; Moissl, U.; Garzotto, F.; Cruz, D.N.; Clementi, A.; Brendolan, A.; Tetta, C.; Gatti, E.; Signorini, M.G.; Cerutti, S.; et al. Effects of fluid overload on heart rate variability in chronic kidney disease patients on hemodialysis. BMC Nephrol. 2014, 15, 26. [Google Scholar] [CrossRef] [PubMed]
- Fadaee, S.B.; Beetham, K.S.; Howden, E.J.; Stanton, T.; Isbel, N.M.; Coombes, J.S. Oxidative stress is associated with decreased heart rate variability in patients with chronic kidney disease. Redox Rep. 2017, 22, 197–204. [Google Scholar] [CrossRef]
- Vena, D.; Yadollahi, A. The effect of fluid overload by saline infusion on heart rate variability in men during sleep. Annu. Int. Conf. IEEE Eng. Med. Biol. Soc. 2015, 2015, 2047–2050. [Google Scholar] [CrossRef]
- Brown, C.M.; Barberini, L.; Dulloo, A.G.; Montani, J.P. Cardiovascular responses to water drinking: Does osmolality play a role? Am. J. Physiol. Regul. Integr. Comp. Physiol. 2005, 289, R1687–R1692. [Google Scholar] [CrossRef]
- Christiani, M.; Grosicki, G.J.; Flatt, A.A. Cardiac-autonomic and hemodynamic responses to a hypertonic, sugar-sweetened sports beverage in physically active men. Appl. Physiol. Nutr. Metab. 2021, 46, 1189–1195. [Google Scholar] [CrossRef]
- Chapman, C.L.; Reed, E.L.; Worley, M.L.; Pietrafesa, L.D.; Kueck, P.J.; Bloomfield, A.C.; Schlader, Z.J.; Johnson, B.D. Sugar-sweetened soft drink consumption acutely decreases spontaneous baroreflex sensitivity and heart rate variability. Am. J. Physiol. Regul. Integr. Comp. Physiol. 2021, 320, R641–R652. [Google Scholar] [CrossRef]
- Paolisso, G.; Manzella, D.; Tagliamonte, M.R.; Rizzo, M.R.; Gambardella, A.; Varricchio, M. Effects of different insulin infusion rates on heart rate variability in lean and obese subjects. Metab. Clin. Exp. 1999, 48, 755–762. [Google Scholar] [CrossRef]
- Polinder-Bos, H.A.; García, D.V.; Kuipers, J.; Elting, J.W.J.; Aries, M.J.H.; Krijnen, W.P.; Groen, H.; Willemsen, A.T.M.; van Laar, P.J.; Strijkert, F.; et al. Hemodialysis Induces an Acute Decline in Cerebral Blood Flow in Elderly Patients. J. Am. Soc. Nephrol. 2018, 29, 1317–1325. [Google Scholar] [CrossRef] [PubMed]
- Mistry, K. Dialysis disequilibrium syndrome prevention and management. Int. J. Nephrol. Renov. Dis. 2019, 12, 69–77. [Google Scholar] [CrossRef] [PubMed]
- Buszko, K.; Piątkowska, A.; Koźluk, E.; Fabiszak, T.; Opolski, G. Transfer Information Assessment in Diagnosis of Vasovagal Syncope Using Transfer Entropy. Entropy 2019, 21, 347. [Google Scholar] [CrossRef]
- Graff, B.; Wejer, D.; Faes, L.; Graff, G.; Makowiec, D.; Narkiewicz, K. The use of Transfer Entropy method for the assessment of cardiovascular regulation during head-up tilt test. Auton. Neurosci. 2015, 192, 101–102. [Google Scholar] [CrossRef]
- Schneditz, D.; Niemczyk, S.; Sauseng, N.; Lackner, H.K.; Hafner-Giessauf, H. Osmotic and hemodynamic effects of hypertonic glucose in glucose tolerance testing during hemodialysis. ASAIO J. 2017, 63, 824–831. [Google Scholar] [CrossRef] [PubMed]
- Shimizu, K.; Kurosawa, T.; Ishikawa, R.; Sanjo, T. Vasopressin secretion by hypertonic saline infusion during hemodialysis: Effect of cardiopulmonary recirculation. Nephrol. Dial. Transplant. 2012, 27, 796–803. [Google Scholar] [CrossRef]
- Ettema, E.M.; Kuipers, J.; van Faassen, M.; Groen, H.; van Roon, A.M.; Lefrandt, J.D.; Westerhuis, R.; Kema, I.P.; van Goor, H.; Gansevoort, R.T.; et al. Effect of plasma sodium concentration on blood pressure regulators during hemodialysis: A randomized crossover study. BMC Nephrol. 2018, 19, 214. [Google Scholar] [CrossRef] [PubMed]


| Before HD (t = −30) | Before Glucose Injection (t = 0) | After Glucose Injection (t = 5) | End of Test (t = 60) | p * | |
|---|---|---|---|---|---|
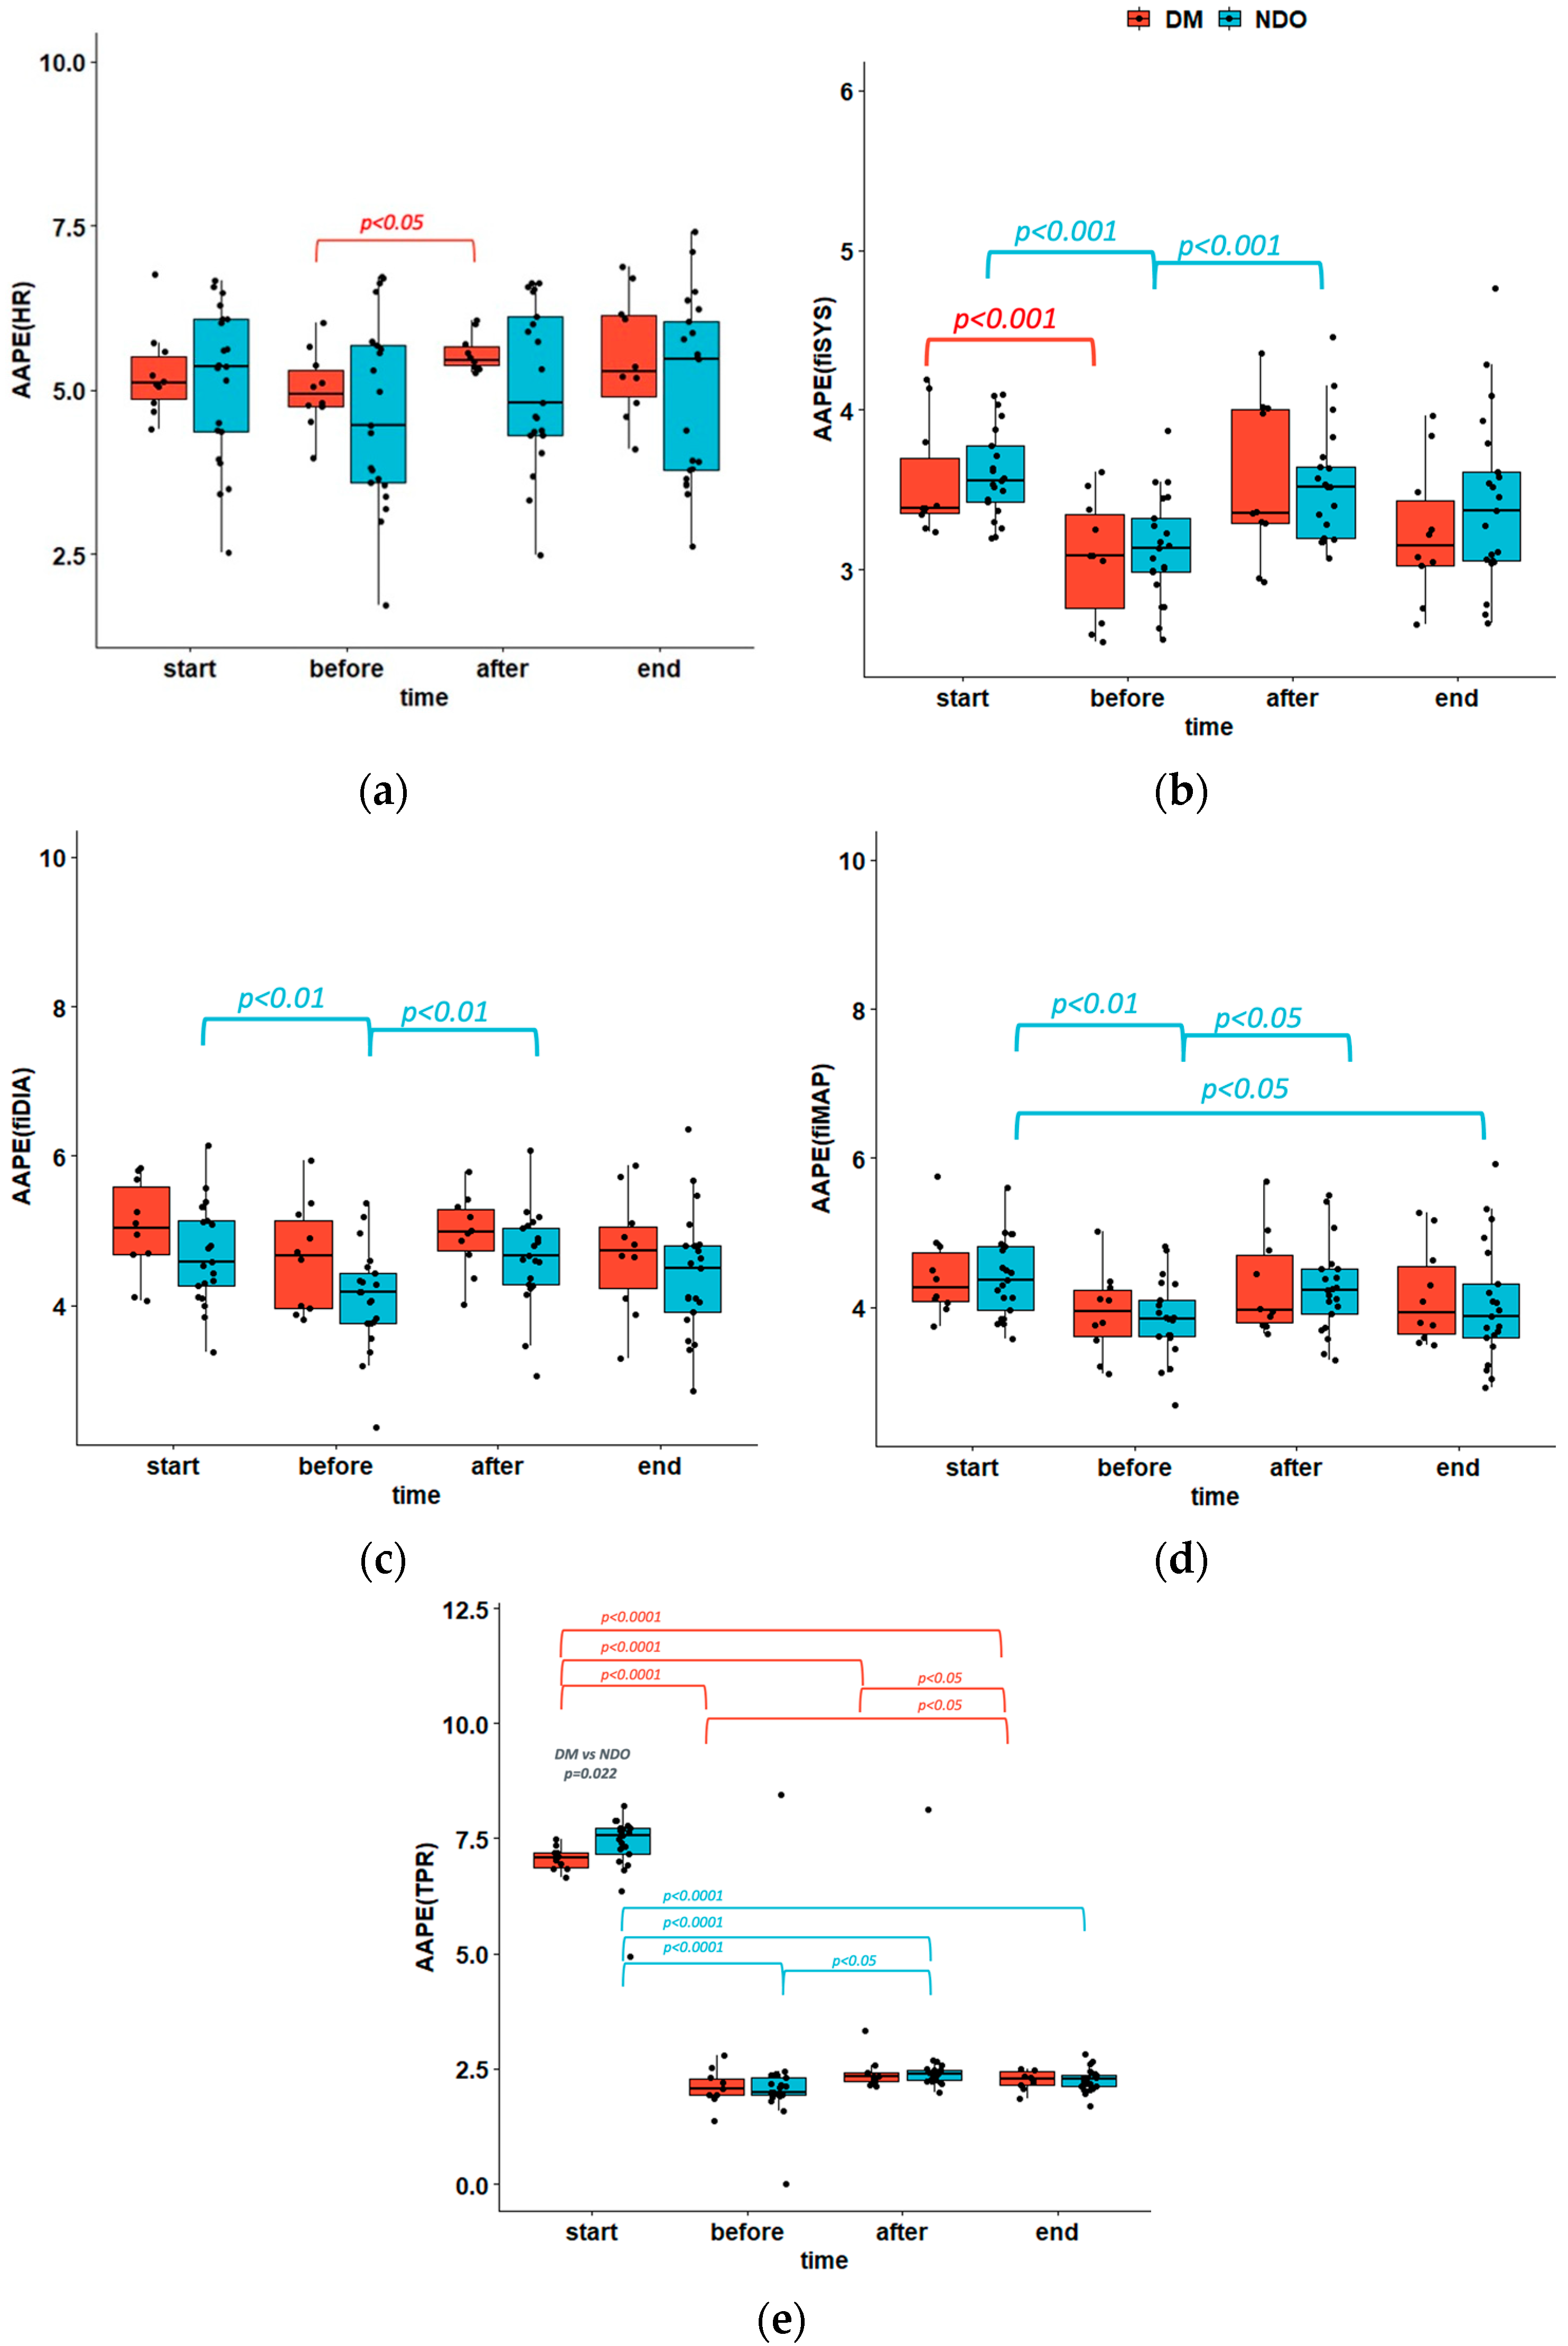
| AAPE(HR) | p = ns ** | p = ns ** | p = ns ** | p = ns ** | |
| DM | 5.25 ± 0.66 | 5.00 ± 0.59 | 5.56 ± 0.28 | 5.51 ± 0.92 | p4 < 0.05 |
| NDO | 5.10 ± 1.17 | 4.66 ± 1.42 | 5.08 ± 1.22 | 4.97 ± 1.40 | p = ns |
| AAPE(fiSYS) | p = ns ** | p = ns ** | p = ns ** | p = ns ** | |
| DM | 3.55 ± 0.36 | 3.07 ± 0.38 | 3.55 ± 0.50 | 3.23 ± 0.42 | p1 < 0.001 |
| NDO | 3.60 ± 0.28 | 3.14 ± 0.33 | 3.53 ± 0.36 | 3.42 ± 0.54 | p1 = p4 < 0.001 |
| AAPE(fiDIA) | p = ns ** | p = ns ** | p = ns ** | p = ns ** | |
| DM | 5.02 ± 0.65 | 4.64 ± 0.73 | 4.96 ± 0.52 | 4.70 ± 0.79 | p = ns |
| NDO | 4.69 ± 0.67 | 4.10 ± 0.68 | 4.63 ± 0.64 | 4.42 ± 0.83 | p1 = p4 < 0.01 |
| AAPE(fiMAP) | p = ns ** | p = ns ** | p = ns ** | p = ns ** | |
| DM | 4.43 ± 0.59 | 3.92 ± 0.57 | 4.29 ± 0.68 | 4.16 ± 0.66 | p = ns |
| NDO | 4.40 ± 0.52 | 3.84 ± 0.52 | 4.24 ± 0.59 | 4.04 ± 0.79 | p1 < 0.01 p3 = p4 < 0.05 |
| AAPE(fiTPR) | p < 0.05 ** | p = ns ** | p = ns ** | p = ns ** | |
| DM | 7.07 ± 0.25 | 2.11 ± 0.39 | 2.40 ± 0.36 | 2.26 ± 0.20 | p1 = p2 = p3 < 0.0001 p5 = p6 < 0.05 |
| NDO | 7.34 ± 0.69 | 2.27 ± 1.50 | 2.64 ± 1.27 | 2.26 ± 0.25 | p1 = p2 = p3 < 0.0001 p4 < 0.05 |
| AAPE(CO) | p = ns ** | p = ns ** | p = ns ** | p = ns ** | |
| DM | 2.27 ± 0.17 | 2.10 ± 0.21 | 2.32 ± 0.12 | 2.29 ± 0.14 | p4 < 0.01 |
| NDO | 2.28 ± 0.14 | 2.33 ± 1.40 | 2.53 ± 1.09 | 2.29 ± 0.22 | p1 < 0.05 p4 < 0.05 |
| AAPE(SV) | p = ns ** | p = ns ** | p = ns ** | p = ns ** | |
| DM | 3.36 ± 0.58 | 2.96 ± 0.44 | 3.41 ± 0.50 | 3.23 ± 0.55 | p1 < 0.0001 |
| NDO | 3.47 ± 0.48 | 3.14 ± 0.52 | 3.33 ± 0.53 | 3.47 ± 0.49 | p1 < 0.0001 |
| AAPE(EJT) | p = ns ** | p = ns ** | p = ns ** | p = ns ** | |
| DM | 7.07 ± 0.25 | 6.69 ± 0.40 | 7.13 ± 0.25 | 7.01 ± 0.44 | p1 = 0.05 p4 = 0.05 |
| NDO | 7.34 ± 0.69 | 6.69 ± 1.39 | 6.87 ± 1.28 | 7.07 ± 0.85 | p1 = 0.05 |
Publisher’s Note: MDPI stays neutral with regard to jurisdictional claims in published maps and institutional affiliations. |
© 2022 by the authors. Licensee MDPI, Basel, Switzerland. This article is an open access article distributed under the terms and conditions of the Creative Commons Attribution (CC BY) license (https://creativecommons.org/licenses/by/4.0/).
Share and Cite
Niemczyk, L.; Buszko, K.; Schneditz, D.; Wojtecka, A.; Romejko, K.; Saracyn, M.; Niemczyk, S. Cardiovascular Response to Intravenous Glucose Injection during Hemodialysis with Assessment of Entropy Alterations. Nutrients 2022, 14, 5362. https://doi.org/10.3390/nu14245362
Niemczyk L, Buszko K, Schneditz D, Wojtecka A, Romejko K, Saracyn M, Niemczyk S. Cardiovascular Response to Intravenous Glucose Injection during Hemodialysis with Assessment of Entropy Alterations. Nutrients. 2022; 14(24):5362. https://doi.org/10.3390/nu14245362
Chicago/Turabian StyleNiemczyk, Longin, Katarzyna Buszko, Daniel Schneditz, Anna Wojtecka, Katarzyna Romejko, Marek Saracyn, and Stanisław Niemczyk. 2022. "Cardiovascular Response to Intravenous Glucose Injection during Hemodialysis with Assessment of Entropy Alterations" Nutrients 14, no. 24: 5362. https://doi.org/10.3390/nu14245362
APA StyleNiemczyk, L., Buszko, K., Schneditz, D., Wojtecka, A., Romejko, K., Saracyn, M., & Niemczyk, S. (2022). Cardiovascular Response to Intravenous Glucose Injection during Hemodialysis with Assessment of Entropy Alterations. Nutrients, 14(24), 5362. https://doi.org/10.3390/nu14245362