
Legumes—A Comprehensive Exploration of Global Food-Based Dietary Guidelines and Consumption

Abstract
1. Introduction
2. Materials and Methods
2.1. Legume Messaging in Food-Based Dietary Guidelines
2.2. Legume Consumption and Comparison to Legume Food Group Classifications
3. Results
3.1. Legume-Based Messaging in Dietary Guidelines
3.2. Key Terms Used to Define Legumes
3.3. Recommended Serving Sizes and Frequency of Consumption
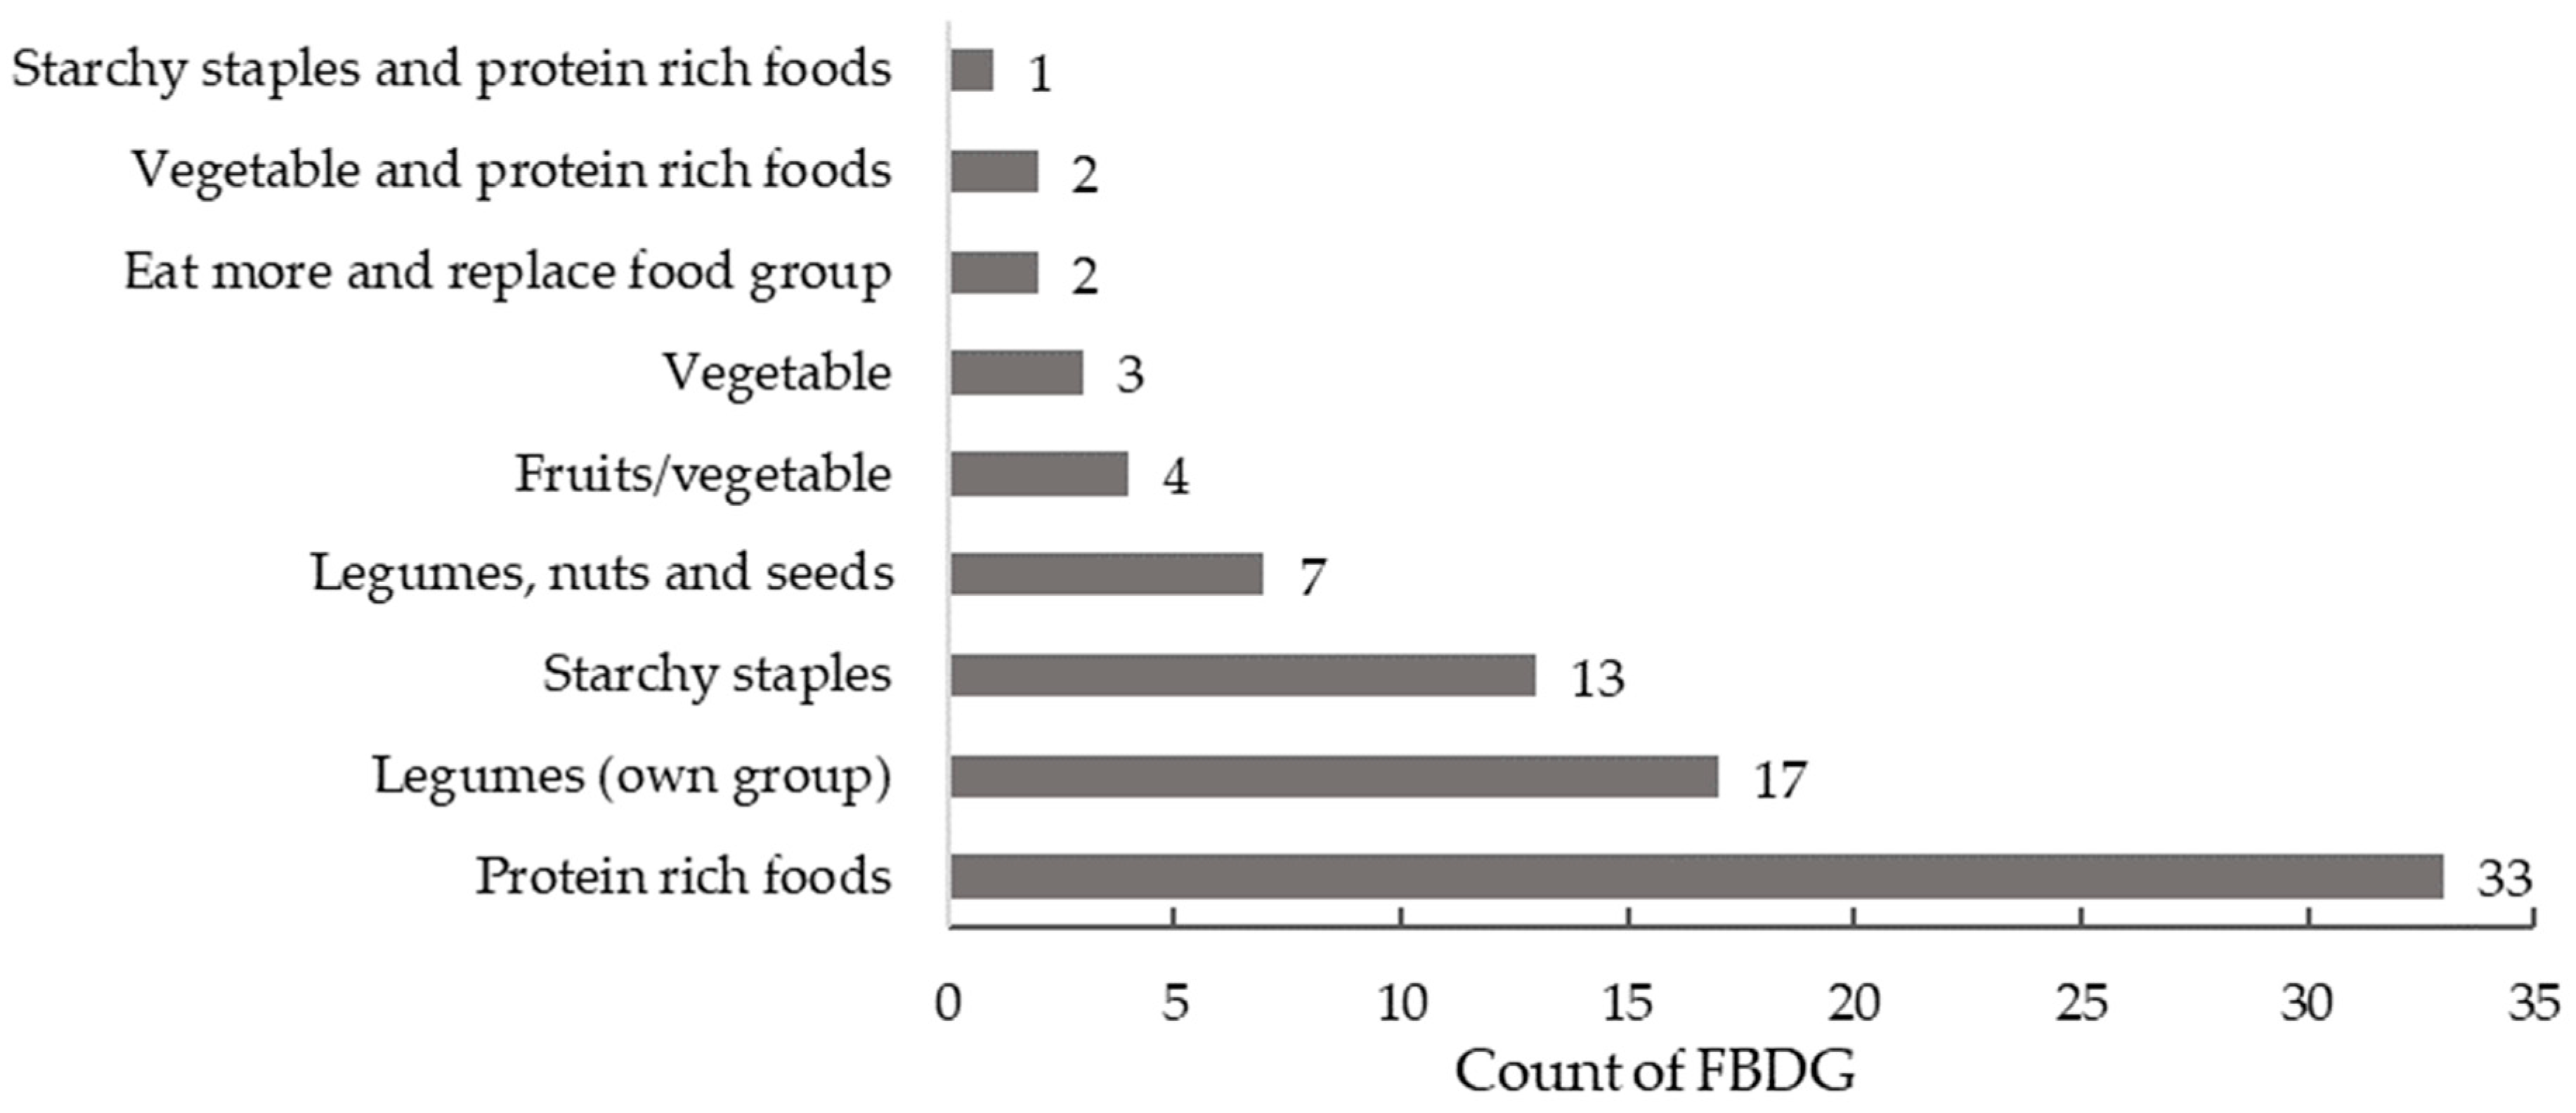
3.4. Food Group Classification
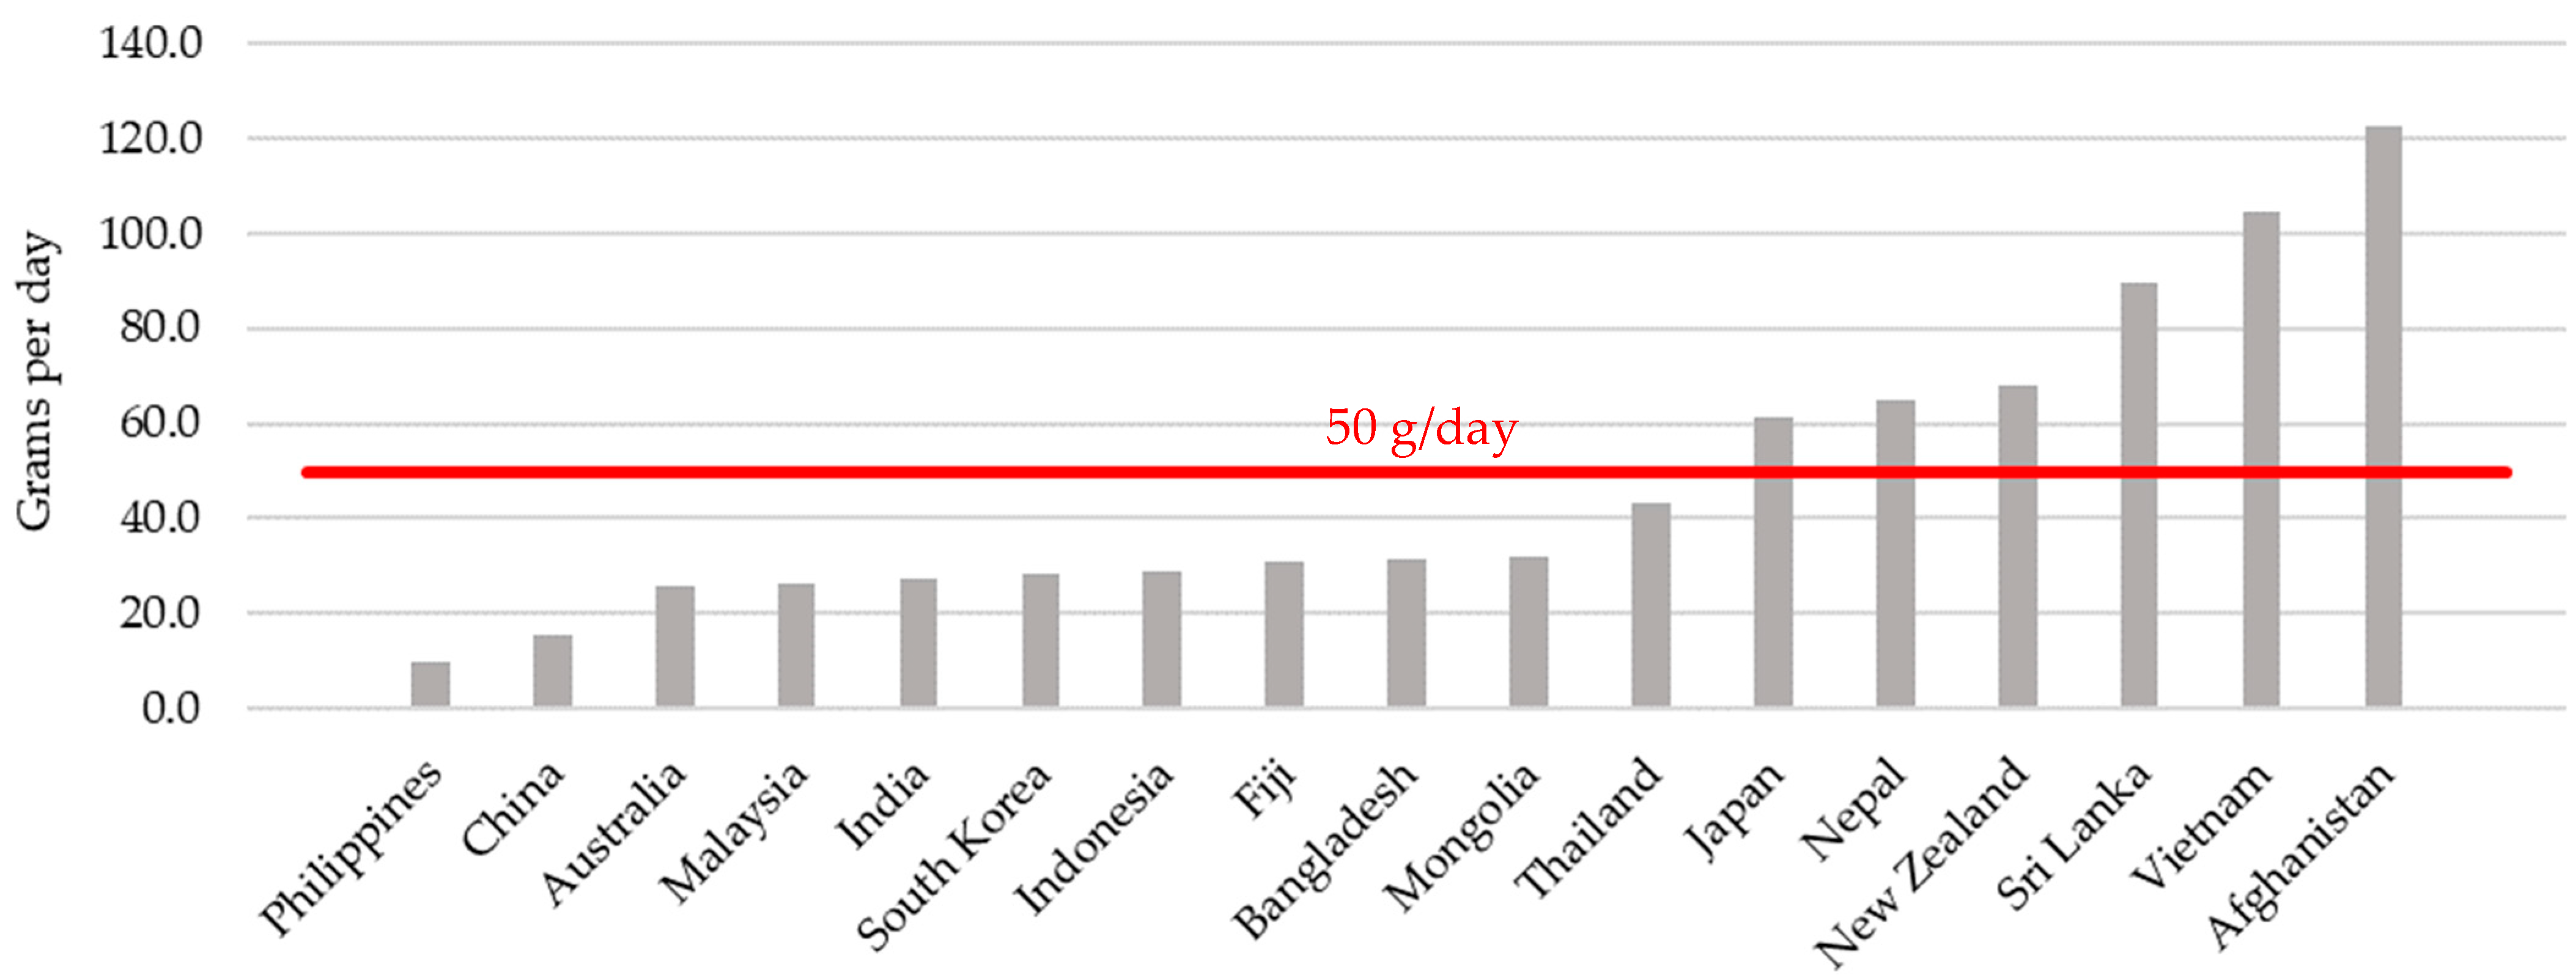
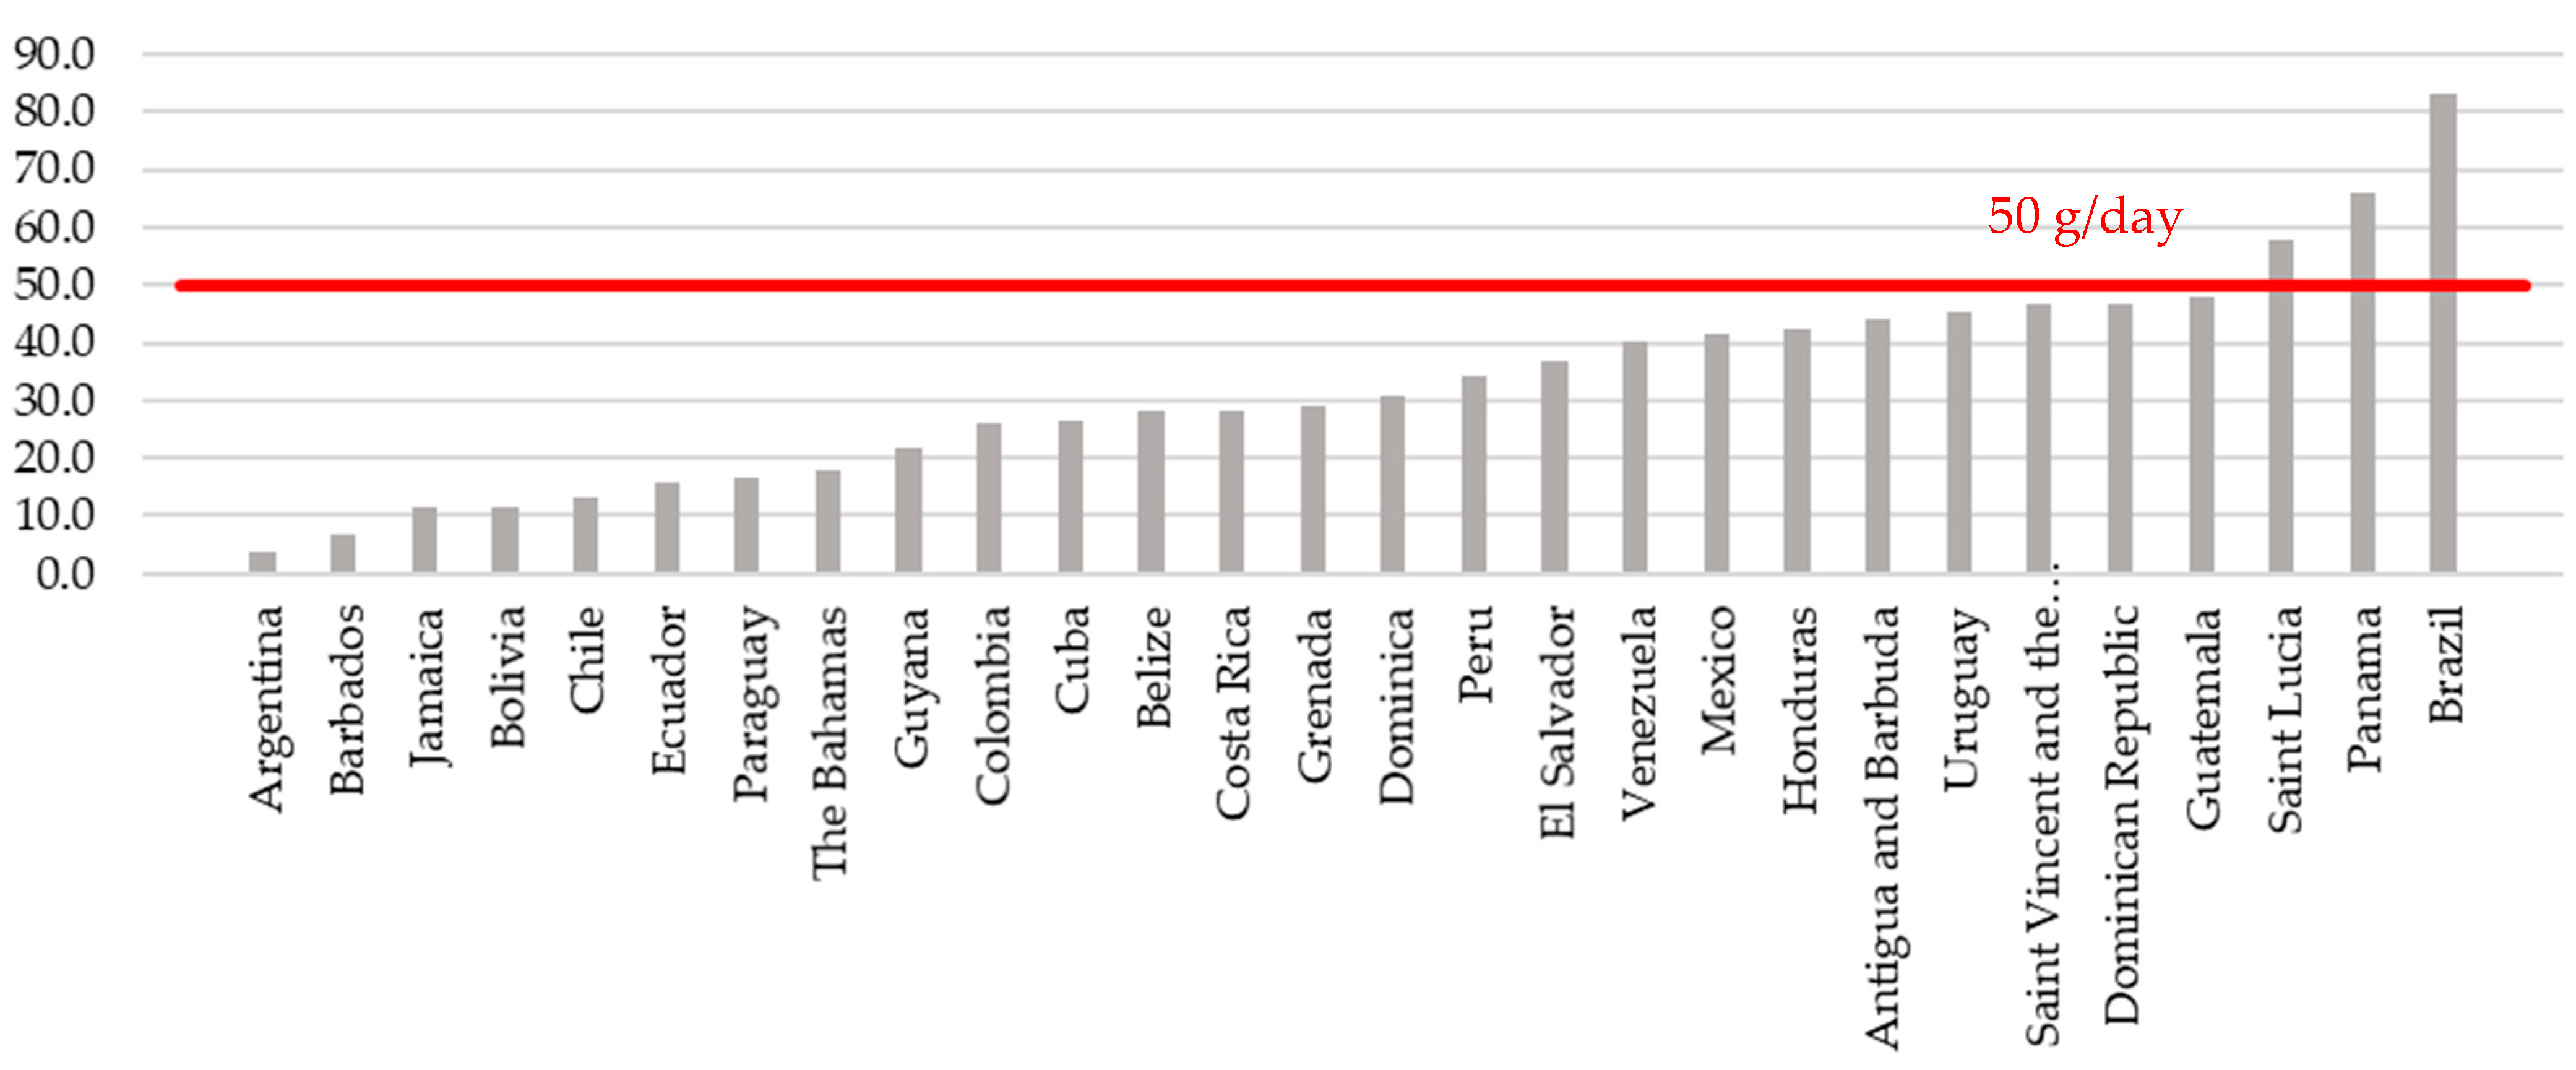
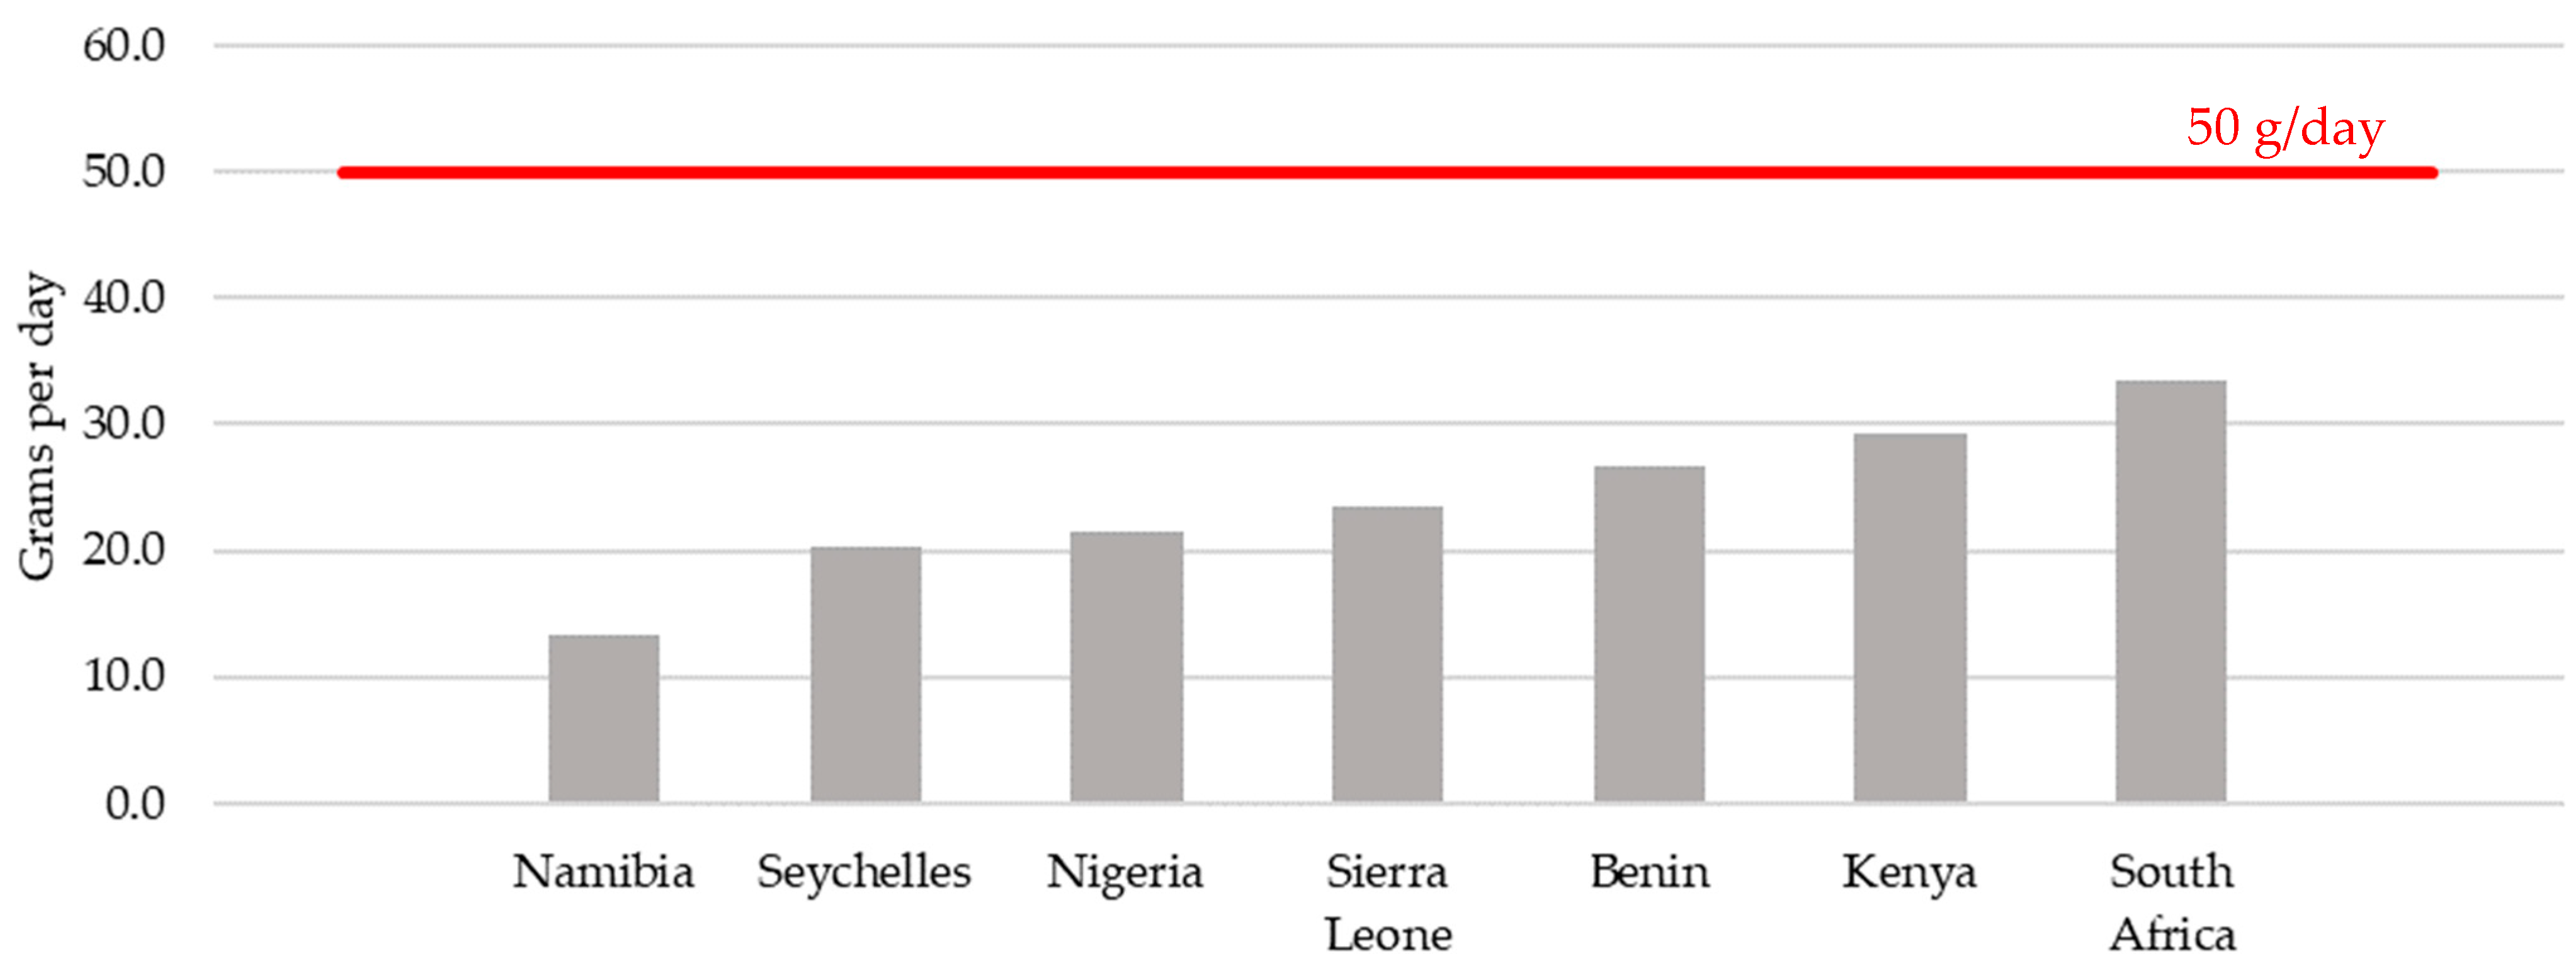
3.5. Legume Intake Data and Comparison to Legume Food Group Classification
4. Discussion
5. Conclusions
Author Contributions
Funding
Institutional Review Board Statement
Informed Consent Statement
Data Availability Statement
Acknowledgments
Conflicts of Interest
Appendix A

Appendix B

Appendix C

Appendix D

Appendix E

Appendix F

References
- Food and Agriculture Organization of the United Nations. Definition and Classification of Commodities, Pulses and Derived Products. Available online: http://www.fao.org/es/faodef/fdef04e.htm (accessed on 20 September 2021).
- Margier, M.; Georgé, S.; Hafnaoui, N.; Remond, D.; Nowicki, M.; Du Chaffaut, L.; Amiot, M.-J.; Reboul, E. Nutritional Composition and Bioactive Content of Legumes: Characterization of Pulses Frequently Consumed in France and Effect of the Cooking Method. Nutrients 2018, 10, 1668. [Google Scholar] [CrossRef] [PubMed]
- Calles, T.; del Castello, R.; Baratelli, M.; Xipsiti, M.; Navarro, D.K. The International Year of Pulses-Final Report; FAO: Rome, Italy, 2019. [Google Scholar]
- Mitchell, D.C.; Marinangeli, C.P.F.; Pigat, S.; Bompola, F.; Campbell, J.; Pan, Y.; Curran, J.M.; Cai, D.J.; Jaconis, S.Y.; Rumney, J. Pulse Intake Improves Nutrient Density among US Adult Consumers. Nutrients 2021, 13, 2668. [Google Scholar] [CrossRef]
- Bechthold, A.; Boeing, H.; Schwedhelm, C.; Hoffmann, G.; Knüppel, S.; Iqbal, K.; De Henauw, S.; Michels, N.; Devleesschauwer, B.; Schlesinger, S.; et al. Food groups and risk of coronary heart disease, stroke and heart failure: A systematic review and dose-response meta-analysis of prospective studies. Crit. Rev. Food Sci. Nutr. 2019, 59, 1071–1090. [Google Scholar] [CrossRef]
- Schwingshackl, L.; Schwedhelm, C.; Hoffmann, G.; Lampousi, A.-M.; Knüppel, S.; Iqbal, K.; Bechthold, A.; Schlesinger, S.; Boeing, H. Food groups and risk of all-cause mortality: A systematic review and meta-analysis of prospective studies. Am. J. Clin. Nutr. 2017, 105, 1462–1473. [Google Scholar] [CrossRef] [PubMed]
- Applegate, C.C.; Rowles, J.L.; Ranard, K.M.; Jeon, S.; Erdman, J.W. Soy Consumption and the Risk of Prostate Cancer: An Updated Systematic Review and Meta-Analysis. Nutrients 2018, 10, 40. [Google Scholar] [CrossRef] [PubMed]
- Qin, L.-Q.; Xu, J.-Y.; Wang, P.-Y.; Hoshi, K. Soyfood Intake in the Prevention of Breast Cancer Risk in Women: A Meta-Analysis of Observational Epidemiological Studies. J. Nutr. Sci. Vitaminol. 2006, 52, 428–436. [Google Scholar] [CrossRef] [PubMed][Green Version]
- Trock, B.J.; Hilakivi-Clarke, L.; Clarke, R. Meta-Analysis of Soy Intake and Breast Cancer Risk. J. Natl. Cancer Inst. 2006, 98, 459–471. [Google Scholar] [CrossRef]
- Strid, A.; Hallström, E.; Sonesson, U.; Sjons, J.; Winkvist, A.; Bianchi, M. Sustainability Indicators for Foods Benefiting Climate and Health. Sustainability 2021, 13, 3621. [Google Scholar] [CrossRef]
- Havemeier, S.; Erickson, J.; Slavin, J. Dietary guidance for pulses: The challenge and opportunity to be part of both the vegetable and protein food groups. Ann. N. Y. Acad. Sci. 2017, 1392, 58–66. [Google Scholar] [CrossRef]
- Willett, W. Food in the Anthropocene: The EAT-Lancet Commission on healthy diets from sustainable food systems. Lancet Glob. Health 2019, 393, 447–492. [Google Scholar] [CrossRef]
- Abdullah, M.; Marinangeli, C.P.F.; Jones, P.J.H.; Carlberg, J.G. Canadian Potential Healthcare and Societal Cost Savings from Consumption of Pulses: A Cost-Of-Illness Analysis. Nutrients 2017, 9, 793. [Google Scholar] [CrossRef] [PubMed]
- Abdullah, M.M.H.; Hughes, J.; Grafenauer, S. Legume Intake Is Associated with Potential Savings in Coronary Heart Disease-Related Health Care Costs in Australia. Nutrients 2022, 14, 2912. [Google Scholar] [CrossRef]
- Food and Agriculture Organisation of the United Nations. Food-Based Dietary Guidelines. 2020. Available online: http://www.fao.org/nutrition/nutrition-education/food-dietary-guidelines/en/ (accessed on 20 September 2021).
- Curtain, F.; Grafenauer, S. Historical and Global Perspectives on Grains and Whole Grains within Dietary Guidelines. Cereal Foods World 2020, 65, 29. [Google Scholar] [CrossRef]
- National Health and Medical Research Council. Australian Dietary Guidelines Summary; National Health and Medical Research Council: Canberra, Australia, 2013. Available online: https://www.eatforhealth.gov.au/guidelines (accessed on 15 June 2022).
- National Health and Medical Research Council. A Modelling System to Inform the Revision of the Australian Guide to Healthy Eating; National Health and Medical Research Council: Canberra, Australia, 2011; p. 68. Available online: https://www.eatforhealth.gov.au/file/modelling-system-inform-revision-australian-guide-healthy-eating-fms (accessed on 15 June 2022).
- Marinangeli, C.; Curran, J.; Barr, S.; Slavin, J.; Puri, S.; Swaminathan, S.; Tapsell, L.; Patterson, C. Enhancing nutrition with pulses: Defining a recommended serving size for adults. Nutr. Rev. 2017, 75, 990–1006. [Google Scholar] [CrossRef]
- Figueira, N.; Curtain, F.; Beck, E.; Grafenauer, S. Consumer Understanding and Culinary Use of Legume in Australia. Nutrients 2019, 11, 1575. [Google Scholar] [CrossRef] [PubMed]
- Global Dietary Database. GDD 2018 Final Estimates-Beans and Legumes. Available online: https://www.globaldietarydatabase.org/data-download (accessed on 7 June 2022).
- Global Dietary Database. The GDD Prediction Model. Available online: https://www.globaldietarydatabase.org/gdd-prediction-model (accessed on 7 June 2022).
- Khatibzadeh, S.; Saheb Kashaf, M.; Micha, R.; Fahimi, S.; Shi, P.; Elmadfa, I.; Kalantarian, S.; Wirojratana, P.; Ezzati, M.; Powles, J.; et al. A global database of food and nutrient consumption. Bull. World Health Organ. 2016, 94, 931–934. [Google Scholar] [CrossRef]
- Micha, R.; Khatibzadeh, S.; Shi, P.; Andrews, K.G.; Engell, R.E.; Mozaffarian, D. Global, regional and national consumption of major food groups in 1990 and 2010: A systematic analysis including 266 country-specific nutrition surveys worldwide. BMJ Open 2015, 5, e008705. [Google Scholar] [CrossRef]
- Miller, V.; Singh, G.M.; Onopa, J.; Reedy, J.; Shi, P.; Zhang, J.; Tahira, A.; Shulkin Morris, M.L.; Marsden, D.P.; Kranz, S.; et al. Global Dietary Database 2017: Data availability and gaps on 54 major foods, beverages and nutrients among 5.6 million children and adults from 1220 surveys worldwide. BMJ Glob. Health 2021, 6, e003585. [Google Scholar] [CrossRef]
- Miller, V.; Reedy, J.; Cudhea, F.; Zhang, J.; Shi, P.; Erndt-Marino, J.; Coates, J.; Micha, R.; Webb, P.; Mozaffarian, D.; et al. Global, regional, and national consumption of animal-source foods between 1990 and 2018: Findings from the Global Dietary Database. Lancet Planet. Health 2022, 6, e243–e256. [Google Scholar] [CrossRef]
- Global Dietary Database. Model Covariates. Available online: https://www.globaldietarydatabase.org/model-covariates (accessed on 7 June 2022).
- Forouzanfar, M.H.; Alexander, L.; Anderson, H.R.; Bachman, V.F.; Biryukov, S.; Brauer, M.; Burnett, R.; Casey, D.; Coates, M.M.; Cohen, A.; et al. Global, regional, and national comparative risk assessment of 79 behavioural, environmental and occupational, and metabolic risks or clusters of risks in 188 countries, 1990–2013: A systematic analysis for the Global Burden of Disease Study 2013. Lancet 2015, 386, 2287–2323. [Google Scholar] [CrossRef]
- Global Dietary Database. GDD Variable Definitions. Available online: https://www.globaldietarydatabase.org/GDD/VariableDefinitions (accessed on 7 June 2022).
- Painter, J.; Rah, J.; Lee, Y. Comparision of international food guide pictorial representations. J. Am. Diet. Assoc. 2002, 102, 483–489. [Google Scholar] [CrossRef]
- Didinger, C.; Thompson, H.J. Defining Nutritional and Functional Niches of Legumes: A Call for Clarity to Distinguish a Future Role for Pulses in the Dietary Guidelines for Americans. Nutrients 2021, 13, 1100. [Google Scholar] [CrossRef] [PubMed]
- Reyneke, G.; Hughes, J.; Grafenauer, S. Consumer Understanding of the Australian Dietary Guidelines: Recommendations for Legumes and Whole Grains. Nutrients 2022, 14, 1753. [Google Scholar] [CrossRef]
- U.S. Department of Agriculture; U.S. Department of Health and Human Services. Dietary Guidelines for Americans, 2020–2025, 9th ed. Available online: https://www.dietaryguidelines.gov/ (accessed on 28 September 2021).
- Gilham, B.; Hall, R.; Woods, J.L. Vegetables and legumes in new Australasian food launches: How are they being used and are they a healthy choice? Nutr. J. 2018, 17, 104. [Google Scholar] [CrossRef] [PubMed]
- Huebbe, P.; Rimbach, G. Historical Reflection of Food Processing and the Role of Legumes as Part of a Healthy Balanced Diet. Foods 2020, 9, 1056. [Google Scholar] [CrossRef]
- Varela-Moreiras, G.; Ruiz, E.; Valero, T.; Avila, J.M.; del Pozo, S. The Spanish diet: An update. Nutr. Hosp. 2013, 28, 13–20. [Google Scholar]
- Del Gobbo, L.C.; Khatibzadeh, S.; Imamura, F.; Micha, R.; Shi, P.; Smith, M.; Myers, S.S.; Mozaffarian, D. Assessing global dietary habits: A comparison of national estimates from the FAO and the Global Dietary Database. Am. J. Clin. Nutr. 2015, 101, 1038–1046. [Google Scholar] [CrossRef]
- Bielefeld, D.; Hughes, J.; Grafenauer, S. The Changing Landscape of Legume Products Available in Australian Supermarkets. Nutrients 2021, 13, 3226. [Google Scholar] [CrossRef]


| Country | Food Group Classification in Food Guide | Legume-Based Message/s | Key Legume Term | Recommended Serving Frequency a | Recommended Serving Size | GDD Consumption (Median; 95% CI) |
|---|---|---|---|---|---|---|
| Africa | ||||||
| Benin (2015) | Protein-rich foods | “When there is no meat, fish or eggs in a given day, you can replace them with pulses, peanuts, soybeans, soya, cheese or peas.” | Pulses | 2–3 servings of food group/day * | ½ cup (140 g) * | 26.7 (22.7–31.5) |
| Kenya (2017) | Legumes, nuts and seeds (own group) | “Eat beans, peas, lentils, cowpeas, pigeon peas, soya, nuts and edible seeds regularly (at least four times a week).” | Beans, peas, lentils | 4 serving/week | ½ cup (125 mL) cooked dried beans, peas or lentils | 29.2 (25.3–34) |
| Namibia (2000) | Protein-rich foods | “Eat beans or meat regularly” | Beans | n/s | n/s | 13.4 (11.2–16.2) |
| Nigeria (2001) | Starchy staples | The diet should contain as wide a variety of foods as possible, e.g., legumes | Legumes | n/s | n/s | 21.6 (18.7–24.8) |
| Seychelles (2006) | Fruits and/or vegetable | “Eat pulses (peas, beans and lentils) at least 4 times a week” | Pulses | 4 servings/week | n/s | 20.4 (17.1–24.4) |
| Sierra Leone (2016) | Legumes (own group) | “Eat beans, peas and lentils everyday” | Beans, peas and lentils | n/s | ½ cup cooked beans/lentils | 23.4 (20.0–27.7) |
| South Africa (2012) | Legumes (own group) | “Eat dry beans, split peas, lentils and soya regularly” | Beans, split peas, lentils and soya | n/s | n/s | 33.6 (25.2–44.3) |
| Asia and the Pacific | ||||||
| Afghanistan (2015) | Legumes, nuts and seeds (own group) | “Eat different types of food daily” | Pulses and beans | 0.5–2 servings/day depending on energy needs. | ½ cup (100 g) boiled lentil/peas, ¼ cup raw dry lentils/peas | 122.7 (59.5–237.3) |
| Australia (2013) | Vegetable | “Plenty of vegetables, including different types and colours, and legumes/beans” | Legumes/beans | 5 servings of the food group/day | ½ cup (75 g) cooked dried or canned beans, peas or lentils | 26.1 (18.7–36.5) |
| Protein-rich foods | “Lean meats and poultry, fish, eggs, tofu, nuts and seeds, and legumes/beans” | 2.5 servings of the food group/day | 1 cup (150 g) cooked or canned legumes/beans | |||
| Bangladesh (2013) | Protein-rich foods | “Consume required amounts of fish, meat, poultry, egg and legumes daily” | Legumes | 1 serving/day. Combine cereals with legumes in a 3:1 ratio | ⅓–½ cup pulses | 31.7 (28.6–35.4) |
| China (2016) | Starchy staples | “Consume plenty of vegetables, milk, and soybeans” | Soybeans | 250–400 g of the food group/day | n/s | 15.8 (12.8–19.6) |
| Fiji (2018) | Protein-rich foods | “Eat body building foods such as dhal, dried peas and beans…” | Dhal, dried peas and beans | n/s | n/s | 30.7 (17.9–53.9) |
| India (2011) | Starchy staples | “Eat variety of foods to ensure a balanced diet” | Pulses | 2 servings/day for vegetarians, 1 serving/day for non-vegetarian | 30 g | 27.2 (24.6–30.2) |
| Indonesia (2014) | Protein-rich foods | “Eat high-protein foods (animal or vegetable source)” | n/s | 2–4 servings of the food group/day | n/s | 29.0 (25.5–33) |
| Japan (2010) | Cannot be determined ** | “Combine vegetables, fruits, milk products, beans and fish in your diet.” | Beans | n/s | n/s | 61.1 (53.5–70.5) |
| Malaysia (2010) | Protein-rich foods | “Consume moderate amounts of fish, meat, poultry, eggs, legumes and nuts.” | Legumes | ½–1 serving/day | n/s | 26.6 (22.6–31.1) |
| Mongolia (2010) | Cannot be determined ** | “Consume a variety of nutrient-dense foods and beverages.” | n/s | n/s | n/s | 32.0 (18.8–56) |
| Nepal (2012) | No food guide | “Eat pulses, fish, poultry, eggs and a little meat regularly.” | Pulses | n/s | n/s | 64.7 (56.5–74.4) |
| New Zealand (2020) | Protein-rich foods | “Enjoy a variety of nutritious foods every day including: some legumes…” | Legumes | 2 servings of the food group/day | 1 cup (150 g) cooked or canned | 68.0 (53.8–85.6) |
| Philippines (2012) | Protein-rich foods | “Consume fish, lean meat, poultry, eggs, dried beans or nuts daily for growth and repair of body tissues.” | Beans | 3–4 servings of the food group/day | n/s | 9.7 (8.6–11) |
| Republic of Korea (2016) | Protein-rich foods | “Eat a variety of foods including rice & other grains, vegetables, fruits, milk & dairy products, meat, fish, eggs, and beans.” | Beans | 3–4 servings of the food group/day | n/s | 28.5 (26.4–30.9) |
| Sri Lanka (2011) | Protein-rich foods | “Eat pulses, fish, dried fish, eggs, poultry and lean meat.” | Pulses | 3–4 servings of the food group/day | 3 Tbsp cooked pulses | 89.6 (76.6–104.4) |
| Thailand (1998) | Protein-rich foods | “Eat fish, lean meat, eggs, legumes and pulses regularly.” | Legumes and pulses | n/s | n/s | 43.4 (17.8–104.9) |
| Vietnam (2013) | Protein-rich foods | “Eat protein-rich foods from a good balance of vegetable and animal sources. Increase the intake of … beans/peas” | Beans/peas | n/s | n/s | 104.7 (69.8–157.2) |
| Near East | ||||||
| Iran (2015) | Legumes, nuts and seeds | “Eat legumes and dishes made with legumes once a day” | Legumes | n/s | n/s | 16.4 (14.6–18.2) |
| Lebanon (2013) | Protein-rich foods | “Consume legume-based dishes regularly…” | Legumes | 5–6.5 servings of the food group/day | ¼ cup cooked legumes, 2 Tbsp hummus, 1 baked falafel | 28.9 (24–34.7) |
| Oman (2009) | Legumes (own group) | “Consume one serving of legumes daily.” | Legumes | 1 serving/day | ½ cup cooked lentils, beans or peas, ¼ cup dried beans or tofu | 45.5 (23.4–92.1) |
| Qatar (2015) | Legumes (own group) | “Eat legumes daily” “Choose legumes, nuts and seeds as alternative protein sources” | Legumes | n/s | n/s | 39.0 (19.5–85.9) |
| Saudi Arabia (2013) | Protein-rich foods | “Enjoy a variety of food items from major food groups daily—Include legumes, nuts, seeds, poultry, and lean meats in your eating pattern” | Legumes | 2–3 servings of the food group/day | ½ cup cooked legumes | 58.9 (31.1–110.7) |
| United Arab Emirates (2019) | Cannot be determined ** | “Consume diversified nutrient-rich foods and beverages.” | n/s | n/s | n/s | 41.7 (21.5–84.2) |
| Europe | ||||||
| Albania (2008) | Starchy staples | “Integral grains and legumes, other grain and potatoes—in every main meal” | Legumes | 2 servings/ day | 60–100 g legumes | 42.4 (33.3–54) |
| Protein-rich foods | “Substitute greasy meat and meat by-products with peas, kidney beans, lentils…” | Peas, kidney beans, lentils | ||||
| Austria (2015) | Vegetables, legumes and fruits | “Eat five servings of vegetables, legumes and fruits every day. The ideal would be to eat three servings of vegetables and/or legumes…” | Legumes | 3 servings of vegetables and/or legumes/day * | 70–100 g dry pulses (150–200 g cooked) * | 7.0 (4.6–10.8) |
| Belgium (French region) (2020) | Protein-rich foods | n/s | Legumes | n/s | n/s | 5.0 (3.4–7.4) |
| Bosnia and Herzegovina (2004) | Cannot be determined ** | “Eat meat, poultry, eggs and legumes several times a week” | Legumes | n/s | n/s | 14.6 (8.7–24.8) |
| Bulgaria (2006) | Protein-rich foods | “Replace meat and meat products often with fish, poultry or pulses” | Pulses | 2 servings per week | 200–300 g | 18.9 (13.7–25.9) |
| Croatia (2002) | Starchy staples | n/s | n/s | n/s | n/s | 8.6 (3.4–21.8) |
| Cyprus (2007) | Legumes (own group) | “Consume a traditional Mediterranean diet with lots of legumes…” “Increase your intake of fibre and complex carbohydrates by using whole grains, legumes, vegetables and fruit with the peel on” | Legumes | n/s | n/s | 34.3 (13.3–88.3) |
| Denmark (2021) | Legumes (own group) | “Eat less meat—choose legumes and fish” | Legumes | 100 g/day | n/s | 25.5 (15.6–42.2) |
| Estonia (2017) | Vegetable | “Increase the consumption of vegetables, including legumes.” | Legumes | 3–4 servings/ week * | 30 g fresh or cooked, 10 g dried legumes * | 6.3 (4.9–8.2) |
| Finland (2014) | Vegetable, fruits and berries | “Eat vegetables, fruits and berries frequently…” | n/s | 500 g of the food group/day | n/s | 6.7 (5.4–8.5) |
| France (2019) | No guide | “The consumption of pulses (beans, lentils, chickpeas, etc), at least twice a week” | Pulses | 2 servings/week | n/s | 14.9 (12.7–17.5) |
| Georgia (2005) | Protein-rich foods | “Replace fatty meat and meat products with legumes…” | Legumes | 1–3 servings/d (150–200 g) | ¼ cup of beans | 36.9 (21.5–65.3) |
| Germany (2017) | Vegetable | “Enjoy a variety of foods”. | n/s | n/s | n/s | 5.7 (5.1–6.5) |
| Greece (2014) | Legumes, nuts and seeds | “Consume legumes frequently” | Legumes | 3 servings/week * | 1 cup of cooked drained legumes (150–200 g) * | 15.2 (11.5–19.9) |
| Hungary (2004) | Fruits and vegetables | “Eat dark green vegetables, citrus fruits, tomato and legumes often..” | Legumes | n/s | n/s | 16.9 (5.4–51) |
| Iceland (2014) | Protein-rich foods | “Variety of foods in reasonable quantity” | Beans | 2 servings of food group/day * | ¾ cup beans or lentils * | 6.0 (4.7–7.7) |
| Ireland (2015–16) | Protein-rich foods | “Choose eggs, beans and nuts” | Beans | n/s | n/s | 25.5 (11–56.4) |
| Israel (2008) | Protein-rich foods | “Choose fibre-containing foods such as… legumes…” | Legumes | n/s | n/s | 75.3 (64–88.5) |
| Italy (2019) | No guide | “Eat whole grain and legumes” | Legumes | n/s | n/s | 14.9 (13.2–16.9) |
| Latvia (2008) | Protein-rich foods | “Eat legumes, fish or lean meat. The recommended daily amount of those products is 2–3 servings” | Legumes | 2–3 servings of food group/day | n/s | 10.5 (4.9–23.5) |
| Malta (2016) | Protein-rich foods | “Include legume-based dishes throughout the week. These could take the form of home-made dips (bigilla, red kidney dip and hummus). Salads (bean and chickpea salad), stews, vegetable soups (minestra) and home-made torta talful.” | Legumes | 2+ servings/week | 70 g (raw), 140 g (cooked/canned) | 4.0 (2.1–7.5) |
| The Netherlands (2016) | Protein-rich foods | “Eat less meat and more plant-based foods, and vary with fish, pulses, nuts, eggs and vegetarian products” | Pulses | n/s | n/s | 5.9 (5.0–6.9) |
| The Republic of North Macedonia (2014) | No guide | “Substitute meat and meat products with fish, poultry, beans and bean-based products” | Beans | n/s | n/s | 22.4 (13.6–38.2) |
| Norway (2014) | No guide | n/s | n/s | n/s | n/s | 1.2 (0.5–3.1) |
| Poland (2020) | Eat more food group | “Eat more legume seeds (e.g., beans, peas, chickpeas, lentils, broad beans)” | Legume seeds | n/s | n/s | 3.0 (2.6–3.4) |
| Replace food group | “Replace red meat and processed meat with fish, poultry, eggs, legume seeds and nuts” | n/s | n/s | |||
| Portugal (2003) | Legumes (own group) | “Eat foods from each food group every day to have a complete diet.” | Legumes | 1–2 servings/day | 1 Tbsp raw dried (25 g), 3 Tbsp raw fresh (80 g), 3 Tbsp dried/cooked fresh (80 g) | 12.8 (11.3–14.4) |
| Romania (2006) | Cannot be determined ** | “Eat a variety of foods” | n/s | n/s | n/s | 34.6 (27.8–43.5) |
| Slovenia (2011) | Protein-rich foods | “Eat a variety of foods originating mainly from plants, rather than animals”. | Beans, lentils, soybeans, chickpeas. | 3–5 servings of the food groups/day * | 4 tablespoons of beans, lentils, soybeans, chickpeas * | 20.1 (8.9–44.4) |
| Spain (2008) | Protein-rich foods | “Enjoy a variety of foods” | Legumes | n/s | n/s | 22.9 (10.7–49.5) |
| Sweden (2015) | “Eat More” | “Eat more vegetables and fruit—Ideally, choose high fibre vegs such as… beans.” | Beans | n/s | n/s | 17.0 (14.7–19.6) |
| Switch To | “Soups, pies and stir fries can easily be made without meat” | n/s | n/s | |||
| Switzerland (2011) | Starchy staples | “Consume three portions of grains, potatoes and pulses per day” | Pulses | 3 servings of the food group/day | n/s | 2.9 (2.1–4.1) |
| Turkey (2014) | Protein-rich foods | “Increase consumption of wholegrain cereals and leguminous seeds” | Legumes | 2 servings of food group/day | 90 g | 32.6 (21.9–49.3) |
| United Kingdom (2016) | Protein-rich foods | “Eat some beans, pulses, fish, eggs, meat and other proteins..” | Beans and pulses | n/s | 80 g | 44.8 (36.8–55.2) |
| Latin America and the Caribbean | ||||||
| Antigua and Barbuda (2013) | Legumes, nuts and seeds | “Choose to eat a variety of foods every day” | Peas and beans | n/s | n/s | 44.2 (26.2–75.7) |
| Argentina (2014) | Starchy staples | “Eat legumes; cereals, preferably wholemeal; potato; sweet potato; corn or cassava” | Legumes | n/s | n/s | 3.7 (2.7–4.9) |
| Bahamas (2002) | Legumes (own group) | “Make starchy vegetables, peas and beans a part of your diet” | Peas and beans | n/s | n/s | 18 (10.1–32.4) |
| Barbados (2017) | Legumes (own group) | “Enjoy a wide variety of foods every day” | Legumes | n/s | n/s | 6.9 (4.4–11) |
| Belize (2012) | Legumes (own group) | “Choose different types of foods from all the food groups daily” | Legumes | 1–2 servings/day depending on energy needs | ¼ cup red beans or lentils | 28.2 (16.4–49.7) |
| Bolivia (2013) | Starchy staples | “Consume a varied diet daily, including foods from all groups” | n/s | n/s | n/s | 11.7 (10–13.6) |
| Brazil (2014) | No guide | “Make natural or minimally processed foods part of your diet” | Beans | n/s | n/s | 83.0 (71.6–96.2) |
| Chile (2013) | Protein-rich foods | “To keep your heart healthy…eat legumes at least twice a week, without mixing them with cold or cured meats” | Legumes | 2 servings/ week | n/s | 13.1 (7.4–23.2) |
| Colombia (2015) | Protein-rich foods | “To complement your diet, eat pulses like beans, lentils, peas and chickpeas at least two times per week” | Pulses | 2 servings/ week | n/s | 26.1 (22.8–29.9) |
| Costa Rica (2010) | Starchy staples | “Eat rice and beans; they are the basis of the everyday diet” | Beans | n/s | n/s | 28.4 (16.9–49.7) |
| Cuba (2009) | Protein-rich foods | “A variety of foods during the day is pleasant and necessary for good health” | Legumes | n/s | n/s | 26.4 (16–44.8) |
| Dominica (2007) | Legumes (own group) | “Always try to eat a variety of foods every day. Use the basket to help you make the right choices” | Peas and Beans | n/s | n/s | 30.9 (18.6–53.5) |
| Dominican Republic (2009) | Legumes (own group) | “Increase consumption of beans, grains, fish, eggs and dairy to keep your bones and organs healthy” | Beans | n/s | n/s | 46.8 (40.9–54.1) |
| Ecuador (2018) | Protein-rich foods | “Let’s include animal source foods or legumes in our daily dishes to develop and strengthen our bodies” “Let’s eat better by combining legumes with cereals like rice, maize or quinoa” | Legumes | n/s | n/s | 15.8 (8.9–28) |
| El Salvador (2012) | No guide | “Prepare varied meals using natural foods every day” | Beans | n/s | n/s | 36.8 (21.8–63.8) |
| Grenada (2006) | Legumes (own group) | “Eat a variety of foods” | Legumes | n/s | n/s | 29.1 (17.7–50.2) |
| Guatemala (2012) | Starchy Staples | “Eat beans and tortillas every day: eat two tablespoons of beans per tortilla, because they provide more nutrients and fill you up more.” | Beans | n/s | n/s | 48.1 (41.7–55.5) |
| Guyana (2018) | Legumes (own group) | “Eat different types of foods from all the food groups daily” | Legumes | n/s | n/s | 21.9 (17.6–27) |
| Honduras (2013) | Starchy staples | “Eat foods from all food groups to enjoy good health” | n/s | n/s | n/s | 42.4 (36.7–49.1) |
| Jamaica (2015) | Legumes, nuts and seeds | “Include peas, beans and nuts in your daily meals” | Legumes | 3 servings of food group/day | ¼ cup cooked peas, beans, baked beans, stewed peas and chickpeas (1 Tbspn), ½ cup canned green peas and lentils | 11.6 (7.9–16.9) |
| Mexico (2015) | Legumes (own group) | “Include the three food groups: fruits and vegetables, legumes and animal source foods in your breakfast, lunch and dinner” “Eat legumes like beans, lentils and green beans, daily” | Legumes | n/s | n/s | 41.4 (37.3–45.9) |
| Panama (2013) | Starchy staples | “Eat a variety of foods every day” | n/s | n/s | n/s | 66.1 (40.8–109.8) |
| Paraguay (2015) | Protein-rich foods | “To have a healthy diet, eat from all 7 food groups (… meats, legumes and eggs…) every day” “Eat cereals and legumes 2 times a week because together they are more nutritious” | Legumes | 2 servings/week consumed with cereals | n/s | 16.7 (10.2–28.9) |
| Peru (2019) | Starchy staples | “Don’t miss legumes, they are tasty, healthy and can be prepared in many ways” | Legumes | n/s | n/s | 34.4 (30.3–39.5) |
| Saint Kitts and Nevis (2010) | Legumes, nuts and seeds (own group) | “Every day, choose foods from each of the groups (shown on the mill)” | Peas and beans | n/s | n/s | No data |
| Saint Lucia (2007) | Legumes (own group) | “Always try to eat ground provisions, peas and beans in your meals every day” | Peas and beans | n/s | n/s | 57.6 (34.2–98.3) |
| Saint Vincent and the Grenadines (2006) | Legumes (own group) | “Eat a variety of foods from the foods groups in the breadfruit” | Legumes | n/s | n/s | 46.6 (28.2–79.2) |
| Uruguay (2016) | Vegetable | “Incorporate vegetables and fruits in all your meals. This will help you to feel good and to maintain a healthy weight” | Legumes | n/s | n/s | 45.6 (26.4–77.6) |
| Venezuela (1991) | Starchy staples | “Eat a varied diet. Get the fibre that your body needs from plant foods on a daily basis” | n/s | n/s | n/s | 40.4 (23.9–71.7) |
| North America | ||||||
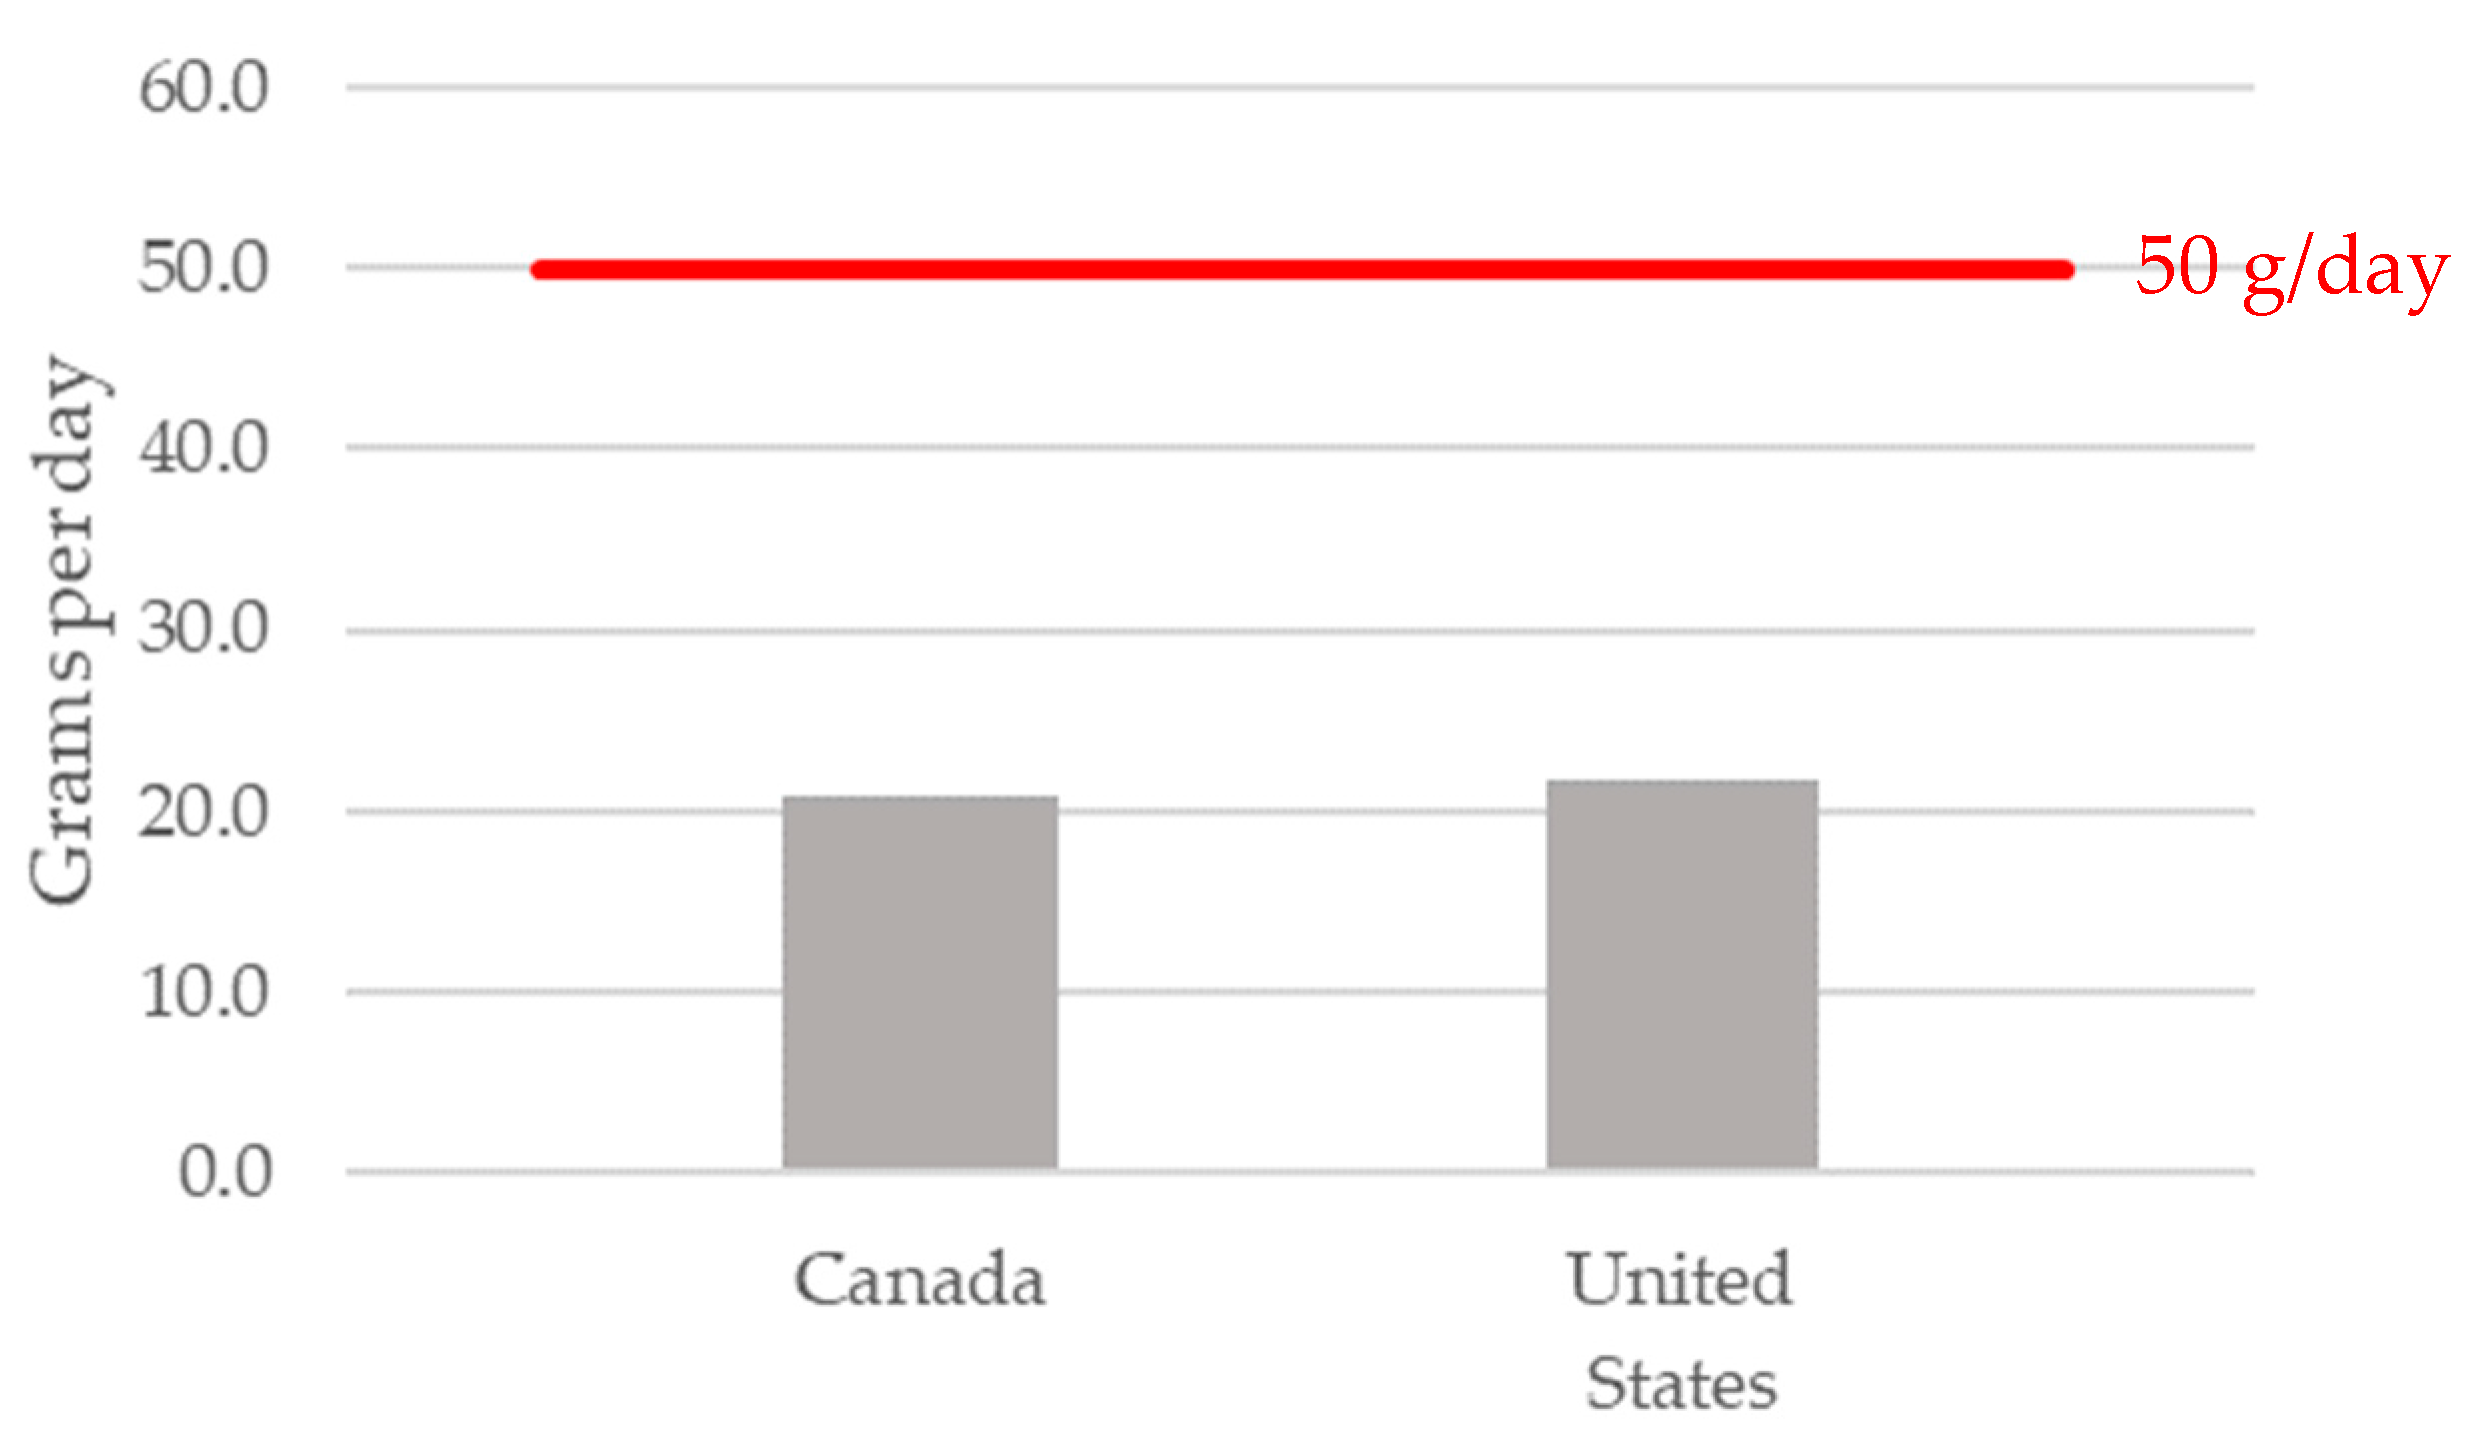
| Canada (2019) | Protein-rich foods | “Eat plenty of vegetables and fruits, whole grain foods and protein foods. Choose protein foods that come from plants more often” | Legumes | n/s | n/s | 20.8 (18–24.2) |
| United States (2020) | Vegetable | “Focus on meeting food group needs with nutrient-dense foods and beverages…” | Beans, Peas, Lentils | 1–3 cups/ week depending on energy needs | n/s | 21.8 (20.2–23.6) |
| Protein-rich foods | n/s | |||||
Publisher’s Note: MDPI stays neutral with regard to jurisdictional claims in published maps and institutional affiliations. |
© 2022 by the authors. Licensee MDPI, Basel, Switzerland. This article is an open access article distributed under the terms and conditions of the Creative Commons Attribution (CC BY) license (https://creativecommons.org/licenses/by/4.0/).
Share and Cite
Hughes, J.; Pearson, E.; Grafenauer, S. Legumes—A Comprehensive Exploration of Global Food-Based Dietary Guidelines and Consumption. Nutrients 2022, 14, 3080. https://doi.org/10.3390/nu14153080
Hughes J, Pearson E, Grafenauer S. Legumes—A Comprehensive Exploration of Global Food-Based Dietary Guidelines and Consumption. Nutrients. 2022; 14(15):3080. https://doi.org/10.3390/nu14153080
Chicago/Turabian StyleHughes, Jaimee, Emma Pearson, and Sara Grafenauer. 2022. "Legumes—A Comprehensive Exploration of Global Food-Based Dietary Guidelines and Consumption" Nutrients 14, no. 15: 3080. https://doi.org/10.3390/nu14153080
APA StyleHughes, J., Pearson, E., & Grafenauer, S. (2022). Legumes—A Comprehensive Exploration of Global Food-Based Dietary Guidelines and Consumption. Nutrients, 14(15), 3080. https://doi.org/10.3390/nu14153080