Article

Adherence to a Plant-Based Diet and Consumption of Specific Plant Foods—Associations with 3-Year Weight-Loss Maintenance and Cardiometabolic Risk Factors: A Secondary Analysis of the PREVIEW Intervention Study

by Ruixin Zhu 1, Mikael Fogelholm 2, Sally D. Poppitt 3, Marta P. Silvestre 3,4, Grith Møller 1, Maija Huttunen-Lenz 5, Gareth Stratton 6, Jouko Sundvall 7, Laura Råman 7, Elli Jalo 2, Moira A. Taylor 8, Ian A. Macdonald 9, Svetoslav Handjiev 10, Teodora Handjieva-Darlenska 10, J. Alfredo Martinez 11,12,13,14, Roslyn Muirhead 15, Jennie Brand-Miller 15 and Anne Raben 1,16,*
1
Department of Nutrition, Exercise and Sports, Faculty of Science, University of Copenhagen, Rolighedsvej 30, Frederiksberg C, 1958 Copenhagen, Denmark
2
Department of Food and Nutrition, University of Helsinki, P.O. Box 66, 00014 Helsinki, Finland
3
Human Nutrition Unit, Department of Medicine, School of Biological Sciences, University of Auckland, Auckland 1042, New Zealand
4
CINTESIS, NOVA Medical School, NMS, Universidade Nova de Lisboa, 1169-056 Lisboa, Portugal
5
Institute for Nursing Science, University of Education Schwäbisch Gmünd, Oberbettringerstrasse 200, 73525 Schwäbisch Gmünd, Germany
6
Applied Sports, Technology, Exercise and Medicine (A-STEM) Research Centre, Swansea University, Swansea SA1 8EN, UK
7
Finnish Institute for Health and Welfare, P.O. Box 30, 00271 Helsinki, Finland
8
Division of Physiology, Pharmacology and Neuroscience, School of Life Sciences, Queen’s Medical Centre, Nottingham NG7 2UH, UK
9
Division of Physiology, Pharmacology and Neuroscience, School of Life Sciences, Queen’s Medical Centre, MRC/ARUK Centre for Musculoskeletal Ageing Research, ARUK Centre for Sport, Exercise and Osteoarthritis, National Institute for Health Research (NIHR) Nottingham Biomedical Research Centre, Nottingham NG7 2RD, UK
10
Department of Pharmacology and Toxicology, Medical University of Sofia, 1000 Sofia, Bulgaria
11
Department of Nutrition and Physiology, University of Navarra, 31008 Pamplona, Spain
12
Precision Nutrition and Cardiometabolic Health Program, IMDEA-Food Institute (Madrid Institute for Advanced Studies), CEI UAM + CSIC, 28049 Madrid, Spain
13
Centro de Investigacion Biomedica en Red Area de Fisiologia de la Obesidad y la Nutricion (CIBEROBN), 28029 Madrid, Spain
14
IdisNA Instituto for Health Research, 31008 Pamplona, Spain
15
Charles Perkins Centre, School of Life and Environmental Sciences, University of Sydney, Camperdown, Sydney 2006, Australia
16
Steno Diabetes Center Copenhagen, 2820 Gentofte, Denmark
*
Author to whom correspondence should be addressed.
Nutrients 2021, 13(11), 3916; https://doi.org/10.3390/nu13113916
Submission received: 27 September 2021 / Revised: 27 October 2021 / Accepted: 31 October 2021 / Published: 1 November 2021

Abstract

:
Plant-based diets are recommended by dietary guidelines. This secondary analysis aimed to assess longitudinal associations of an overall plant-based diet and specific plant foods with weight-loss maintenance and cardiometabolic risk factors. Longitudinal data on 710 participants (aged 26–70 years) with overweight or obesity and pre-diabetes from the 3-year weight-loss maintenance phase of the PREVIEW intervention were analyzed. Adherence to an overall plant-based diet was evaluated using a novel plant-based diet index, where all plant-based foods received positive scores and all animal-based foods received negative scores. After adjustment for potential confounders, linear mixed models with repeated measures showed that the plant-based diet index was inversely associated with weight regain, but not with cardiometabolic risk factors. Nut intake was inversely associated with regain of weight and fat mass and increments in total cholesterol and LDL cholesterol. Fruit intake was inversely associated with increments in diastolic blood pressure, total cholesterol, and LDL cholesterol. Vegetable intake was inversely associated with an increment in diastolic blood pressure and triglycerides and was positively associated with an increase in HDL cholesterol. All reported associations with cardiometabolic risk factors were independent of weight change. Long-term consumption of nuts, fruits, and vegetables may be beneficial for weight management and cardiometabolic health, whereas an overall plant-based diet may improve weight management only.

1. Introduction

Cardiovascular diseases (CVDs) have placed a substantial healthcare and economic burden on governments and individuals [1]. Obesity is a major risk factor for CVDs [1]. Plant-based diets (PBDs) recommended by European food-based dietary guidelines [2] and the EAT-Lancet Commission [3] may be beneficial in terms of environmental sustainability, particularly if plant-based proteins replace animal-based foods such as red meat [2]. PBDs may also assist in weight management and prevention of CVDs [4,5,6,7,8,9] and improve multiple cardiometabolic risk factors [5].
Many previous randomized controlled trials (RCTs) and observational studies have explored the association of a vegetarian or a PBD with weight loss (WL) [8] or weight gain [6] or BMI [5]. Some prospective cohort studies have explored the association of PBDs with risk of CVDs [10], whereas previous evidence on PBDs and cardiometabolic risk factors was mainly based on cross-sectional studies and small-scale, short- or medium-term RCTs [11,12,13,14,15,16,17]. Long-term data on adherence to a PBD and weight regain and cardiometabolic risk factors during weight-loss maintenance (WLM), particularly after diet-induced rapid WL, are largely lacking.
Specific components of a PBD may also have an important role to play in weight management and cardiometabolic health. Certain plant foods such as whole grains, vegetables, fruits, legumes, and nuts are rich in vitamins, minerals, antioxidants, unsaturated fatty acids, and dietary fiber [7]. These plant foods are considered healthy, with improved health outcomes [7]. Other plant foods such as sugar-sweetened beverages, cakes, and cookies have lower nutrient density and higher energy density [7]. These plant foods are regarded as unhealthy and may have negative effects on health [7]. To our knowledge, few long-term studies have to date explored consumption of plant foods and weight regain and cardiometabolic risk factors during WLM.
Therefore, the objective of the current study was to assess the longitudinal associations of adherence to an overall PBD and specific plant foods with WLM and cardiometabolic risk factors in adults with high risk of type 2 diabetes (T2D). Data from the PREVIEW study, a 3-year randomized trial aimed at examining the effects of diet and physical activity (PA) interventions on T2D prevention, were used. We hypothesized that consumption of an overall PBD and healthy plant foods would be inversely associated with weight regain and cardiometabolic risk factors.

2. Materials and Methods
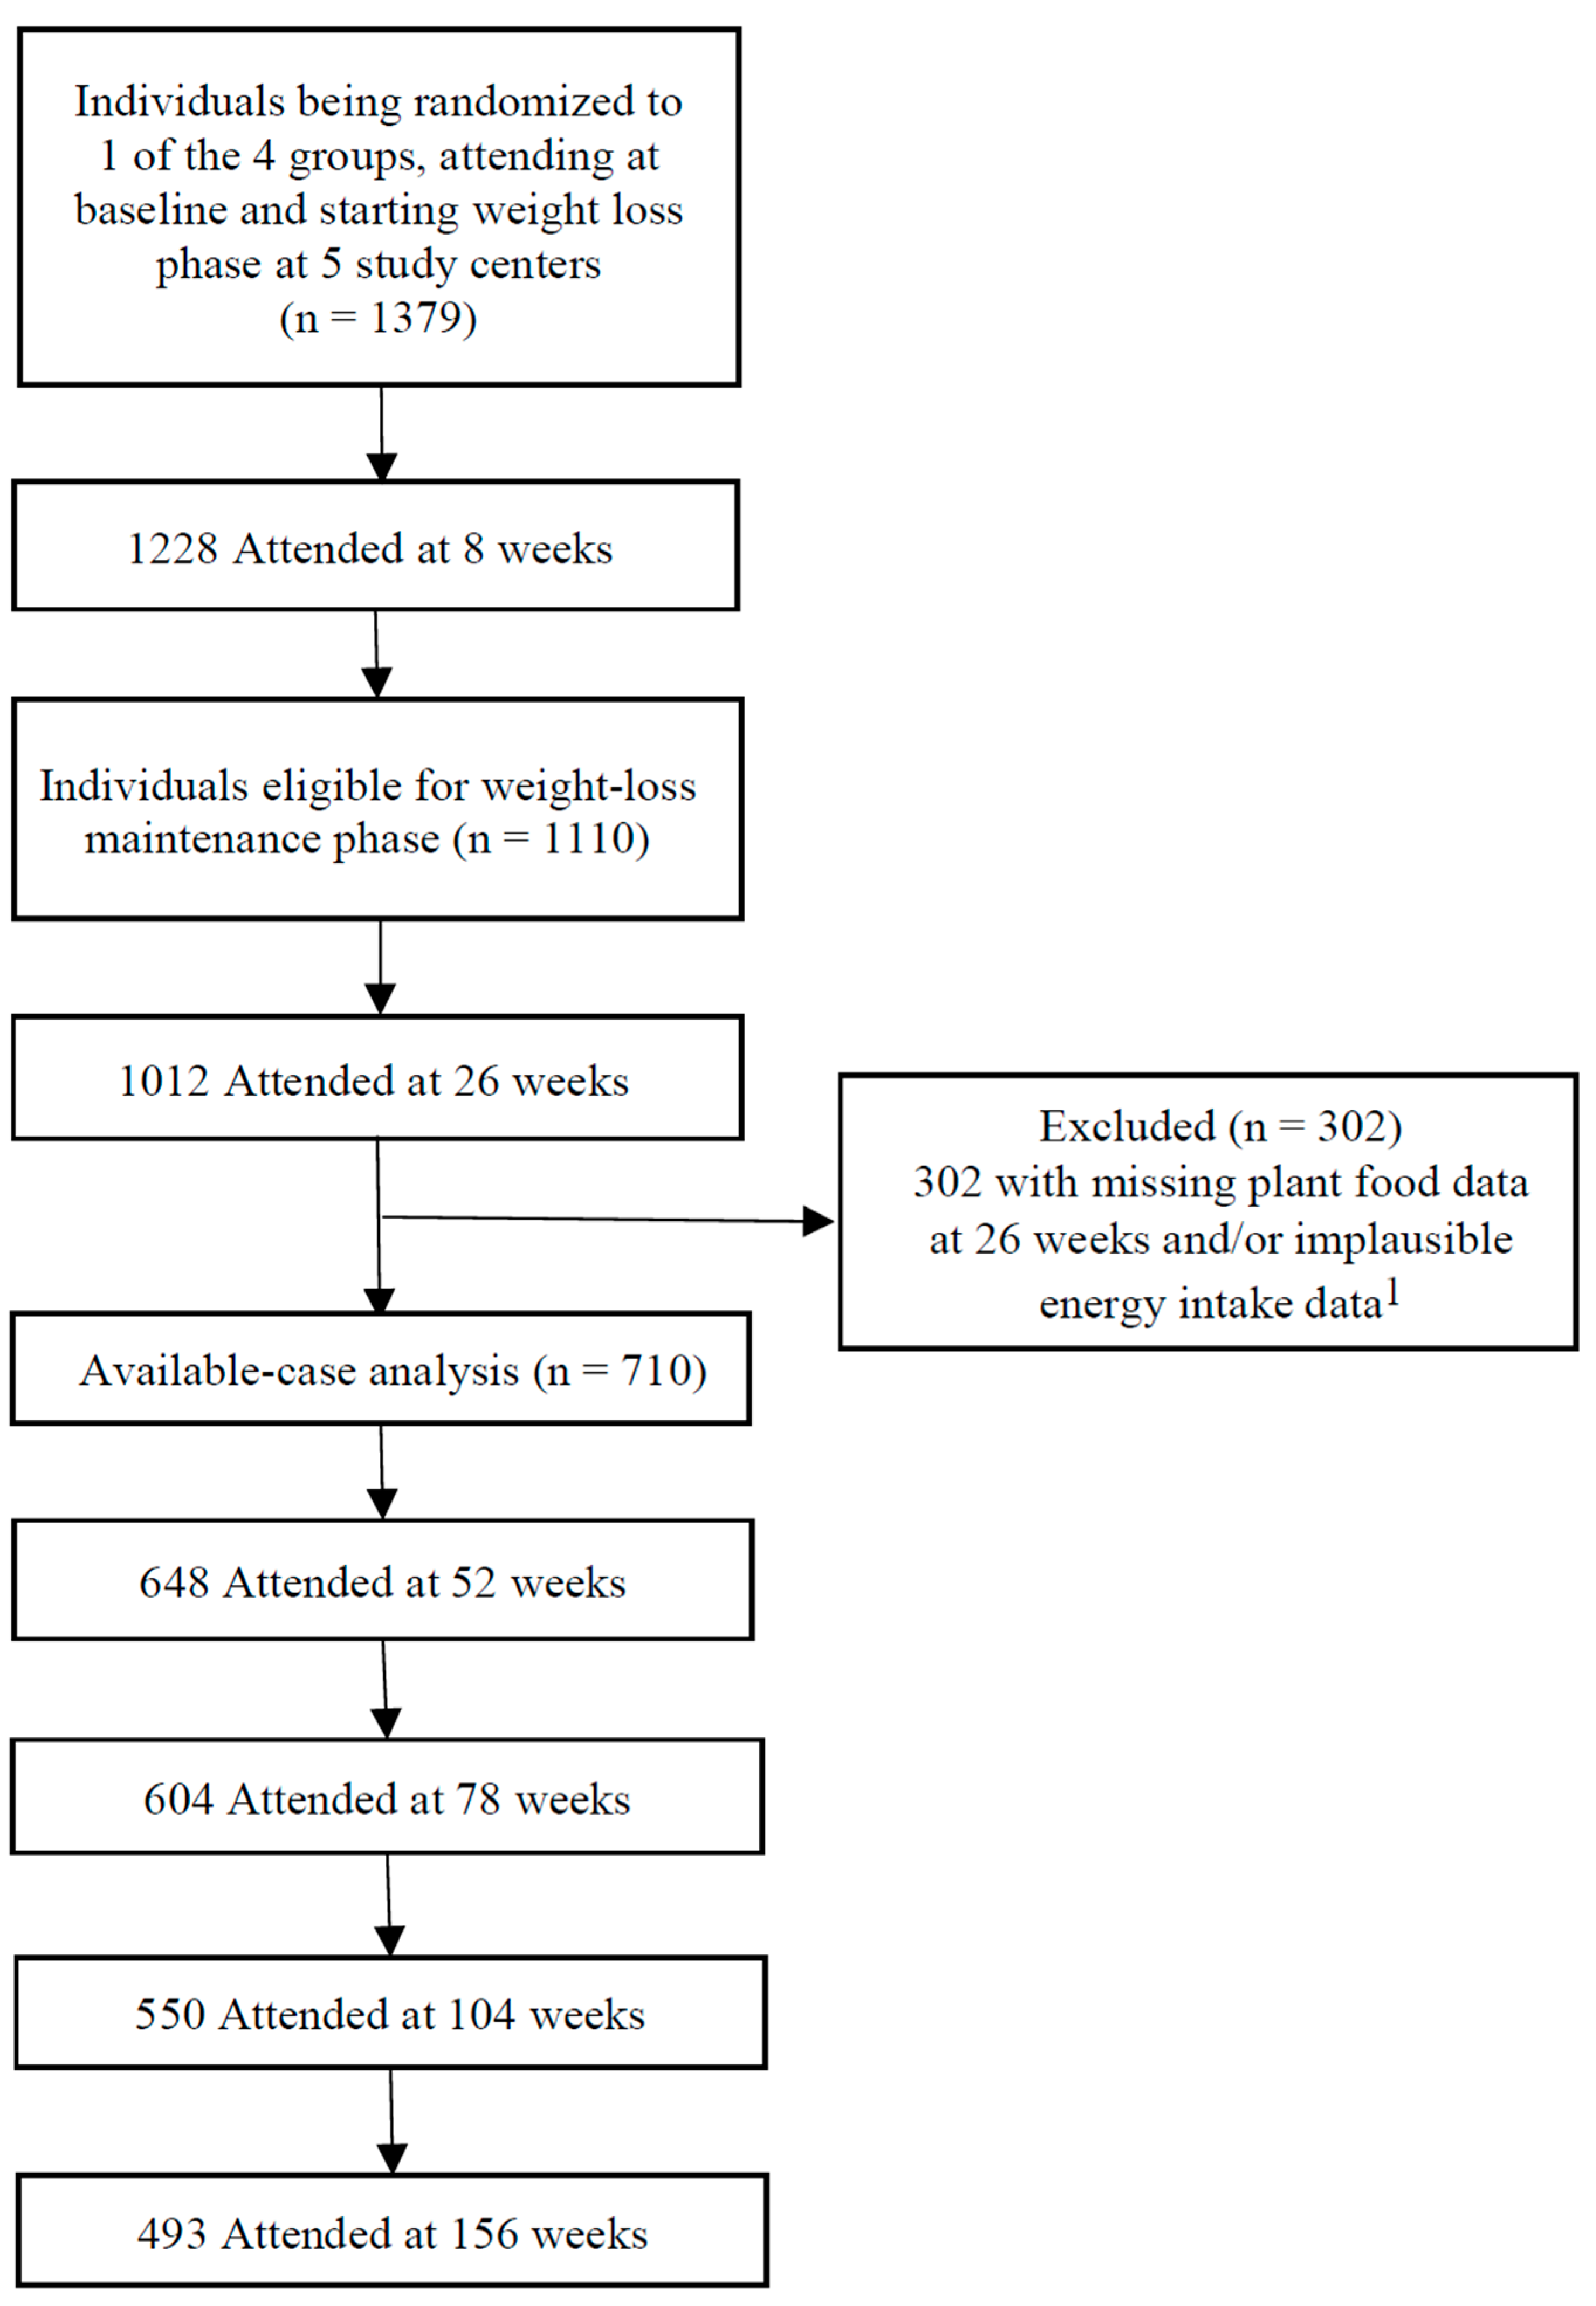
2.1. Study Design

The PREVIEW study was a 3-year, large-scale, 2 × 2 factorial randomized trial. It was conducted at 8 study centers including Denmark, Finland, The Netherlands, the UK, Spain, Bulgaria, New Zealand, and Australia. The detailed information has been described elsewhere [18], and the main results have been published [19,20]. Briefly, the PREVIEW study was designed to examine the effect of a high protein-low glycemic index (GI) diet vs a moderate protein–moderate GI diet (25 E% protein and GI < 50 vs. 15 E% protein and GI > 56) combined with 2 PA programs (high intensity or moderate intensity) on T2D incidence in adults with overweight or obesity and pre-diabetes. The primary endpoint was T2D incidence. The participants underwent an 8-week weight loss (WL) period, and during this period, they were instructed to consume a low energy total meal replacement diet containing 3.4 MJ·day−1. After this period, participants started a 148-week WLM period and received 1 of the 4 diet–PA interventions. The intervention diets were consumed ad libitum during WLM, and the participants were given examples of eating plans, cooking books, and food-exchange lists. Both diet interventions included the recommendation of whole grain cereals. A behavioral modification program (PREMIT) and 17 group visits were conducted throughout the intervention to improve dietary and PA compliance [21]. Dietary compliance was evaluated using 4-day food records. In addition, urinary nitrogen or urea analyses were done on 24 h urine samples to assess compliance to the diets, i.e., protein intake. PA compliance was evaluated using 7-day accelerometry.
The PREVIEW study was designed and conducted in line with the Declaration of Helsinki and its latest amendments. The protocol of the PREVIEW study was reviewed and approved by the following Human Ethics Committees at each intervention center. Denmark: The Research Ethics Committees of the Capital Region, ethical approval code: H-1-2013-052; Finland: Coordinating Ethical Committee of HUS (Helsinki and Uusimaa Hospital District), ethical approval code: HUS/1733/2017; the UK: UK National Research Ethics Service (NRES) and East Midlands (Leicester) Ethics Committee, ethical approval code: 13/EM/0259; the Netherlands: Medical Ethics Committee of the Maastricht University Medical Centre, ethical approval code: NL43054.068.13/METC 13-3-008; Spain: Research Ethics Committee of the University of Navarra, ethical approval code: 71/2013; Bulgaria: Commission on Ethics in Scientific Research with the Medical University-Sofia (KENIMUS), ethical approval code: 4303/13.06.2014; Australia: The University of Sydney, Human Research Ethics Committee (HREC), ethical approval code: 2013/535; and New Zealand: Health and Disability Ethics Committees (HDEC), ethical approval code: X14-0408.
The current analysis was an exploratory analysis based on the secondary outcomes of the PREVIEW study. Given that only 5 study centers (Finland, the UK, Bulgaria, New Zealand, and Australia) provided food intake data in g·day−1 or serving size·day−1 and full plant food categories, only data from the WLM phase (8–156 weeks) from participants at these 5 study centers were included.

2.2. Study Population

Participants aged 25–70 years with overweight (BMI 25–29.9 kg·m−2) or obesity (BMI ≥ 30 kg·m−2) and pre-diabetes were recruited between June 2013 and April 2015. Pre-diabetes was defined as impaired FPG (FPG of 5.6–6.9 mmol·L−1) or impaired glucose tolerance (2-h plasma glucose of 7.8–11.0 mmol·L−1 and FPG < 7.0 mmol·L1) after an oral glucose tolerance test (oral ingestion of 75 g of glucose) [22]. Participants who were diagnosed with diabetes (T2D or type 1 diabetes) prior to the study or who were non-compliant with the intervention were excluded. Eligible participants were enrolled, underwent randomization by gender and age, and started WL. Participants who lost ≥8% of initial BW after the WL phase were eligible to continue, entering the 148-week WLM period. In the current analysis, we included those with available plant food data (and full plant food categories) at 26 weeks and plausible energy intake (2520–14700 kJ·day−1 for women and 3360–17640 kJ·day−1 for men) [23]. All participants provided written informed consent.

2.3. Assessment of Dietary Intake and Adherence to an Overall Plant-Based Diet

Dietary intake was estimated using self-administered 4-day food records on 4 consecutive days, including 3 weekdays and 1 weekend day. The 4-day food records were collected at 26, 52, 104, and 156 weeks. Participants were encouraged to record their diet by weighing foods and drinks using a weigh scale or household measures in the absence of a scale. Standard household measures such as cup, spoon, glass, and portions were explained. Additionally, participants were asked to describe the food in detail (e.g., type of foods, cooking methods, and ingredients). Food records were entered into the national nutrient analysis software, i.e., AivoDiet (Finland), Nutritics (the UK), Nutrition Calculation (Bulgaria), and Foodworks (Australia and New Zealand). Food intake at each time point was calculated as the average of 4 days and expressed in g·day−1 or serving·day−1. Serving sizes were converted to grams of food [23].
We created 11 food groups according to nutrients and culinary similarities within the larger categories of plant foods and animal-based foods (Table 1). Plant food groups included total grains and potatoes, legumes, nuts, vegetables, and fruits. Animal-based food groups included dairy products, eggs, red meat, processed meat, poultry and fish/seafood. Adherence to an overall PBD was evaluated using a plant-based diet index (PDI), modified from Satija et al. [24]. As conversion from serving·day−1 to g·day−1 of high-sugar products may introduce bias, they were not included in the PDI. In addition, in our dietary data, there was not a specific potato group. Potatoes and potato products were considered as 1 group. For the PDI calculation, food groups were divided into quintiles of consumption (g·day−1) and given positive (between 1 and 5) or negative (between –5 and –1) scores. For positive scores, participants in the highest quintile were assigned a score of 5 and those in the lowest quintile were assigned a score of 1. All plant food groups were given positive scores and all animal food groups were given negative scores. Scores based on the 11 food groups were summed to obtain the index. Higher PDI reflected lower consumption of animal-based foods.

2.4. Assessment of Outcomes

Outcomes including body weight (BW), fat mass (FM), waist circumference (WC), fasting plasma glucose (FPG), fasting insulin, glycosylated hemoglobin A1c (HbA1c), homeostatic model assessment of insulin resistance (HOMA-IR), fasting triglycerides, total cholesterol, high-density lipoprotein cholesterol (HDL cholesterol), low-density lipoprotein cholesterol (LDL cholesterol), systolic blood pressure (SBP), and diastolic blood pressure (DBP) were measured at 8, 26, 52, 104, and 156 weeks. BW was measured in the fasting state (>10 h), with participants wearing light clothing or underwear. FM was determined by dual energy X-ray absorptiometry in the UK, Australia, and New Zealand and by bioelectrical impedance in Finland and Bulgaria. Blood samples were drawn from fasting participants’ antecubital veins. FPG, HbA1c, fasting insulin, fasting triglycerides, total cholesterol, HDL cholesterol, and LDL cholesterol were determined at the central laboratory of the Finnish Institute for Health and Welfare, Helsinki, Finland. HOMA-IR was calculated with the formula: fasting insulin (mU·L−1) × FPG (mmol·L−1)/22.5 [25]. SBP and DBP were determined using a validated automatic device on participants’ right arm after 5–10 min in a resting position.

2.5. Assessment of Covariates

Self-reported questionnaires were used to collect sociodemographic information including age, sex, ethnicity, and smoking status at baseline (0 weeks). PA was determined using 7-day accelerometry (ActiSleep+, ActiGraph LLC, Pensacola, FL, USA) and was expressed as counts·min−1, i.e., mean activity counts during valid wear time.

2.6. Statistical Analysis
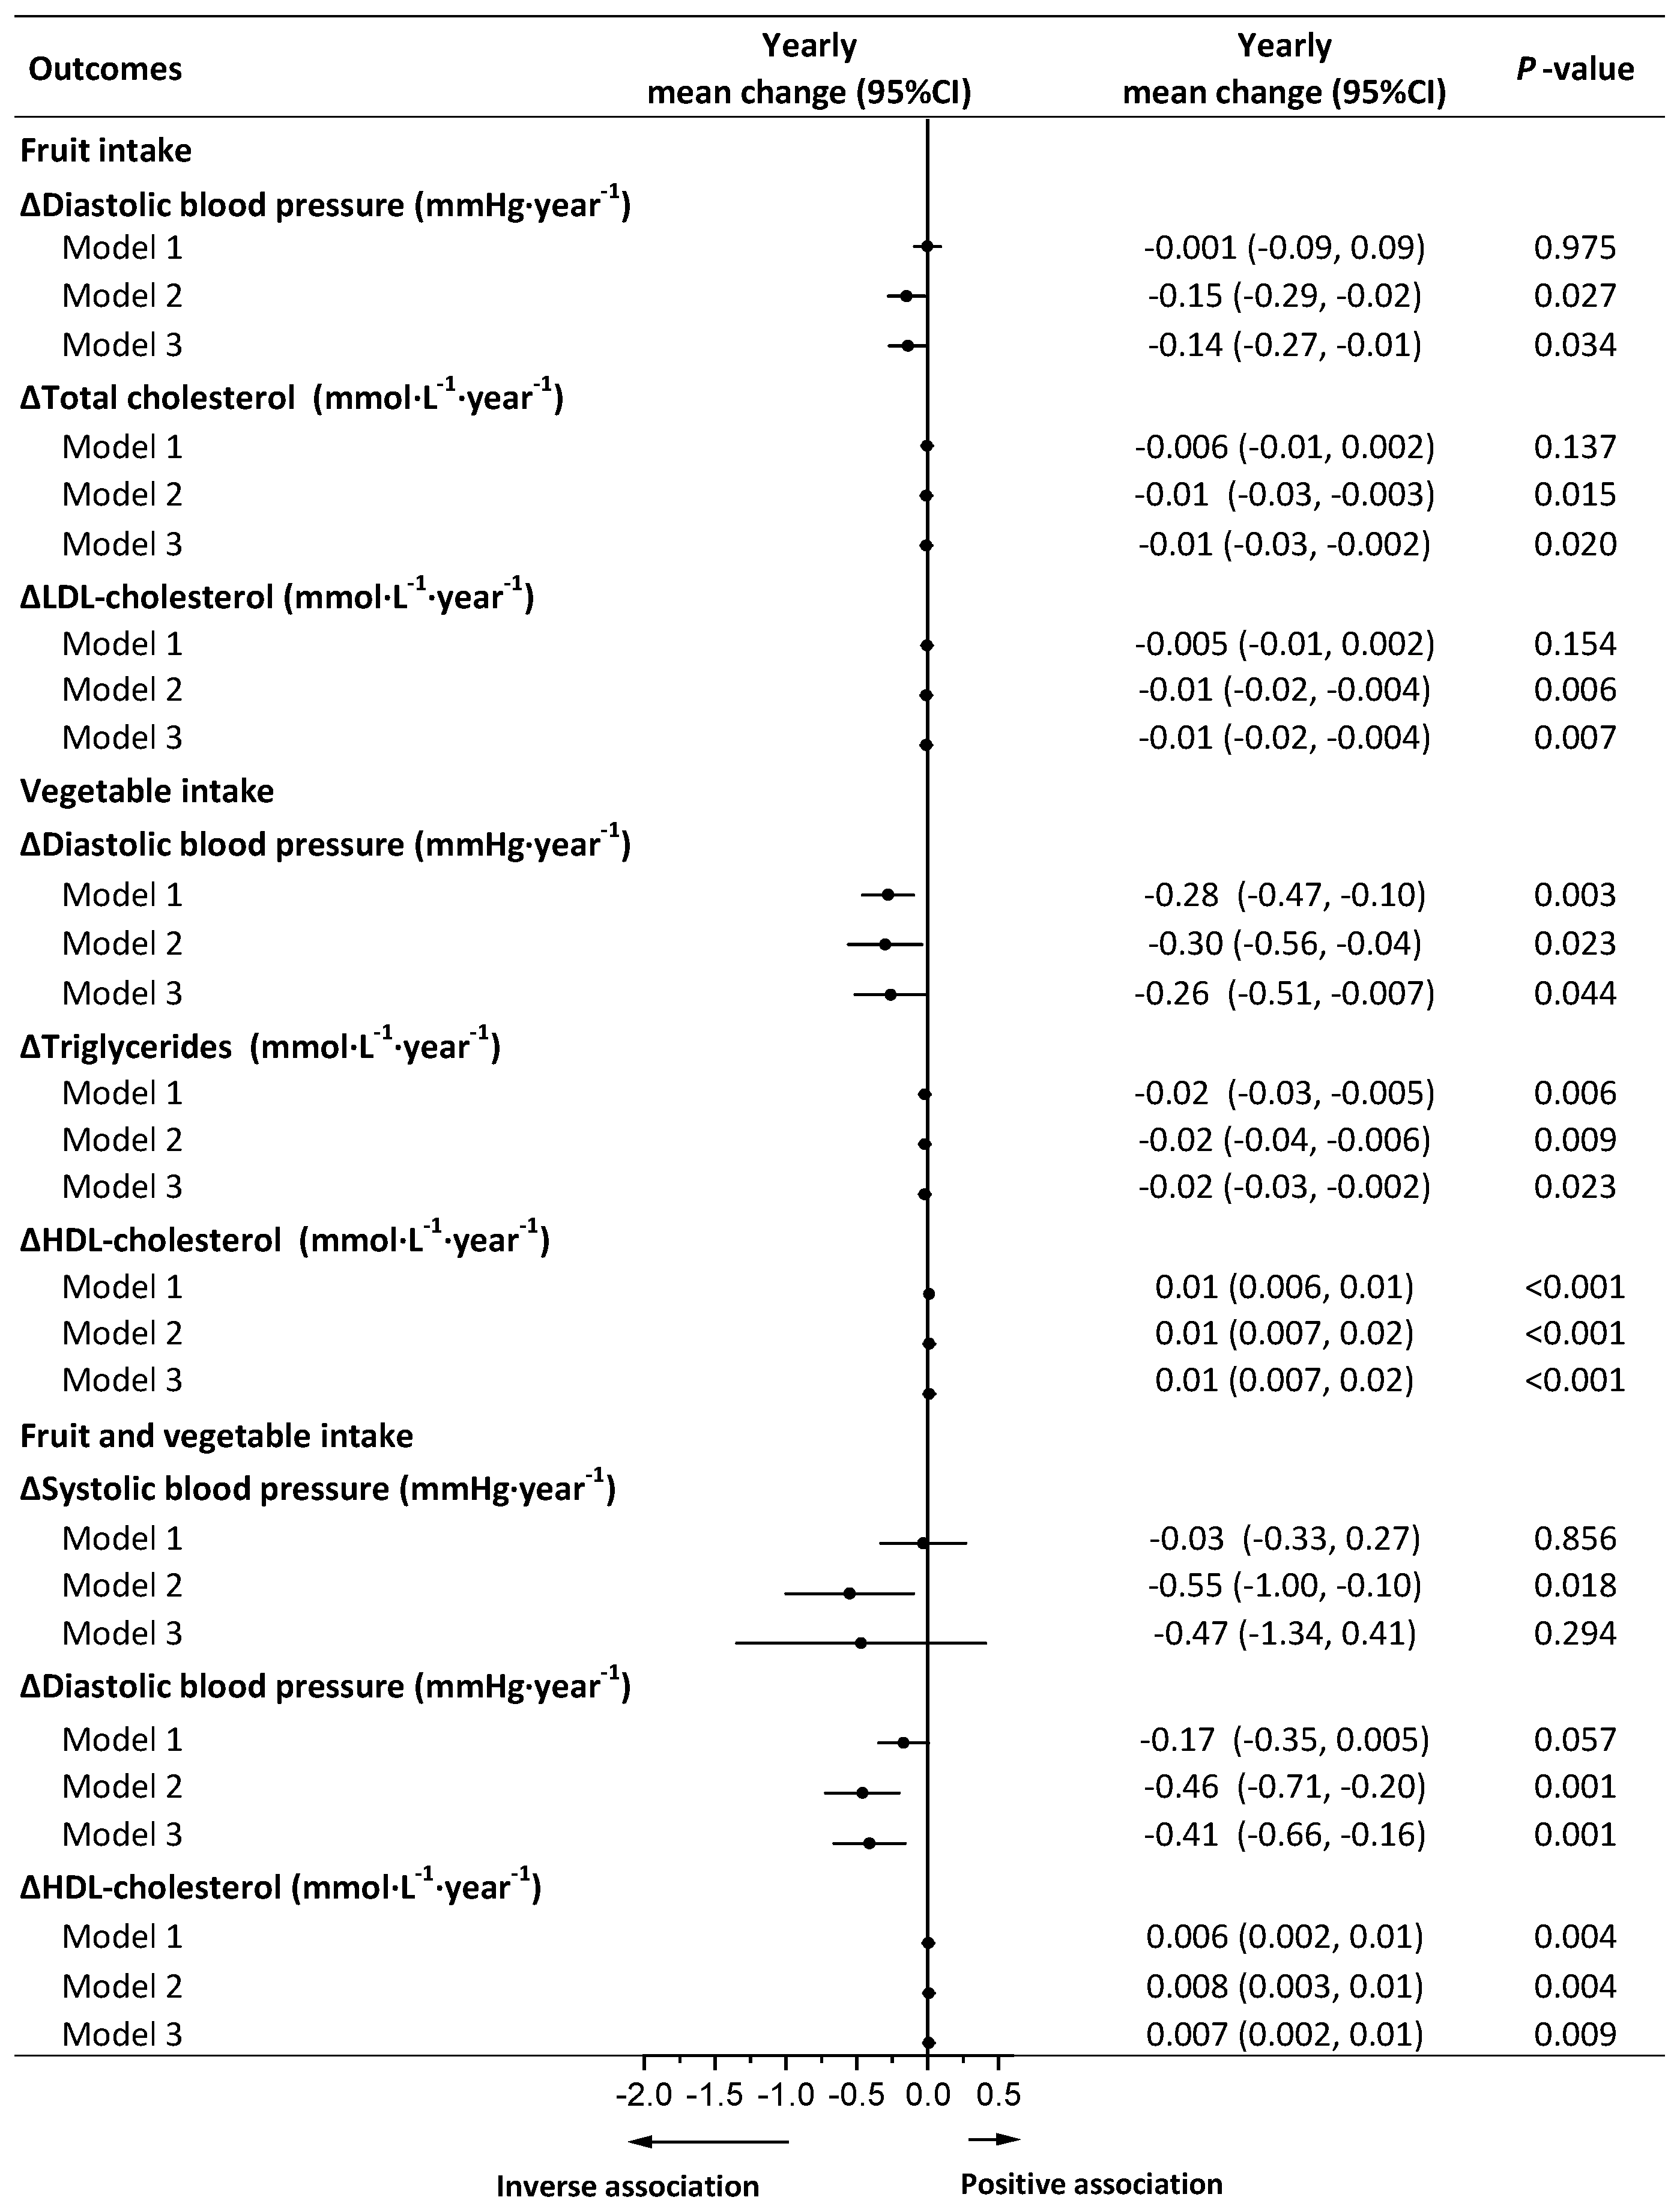
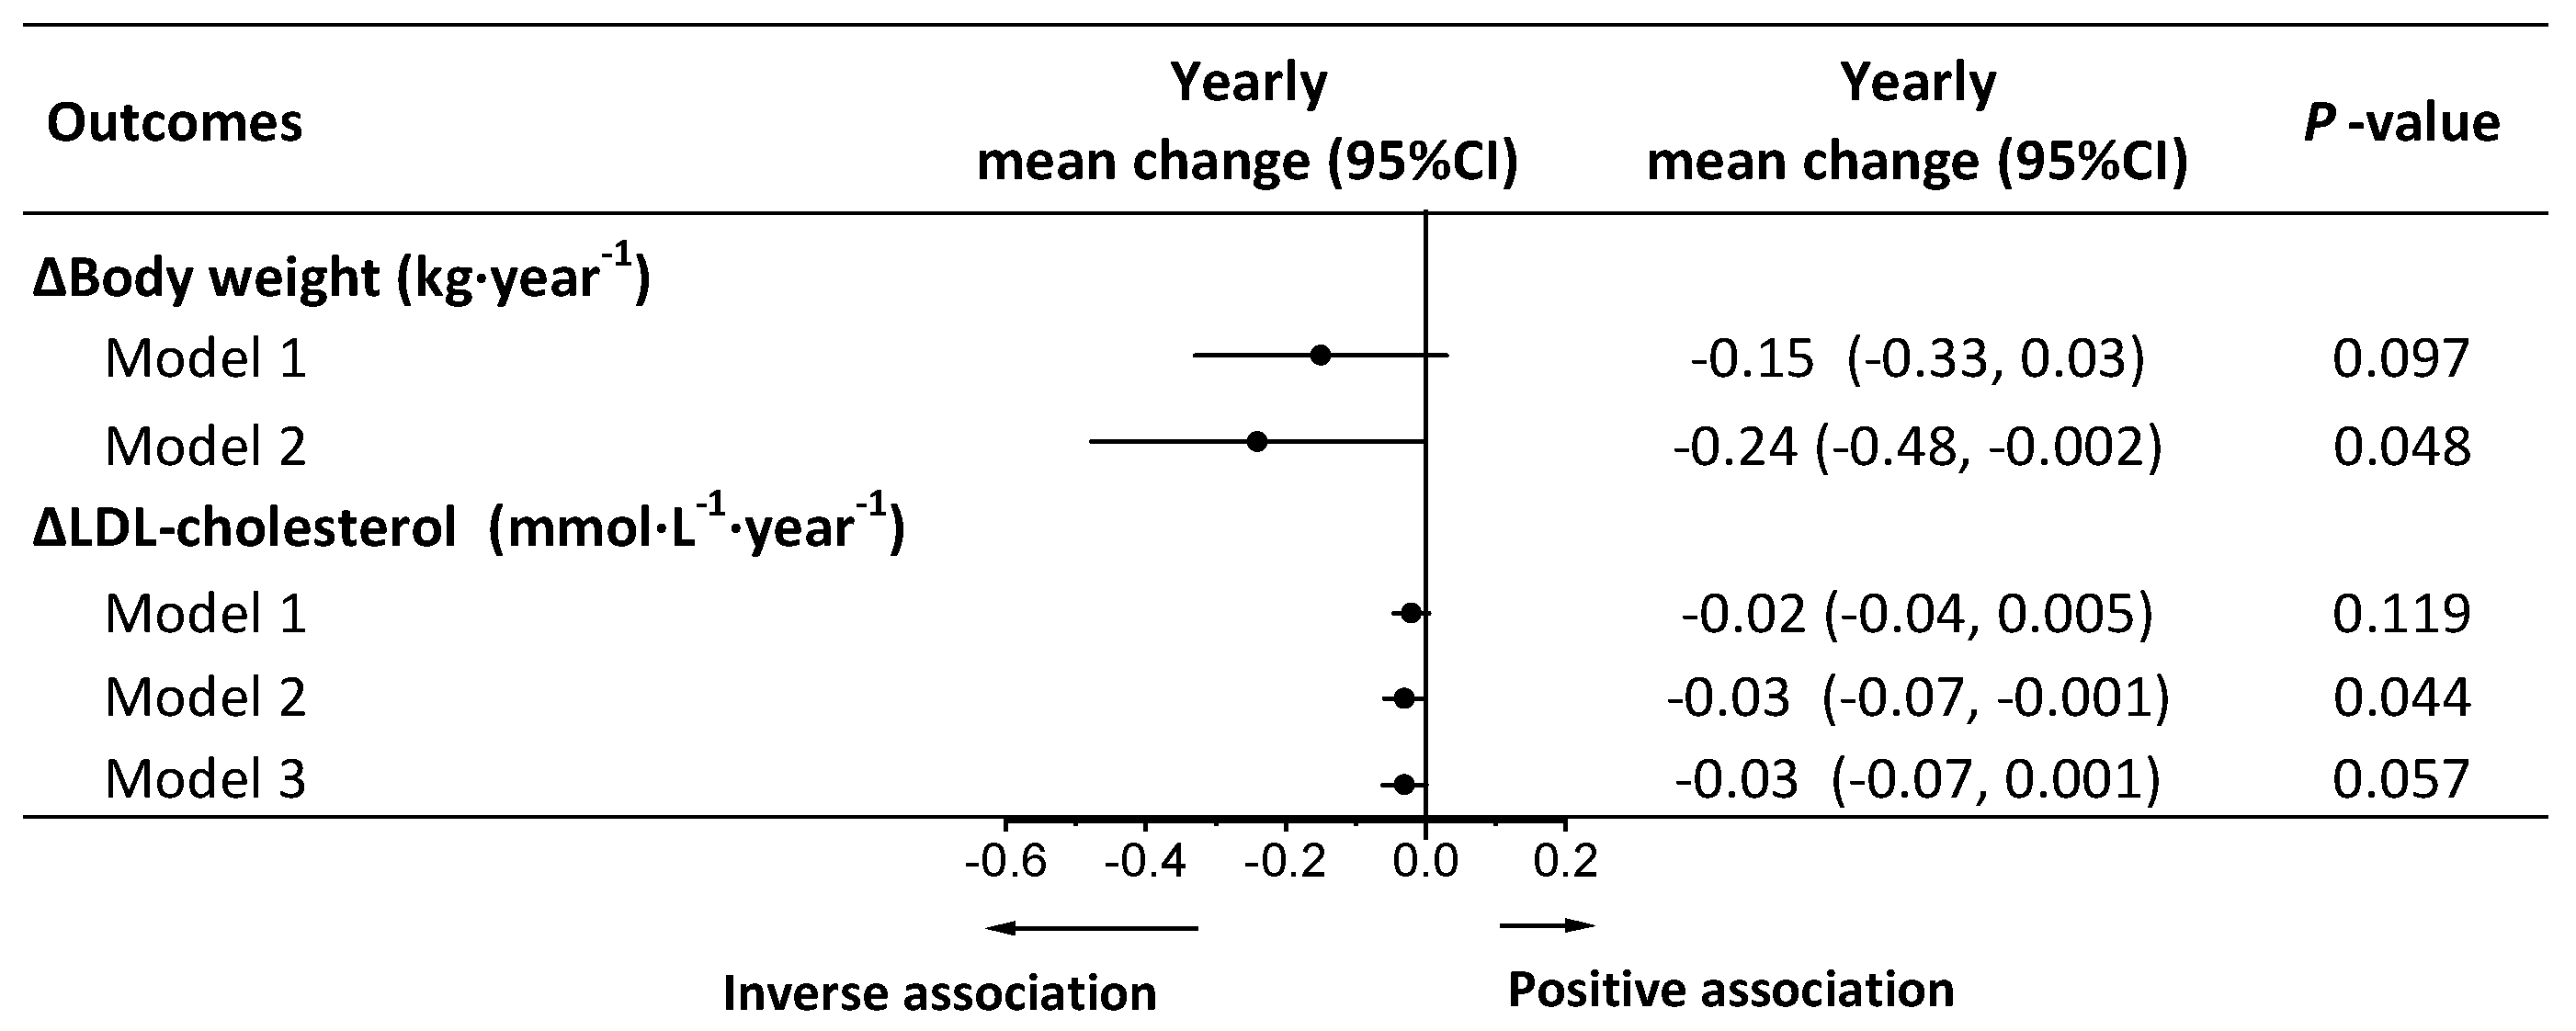
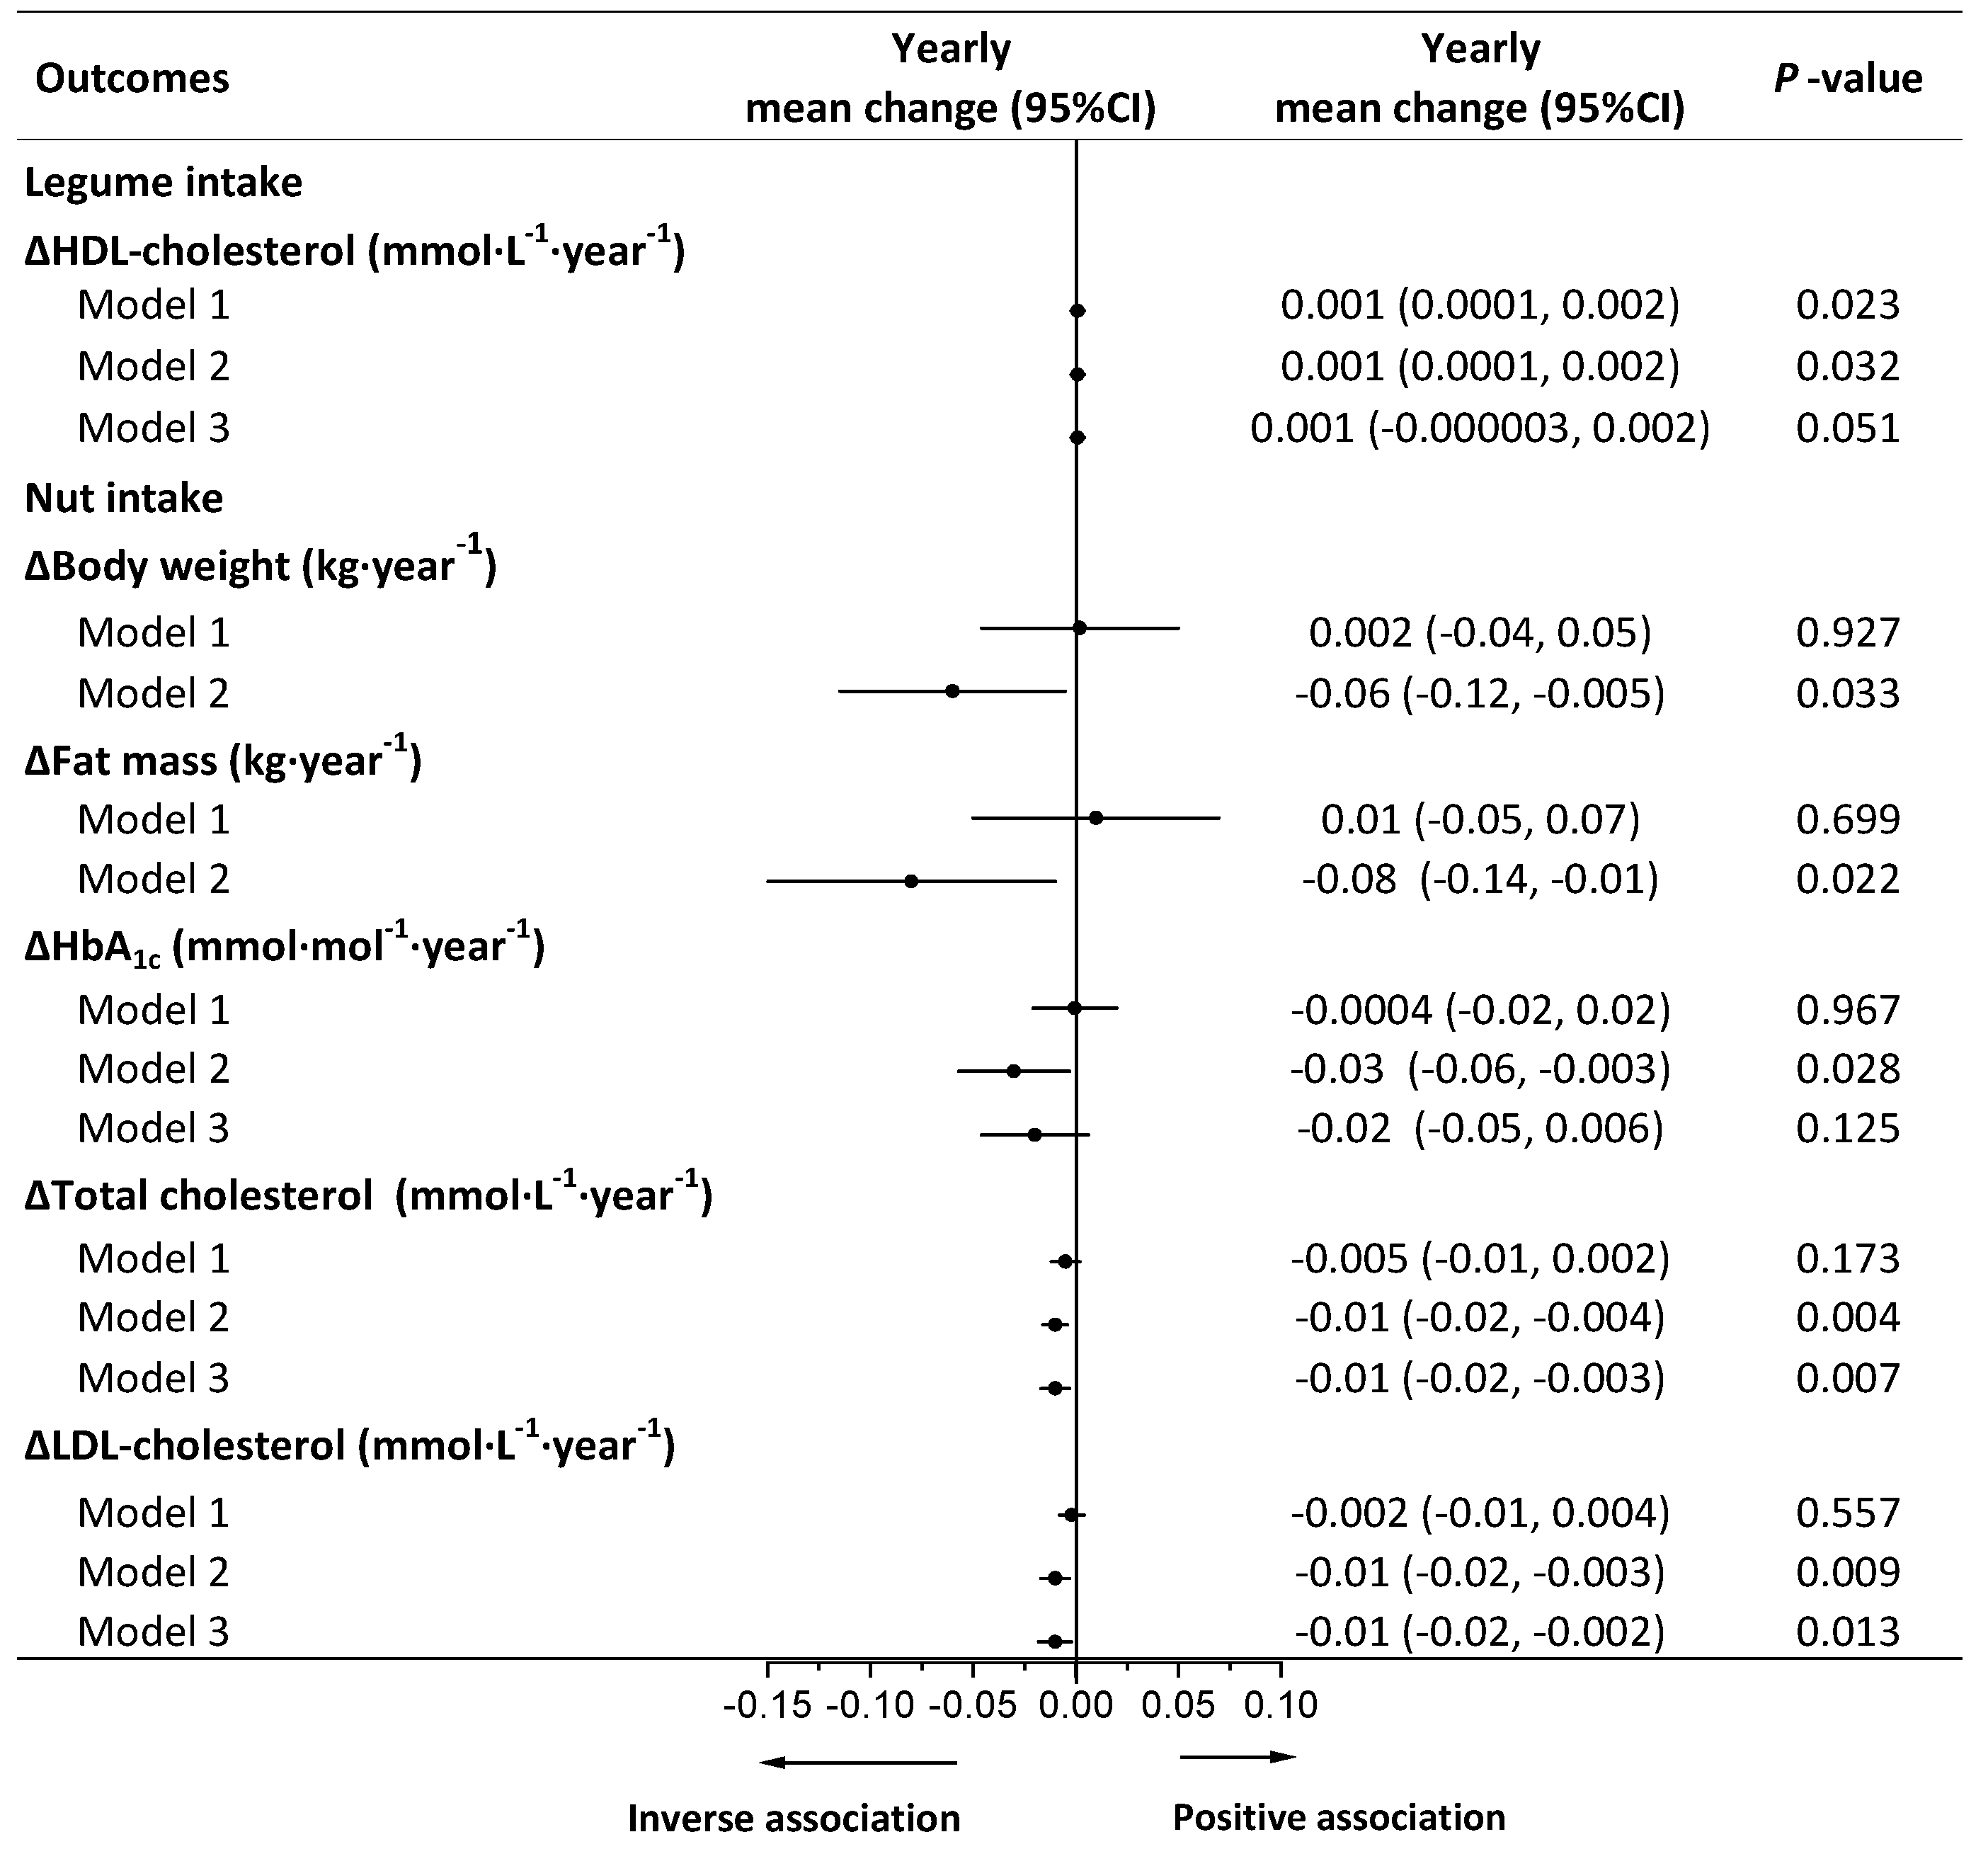
For descriptive statistics, the normality of continuous variables was assessed by p–p plots and histograms. Approximately normally distributed variables are presented as means ± standard deviation (SD) and non-normal variables as medians (25th, 75th percentiles). Categorical variables are presented as absolute values and frequencies.
We conducted an available-case analysis and merged all participants into 1 group to assess longitudinal associations of adherence to an overall PBD (evaluated by PDI) and plant food intake with yearly changes in outcomes including BW and cardiometabolic risk factors, using adjusted linear mixed models with repeated measures. Model 1 was adjusted for fixed factors including age (continuous), sex (categorical; women and men), ethnicity (categorical; Caucasian, Asian, Black, Arabic, or other), intervention group (categorical), BMI at 8 weeks, weight or cardiometabolic risk factors at 8 weeks (continuous), and time (categorical) and random factors including study center (categorical) and participant-ID. For adherence to a PBD, model 2 was adjusted for covariates in model 1 plus fixed factors including time-varying PA (continuous), energy intake (kJ·day−1; continuous), and alcohol intake (g·day−1; continuous). For specific plant food intake, model 2 was additionally adjusted for consumption of animal-based foods (g·day−1; continuous) and other plant foods (g·day−1; continuous) as fixed factors. As dietary sodium intake may be associated with blood pressure [26], model 2 was additionally adjusted for sodium intake (g·day−1; continuous) when DBP or SBP was added as a dependent variable. Model 3 was adjusted for covariates in model 2 plus time-varying yearly weight change (continuous) as a fixed factor. Yearly changes were obtained by dividing changes in outcomes from 8 to 26, 52, 104, and 156 weeks by changes in years. To best represent the long-term dietary and PA patterns of participants during WLM, a cumulative average method [24,27] based on all available measurements of self-reported diet and device-measured PA was used. In this calculation, the 26-week diet was related to yearly changes in weight and cardiometabolic risk factors from 8 to 26 weeks; the average of the 26- and 52-week diets was related to yearly changes in weight and cardiometabolic risk factors from 8 to 52 weeks; the average of the 26-, 52-, and 104-week diets was related to yearly changes in weight and cardiometabolic risk factors from 8 to 104 weeks; the average of the 26-, 52-,104-, and 156-week diets was related to yearly changes in weight and cardiometabolic risk factors from 8 to 156 weeks. Cumulative average PA was calculated using the same method. Detailed information is included in Supplementary Materials Table S1. A sensitivity analysis was conducted by adding smoking status (categorical; daily, less than weekly, or no smoking) at 0 weeks in the abovementioned models. As the results were similar, they are not shown.
The associations of adherence to PBD with outcomes of interest are expressed as changes in outcomes per year induced by each 1 SD increment in PDI. To clarify the associations of PDI with BW, we also divided the participants into 2 groups, i.e., higher (n = 344 at 8 weeks) or lower (n = 344 at 8 weeks) adherence to PBD, at each time point separately according to PDI. We examined the difference in change in BW between the 2 groups using linear mixed models adjusted for the covariates in model 2. As the 2 groups were defined afresh at each time point, we compared the 2 groups at each time point regardless of the significance of time and group interaction. The associations of plant foods with outcomes of interest are expressed as changes in outcomes per year associated with each 1-serving size increment in plant food intake. The serving sizes were defined as follows: 75 g·day−1 for total grains and potatoes, 10 g·day−1 for legumes, 5 g·day−1 for nuts, 100 g·day−1 for vegetables, 50 g·day−1 for fruits, and 150 g·day−1 for combined consumption of vegetables and fruit—all based on medians and 25th and 75th percentiles of plant food intakes from dietary records over 3 years.
Missing data were not handled with multiple imputation because this method did not increase precision [28,29]. Data were analyzed using IBM SPSS v26.0 (Chicago, IL, USA). All P values were based on 2-sided tests and P < 0.05 was considered significant.

3. Results

In the present available-case analysis, we included 710 participants and 2144–2336 observations of outcomes from available plant food data and full plant food categories at 26 weeks and plausible energy intakes (Figure 1). Of these, 493 participants completed the study. Participants who withdrew during WLM did so for personal reasons, including time constraints, moving away, and illness. The median age of participants (69% women) at the beginning of WLM was 57 years (range: 26–70 years) (Table 2). As there were no poultry and processed meat data from participants in Bulgaria, PDI analysis was based on 688 participants with both complete plant food and animal food data.
Adherence to an overall PBD was inversely associated with weight regain and increment in LDL cholesterol in model 2, whereas after adjustment for weight change, the association of PBD with LDL cholesterol was lost (Figure 2). No associations were observed between PBD and other cardiometabolic risk factors in models 2 and 3 (Table S2). In all participants (n = 688), compared with those with lower adherence to PBD, participants with higher adherence to PBD had less weight regain at 52 and 104 weeks (Figure S1A). In completers (n = 493), compared with those with lower adherence to PBD, participants with higher adherence to PBD had less weight regain at 26, 52, and 104 weeks (Figure S1B).
Total grains and potatoes were not associated with any health outcomes in models 2 and 3 (Table S3). Legumes were positively associated with an increase in HDL cholesterol, whereas after adjustment for weight change, the association was lost (Figure 3). No associations were observed between legumes and weight regain or other cardiometabolic risk factors in models 2 and 3 (Table S4). Nuts were inversely associated with increments in BW, FM, HbA1c, total cholesterol, and LDL cholesterol in model 2. After adjustment for weight change, the association of nuts with HbA1c was lost (Figure 3). No associations were observed between nuts and other cardiometabolic risk factors in models 2 and 3 (Table S5).
In the available analysis, fruits were inversely associated with increments in DBP, total cholesterol, and LDL cholesterol after adjustment for weight change in model 3 (Figure 4). No associations were observed between fruits and weight regain or other cardiometabolic risk factors in models 2 and 3 (Table S6). Vegetables were inversely associated with DBP and triglycerides and were positively associated with HDL cholesterol, independent of weight change in model 3 (Figure 4). No associations were observed between vegetables and weight regain or other cardiometabolic risk factors in models 2 and 3 (Table S7). Combined vegetable and fruit intake was inversely associated with an increment in SBP, and DBP and was positively associated with an increase in HDL cholesterol in model 2, whereas after adjustment for weight change, only the associations of DBP and HDL cholesterol with combined vegetable and fruit intake remained significant in model 3 (Figure 4 and Table S8).

4. Discussion

In this 3-year, multi-center study, we examined the longitudinal associations of an overall PBD and specific plant foods with WLM and cardiometabolic risk factors in individuals with a high risk of developing T2D. We found that adherence to an overall PBD diet improved weight management. Consumption of nuts, fruits, and vegetables and fruits and vegetables was inversely associated with weight regain or cardiometabolic risk factors. Importantly, the reported associations with cardiometabolic risk factors were independent of weight change.
In the present analysis, we found that an overall PBD was inversely associated with weight regain, which is in agreement with findings from meta-analyses of RCTs [5,8,30] and prospective studies. Satija et al. [31] and Choi et al. [6] found inverse associations between adherence to a PBD and long-term weight gain. We did not find any associations between an overall PBD and cardiometabolic risk factors including glycemic markers, lipids, and blood pressure, after adjustment for weight change. On the contrary, Satija et al. [24,27,31] and Chen et al. [32] showed that an overall PDI was associated with smaller weight change or lower risk of T2D and coronary heart disease in three US prospective cohort studies. In addition, Glenn et al. [33] found that a plant-based Portfolio Diet was associated with a reduced CVD risk in the Women’s Health Initiative Prospective Cohort.
The mixed findings may be partly explained by differences in assessment of adherence to a PBD. In observational studies, compliance to a PBD was commonly assessed by dietary indices such as PDI (including 18 food groups) [24,27] and A Priori Diet Quality Score (including 46 food groups) [6]. Specifically, the PDI created by Satija et al. [27] included vegetable oils, tea, and coffee (as healthy plant foods) and sugar-sweetened beverages and sweets and desserts (as unhealthy plant foods). However, in our PDI version, we did not include these food groups. In addition, some prospective studies showed that compared with overall PDI, healthy PDI emphasizing whole grains, fruits, vegetables, nuts, legumes, and vegetable oils showed stronger associations with smaller weight change and lower risk of T2D and coronary heart disease [24,27,31]. Furthermore, we did not calculate healthy PDI by giving positive scores to whole grains, vegetable oils, and tea and coffee and giving negative scores to refined grains, sugar sweetened beverages, and sweets and desserts. Compared with healthy PBDs or vegetarian diets in the abovementioned studies, our PDI captured a “less healthy” diet. PBDs rich in healthy components have higher dietary fiber and micronutrients as well as lower energy, GI, and glycemic load [27]. In a previous secondary analysis of the PREVIEW study, we found positive associations between GI, glycemic load, and weight regain during WLM [34].
In terms of specific components of PBDs, we found that nuts were linked with improved weight management and cardiometabolic risk factors during WLM. Similar to our findings, meta-analyses of prospective studies and RCTs also showed that nuts improved weight management [35,36,37] and cardiometabolic risk factors including HOMA-IR and fasting insulin [38]. In a study based on a cross-sectional nutrition survey, compared with non-nut consumers, nut consumers had lower BW, BMI, and WC, whereas there were no differences in cardiometabolic risk factors including blood pressure, total cholesterol, HDL cholesterol, and HbA1c [13]. The results, however, were limited by cross-sectional design, and causal inferences could not be drawn. Our study stands out because it used long-term, repeatedly measured, and updated dietary records and health outcomes, which not only provided a large number of observations, but also deeper insights into the causally relevant associations compared with cross-sectional studies and prospective studies with diet measured at baseline only.
We also observed that fruits, vegetables, and combined consumption of vegetables and fruits were associated with improved cardiometabolic risk factors. Similarly, in a population-based cross-sectional study, Mirmiran et al. [39] showed that consumption of fruits and vegetables was associated with lower concentrations of total cholesterol and LDL cholesterol. However, in a 12-week RCT, McEvoy et al. [40] did not find dose–response effects of fruit and vegetable intake on cardiometabolic risk factors including ambulatory blood pressure and plasma lipids. For grains, several RCTs and observational studies suggested that whole grains showed inverse effects on cardiometabolic risk factors [41,42,43], whereas refined grains showed positive effects [44,45]. However, there are conflicting reports of the associations of whole grains with obesity measures [46,47]. In the current study, total grains were not associated with any favorable change in health outcome. This may be because the grain group in the PREVIEW dietary dataset was not strictly based on whole grains, although whole grains were recommended to participants in each intervention arms during WLM.
The strengths of the current study are that this is the first multi-center, international study to explore associations of consumption of a PBD and specific plant foods with weight gain and cardiometabolic risk factors during 3-year WLM after diet-induced WL. Additionally, our study included individuals who met the pre-diabetes criteria (not just overweight/obesity) at the start. Furthermore, long-term, repeated dietary records were collected, which provided a large number of observations and a sufficient statistical power to adjust for important and multiple confounding factors including animal-based food intake and PA measured by accelerometry.
The current study also has some limitations. First, the attrition rate, especially at the end of the study, was higher than expected, which may affect the generalization of our findings. Second, the dietary data were obtained via 4-day food records, and misreporting, overreporting, or underreporting were inevitable [48]. Third, specific food groups such as refined grains, whole grains, and sugar sweetened beverages were not included in PDI calculation, which made this index less accurate when describing adherence to an overall PBD. It was not possible for us to investigate unhealthy PDI or specific unhealthy plant foods because these foods were specifically excluded in the dietary instructions. Furthermore, in order to make the results easy to understand, we divided the participants into higher or lower plant-based diet adherence groups according to PDI at each time point. Unlike RCTs, however, in the present analysis the participants were not randomly allocated to one of the two groups, which means that their baseline characteristics may be unbalanced. The statistical phenomenon “regression toward the mean” may have affected the two groups differently, making the natural variation in BW appear as true change [49]. Finally, residual and unmeasured confounders are possible in any observational analysis, which may create bias. Hyperuricemia, an independent risk factor for major CVD [50] and an important confounding factor, was not included in the current analysis. As we collected smoking status at baseline only (not at each time point), it was not possible to adjust for smoking status as a time-varying variable in the models. Adjustment for baseline values only may introduce bias because smokers may quit smoking during a long-term healthy lifestyle intervention.

5. Conclusions

This secondary analysis showed that long-term consumption of specific healthy plant foods including nuts, fruits, and vegetables improved weight management and cardiometabolic health, whereas adherence to an overall PBD benefited weight management only. Our findings support the hypothesis that specific components in a PBD are important as well. Although healthy and high-quality plant foods are currently recommended to individuals for reducing weight regain and the risk of developing CVDs, the observational nature of our analysis cannot establish a cause-and-effect relationship. The findings should be treated with caution because misreporting of food intake and unmeasured confounders are common.

Supplementary Materials

The following are available online at https://www.mdpi.com/article/10.3390/nu13113916/s1, Table S1: Calculations for cumulative average dietary intake, physical activity, and yearly changes in body weight and cardiometabolic risk factors, Table S2. Longitudinal associations of adherence to healthy plant-based diet with yearly changes in weight outcomes and cardiometabolic risk factors during weight-loss maintenance (n = 688), Table S3. Longitudinal associations of total grain and potato intake with yearly weight regain and changes in cardiometabolic risk factors during weight-loss maintenance (n = 710), Table S4. Longitudinal associations of legume intake with yearly weight regain and changes in cardiometabolic risk factors during weight-loss maintenance (n = 710), Table S5. Longitudinal associations of nut intake with yearly changes in waist circumference and cardiometabolic risk factors during weight-loss maintenance (n = 710), Table S6. Longitudinal associations of fruit intake with yearly weight regain and changes in cardiometabolic risk factors during weight-loss maintenance (n = 710), Table S7. Longitudinal associations of vegetable intake with yearly weight regain and changes in cardiometabolic risk factors during weight-loss maintenance (n = 710), Table S8. Longitudinal associations of vegetable and fruit intake with yearly weight regain and changes in cardiometabolic risk factors during weight-loss maintenance (n = 710), Figure S1. Changes in body weight during weight-loss maintenance in all participants (n = 688) (A) or completers (n = 493) (B) with lower or higher adherence to the plant-based diet.

Author Contributions

Conceptualization for the secondary analysis, R.Z. and A.R.; methodology, A.R., J.B.-M., M.F., S.D.P., I.A.M., J.A.M., G.S. and S.H.; sample analysis, J.S. and L.R.; writing—original draft preparation, R.Z.; writing—review and editing, R.Z., A.R., J.B.-M., M.F., S.D.P., J.A.M., G.M., M.H.-L., E.J., R.M., M.A.T., M.P.S., T.H.-D., I.A.M., G.S., S.H., J.S. and L.R. A.R. attests that all listed authors meet authorship criteria and that no others meeting the criteria have been omitted. The funders had no role in the design of the study; in the collection, analyses, or interpretation of data; in the writing of the manuscript; or in the decision to publish the results. All authors have read and agreed to the published version of the manuscript.

Funding

EU framework programme 7 (FP7/2007-2013) grant agreement # 312057. National Health and Medical Research Council—EU Collaborative Grant, AUS 8, ID 1067711). The Glycemic Index Foundation Australia through royalties to the University of Sydney. The New Zealand Health Research Council (grant #14/191) and University of Auckland Faculty Research Development Fund. The Cambridge Weight Plan© donated all products for the 8-week LED period. The Danish Agriculture & Food Council. The Danish Meat and Research Institute. National Institute for Health Research Biomedical Research Centre (NIHR BRC) (UK). Engineering and Physical Sciences Research Council (EPSRC) (UK). Nutritics (Dublin) donated all dietary analyses software used by UNOTT. Juho Vainio Foundation (FIN), Academy of Finland (grant numbers: 272376, 314383, 266286, 314135), Finnish Medical Foundation, Gyllenberg Foundation, Novo Nordisk Foundation, Finnish Diabetes Research Foundation, University of Helsinki, Government Research Funds for Helsinki University Hospital (FIN), Jenny and Antti Wihuri Foundation (FIN), Emil Aaltonen Foundation (FIN). China Scholarship Council.

Institutional Review Board Statement

The PREVIEW study was conducted according to the guidelines of the Declaration of Helsinki, and the study was approved by the Human Ethics Committees at each intervention center (Denmark: The Research Ethics Committees of the Capital Region, ethical approval code: H-1-2013-052; Finland: Coordinating Ethical Committee of HUS (Helsinki and Uusimaa Hospital District), ethical approval code: HUS/1733/2017; the UK: UK National Research Ethics Service (NRES) and East Midlands (Leicester) Ethics Committee, ethical approval code: 13/EM/0259; the Netherlands: Medical Ethics Committee of the Maastricht University Medical Centre, ethical approval code: NL43054.068.13/METC 13–3-008; Spain: Research Ethics Committee of the University of Navarra, ethical approval code: 71/2013; Bulgaria: Commission on Ethics in Scientific Research with the Medical University-Sofia (KENIMUS), ethical approval code: 4303/13.06.2014; Australia: The University of Sydney, Human Research Ethics Committee (HREC), ethical approval code: 2013/535; and New Zealand: Health and Disability Ethics Committees (HDEC), ethical approval code: X14-0408).

Informed Consent Statement

Written informed consent was obtained from all participants.

Data Availability Statement

The dataset for this study is available from the corresponding author on reasonable request.

Acknowledgments

The PREVIEW consortium would like to thank all study participants at every intervention center for their time and commitment and all scientists, advisors, and students for their dedication and contributions to the study. Specially, we would like to thank Thomas Meinert Larsen (University of Copenhagen), Margriet Westerterp-Plantenga (Maastricht University), Edith Feskens (Wageningen University), and Wolfgang Schlicht (University of Stuttgart).

Conflicts of Interest

A.R. has received honorariums from Unilever and the International Sweeteners Association. J.B.-M. is President and Director of the Glycemic Index Foundation, oversees a glycemic index testing service at the University of Sydney, and is a co-author of books about diet and diabetes. She is a member of the Scientific Advisory Board of the Novo Foundation and of ZOE Global. I.A.M. was a member of the UK Government Scientific Advisory Committee on Nutrition, Treasurer of the Federation of European Nutrition Societies, Treasurer of the World Obesity Federation, member of the Mars Scientific Advisory Council, member of the Mars Europe Nutrition Advisory Board, and Scientific Adviser to the Waltham Centre for Pet Nutrition. He was also a member of the Nestle Research Scientific Advisory Board and of the Novozymes Scientific Advisory Board. He withdrew from all of these roles in 2020 and on 1 August 2020 became Professor Emeritus at the University of Nottingham and took up the post of Scientific Director of the Nestle Institute of Health Sciences in Lausanne, Switzerland. S.D.P. was the Fonterra Chair in Human Nutrition during the PREVIEW intervention.

References

  1. Timmis, A.; Townsend, N.; Gale, C.P.; Torbica, A.; Lettino, M.; Petersen, S.E.; Mossialos, E.A.; Maggioni, A.P.; Kazakiewicz, D.; May, H.T.; et al. European Society of Cardiology: Cardiovascular Disease Statistics 2019. Eur. Heart J. 2020, 41, 12–85. [Google Scholar] [CrossRef] [PubMed]
  2. Bechthold, A.; Boeing, H.; Tetens, I.; Schwingshackl, L.; Nothlings, U. Perspective: Food-Based Dietary Guidelines in Europe-Scientific Concepts, Current Status, and Perspectives. Adv. Nutr. 2018, 9, 544–560. [Google Scholar] [CrossRef]
  3. Willett, W.; Rockstrom, J.; Loken, B.; Springmann, M.; Lang, T.; Vermeulen, S.; Garnett, T.; Tilman, D.; DeClerck, F.; Wood, A.; et al. Food in the Anthropocene: The EAT-Lancet Commission on healthy diets from sustainable food systems. Lancet 2019, 393, 447–492. [Google Scholar] [CrossRef]
  4. Aune, D. Plant Foods, Antioxidant Biomarkers, and the Risk of Cardiovascular Disease, Cancer, and Mortality: A Review of the Evidence. Adv. Nutr. 2019, 10, S404–S421. [Google Scholar] [CrossRef] [Green Version]
  5. Dinu, M.; Abbate, R.; Gensini, G.F.; Casini, A.; Sofi, F. Vegetarian, vegan diets and multiple health outcomes: A systematic review with meta-analysis of observational studies. Crit. Rev. Food Sci. Nutr. 2017, 57, 3640–3649. [Google Scholar] [CrossRef]
  6. Choi, Y.; Larson, N.; Gallaher, D.D.; Odegaard, A.O.; Rana, J.S.; Shikany, J.M.; Steffen, L.M.; Jacobs, D.R., Jr. A Shift toward a Plant-Centered Diet from Young to Middle Adulthood and Subsequent Risk of Type 2 Diabetes and Weight Gain: The Coronary Artery Risk Development in Young Adults (CARDIA) Study. Diabetes Care 2020, 43, 2796–2803. [Google Scholar] [CrossRef] [PubMed]
  7. Hemler, E.C.; Hu, F.B. Plant-Based Diets for Personal, Population, and Planetary Health. Adv. Nutr. 2019, 10, S275–S283. [Google Scholar] [CrossRef] [PubMed]
  8. Huang, R.Y.; Huang, C.C.; Hu, F.B.; Chavarro, J.E. Vegetarian Diets and Weight Reduction: A Meta-Analysis of Randomized Controlled Trials. J. Gen. Intern. Med. 2016, 31, 109–116. [Google Scholar] [CrossRef] [PubMed] [Green Version]
  9. Kim, H.; Caulfield, L.E.; Garcia-Larsen, V.; Steffen, L.M.; Coresh, J.; Rebholz, C.M. Plant-Based Diets Are Associated With a Lower Risk of Incident Cardiovascular Disease, Cardiovascular Disease Mortality, and All-Cause Mortality in a General Population of Middle-Aged Adults. J. Am. Heart Assoc. 2019, 8, e012865. [Google Scholar] [CrossRef] [PubMed]
  10. Satija, A.; Hu, F.B. Plant-based diets and cardiovascular health. Trends Cardiovasc. Med. 2018, 28, 437–441. [Google Scholar] [CrossRef]
  11. Bielefeld, D.; Grafenauer, S.; Rangan, A. The Effects of Legume Consumption on Markers of Glycaemic Control in Individuals with and without Diabetes Mellitus: A Systematic Literature Review of Randomised Controlled Trials. Nutrients 2020, 12, 2123. [Google Scholar] [CrossRef]
  12. Abbaspour, N.; Roberts, T.; Hooshmand, S.; Kern, M.; Hong, M.Y. Mixed nut consumption may improve cardiovascular disease risk factors in overweight and obese adults. Nutrients 2019, 11, 1488. [Google Scholar] [CrossRef] [Green Version]
  13. Brown, R.C.; Tey, S.L.; Gray, A.R.; Chisholm, A.; Smith, C.; Fleming, E.; Parnell, W. Association of Nut Consumption with Cardiometabolic Risk Factors in the 2008/2009 New Zealand Adult Nutrition Survey. Nutrients 2015, 7, 7523–7542. [Google Scholar] [CrossRef] [Green Version]
  14. Carter, P.; Gray, L.J.; Talbot, D.; Morris, D.H.; Khunti, K.; Davies, M.J. Fruit and vegetable intake and the association with glucose parameters: A cross-sectional analysis of the Let’s Prevent Diabetes Study. Eur. J. Clin. Nutr. 2013, 67, 12–17. [Google Scholar] [CrossRef] [PubMed]
  15. Fisk, P.S., II; Middaugh, A.L.; Rhee, Y.S.; Brunt, A.R. Few favorable associations between fruit and vegetable intake and biomarkers for chronic disease risk in American adults. Nutr. Res. 2011, 31, 616–624. [Google Scholar] [CrossRef] [PubMed]
  16. Toumpanakis, A.; Turnbull, T.; Alba-Barba, I. Effectiveness of plant-based diets in promoting well-being in the management of type 2 diabetes: A systematic review. BMJ Open Diabetes Res. Care 2018, 6, e000534. [Google Scholar] [CrossRef] [PubMed] [Green Version]
  17. Yokoyama, Y.; Barnard, N.D.; Levin, S.M.; Watanabe, M. Vegetarian diets and glycemic control in diabetes: A systematic review and meta-analysis. Cardiovasc. Diagn. Ther. 2014, 4, 373–382. [Google Scholar] [CrossRef]
  18. Fogelholm, M.; Larsen, T.M.; Westerterp-Plantenga, M.; Macdonald, I.; Martinez, J.A.; Boyadjieva, N.; Poppitt, S.; Schlicht, W.; Stratton, G.; Sundvall, J.; et al. PREVIEW: Prevention of diabetes through lifestyle intervention and population studies in Europe and around the world. design, methods, and baseline participant description of an adult cohort enrolled into a three-year randomised clinical trial. Nutrients 2017, 9, 632. [Google Scholar] [CrossRef] [Green Version]
  19. Christensen, P.; Meinert Larsen, T.; Westerterp-Plantenga, M.; Macdonald, I.; Martinez, J.A.; Handjiev, S.; Poppitt, S.; Hansen, S.; Ritz, C.; Astrup, A.; et al. Men and women respond differently to rapid weight loss: Metabolic outcomes of a multi-centre intervention study after a low-energy diet in 2500 overweight, individuals with pre-diabetes (PREVIEW). Diabetes Obes. Metab. 2018, 20, 2840–2851. [Google Scholar] [CrossRef] [Green Version]
  20. Raben, A.; Vestentoft, P.S.; Brand-Miller, J.; Jalo, E.; Drummen, M.; Simpson, L.; Martinez, J.; Handjieva-Darlenska, T.; Stratton, G.; Huttunen-Lenz, M.; et al. PREVIEW-Results from a 3-year randomised 2 x 2 factorial multinational trial investigating the role of protein, glycemic index and physical activity for prevention of type-2 diabetes. Diabetes Obes. Metab. 2020, 23, 324–337. [Google Scholar] [CrossRef]
  21. Kahlert, D.; Unyi-Reicherz, A.; Stratton, G.; Meinert Larsen, T.; Fogelholm, M.; Raben, A.; Schlicht, W. PREVIEW behavior modification intervention toolbox (PREMIT): A study protocol for a psychological element of a multicenter project. Front. Psychol. 2016, 7, 1136. [Google Scholar] [CrossRef] [Green Version]
  22. American Diabetes Association. 2. Classification and Diagnosis of Diabetes. Diabetes Care 2017, 40, S11–S24. [Google Scholar] [CrossRef] [PubMed] [Green Version]
  23. National Health and Medical Research Council. Australian Dietary Guidelines; National Health and Medical Research Council: Canberra, Australia, 2013.
  24. Satija, A.; Bhupathiraju, S.N.; Rimm, E.B.; Spiegelman, D.; Chiuve, S.E.; Borgi, L.; Willett, W.C.; Manson, J.E.; Sun, Q.; Hu, F.B. Plant-Based Dietary Patterns and Incidence of Type 2 Diabetes in US Men and Women: Results from Three Prospective Cohort Studies. PLoS Med. 2016, 13, e1002039. [Google Scholar] [CrossRef] [PubMed] [Green Version]
  25. Wallace, T.M.; Levy, J.C.; Matthews, D.R. Use and abuse of HOMA modeling. Diabetes Care 2004, 27, 1487–1495. [Google Scholar] [CrossRef] [PubMed] [Green Version]
  26. He, F.J.; Tan, M.; Ma, Y.; MacGregor, G.A. Salt Reduction to Prevent Hypertension and Cardiovascular Disease: JACC State-of-the-Art Review. J. Am. Coll. Cardiol 2020, 75, 632–647. [Google Scholar] [CrossRef]
  27. Satija, A.; Bhupathiraju, S.N.; Spiegelman, D.; Chiuve, S.E.; Manson, J.E.; Willett, W.; Rexrode, K.M.; Rimm, E.B.; Hu, F.B. Healthful and Unhealthful Plant-Based Diets and the Risk of Coronary Heart Disease in U.S. Adults. J. Am. Coll. Cardiol. 2017, 70, 411–422. [Google Scholar] [CrossRef]
  28. Peters, S.A.; Bots, M.L.; den Ruijter, H.M.; Palmer, M.K.; Grobbee, D.E.; Crouse III, J.R.; O’Leary, D.H.; Evans, G.W.; Raichlen, J.S.; Moons, K.G. Multiple imputation of missing repeated outcome measurements did not add to linear mixed-effects models. J. Clin. Epidemiol. 2012, 65, 686–695. [Google Scholar] [CrossRef]
  29. Twisk, J.; de Boer, M.; de Vente, W.; Heymans, M. Multiple imputation of missing values was not necessary before performing a longitudinal mixed-model analysis. J. Clin. Epidemiol. 2013, 66, 1022–1028. [Google Scholar] [CrossRef]
  30. Wang, F.; Zheng, J.; Yang, B.; Jiang, J.; Fu, Y.; Li, D. Effects of Vegetarian Diets on Blood Lipids: A Systematic Review and Meta-Analysis of Randomized Controlled Trials. J. Am. Heart Assoc. 2015, 4, e002408. [Google Scholar] [CrossRef] [Green Version]
  31. Satija, A.; Malik, V.; Rimm, E.B.; Sacks, F.; Willett, W.; Hu, F.B. Changes in intake of plant-based diets and weight change: Results from 3 prospective cohort studies. Am. J. Clin. Nutr. 2019, 110, 574–582. [Google Scholar] [CrossRef] [Green Version]
  32. Chen, Z.; Drouin-Chartier, J.P.; Li, Y.; Baden, M.Y.; Manson, J.E.; Willett, W.C.; Voortman, T.; Hu, F.B.; Bhupathiraju, S.N. Changes in Plant-Based Diet Indices and Subsequent Risk of Type 2 Diabetes in Women and Men: Three U.S. Prospective Cohorts. Diabetes Care 2021, 44, 663–671. [Google Scholar] [CrossRef]
  33. Glenn, A.J.; Lo, K.; Jenkins, D.J.A.; Boucher, B.A.; Hanley, A.J.; Kendall, C.W.C.; Manson, J.E.; Vitolins, M.Z.; Snetselaar, L.G.; Liu, S.; et al. Relationship Between a Plant-Based Dietary Portfolio and Risk of Cardiovascular Disease: Findings From the Women’s Health Initiative Prospective Cohort Study. J. Am. Heart Assoc. 2021, 10, e021515. [Google Scholar] [CrossRef]
  34. Zhu, R.; Larsen, T.M.; Fogelholm, M.; Poppitt, S.; Vestentoft, P.S.; Silvestre, M.P.; Jalo, E. Dose-dependent associations of dietary glycemic index, glycemic load and fiber with 3-year weight-loss maintenance and glycemic status in a high-risk population: A secondary analysis of the PREVIEW diabetes prevention study. Diabetes Care 2021, 44, 1672–1681. [Google Scholar] [CrossRef]
  35. Schlesinger, S.; Neuenschwander, M.; Schwedhelm, C.; Hoffmann, G.; Bechthold, A.; Boeing, H.; Schwingshackl, L. Food Groups and Risk of Overweight, Obesity, and Weight Gain: A Systematic Review and Dose-Response Meta-Analysis of Prospective Studies. Adv. Nutr. 2019, 10, 205–218. [Google Scholar] [CrossRef] [Green Version]
  36. Li, H.; Li, X.; Yuan, S.; Jin, Y.; Lu, J. Nut consumption and risk of metabolic syndrome and overweight/obesity: A meta-analysis of prospective cohort studies and randomized trials. Nutr. Metab. 2018, 15, 46. [Google Scholar] [CrossRef] [Green Version]
  37. Eslami, O.; Shidfar, F.; Dehnad, A. Inverse association of long-term nut consumption with weight gain and risk of overweight/obesity: A systematic review. Nutr. Res. 2019, 68, 1–8. [Google Scholar] [CrossRef]
  38. Tindall, A.M.; Johnston, E.A.; Kris-Etherton, P.M.; Petersen, K.S. The effect of nuts on markers of glycemic control: A systematic review and meta-analysis of randomized controlled trials. Am. J. Clin. Nutr. 2019, 109, 297–314. [Google Scholar] [CrossRef]
  39. Ibarrola-Jurado, N.; Bulló, M.; Guasch-Ferré, M.; Ros, E.; Martínez-González, M.A.; Corella, D.; Fiol, M.; Wärnberg, J.; Estruch, R.; Román, P. Cross-sectional assessment of nut consumption and obesity, metabolic syndrome and other cardiometabolic risk factors: The PREDIMED study. PLoS ONE 2013, 8, e57367. [Google Scholar] [CrossRef] [PubMed] [Green Version]
  40. McEvoy, C.T.; Wallace, I.R.; Hamill, L.L.; Hunter, S.J.; Neville, C.E.; Patterson, C.C.; Woodside, J.V.; Young, I.S.; McKinley, M.C. Increasing fruit and vegetable intake has no dose-response effect on conventional cardiovascular risk factors in overweight adults at high risk of developing cardiovascular disease. J. Nutr. 2015, 145, 1464–1471. [Google Scholar] [CrossRef] [PubMed] [Green Version]
  41. Marshall, S.; Petocz, P.; Duve, E.; Abbott, K.; Cassettari, T.; Blumfield, M.; Fayet-Moore, F. The Effect of Replacing Refined Grains with Whole Grains on Cardiovascular Risk Factors: A Systematic Review and Meta-Analysis of Randomized Controlled Trials with GRADE Clinical Recommendation. J. Acad. Nutr. Diet. 2020, 120, 1859–1883.E31. [Google Scholar] [CrossRef] [PubMed]
  42. Tieri, M.; Ghelfi, F.; Vitale, M.; Vetrani, C.; Marventano, S.; Lafranconi, A.; Godos, J.; Titta, L.; Gambera, A.; Alonzo, E.; et al. Whole grain consumption and human health: An umbArella review of observational studies. Int. J. Food Sci. Nutr. 2020, 71, 668–677. [Google Scholar] [CrossRef]
  43. Reynolds, A.; Mann, J.; Cummings, J.; Winter, N.; Mete, E.; Te Morenga, L. Carbohydrate quality and human health: A series of systematic reviews and meta-analyses. Lancet 2019, 393, 434–445. [Google Scholar] [CrossRef] [Green Version]
  44. Musa-Veloso, K.; Poon, T.; Harkness, L.S.; O’Shea, M.; Chu, Y. The effects of whole-grain compared with refined wheat, rice, and rye on the postprandial blood glucose response: A systematic review and meta-analysis of randomized controlled trials. Am. J. Clin. Nutr. 2018, 108, 759–774. [Google Scholar] [CrossRef] [Green Version]
  45. Schwingshackl, L.; Hoffmann, G.; Lampousi, A.M.; Knuppel, S.; Iqbal, K.; Schwedhelm, C.; Bechthold, A.; Schlesinger, S.; Boeing, H. Food groups and risk of type 2 diabetes mellitus: A systematic review and meta-analysis of prospective studies. Eur. J. Epidemiol. 2017, 32, 363–375. [Google Scholar] [CrossRef] [PubMed] [Green Version]
  46. Sadeghi, O.; Sadeghian, M.; Rahmani, S.; Maleki, V.; Larijani, B.; Esmaillzadeh, A. Whole-grain consumption does not affect obesity measures: An updated systematic review and meta-analysis of randomized clinical trials. Adv. Nutr. 2020, 11, 280–292. [Google Scholar] [CrossRef] [PubMed]
  47. Ye, E.Q.; Chacko, S.A.; Chou, E.L.; Kugizaki, M.; Liu, S. Greater whole-grain intake is associated with lower risk of type 2 diabetes, cardiovascular disease, and weight gain. J. Nutr. 2012, 142, 1304–1313. [Google Scholar] [CrossRef]
  48. Park, Y.; Dodd, K.W.; Kipnis, V.; Thompson, F.E.; Potischman, N.; Schoeller, D.A.; Baer, D.J.; Midthune, D.; Troiano, R.P.; Bowles, H.; et al. Comparison of self-reported dietary intakes from the Automated Self-Administered 24-h recall, 4-d food records, and food-frequency questionnaires against recovery biomarkers. Am. J. Clin. Nutr. 2018, 107, 80–93. [Google Scholar] [CrossRef] [Green Version]
  49. Barnett, A.G.; Van Der Pols, J.C.; Dobson, A.J. Regression to the mean: What it is and how to deal with it. Int. J. Epidemiol. 2005, 34, 215–220. [Google Scholar] [CrossRef] [Green Version]
  50. Capuano, V.; Marchese, F.; Capuano, R.; Torre, S.; Iannone, A.G.; Capuano, E.; Lamaida, N.; Sonderegger, M.; Capuano, E. Hyperuricemia as an independent risk factor for major cardiovascular events: A 10-year cohort study from Southern Italy. J. Cardiovasc. Med. 2017, 18, 159–164. [Google Scholar] [CrossRef]
Figure 1. Participant flow diagram. 1 Individuals with missing plant food data at 26 weeks and/or implausible energy intake data (<2520 or >14,700 kJ·day−1 for women and <3360 or >17,640 kJ·day−1 for men) were excluded.
Nutrients 13 03916 g001
Figure 2. Longitudinal associations of adherence to a plant-based diet with yearly weight regain and changes in cardiometabolic risk factors during weight-loss maintenance. Yearly mean change and 95% CI of main effects indicating changes in body weight or cardiometabolic risk factors per year associated with a 1 standard deviation increment in plant-based diet index. Analyses were conducted using a linear mixed model with repeated measures. Model 1 was adjusted for fixed factors including age, sex, ethnicity, BMI at 8 weeks, body weight, or cardiometabolic risk factors at 8 weeks, and time and random factors including study center and participant ID. Model 2 was adjusted for covariates in model 1 plus fixed factors including time-varying physical activity, energy intake (kJ·day−1), alcohol intake (g·day−1). Model 3 was adjusted for covariates in model 2 plus time-varying yearly changes in body weight as a fixed factor. LDL cholesterol, low-density lipoprotein cholesterol.
Nutrients 13 03916 g002
Figure 3. Longitudinal associations of legume (10 g·day−1) or nut (5 g·day−1) intake with yearly weight regain and changes in cardiometabolic risk factors during weight-loss maintenance. Yearly mean change and 95% CI of main effects indicating changes in body weight or cardiometabolic risk factors per year associated with 10 g increment in legume intake or 5 g increment in vegetable intake. Analyses were conducted using a linear mixed model with repeated measures. Model 1 was adjusted for fixed factors including age, sex, ethnicity, BMI at 8 weeks, body weight, or cardiometabolic risk factors at 8 weeks and time and random factors including study center and participant ID. Model 2 was adjusted for covariates in model 1 plus fixed factors including time-varying physical activity, energy intake (kJ·day−1), alcohol intake (g·day−1), animal-based food intake (g·day−1), and other plant food intake (g·day−1). Model 3 was adjusted for covariates in model 2 plus time-varying yearly changes in body weight as a fixed factor. HbA1c, glycosylated hemoglobin A1c; HDL cholesterol, high-density lipoprotein cholesterol; LDL cholesterol, low-density lipoprotein cholesterol.
Nutrients 13 03916 g003
Figure 4. Longitudinal associations of fruit (50 g·day−1) or vegetable (100 g·day−1) or fruit and vegetable intake (150 g·day−1) with yearly changes in cardiometabolic risk factors during weight-loss maintenance. Yearly mean change and 95% CI of main effects indicating changes in cardiometabolic risk factors per year associated with 50 g increment in fruit intake or 100 g increment in vegetable intake or 150 g increment in fruit and vegetable intake. Analyses were conducted using a linear mixed model with repeated measures. Model 1 was adjusted for fixed factors including age, sex, ethnicity, BMI at 8 weeks, cardiometabolic risk factors at 8 weeks, and time and random factors including study center and participant ID. Model 2 was adjusted for covariates in model 1 plus fixed factors including time-varying physical activity, energy intake (kJ·day−1), alcohol intake (g·day−1), animal-based food intake (g·day−1), and other plant food intake (g·day−1); for systolic blood pressure and diastolic blood pressure, model 2 was additionally adjusted for dietary sodium intake (g·day−1). Model 3 was adjusted for covariates in model 2 plus time-varying yearly changes in body weight as a fixed factor. HDL cholesterol, high-density lipoprotein cholesterol; LDL cholesterol, low-density lipoprotein cholesterol.
Nutrients 13 03916 g004
Table 1. Examples of food items in the 11 food groups.
Food GroupsFoodsPlant-Based Diet Index
Plant
GrainsBread rolls/baps/bagels, breads, cereal bars, cereal products, cereals, crackers/crispbreads, flours, grains, pastas, pastries/buns, rice, potatoes, potato products, pastry, plain cake, biscuits, and starch-based carbohydrate-rich snacksPositive scores
LegumesPulses, beans, peas, lentils, and soy foodsPositive scores
NutsNuts and seedsPositive scores
Vegetablesleafy vegetables, dried vegetables, mushrooms, pickles/chutney, roots/tubers/bulbs, sea vegetables/algae, vegetable dishes, and avocadoPositive scores
FruitsFruits, canned fruit, and dried fruitPositive scores
Animal
DairyMilk products, cow’s milk, cream, creams, drinking yogurts, milkshakes/smoothies, processed milk/powders, yogurts, chilled desserts, and cheesesNegative scores
EggsEggs, egg products, and egg dishesNegative scores
Red meatBeef, pork, lamb, organ meats, meat dishes, and meat productsNegative scores
Processed meatFrankfurters, bacon, corned beef, sausage, cured ham, and luncheon meat made from beef, pork, and poultryNegative scores
PoultryPoultry and poultry products, chicken, turkeyNegative scores
Fish/seafoodFatty fish, fish products, low-fat fish, canned fatty fish, canned low-fat fish, seafoods, and crustaceans, including lobster and shrimpsNegative scores
Table 2. Characteristics of participants at baseline (0 weeks), the start of weight-loss maintenance (8 weeks), or 26 weeks.
Characteristics
n 710
Socio-demographics 1
Female, n (%)491 (69.2)
Age (years)57 (46, 63)
Height (m)1.66 (1.61, 1.73)
Ethnicity, n (%)
Caucasian617 (86.9)
Asian24 (3.4)
Black19 (2.7)
Arabic4 (0.6)
Other46 (6.5)
Smoking, n (%)
No659 (92.8)
Yes, but less than weekly17 (2.4)
Yes, at least daily30 (4.2)
Missing4 (0.6)
Anthropometric outcomes and body composition 2
Body weight (kg)86.1 ± 16.6
BMI (kg·m−2)29.5 (26.7, 33.5)
Fat mass (kg)33.5 ± 12.3
Waist circumference (cm)100.2 ± 12.6
Cardiometabolic risk factors 2
Fasting plasma glucose (mmol·L−1)5.7 ± 0.6
HbA1c (mmol·mol−1)35.0 ± 3.1
HbA1c (%)5.4 ± 0.3
Fasting insulin (mU·L−1)7.3 (5.3, 9.9)
HOMA-IR1.8 (1.3, 2.5)
Systolic blood pressure (mmHg)121.6 ± 15.8
Diastolic blood pressure (mmHg)72.1 ± 9.5
Triglycerides (mmol·L−1)1.0 (0.8, 1.2)
Total cholesterol (mmol·L−1)4.1 ± 0.9
HDL cholesterol (mmol·L−1)1.1 ± 0.2
LDL cholesterol (mmol·L−1)2.4 (1.9, 3.0)
Energy and food intake 3
Energy (kJ·day−1)29,491 ± 7731
Grains (g·day−1)206.1 (144.7, 276.6)
Legumes (g·day−1)0.2 (0, 27.5)
Nuts (g·day−1)3.2 (0, 10.8)
Fruits (g·day−1)169.5 (83.8, 260.5)
Vegetables (g·day−1)185.9 (97.1, 310.7)
Dairy (g·day−1)361.0 (226.4, 501.0)
Eggs (g·day−1)20.8 (5.1, 41.3)
Red meat (g·day−1)35.9 (0, 71.9)
Processed meat (g·day−1)12.0 (0, 29.7)
Poultry (g·day−1)37.2 (9.6, 70.4)
Fish/seafood (g·day−1)30.0 (3.6, 62.7)
Values represent mean ± standard deviation, median (25th, 75th percentiles), and the number of participants (%) 1 Data were collected at 0 weeks. 2 Data were collected at 8 weeks. 3 Data were collected at 26 weeks. BMI, body mass index; HbA1c, glycosylated hemoglobin A1c; HDL cholesterol, high-density lipoprotein cholesterol; HOMA-IR, homeostatic model assessment of insulin resistance; LDL cholesterol, low-density lipoprotein cholesterol.
Publisher’s Note: MDPI stays neutral with regard to jurisdictional claims in published maps and institutional affiliations.

