Abstract
Background: Clinical characteristics of nutrition status in acute myocardial infarction (AMI) patients with cancer remains unknown. Therefore, this study aimed to clarify the differences of clinical parameters, including nutrition status, between AMI patients with and without history of cancer. Methods and Results: This retrospective cohort study, using the database of AMI between 2014 and 2019 in Kurume University Hospital, enrolled 411 patients; AMI patients without cancer (n = 358, 87.1%) and with cancer (n = 53, 12.9%). AMI patients with cancer were significantly older with lower body weight, worse renal function, and worse nutrition status. Next, we divided the patients into 4 groups by cancer, age, and plaque area, detected by coronary image devices. The prediction model indicated that nutrition, lipid, and renal functions were significant predictors of AMI with cancer. The ordinal logistic regression model revealed that worse nutrition status, renal dysfunction, lower uric acid, and elevated blood pressure were significant predictors. Finally, we were able to calculate the probability of the presence of cancer, by combining each factor and scoring. Conclusions: Worse nutrition status and renal dysfunction were associated with AMI with cancer, in which nutrition status was a major different characteristic from those without cancer.
1. Introduction
Acute myocardial infarction (AMI) is mainly caused by coronary arteries thrombus due to atherosclerotic plaque rupture or endothelial erosion, and sometimes coronary artery spasm, microvascular thrombus, or others []. The formation of fibrofatty lesions in the atherosclerotic vulnerable plaques occurs during the atherosclerosis progression [], which have been treated by lipid-lowering therapy to stabilize during these 2 decades [,]. Further, it has been reported that rapid plaque progression of moderately severe vulnerable plaques is the critical step prior to AMI in most patients [,,]. Actually, accumulating evidence demonstrates that atherosclerotic risk factors, including hypertension, dyslipidemia, diabetes mellitus, and cigarette smoking, develop atherosclerotic lesions through immune system []. The atherosclerotic plaques often contain lipid core and fibrous cap, which consist of smooth muscle cells, macrophages, angiogenesis, and adventitial inflammation []. Taken together, when focused on vulnerable coronary atherosclerosis, not stable atheroma, it is considered that AMI most likely occurs due to rapidly progressed coronary atherosclerosis, caused by traditional atherosclerotic risk factors, including age; however, even small atherosclerotic plaques can cause AMI in some patients, which might be associated with some other risk factors.
In cancer patients, the mechanisms of atherosclerosis progression might be different. Especially, clonal hematopoiesis with indeterminate potential (CHIP) has been reported to increase the risk of AMI []. CHIP carriers had a 4.0-fold (95% confidence interval 2.4–6.7) higher risk of myocardial infarction than non-carriers []. It has been also reported that each of DNA methyltransferase 3A (DNMT3A), ten-eleven translocation-2 (TET2), additional sex combs-like 1 (ASXL1), and Janus kinase 2 (JAK2) mutation was associated with coronary artery disease, and that CHIP carriers with these mutations also had high levels of coronary artery calcification []. Further, TET2-deficient bone marrow cells enlarge atherosclerotic plaques by infiltrating macrophages, and TET2-deficiency increases cytokines/chemokines such as C-X-C motif ligand (CXCL)-1, CXCL 2, CXCL 3, interleukin (IL)-6 and IL-1β []. Also, Heyde et al., have reported that CHIP causes hematopoietic stem cell proliferation, promotes arteriosclerosis, and leads to a vicious cycle of proliferation of hematopoietic stem cells []. Above all, CHIP is an independent coronary risk factor in patients with premature menopause, especially in patients with spontaneous premature menopause []. Thus, coronary risk factors in the clinical settings might be different between cancer and non-cancer patients.
During these 4 decades, cancer is the first cause of death in Japan, and cardiovascular diseases (CVDs) are the second []. Because of recent improvement of cancer prognosis due to the advancement of cancer early detection, surgery, and anticancer drug treatment, the number of cancer survivors has increased [,]. Cancer and CVDs have common risks of lifestyle factors, such as smoking, obesity, and unhealthy food intake, in which healthy lifestyle is oppositely associated with a longer life expectancy free from major chronic diseases, including cancer and CVDs []. However, the clinical characteristics, especially in the aspects of nutrition status, remains scant in AMI patients with cancer.
Therefore, the purpose of the present study was to clarify the differences of clinical parameters in AMI with and without history of cancer, focusing on traditional coronary risk factors and nutrition status, and to develop a statistical model to evaluate the presence of cancer in patients with AMI, using database of AMI in Kurume University Hospital.
2. Materials and Methods
2.1. Study Design
This study was retrospective cohort study using the database of AMI in Cardiovascular Medicine, Kurume University Hospital. We enrolled 437 patients, who were treated by primary percutaneous coronary intervention (PCI) due to AMI in Cardiovascular Medicine, Kurume University Hospital from January 2014 to December 2019. We excluded patients if the patients had following reasons; (1) AMI occurred due to PCI complication, (2) PCI due to acute stent thrombosis, (3) unsuccessful PCI, and (4) coronary bypass surgery due to multi-vessel coronary artery disease.
2.2. Data Collection
Baseline demographic data were collected based on the medical records, including age, sex, height, body weight, waist, medications, traditional risk factors (hypertension, glucose intolerance/diabetes mellitus and dyslipidemia), blood pressure (BP), pulse rate, heart rate, and comorbidities (coronary artery disease, hypertensive heart disease, cardiomyopathy, valvular heart diseases, and congenital heart diseases). All cardiovascular diseases were diagnosed by expert cardiologists. AMI was diagnosed according to fourth universal definition of myocardial infarction [].
All patients were treated by PCI combined with the use of image devices, such as intravascular ultrasound (IVUS) or optical coherence tomography (OCT). We retrospectively measured the coronary atherosclerotic plaque area by image devices at the culprit lesions.
2.3. Blood Sampling
Peripheral blood was drawn from the antecubital vein for measurements of blood cell counts, lipid profiles including total cholesterol (T.chol), low-density lipoprotein cholesterol (LDL-c), high-density lipoprotein cholesterol (HDL-c), and triglyceride, liver and renal function markers including creatinine (Cr) and estimated glomerular filtration rate (eGFR), glycemic parameters of fasting plasma glucose (FPG) and hemoglobin A1c (HbA1c), uric acid, troponin, and N-terminal pro-brain natriuretic peptide (NT-pro-BNP). These chemistries were measured at a commercially available laboratory in Kurume University Hospital.
2.4. Definition of Comorbidities
Hypertension was defined as the use of antihypertensive drugs and/or systolic blood pressure ≥ 140 mmHg or diastolic blood pressure ≥ 90 mmHg. Dyslipidemia was defined as the use of lipid-lowering drugs and/or plasma LDL-c ≥ 140 mg/dL and/or triglycerides ≥ 150 mg/dL, and/or HDL-c < 40 mg/dL. Diabetes mellitus was diagnosed using antidiabetic drugs and/or fasting plasma glucose ≥ 110 mg/dL or HbA1c ≥ 6.5%.
2.5. Evaluation of Nutrition Status
The nutrition status was evaluated using the Glasgow Prognostic Score (GPS) [], modified GPS (mGPS) [,] and Controlling Nutritional Status (CONUT) [].
2.6. Statistical Analysis
All continuous variables were given as the mean ± standard deviations (SDs) or median with interquartile range. Categorical data were presented as number (n) or percentage (%). For intergroup univariate comparisons, an unpaired t test was applied in continuous variables and chi-square test in categorical variables.
The mean ± SDs and frequencies were presented by the two groups with and without cancer (Table 1 and Table 2).

Table 1.
Clinical characteristics of acute myocardial infarction patients with and without cancer.
Table 2.
Comorbidities and medicine of acute myocardial infarction patients with and without cancer.
To evaluate the impact of various risk factors of myocardial infarction on cancer and non-cancer patients, following three analytical steps were taken. First, the classification and regression tree (CART) model was employed to define risk groups (Table 3). Cancer status (yes or no) was used as the response variable and plaque area, age and sex were used as predictors. The fitted probability for the levels of the response was calculated, and the split is chosen to minimize the residual log-likelihood chi-square. Second, principal component analyses were performed to derive synthetic variables based on five sets of risk factors. Specifically, three measurements of nutrition, two measurements for lipid, glucose, blood pressure and renal function were subjected in the principal component analyses which render a way to avoid collinearity problems among highly correlated measurements within each set of risk factor (Table 4 and Table 5). Finally, ordinal logistic regression was employed to evaluate effect of each synthetic variables on the risk groups derived from the CART. Effect of each synthetic variable was interpreted based on the odds ratio (Table 6 and Table 7), and the predicted probability of the risk groups were calculated (Figure 5). To compare the results with logistic regressing model with cancer/non-cancer as response variable, an additional table was added (Table 8).
Table 3.
Divided groups by age and atherosclerotic plaque area.
Table 4.
Comportments of Synthetic variable with weights.
Table 5.
Mean and SD of six risk variables by Four Groups.
Table 6.
Estimate of the ordinal logistic regression model.
Table 7.
Estimates of odds ratio from ordinal logistic regression model.
Table 8.
Estimates of odds ratio from ordinal logistic regression model.
Statistical significance was defined as p value < 0.05. All statistical analyses were performed using JMP Pro 13.0 and SAS software (Release 9.3; SAS Institute, Cary, NC, USA).
2.7. Description of Ordinal Logistic Regression Model
Each subject denoted by i (i = 1, …, N) is classified into risk group denoted as “G1”, “G2”, “G3” or “G4”, and group membership is represented by random variable Y. Y takes value = 1 if G1, Y = 2 if G2, Y = 3 if G3 and Y = 3 if G4. Ordinal logistic regression is used to model. Let X be a vector of covariate defined as where are 6 risk variables. is a dummy variable, which takes value 0 or 1 for non-smoker and smoker respectively. Given covariate vector X, cumulative probability of Y is written as , and ordinal logistic regression model is defined as
where is an intercept with , and is parameter vector. From definition of the model, the expected predicted probabilities for G1, G2, G3 and G4 are given by
Finally, the predicted probabilities were obtained by plugging in parameter estimates into the expected predicted probabilities, and is referred to as the linear predicted score in the Figure 5.
Since our model is defined as , log odds ratio of belonging lower risk group when Nutrition score increase one unit is given by
where is the parameter estimate of “Nutrition”, thus, odds ratio is given by However, interpretation of odds ratio for a risk variable is easier for a subject being classified into higher risk group. To this end, we reversed the order of group membership (i.e., Y * = 5 − Y) and model Y * instead of Y where G1 was set as a reference group. Table 6 shown parameter estimates for modeling Y * where OR for nutrition is calculated as exp (0.232) = 1.26.
3. Results
3.1. Clinical Differences of Traditional Coronary Risk Factors and Nutrition Status with and without Cancer
Among 437 enrolled patients in the present study, 26 patients were excluded (Figure 1).
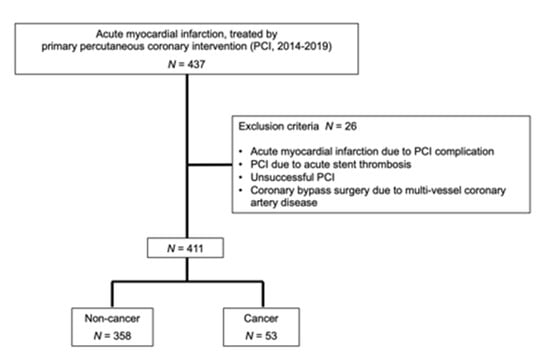
Figure 1.
Enrollment of patients.
In the remaining 411 patients, there were 358 AMI patients without cancer (87.1%) and 53 with cancer (12.9%). To compare with AMI patients without cancer, those with cancer were significantly older with significantly lower body weight, lower diastolic blood pressure, anemia, worse renal function, lower albumin and cholesterol levels, and worse nutrition status, evaluated by CONUT score, GPS, and mGPS (Table 1).
Next in comorbidities, those with cancer had significantly higher prevalence of diabetes mellitus, chronic kidney disease, history of coronary artery bypass surgery treatment, and peripheral artery disease, who also had more frequent drug interventions by clopidogrel, ticlopidine, other antiplatelet agents, anti-cancer agents, and steroid (Table 2).
3.2. Risk Model of Cancer
To divide the patients into some groups to evaluate the presence of cancer, we first examined the association between age and coronary atherosclerotic plaque area (Figure 2).
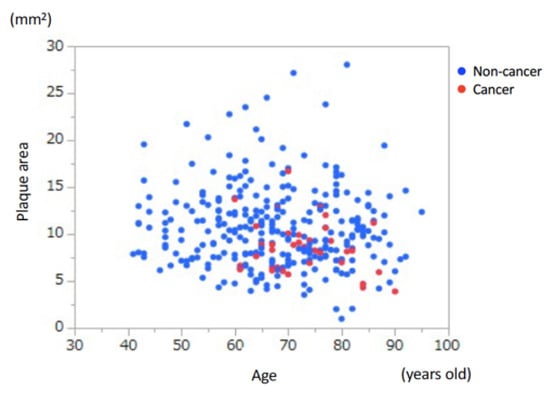
Figure 2.
Association between age and coronary atherosclerotic plaque area. There was no significant association between age and coronary plaque area.
Obviously, there was no cancer patient in Age < 60 years-old group. Then, the CART divided the patients by plaque area < 9.39 mm2 and those ≥9.39 mm2, which was the cut-off value of the presence and absence of cancer. According to this grouping process, we divided the whole patients into 4 groups to develop a new response variable to evaluate the presence of cancer (Figure 3 and Table 3). As we considered that if AMI occurred in patients with smaller coronary atherosclerotic plaques, the patients had higher risks, we defined the 4 groups as described in Figure 3 and Table 3.
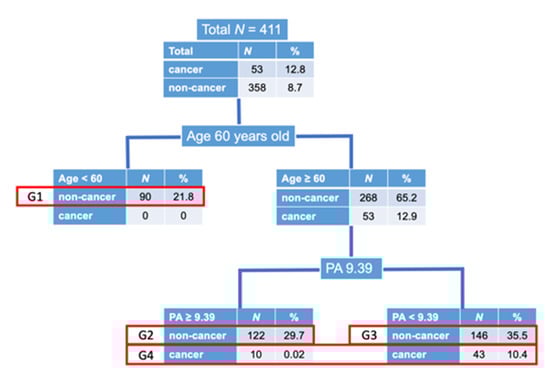
Figure 3.
Disposition of patients. As there was no cancer patient in age < 60 years old, we first divided the patients into 2 groups according to age of 60 years old. Next, the CART defined that the cut-off value of coronary atherosclerotic plaque area (PA) to divide the patients into with and without cancer was 9.39 mm2. Then, we divided the patients ≥ 60 years old into 2 groups according to plaque area of 9.39 mm2, with and without cancer. Due to the small number of cancer patients, we made 4 groups as shown above. Group 1; non-cancer, age < 60 years old, Group 2; non-cancer, age ≥ 60 years old, plaque area ≥ 9.39 mm2, Group 3; non-cancer, age ≥ 60 years old, plaque area < 9.39 mm2, Group 4; cancer, age ≥ 60 years old.
Next, we have developed the prediction model, which consisted of nutrition, lipid, glucose, blood pressure, and renal function (Table 4).
The equation of nutrition was expressed as “Nutrition = (−1.307) + 0.243 * CONUT + 0.898 * GPS + 0.846 * mGPS”. Similarly, other equations were expressed as “Lipid = (−4.947) + 0.018 * LDL-c + 0.015 * T.chol”, “Glucose = (−5.448) + 0.594 * HbA1c + 0.0092 * FPG”, “Blood pressure = (−5.559) + 0.038 * Pulse pressure + 0.027 * systolic BP”, “Renal function = (1.151) + 0.469 * Cr + (−0.025) * eGFR”. Using these equations, we performed analysis of variance, which indicated that nutrition, lipid, and renal functions were significant predictors of risk grouping (Table 5, Figure 4).
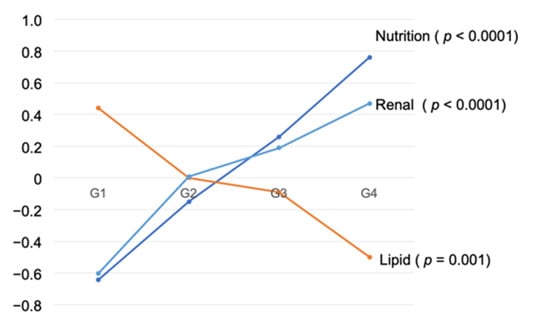
Figure 4.
Mean of synthetic variable by Four Groups.
The odds of a subject being classified into higher risk group (i.e., group membership j (=1,2,3,4) increase) were 1.26 times when value of the synthetic variable “Nutrition” increased 1 point (Table 7).
Variables with odds ratio greater than 1 had similar interpretation. On the other hand, variables with odds ratio less than 1 had reverse effects. For example, when value of the synthetic variable “Lipid” increased 1 point, the odds of a subject being classified into higher risk group were 0.88 times compared with odds of being classified into lower risk group (Table 7). The additional logistic regression model, where cancer/non-cancer was used a response factor with age and plaque area as adjusting variables, showed the insignificant increase in nutrition (Table 8). Direction of effect of each synthetic variable could be also seen in the Table 5. Finally, we were able to calculate the probability of the presence of cancer, by combining each factor and scoring (Figure 5).
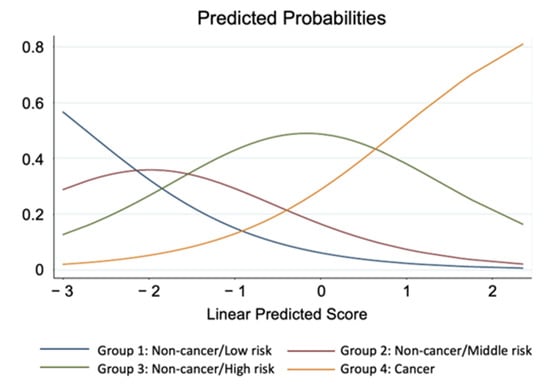
Figure 5.
Predicted probabilities of classification to 4 risk groups. Linear predicted Score is referred to as linear combination of parameter estimates with its corresponding variable scores in the ordinal logistic regression model.
4. Discussion
The major findings of the present study were that (a) the prevalence of cancer in AMI patients was 13%, (b) AMI patients with cancer were older with worse nutrition status and renal dysfunction, (c) nutrition status and renal function were consistent predictors for obtaining cancer in AMI, and (d) we were able to calculate the probability of the presence of cancer, by combining each factor and scoring. To the best of our knowledge, this is the first study that provides the evidence of differential risk factors including nutrition status in AMI patients between with and without cancer in details.
4.1. Prevalence of Cancer in AMI
In the US National Inpatient Sample database between 2004 and 2014 report, among 6,563,255 AMI patients, there were 5,966,955 with no cancer, 186,604 with current cancer (2.8%), and 409,697 with a historical diagnosis of cancer (6.2%) []. Among 175,146 patients in Swedish registries of first AMI between 2001 and 2014, there were 16,237 patients (9.3%), who had received care for cancer in the 5 years before AMI []. The prevalence of cancer in AMI patients was 13% in the present study, which was relatively higher that these nationwide data, probably because the enrolled patients in the study might have complicated conditions such as being hospitalized in our University Hospital.
4.2. Differences of Traditional Risk Factors and Nutrition Status in AMI between with and without Cancer
Hypertension, diabetes, current smoking, family history, and dyslipidemia are well known as traditional risk factors in AMI [], and it has been recently reported that aging, higher prevalence of dyslipidemia and hypertension, and lower prevalence of obesity, diabetes mellitus, and smoking were risk factors in breast cancer survivors compared with general female population []. However, the differential risk factors for AMI with cancer compared with non-cancer remains scant. The present study indicated for the first time that renal dysfunction and worse nutrition status were the strongest risk factors in AMI patients with cancer. Besides these factors, univariate analyses (Table 1) showed that AMI with cancer patients had significantly lower levels of albumin, T.chol, and LDL-c than those without cancer, which seemed to be caused by deterioration of nutrition status, which were different from traditional coronary risk factors.
4.3. Prediction and Scoring of Cancer in AMI
In the present study, we have developed formulas regarding nutrition status, lipid, glucose blood pressure, and renal function (Table 4). Using these formulas, we are able to avoid to evaluate several data separately, such as T.chol and LDL-c, or Cr and eGFR, and to consider these factors as whole. Further, we have established the predicted scoring system for AMI with cancer (Figure 5), which means that we are able to predict if the patients with AMI have cancer, by calculating this score. This might be useful in clinical settings to recognize the presence of cancer.
4.4. Limitations
Several limitations should be acknowledged in the present study. First, the present study was an observational retrospective cohort study from a single center. Thus, there might be some bias. Second, we were not able to divide cancer patients into active cancer and history of cancer, due to the limited number of patients with cancer. Also, we were not able to evaluate cancer stage in this study. Third, we were not able to distinguish coronary plaque rupture from coronary artery erosion as causes of AMI. Fourth, the enrolled patients in the present study were hospitalized in University Hospital, which may also cause some bias. Fifth, due to the limited number of enrolled patients, we were not able to examine sex-difference in the present study. Taken together, further investigations should be necessary in larger multi-center cohort studies.
5. Conclusions
The present study demonstrates that the prevalence of cancer in AMI was 13%, and that worse nutrition status and renal dysfunction were associated with AMI with cancer, in which nutrition status was a major different characteristic from non-cancer. Further, we have developed formulas to predict the presence of cancer in AMI.
Author Contributions
Conceptualization, N.I. and Y.F.; methodology, A.F. and T.K.; software, A.F. and T.K.; validation, T.K.; formal analysis, A.F.; investigation, N.I.; resources, Y.F.; data curation, N.I.; writing—original draft preparation, N.I.; writing—review and editing, Y.F.; visualization, A.F.; supervision, Y.F.; project administration, Y.F.; funding acquisition, Y.F. All authors have read and agreed to the published version of the manuscript.
Funding
This research received no external funding.
Institutional Review Board Statement
The study was conducted according to the guidelines of the Declaration of Helsinki, and approved by the institutional review board at Kurume University (No. 20181, 18 November 2020 approved).
Informed Consent Statement
Informed consent was waved due to the retrospective nature and opt-out was used in the study.
Data Availability Statement
The data presented in this paper are available on request from the corresponding author.
Conflicts of Interest
The authors declare no conflict of interest.
References
- Crea, F.; Libby, P. Acute Coronary Syndromes: The Way Forward From Mechanisms to Precision Treatment. Circulation 2017, 136, 1155–1166. [Google Scholar] [CrossRef] [PubMed]
- Libby, P.; Buring, J.E.; Badimon, L.; Hansson, G.K.; Deanfield, J.; Bittencourt, M.S.; Tokgozoglu, L.; Lewis, E.F. Atherosclerosis. Nat. Rev. Dis. Primers 2019, 5, 56. [Google Scholar] [CrossRef]
- Fukumoto, Y.; Libby, P.; Rabkin, E.; Hill, C.C.; Enomoto, M.; Hirouchi, Y.; Shiomi, M.; Aikawa, M. Statins alter smooth muscle cell accumulation and collagen content in established atheroma of watanabe heritable hyperlipidemic rabbits. Circulation 2001, 103, 993–999. [Google Scholar] [CrossRef] [PubMed]
- Libby, P.; Aikawa, M. Mechanisms of plaque stabilization with statins. Am. J. Cardiol. 2003, 91, 4B–8B. [Google Scholar] [CrossRef]
- Ahmadi, A.; Leipsic, J.; Blankstein, R.; Taylor, C.; Hecht, H.; Stone, G.W.; Narula, J. Do plaques rapidly progress prior to myocardial infarction? The interplay between plaque vulnerability and progression. Circ. Res. 2015, 117, 99–104. [Google Scholar] [CrossRef]
- Mayer, D.K.; Nasso, S.F.; Earp, J.A. Defining cancer survivors, their needs, and perspectives on survivorship health care in the USA. Lancet Oncol. 2017, 18, e11–e18. [Google Scholar] [CrossRef]
- Takahashi, M. Cancer survivorship: Current status of research, care, and policy in Japan. Jpn. J. Clin. Oncol. 2016, 46, 599–604. [Google Scholar] [CrossRef][Green Version]
- Falk, E. Pathogenesis of atherosclerosis. J. Am. Coll. Cardiol. 2006, 47, C7–C12. [Google Scholar] [CrossRef]
- Jaiswal, S.; Natarajan, P.; Silver, A.J.; Gibson, C.J.; Bick, A.G.; Shvartz, E.; McConkey, M.; Gupta, N.; Gabriel, S.; Ardissino, D.; et al. Clonal Hematopoiesis and Risk of Atherosclerotic Cardiovascular Disease. N. Engl. J. Med. 2017, 377, 111–121. [Google Scholar] [CrossRef] [PubMed]
- Pardali, E.; Dimmeler, S.; Zeiher, A.M.; Rieger, M.A. Clonal hematopoiesis, aging, and cardiovascular diseases. Exp. Hematol. 2020, 83, 95–104. [Google Scholar] [CrossRef]
- Heyde, A.; Rohde, D.; McAlpine, C.S.; Zhang, S.; Hoyer, F.F.; Gerold, J.M.; Cheek, D.; Iwamoto, Y.; Schloss, M.J.; Vandoorne, K.; et al. Increased stem cell proliferation in atherosclerosis accelerates clonal hematopoiesis. Cell 2021, 184, 1348–1361.e1322. [Google Scholar] [CrossRef] [PubMed]
- Honigberg, M.C.; Zekavat, S.M.; Niroula, A.; Griffin, G.K.; Bick, A.G.; Pirruccello, J.P.; Nakao, T.; Whitsel, E.A.; Farland, L.V.; Laurie, C.; et al. Premature Menopause, Clonal Hematopoiesis, and Coronary Artery Disease in Postmenopausal Women. Circulation 2021, 143, 410–423. [Google Scholar] [CrossRef] [PubMed]
- Ministry of Health, Labour and Welfare. Available online: https://www.mhlw.go.jp/toukei/saikin/hw/jinkou/geppo/nengai18/dl/gaikyou30.pdf (accessed on 22 June 2021).
- Li, Y.; Schoufour, J.; Wang, D.D.; Dhana, K.; Pan, A.; Liu, X.; Song, M.; Liu, G.; Shin, H.J.; Sun, Q.; et al. Healthy lifestyle and life expectancy free of cancer, cardiovascular disease, and type 2 diabetes: Prospective cohort study. BMJ 2020, 368, l6669. [Google Scholar] [CrossRef] [PubMed]
- Thygesen, K.; Alpert, J.S.; Jaffe, A.S.; Chaitman, B.R.; Bax, J.J.; Morrow, D.A.; White, H.D. Executive Group on behalf of the Joint European Society of Cardiology/American College of Cardiology/American Heart Association/World Heart Federation Task Force for the Universal Definition of Myocardial, I. Fourth Universal Definition of Myocardial Infarction (2018). Circulation 2018, 138, e618–e651. [Google Scholar] [CrossRef]
- Forrest, L.M.; McMillan, D.C.; McArdle, C.S.; Angerson, W.J.; Dunlop, D.J. Evaluation of cumulative prognostic scores based on the systemic inflammatory response in patients with inoperable non-small-cell lung cancer. Br. J. Cancer 2003, 89, 1028–1030. [Google Scholar] [CrossRef]
- Toiyama, Y.; Miki, C.; Inoue, Y.; Tanaka, K.; Mohri, Y.; Kusunoki, M. Evaluation of an inflammation-based prognostic score for the identification of patients requiring postoperative adjuvant chemotherapy for stage II colorectal cancer. Exp. Ther. Med. 2011, 2, 95–101. [Google Scholar] [CrossRef]
- Inoue, Y.; Iwata, T.; Okugawa, Y.; Kawamoto, A.; Hiro, J.; Toiyama, Y.; Tanaka, K.; Uchida, K.; Mohri, Y.; Miki, C.; et al. Prognostic significance of a systemic inflammatory response in patients undergoing multimodality therapy for advanced colorectal cancer. Oncology 2013, 84, 100–107. [Google Scholar] [CrossRef]
- de Ulibarri, J.I.; Gonzalez-Madrono, A.; de Villar, N.G.; Gonzalez, P.; Gonzalez, B.; Mancha, A.; Rodriguez, F.; Fernandez, G. CONUT: A tool for controlling nutritional status. First validation in a hospital population. Nutr. Hosp. 2005, 20, 38–45. [Google Scholar]
- Bharadwaj, A.; Potts, J.; Mohamed, M.O.; Parwani, P.; Swamy, P.; Lopez-Mattei, J.C.; Rashid, M.; Kwok, C.S.; Fischman, D.L.; Vassiliou, V.S.; et al. Acute myocardial infarction treatments and outcomes in 6.5 million patients with a current or historical diagnosis of cancer in the USA. Eur. Heart J. 2020, 41, 2183–2193. [Google Scholar] [CrossRef]
- Velders, M.A.; Hagstrom, E.; James, S.K. Temporal Trends in the Prevalence of Cancer and Its Impact on Outcome in Patients With First Myocardial Infarction: A Nationwide Study. J. Am. Heart Assoc. 2020, 9, e014383. [Google Scholar] [CrossRef]
- Kawano, H.; Soejima, H.; Kojima, S.; Kitagawa, A.; Ogawa, H.; Japanese Acute Coronary Syndrome Study (JACSS) Investigators. Sex differences of risk factors for acute myocardial infarction in Japanese patients. Circ. J. 2006, 70, 513–517. [Google Scholar] [CrossRef] [PubMed]
- Yandrapalli, S.; Malik, A.H.; Pemmasani, G.; Gupta, K.; Harikrishnan, P.; Nabors, C.; Aronow, W.S.; Cooper, H.A.; Panza, J.A.; Frishman, W.H.; et al. Risk Factors and Outcomes During a First Acute Myocardial Infarction in Breast Cancer Survivors Compared with Females Without Breast Cancer. Am. J. Med. 2020, 133, 444–451. [Google Scholar] [CrossRef] [PubMed]
Publisher’s Note: MDPI stays neutral with regard to jurisdictional claims in published maps and institutional affiliations. |
© 2021 by the authors. Licensee MDPI, Basel, Switzerland. This article is an open access article distributed under the terms and conditions of the Creative Commons Attribution (CC BY) license (https://creativecommons.org/licenses/by/4.0/).