Article

In Vitro Evaluation of Prebiotic Properties of a Commercial Artichoke Inflorescence Extract Revealed Bifidogenic Effects

1
ProDigest BV, Technologiepark 82, 9052 Ghent, Belgium
2
Center of Microbial Ecology and Technology, Ghent University, 9000 Ghent, Belgium
3
Euromed S.A., C/Rec de Dalt, 21-23, Pol. Ind. Can Magarola, Mollet del Valles, 08100 Barcelona, Spain
4
Centre for Human Psychopharmacology, Swinburne University, Melbourne, VIC 3122, Australia
5
Smidt Labs, LLC, Sandy, UT 84092, USA
6
Unitat de Farmacologia i Farmacognòsia, Facultat de Farmàcia, Universitat de Barcelona, Av. Joan XXIII, s/n. E-08028 Barcelona, Spain
*
Author to whom correspondence should be addressed.
Nutrients 2020, 12(6), 1552; https://doi.org/10.3390/nu12061552
Submission received: 1 May 2020 / Revised: 20 May 2020 / Accepted: 20 May 2020 / Published: 26 May 2020

Abstract

:
Background: Prebiotics used as a dietary supplement, stimulate health-related gut microbiota (e.g., bifidobacteria, lactobacilli, etc.). This study evaluated potential prebiotic effects of an artichoke aqueous dry extract (AADE) using in vitro gut model based on the Simulator of Human Intestinal Microbial Ecosystem (SHIME®). Methods: Short-term colonic fermentations (48 h) of AADE, fructo-oligosaccharides (FOS), and a blank were performed. Microbial metabolites were assessed at 0, 6, 24, and 48 h of colonic incubation via measuring pH, gas pressure, lactate, ammonium, and short-chain fatty acids (SCFAs) levels. Community composition was assessed via targeted qPCRs. Results: After 24 and 48 h of incubation, bifidobacteria levels increased 25-fold with AADE (p < 0.05) and >100-fold with FOS (p < 0.05) compared to blank. Lactobacillus spp. levels only tended to increase with AADE, whereas they increased 10-fold with FOS. At 6 h, pH decreased with AADE and FOS and remained stable until 48 h; however, gas pressure increased significantly till the end of study. Acetate, propionate, and total SCFA production increased significantly with both at all time-points. Lactate levels initially increased but branched SCFA and ammonium levels remained low till 48 h. Conclusion: AADE displayed prebiotic potential by exerting bifidogenic effects that stimulated production of health-related microbial metabolites, which is potentially due to inulin in AADE.

1. Introduction

Human gut microbiota consist of over 35,000 bacterial strains, encompassing beneficial and pathogenic species; however, the predominance of positively affecting microbes ensure our well-being [1]. Human gut microbiota are dominated by two main phyla, Firmicutes (including Lactobacillus spp.) and Bacteroidetes that are susceptible to alterations. Other phyla are Actinobacteria (including Bifidobacterium spp.), Proteobacteria, Fusobacteria, and Verrucomicrobia. Spatial and temporal discrepancies in gut microbial distribution contribute toward specific metabolic, immunological, and gut-protective functions throughout an individual’s life span [2,3]. Characterization of such discrepancies can help identify gut-related abnormalities and play an important role in ensuring good health [4].
Prebiotics were first defined as, “Nondigestible food ingredients that beneficially affect a host by selectively stimulating growth and/or activity of one or a limited number of bacteria in the colon that are recognized to improve host health” [5]. Dysbiosis of microbial populations has been postulated as one of the reasons for metabolic disorders such as obesity, type 2 diabetes, and nonalcoholic fatty liver diseases. As prebiotics alter microbiota positively, their use as dietary supplements could effectively improve overall host health [6]. Fructo-oligosaccharides (FOS) are prebiotics that are plant-derived, naturally occurring oligosaccharides, indigestible by human enzymes, and can thus reach the colon unaltered [7]. Daily intake of FOS can increase bifidobacteria counts, a member of the indigenous gut microbiota. However, certain individuals are more sensitive to effects of FOS and suffer side effects such as itching in the throat; puffiness in the eyes, face, and mouth; dizziness; light headedness; fainting; gas; bloating; and itching of the skin [8,9].
There is a constant need for new prebiotics that can target specific bacterial species and most approaches have focused on non-digestible oligosaccharides, such as galacto-oligosaccharides, soya-oligosaccharides, isomaltooligosaccharides, gluco-oligosaccharides, xylo-oligosaccharides, lacto-sucrose, and inulin-type fructans. However, they are known to have varied prebiotic potential. Inulin has been demonstrated to positively alter gut microbiota in a dose range of 4 to 40 g/d [10,11,12,13,14,15,16]. Whole food sources, such as artichoke (Cynara scolymus L.), chicory (Cichorium intybus) roots, and garlic (Allium sativum) are rich in inulin and dietary fibers. Inulin from artichoke is recognized to have the highest degree of polymerization known in plants. Degree of polymerization directly contributes to prebiotic effects and persistence in the colon [17]. Inulin promotes host health by positively altering the bacterial metabolites mediated via stimulation of different metabolic pathways within the gut microbial community. Acetate, propionate, and butyrate are the most crucial metabolites. By acidifying the colonic environment, short-chain fatty acids (SCFA) promote growth of beneficial bacteria such as bifidobacteria and lactobacilli, which inhibit the growth of pathogenic bacteria [18]. Additionally, bifidobacteria and lactobacilli exert immunomodulatory activity that contributes to the host defense [19]. Prebiotic potential of artichoke has been demonstrated in several clinical studies and the effect was mainly mediated via increase in Bifidobacterium spp. in the gut [20,21]. In addition to inulin, artichoke contains polyphenols, such as dicaffeoylquinic acids and flavonoids, which provide additional nutritional values proposing a novel holistic approach to whole digestive health [22,23].
In the present study, we aimed to evaluate the prebiotic effects of artichoke aqueous dry extract (AADE) through an in vitro approach of highly controlled conditions using short-term colonic incubations based on the Simulator of Human Intestinal Microbial Ecosystem (SHIME®) model [18]. In vitro models offer certain advantages, first they allow dynamic monitoring of gut microbiome at the site of fermentation under a controlled environment and second, in vitro models help avoid large variability that arise during in vivo evaluations owing to host-derived factors such as amount of food intake, immune system, enzyme levels, or transit time. Lastly, using molecular detection methods, microbial changes can be evaluated in detail. Artichoke aqueous dry extract is a standardized herbal powder extract prepared from the edible part of artichoke (Cynara scolymus L.); cultivated in Spain, and extracted by the Pure-Hydro Process™ using only water (instead of organic solvents), AADE can be safely used in foods and food supplements.

2. Materials and Methods

2.1. Chemicals and Reagents

All chemicals were obtained from Sigma-Aldrich (Overijse, Belgium), unless stated otherwise. The test product AADE, also known as Cynamed™, was provided by Euromed S.A. (Mollet del Valles, Barcelona, Spain). It is derived from the edible part of the artichoke plant (Cynara scolymus L.) cultivated in Mediterranean regions of Spain. The AADE was prepared in accordance with the European Pharmacopoeia monograph extracts (Extracta) (No. 0765) using a proprietary water-based extraction process [24]. This process starts with the milling of dried Artichoke immature edible inflorescences that are extracted with ultrapure water at a temperature between 80 °C and 90 °C. The miscella of extract is filtered until transparency and concentrated under vacuum until a soft paste is obtained that is subsequently dried in a vacuum belt dryer and finally milled to a fine powder. The AADE used in the current study has an exact content of 9.1% caffeoylquinic acids expressed as chlorogenic acid by HPLC and an exact content of 32.2% inulin determined by HPLC. As a nutritional analysis of the AADE, the amount of total carbohydrates is 77% and the amount of protein 8.1% with a negligible content of fat. The FOS preparation used as a positive control in the current study had a purity of 89% FOS with 8% sugar residues. While the degree of polymerization of the ingredient varied between 2 and 10, it was on average 4.

2.2. Short-Term Colonic Fermentation

Short-term colonic fermentations were performed as described recently [18]. Briefly, colonic background medium containing 5.2 g/L K2HPO4, 16.3 g/L KH2PO4, 2.0 g/L NaHCO3 (Chem-lab NV, Zedelgem, Belgium), 2.0 g/L Yeast Extract, 2.0 g/L pepton (Oxoid, Aalst, Belgium), 1.0 g/L mucin (Carl Roth, Karlsruhe, Germany), 0.5 g/L L-cystein, and 2.0 mL/L Tween80 (Sigma-Aldrich, Bornem, Belgium) was added to incubation reactors (90 vol%), already containing the correct amount of the test products for obtaining a final concentration of 0 g/L (Blank) or 5 g/L (for both AADE and FOS), respectively. The reactors were sealed and anaerobiosis was obtained by flushing with N2. Subsequently, fresh fecal material of a healthy human donor (no history of antibiotic use in the six months preceding the study) was collected (according to the ethical approval of the University Hospital Ghent with reference number B670201836585; 06/08/2018). After preparation of an anaerobic fecal slurry, this was inoculated at 10 vol% in the aforementioned medium. All incubations were performed in biological triplicate for 48 h at 37 °C under anaerobic conditions with continuous shaking (90 rpm).

2.3. Microbial Metabolic Activity Analysis

Microbial metabolic analyses were performed on samples collected at 0, 6, 24, and 48 h of colonic incubation and levels of pH (Senseline F410; ProSense, Oosterhout, The Netherlands), gas pressure (hand-held pressure indicator CPH6200; Wika, Echt, The Netherlands), lactate, ammonium, and short-chain fatty acids (SCFAs) were measured. Acetate, propionate, butyrate, and branched CFAs (BCFAs) (isobutyrate, isovalerate, and isocaproate) were quantified as described by De Weirdt et al. [25] via GC-FID after performing a diethyl ether extraction. Lactate determination was performed using a commercially available enzymatic assay kit (R-Biopharm, Darmstadt, Germany) as per the manufacturer’s instructions. Ammonium analysis was performed using a KjelMaster K-375 device (Büchi, Hendrik-Ido-Ambacht, The Netherlands), wherein ammonium in the sample was liberated as ammonia by addition of 32% NaOH. The released ammonia was then distilled from the sample into a 2% boric acid solution and was titrimetrically determined with a 0.02 M HCl solution.

2.4. Microbial Community Analysis

At the start of colonic incubation and after 24 and 48 h, samples were collected for microbial community analysis. DNA was isolated using the protocol as described by Vilchez-Vargas et al. [26], starting from pelleted cells originating from 1 mL luminal sample. Subsequently, quantitative polymerase chain reaction (qPCR) assays for Bacteroidetes, Firmicutes, Lactobacillus spp. (Firmicutes phylum), Bifidobacterium spp. (Actinobacteria phylum), and Akkermansia muciniphila (Verrucomicrobia phylum) were performed using a StepOnePlus™ real-time PCR system (Applied Biosystems, Foster City, CA, USA). Each sample was analyzed in triplicate. Standard curves for all the different runs had efficiencies between 90–105%. All protocols were initiated for 10 min at 95 °C and terminated with a melting curve from 60 °C to 95 °C. Cycling programs included 40 cycles with a denaturation step of 15 s at 95 °C, an annealing step of 30 s at 60 °C, and an elongation step of 30 s at 72 °C in each cycle. Descriptions of primers used are presented in Table 1.
Besides presenting the absolute levels of the different groups, the ratio between the obtained levels at 24 h and 48 h versus 0 h were calculated for the blank, AADE, and FOS-treated microbiota.

2.5. Statistics

To evaluate differences in microbial metabolites and microbial community composition between blank and treatment incubations at the different time points, a two-way ANOVA with Tukey multiple comparisons test was performed. Differences were found significant if p < 0.05. Statistical analysis was performed with the GraphPad Prism software (version 8.3.0, San Diego, USA).

3. Results

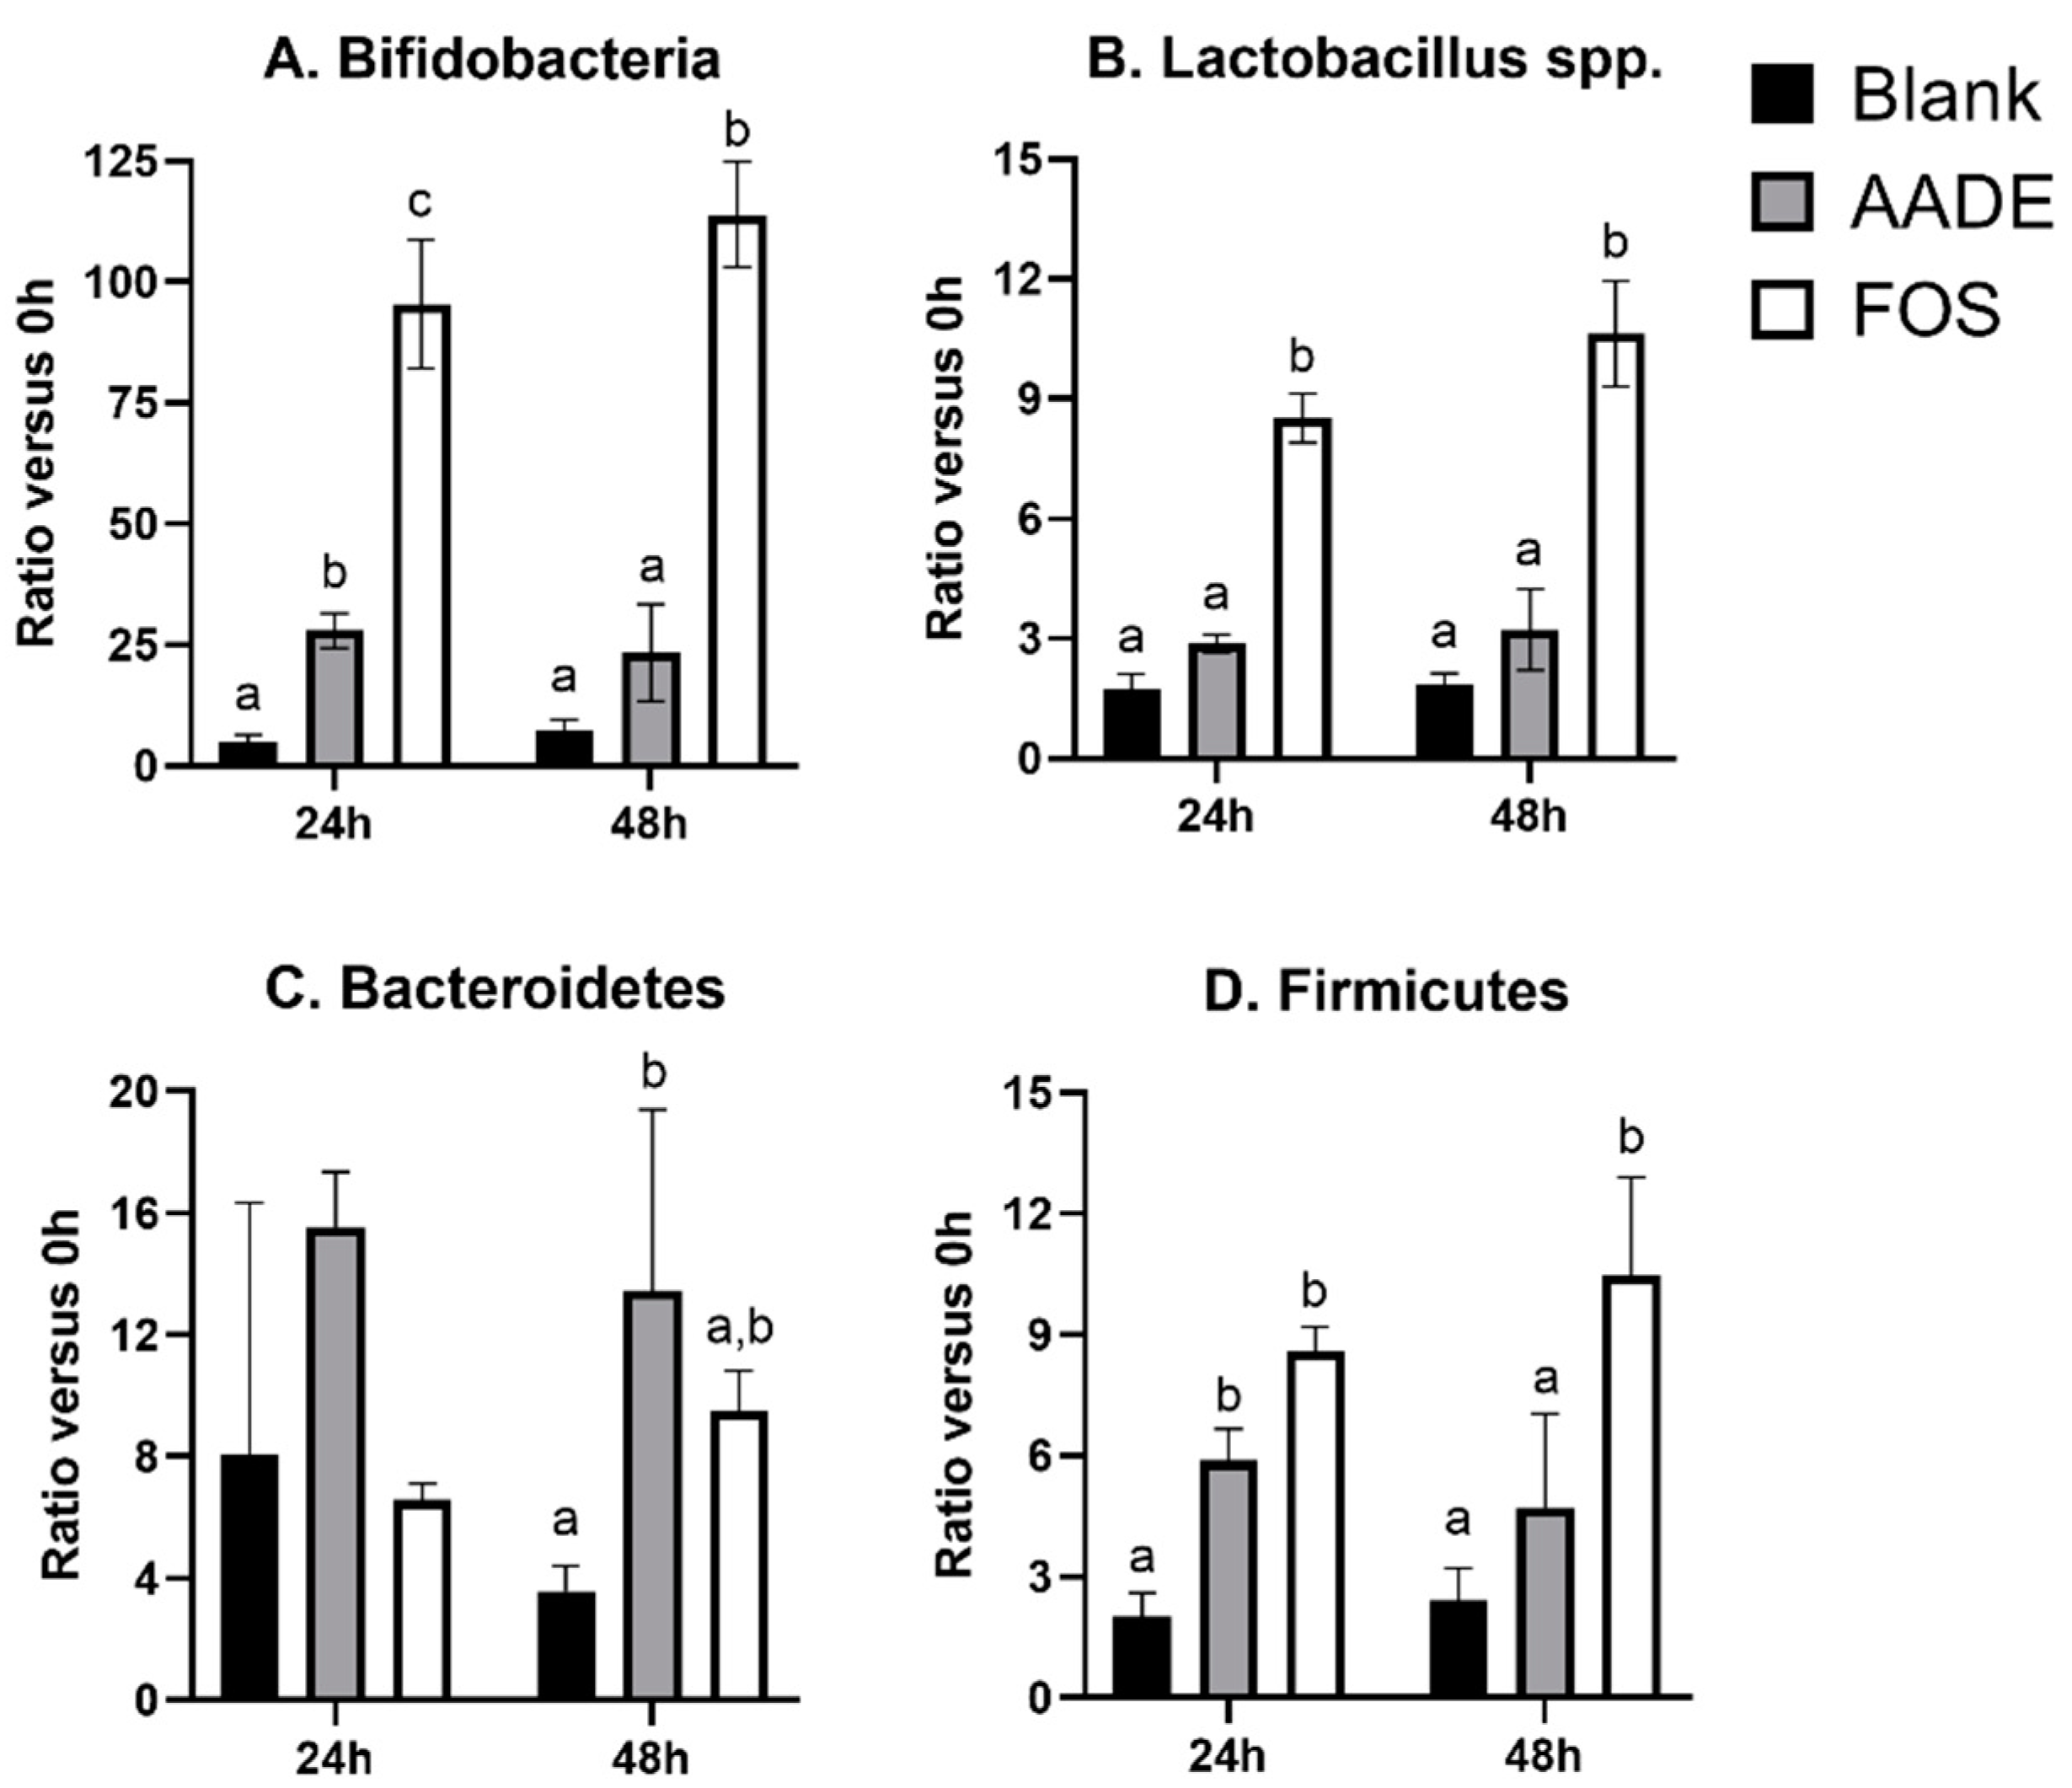
3.1. Microbial Composition

While the absolute levels of each of the five targeted microbial groups (Bifidobacterium spp., Lactobacillus spp., Bacteroidetes, Firmicutes, and Akkermansia muciniphila) at each of the three time points (0/6/48 h) are presented in Table 2, the factor increase versus 0 h is presented in Figure 1 for the four microbial groups for which there were significant changes between the treatments (all except Akkermansia muciniphila). First, both at 24 h and 48 h, bifidobacteria levels were significantly increased versus the blank for AADE but especially for FOS (Table 2). This was reflected by ~25-fold and ~100-fold increased levels versus 0 h for AADE and FOS, respectively; both after 24 h and 48 h of incubation (Figure 1A). Additionally, Lactobacillus spp. were stimulated more profoundly for FOS with ~10-fold increased levels versus 0 h at 24 and 48 h (Figure 1B). AADE exerted more attenuated effects on Lactobacillus spp. levels with only statistically significantly increased absolute levels at 48 h. Incubation with FOS increased absolute Firmicutes levels at all time points, while for AADE the increase was only significant at 24 h (Table 2 and Figure 1C). Finally, AADE increased Bacteriodetes levels versus the blank at 48 h (Table 2 and Figure 1D), while FOS decreased Akkermansia muciniphila levels versus AADE after 48 h of incubation (Table 2).

3.2. pH

A more profound decrease in pH was observed with FOS and to a lesser extent also with AADE compared with blank at 6 h (p < 0.05). The pH continued to decrease until 24 h and remained stable thereafter, indicating continued microbial fermentation (Table 3).

3.3. Gas Pressure

As noted in Table 3, as compared with the blank, gas pressure was significant with AADE and FOS on all the time points along the incubation. On all time points, gas production was significantly higher for FOS versus AADE (Table 3).

3.4. Lactate and Carbohydrate (SCFAs, Acetate, Butyrate, and Propionate) and Protein Metabolites (BCFAs and Ammonium)

Compared with the blank, total SCFAs were significantly increased with AADE and FOS at all time-points of incubation (p < 0.05), which reflected enhanced microbial metabolic activity upon AADE/FOS administration. However, the overall increase in total SCFAs was higher with FOS compared with AADE (Table 4). Similar patterns of increase in acetate and propionate levels were observed with AADE and FOS as for the total SCFA (Table 4). In contrast, butyrate concentrations were only significantly increased for FOS, and this after 24 h and 48 h.
As shown in Table 4, no BCFAs were produced during the initial 6 h of incubation in AADE and FOS. After 24 h of incubation, there was a similar production of BCFAs in the blank (1.34 ± 0.24) and upon AADE treatment (1.70 ± 0.37). In contrast, no BCFAs were produced upon FOS administration at the 24 h time point. After 48 h of incubation, BCFAs were produced but were significantly (p < 0.05) lower for both AADE (3.42 ± 0.02) and especially FOS (0.34 ± 0.26) when compared with the blank (4.01 ± 0.13). The results for ammonium, another marker for protein fermentation, were similar to those for BCFAs, indicating reduced protein fermentation upon AADE and especially FOS administration. Lactate levels were high (p < 0.05) with AADE and even further increased for FOS compared with blank after the initial 6 h of incubation. Thereafter, lactate levels decreased indicating lactate consumption.

4. Discussion

In the present study, although the effects of AADE on microbial activity and composition were milder as compared to the “gold standard” prebiotic FOS, AADE demonstrated marked prebiotic potential. First, AADE significantly decreased pH and increased gas production, which indicated overall increased microbial activity upon administration of the test product. Saccharolytic metabolites such as acetate and propionate, and thus also total SCFAs, increased, while levels of proteolytic metabolites, BCFAs, and ammonium, significantly decreased upon AADE administration at 48 h. A key finding of this study was the growth-promoting action of AADE, mostly on bifidobacteria which are regarded as health-related members of the intestinal microbiome. Further, AADE also affected Bacteroidetes, Firmicutes, and Lactobacillus spp. levels.
Based on results of this study, bifidogenic effects of AADE were milder, yet in the same order of magnitude as those of FOS. These findings were similar to those of a previous in vitro study conducted by Barszcz M et al. [28]. Bifidogenic effects were also reported in healthy volunteers [20,21]. The bifidogenic effect of artichoke has been attributed to its inulin content. Inulin exerts most physiological changes through the bacterial metabolites. SCFAs are some of the important metabolites that acidify the colonic environment promoting growth of beneficial bacteria, such as Lactobacillus spp. and bifidobacteria, and prevent growth of pathogenic bacteria [30,31].
Moreover, in our study, lactate was produced during the initial 6 h of incubation. Subsequently, lactate was consumed and coincided with an increase in propionate levels for both AADE and FOS, with most marked stimulations being noted for FOS. Butyrate was not stimulated by AADE, suggesting that the majority of lactate (that can be used as a substrate for both propionate and butyrate), was cross-fed to propionate upon AADE supplementation. Some Negativicutes (family Veillonellaceae, phylum Firmicutes) are shown to form propionate [32] and could potentially explain the increase of Firmicutes that was observed for AADE after 24 h in our study. Bacteroidetes also contain potent propionate producers [33,34] and could have further contributed to propionate production upon AADE supplementation since AADE also stimulated this phylum in our study. These alterations in propionate levels correlate with the inulin content of the artichoke [18]. Propionate metabolites have been shown to reduce cholesterol and fatty acid synthesis in liver, improve glucose metabolism, and regulate immune status in adipose tissue, and thus elicit health-promoting activities [18,35]. Finally, another key propionate producer is the mucin-degrading, acetate and propionate producing, Akkermansia muciniphila. This taxon was not increased for either AADE or FOS and even decreased upon FOS administration. This was likely due to the fact that FOS more strongly decreased the pH (to 5.66 within 24 h), which is a pH at which Akkermansia muciniphila is unable to grow [36]. In vivo, such lower pH could however boost mucin secretion and result in enhanced mucin degradation by Akkermansia muciniphila in the distal colon, as shown for inulin in humanized rats [37].
Similarly, acetate and lactate can be cross-fed to butyrate by members of the Ruminococcaceae, Lachnospiraceae, Clostridiaceae, Eubacteriaceae, all members of the Firmicutes phylum [18,38]. Butyrate is a major energy source for the gut microbiota and may also reduce oxidative stress, improve gut function, and restrict inflammatory response. In this study, butyrate levels were increased majorly with FOS and were usually produced during the later stage of incubation period. As our study duration was limited to 48 h, additional studies with longer incubation periods are warranted to make accurate conclusions. Moreover, cross-feeding between microbial communities should be taken into account when drawing definite conclusions [39].
Furthermore, propionate and acetate have been shown to stimulate release of peptide hormones leading to short-term signaling of satiation and satiety to appetite centers in the brain, resulting in reduced food intake by the host [35,40,41]. Several metabolic disorders such as obesity, insulin resistance, and metabolic syndrome are associated with impaired carbohydrate and lipid metabolism by the host, and are accompanied by changes in the gut microbiota [32]. Inulin could stimulate different metabolic pathways within the gut microbial community and could potentially elicit varied health-promoting activities [18].
Ammonia and BCFAs are toxic metabolites produced from protein fermentation [39]. In this investigation, the reduction in BCFAs and ammonia production in part explains the increase in carbohydrate metabolism. In vivo studies have also demonstrated that generation and accumulation of ammonia can be reduced by lowering protein supply and by colonic fermentation of suitable non-digestible carbohydrates from food [39,42].
Short-term colonic incubations have often been used to gather information on the prebiotic potential of novel ingredients. Results of the present study using an incubation strategy based on the SHIME® model indicate the prebiotic potential of AADE. These findings could be further validated using different models, such as M-SHIME® (Mucosal Simulator of the Human Intestinal Microbial Ecosystem) which focuses not only on luminal but also mucosal gut-colonizing microbes [43]. Moreover, studies with repeated administration are required in order to simulate gradual changes that occur in vivo with long-term use and to assess any beneficial microbial shift.

5. Conclusions

The present preliminary evaluation, conducted using the SHIME® model, demonstrated that AADE has promising prebiotic potential. Incubation with AADE resulted in an increase of beneficial microbes, which was correlated with their metabolite profile. The promising results of this study justify future investigations using multiple doses in upgraded models to further validate these findings.

Author Contributions

Conceptualization, M.M.; study method, investigation, and data analysis, P.V.d.A. and J.G.; funding acquisition, A.V. and A.Z.; and writing—original draft, reviewing, and editing manuscript, all authors. All authors have read and agreed to the published version of the manuscript.

Funding

The study was funded by Euromed S.A.

Acknowledgments

Authors acknowledge CBCC Global Research for providing statistical analysis and medical writing assistance in the development of this manuscript, which was funded by Euromed S.A.

Conflicts of Interest

A.V., A.Z., and E.R. are employed by Euromed S.A. The study funders (Euromed S.A.) had no role in the design, collection, or analysis of the data.

References

  1. Frank, D.N.; Amand, A.L.S.; Feldman, R.A.; Boedeker, E.C.; Harpaz, N.; Pace, N.R. Molecular-phylogenetic characterization of microbial community imbalances in human inflammatory bowel diseases. Proc. Natl. Acad. Sci. 2007, 104, 13780–13785. [Google Scholar] [CrossRef] [PubMed] [Green Version]
  2. Jandhyala, S.M.; Talukdar, R.; Subramanyam, C.; Vuyyuru, H.; Sasikala, M.; Reddy, D.N. Role of the normal gut microbiota. World J. Gastroenterol. 2015, 21, 8787. [Google Scholar] [CrossRef] [PubMed]
  3. Jandhyala, S.M.; Madhulika, A.; Deepika, G.; Rao, G.V.; Reddy, D.N.; Subramanyam, C.; Sasikala, M.; Talukdar, R. Altered intestinal microbiota in patients with chronic pancreatitis: Implications in diabetes and metabolic abnormalities. Sci. Rep. 2017, 7, 43640. [Google Scholar] [CrossRef] [Green Version]
  4. Blaser, M.J. The microbiome revolution. J. Clin. Investig. 2014, 124, 4162–4165. [Google Scholar] [CrossRef] [PubMed] [Green Version]
  5. Gibson, G.R.; Roberfroid, M.B. Dietary modulation of the human colonic microbiota: Introducing the concept of prebiotics. J. Nutr. 1995, 125, 1401–1412. [Google Scholar] [CrossRef] [PubMed]
  6. A. Parnell, J.; A. Reimer, R. Prebiotic fiber modulation of the gut microbiota improves risk factors for obesity and the metabolic syndrome. Gut Microbes 2012, 3, 29–34. [Google Scholar] [CrossRef] [PubMed] [Green Version]
  7. Oku, T.; Tokunaga, T.; Hosoya, N. Nondigestibility of a new sweetener, “Neosugar”, in the rat. J. Nutr. 1984, 114, 1574–1581. [Google Scholar] [CrossRef]
  8. Spiegel, J.E.; Rose, R.; Karabell, P.; Frankos, V.H.; Schmitt, D.F. Safety and benefits of fructooligosaccharides as food ingredients. Food Technol. (Chic.) 1994, 48, 85–89. [Google Scholar]
  9. Johnson, J. Are Fructooligosaccharides Safe? In Medical News Today. Available online: https://www.medicalnewstoday.com/articles/319299.php (accessed on 15 October 2018).
  10. Williams, C.; Witherly, S.; Buddington, R. Influence of dietary neosugar on selected bacterial groups of the human faecal microbiota. Microb. Ecol. Health Dis. 1994, 7, 91–97. [Google Scholar] [CrossRef]
  11. Gibson, G.R.; Beatty, E.R.; Wang, X.; Cummings, J.H. Selective stimulation of bifidobacteria in the human colon by oligofructose and inulin. Gastroenterology 1995, 108, 975–982. [Google Scholar] [CrossRef]
  12. Buddington, R.K.; Williams, C.H.; Chen, S.-C.; Witherly, S.A. Dietary supplement of neosugar alters the fecal flora and decreases activities of some reductive enzymes in human subjects. Am. J. Clin. Nutr. 1996, 63, 709–716. [Google Scholar] [CrossRef] [PubMed] [Green Version]
  13. Kleessen, B.; Sykura, B.; Zunft, H.-J.; Blaut, M. Effects of inulin and lactose on fecal microflora, microbial activity, and bowel habit in elderly constipated persons. Am. J. Clin. Nutr. 1997, 65, 1397–1402. [Google Scholar] [CrossRef] [PubMed]
  14. Bouhnik, Y.; Vahedi, K.; Achour, L.; Attar, A.; Salfati, J.; Pochart, P.; Marteau, P.; Flourie, B.; Bornet, F.; Rambaud, J.-C. Short-chain fructo-oligosaccharide administration dose-dependently increases fecal bifidobacteria in healthy humans. J. Nutr. 1999, 129, 113–116. [Google Scholar] [CrossRef] [Green Version]
  15. Kruse, H.-P.; Kleessen, B.; Blaut, M. Effects of inulin on faecal bifidobacteria in human subjects. Br. J. Nutr. 1999, 82, 375–382. [Google Scholar] [CrossRef] [PubMed] [Green Version]
  16. Den Hond, E.; Geypens, B.; Ghoos, Y. Effect of high performance chicory inulin on constipation. Nutr. Res. 2000, 20, 731–736. [Google Scholar] [CrossRef]
  17. Van De Wiele, T.; Boon, N.; Possemiers, S.; Jacobs, H.; Verstraete, W. Inulin-type fructans of longer degree of polymerization exert more pronounced in vitro prebiotic effects. J. Appl. Microbiol. 2007, 102, 452–460. [Google Scholar] [CrossRef]
  18. Van den Abbeele, P.; Taminiau, B.; Pinheiro, I.; Duysburgh, C.; Jacobs, H.; Pijls, L.; Marzorati, M. Arabinoxylo-Oligosaccharides and Inulin Impact Inter-Individual Variation on Microbial Metabolism and Composition, Which Immunomodulates Human Cells. J. Agric. Food Chem. 2018, 66, 1121–1130. [Google Scholar] [CrossRef]
  19. Hardy, H.; Harris, J.; Lyon, E.; Beal, J.; Foey, A.D. Probiotics, prebiotics and immunomodulation of gut mucosal defences: Homeostasis and immunopathology. Nutrients 2013, 5, 1869–1912. [Google Scholar] [CrossRef]
  20. Kleessen, B.; Schwarz, S.; Boehm, A.; Fuhrmann, H.; Richter, A.; Henle, T.; Krueger, M. Jerusalem artichoke and chicory inulin in bakery products affect faecal microbiota of healthy volunteers. Br. J. Nutr. 2007, 98, 540–549. [Google Scholar] [CrossRef] [Green Version]
  21. Costabile, A.; Kolida, S.; Klinder, A.; Gietl, E.; Bäuerlein, M.; Frohberg, C.; Landschütze, V.; Gibson, G.R. A double-blind, placebo-controlled, cross-over study to establish the bifidogenic effect of a very-long-chain inulin extracted from globe artichoke (Cynara scolymus) in healthy human subjects. Br. J. Nutr. 2010, 104, 1007–1017. [Google Scholar] [CrossRef] [Green Version]
  22. D’Antuono, I.; Garbetta, A.; Linsalata, V.; Minervini, F.; Cardinali, A. Polyphenols from artichoke heads (Cynara cardunculus (L.) subsp. scolymus Hayek): In vitro bio-accessibility, intestinal uptake and bioavailability. Food Funct. 2015, 6, 1268–1277. [Google Scholar] [PubMed]
  23. Rocchetti, G.; Giuberti, G.; Lucchini, F.; Lucini, L. Polyphenols and sesquiterpene lactones from artichoke heads: Modulation of starch digestion, gut bioaccessibility, and bioavailability following in vitro digestion and large intestine fermentation. Antioxidants 2020, 9, 306. [Google Scholar] [CrossRef] [PubMed] [Green Version]
  24. Council of Europe. European Pharmacopoeia; Council of Europe: Strasbourg, France, Ph. Eur. 10.1 04/2019:0765.
  25. De Weirdt, R.; Possemiers, S.; Vermeulen, G.; Moerdijk-Poortvliet, T.C.; Boschker, H.T.; Verstraete, W.; Van de Wiele, T. Human faecal microbiota display variable patterns of glycerol metabolism. FEMS Microbiol. Ecol. 2010, 74, 601–611. [Google Scholar] [CrossRef] [PubMed] [Green Version]
  26. Vilchez-Vargas, R.; Geffers, R.; Suarez-Diez, M.; Conte, I.; Waliczek, A.; Kaser, V.S.; Kralova, M.; Junca, H.; Pieper, D.H. Analysis of the microbial gene landscape and transcriptome for aromatic pollutants and alkane degradation using a novel internally calibrated microarray system. Environ. Microbiol. 2013, 15, 1016–1039. [Google Scholar] [CrossRef] [PubMed]
  27. Freire, F.C.; Adorno, M.A.T.; Sakamoto, I.K.; Antoniassi, R.; Chaves, A.C.S.D.; Dos Santos, K.M.O.; Sivieri, K. Impact of multi-functional fermented goat milk beverage on gut microbiota in a dynamic colon model. Food Res. Int. 2017, 99, 315–327. [Google Scholar] [CrossRef] [Green Version]
  28. Barszcz, M.; Taciak, M.; Skomiał, J. The effects of inulin, dried Jerusalem artichoke tuber and a multispecies probiotic preparation on microbiota ecology and immune status of the large intestine in young pigs. Arch. Anim. Nutr. 2016, 70, 278–292. [Google Scholar] [CrossRef]
  29. Van Hoek, M.J.; Merks, R.M. Emergence of microbial diversity due to cross-feeding interactions in a spatial model of gut microbial metabolism. BMC Syst. Biol. 2017, 11, 56. [Google Scholar]
  30. Cummings, J.H.; Macfarlane, G.T.; Englyst, H.N. Prebiotic digestion and fermentation. Am. J. Clin. Nutr. 2001, 73, 415s–420s. [Google Scholar] [CrossRef]
  31. Blaut, M. Relationship of prebiotics and food to intestinal microflora. Eur. J. Nutr. 2002, 41, i11–i16. [Google Scholar] [CrossRef]
  32. Rios-Covian, D.; Salazar, N.; Gueimonde, M.; de Los Reyes-Gavilan, C.G. Shaping the Metabolism of Intestinal Bacteroides Population through Diet to Improve Human Health. Front. Microbiol. 2017, 8, 376. [Google Scholar] [CrossRef] [Green Version]
  33. Aguirre, M.; Eck, A.; Koenen, M.E.; Savelkoul, P.H.; Budding, A.E.; Venema, K. Diet drives quick changes in the metabolic activity and composition of human gut microbiota in a validated in vitro gut model. Res. Microbiol. 2016, 167, 114–125. [Google Scholar] [CrossRef]
  34. Salonen, A.; Lahti, L.; Salojärvi, J.; Holtrop, G.; Korpela, K.; Duncan, S.H.; Date, P.; Farquharson, F.; Johnstone, A.M.; Lobley, G.E.; et al. Impact of diet and individual variation on intestinal microbiota composition and fermentation products in obese men. ISME J. 2014, 8, 2218–2230. [Google Scholar] [CrossRef] [PubMed]
  35. Chambers, E.S.; Viardot, A.; Psichas, A.; Morrison, D.J.; Murphy, K.G.; Zac-Varghese, S.E.; MacDougall, K.; Preston, T.; Tedford, C.; Finlayson, G.S. Effects of targeted delivery of propionate to the human colon on appetite regulation, body weight maintenance and adiposity in overweight adults. Gut 2015, 64, 1744–1754. [Google Scholar] [CrossRef] [PubMed] [Green Version]
  36. Herreweghen, F.; Van den Abbeele, P.; De Mulder, T.; De Weirdt, R.; Geirnaert, A.; Hernandez-Sanabria, E.; Vilchez-Vargas, R.; Jauregui, R.; Pieper, D.H.; Belzer, C.; et al. In vitro colonisation of the distal colon by Akkermansia muciniphila is largely mucin and pH dependent. Benef. Microbes 2017, 8, 81–96. [Google Scholar] [CrossRef] [PubMed] [Green Version]
  37. Van den Abbeele, P.; Gérard, P.; Rabot, S.; Bruneau, A.; El Aidy, S.; Derrien, M.; Kleerebezem, M.; Zoetendal, E.G.; Smidt, H.; Verstraete, W.; et al. Arabinoxylans and inulin differentially modulate the mucosal and luminal gut microbiota and mucin-degradation in humanized rats. Environ. Microbiol. 2011, 13, 2667–2680. [Google Scholar] [CrossRef] [PubMed]
  38. Baxter, N.T.; Schmidt, A.W.; Venkataraman, A.; Kim, K.S.; Waldron, C.; Schmidt, T.M. Dynamics of Human Gut Microbiota and Short-Chain Fatty Acids in Response to Dietary Interventions with Three Fermentable Fibers. mBio 2019, 10, e02566-18. [Google Scholar] [CrossRef] [Green Version]
  39. Maathuis, A.J.; van den Heuvel, E.G.; Schoterman, M.H.; Venema, K. Galacto-oligosaccharides have prebiotic activity in a dynamic in vitro colon model using a 13C-labeling technique. J. Nutr. 2012, 142, 1205–1212. [Google Scholar] [CrossRef] [Green Version]
  40. Tolhurst, G.; Heffron, H.; Lam, Y.S.; Parker, H.E.; Habib, A.M.; Diakogiannaki, E.; Cameron, J.; Grosse, J.; Reimann, F.; Gribble, F.M. Short-chain fatty acids stimulate glucagon-like peptide-1 secretion via the G-protein–coupled receptor FFAR2. Diabetes 2012, 61, 364–371. [Google Scholar] [CrossRef] [Green Version]
  41. Freeland, K.R.; Wolever, T.M. Acute effects of intravenous and rectal acetate on glucagon-like peptide-1, peptide YY, ghrelin, adiponectin and tumour necrosis factor-α. Br. J. Nutr. 2010, 103, 460–466. [Google Scholar] [CrossRef] [Green Version]
  42. Geboes, K.P.; De Hertogh, G.; De Preter, V.; Luypaerts, A.; Bammens, B.; Evenepoel, P.; Ghoos, Y.; Geboes, K.; Rutgeerts, P.; Verbeke, K. The influence of inulin on the absorption of nitrogen and the production of metabolites of protein fermentation in the colon. Br. J. Nutr. 2006, 96, 1078–1086. [Google Scholar] [CrossRef] [Green Version]
  43. Van den Abbeele, P.; Roos, S.; Eeckhaut, V.; MacKenzie, D.A.; Derde, M.; Verstraete, W.; Marzorati, M.; Possemiers, S.; Vanhoecke, B.; Van Immerseel, F. Incorporating a mucosal environment in a dynamic gut model results in a more representative colonization by lactobacilli. Microb. Biotechnol. 2012, 5, 106–115. [Google Scholar] [CrossRef] [PubMed] [Green Version]
Figure 1. Mean (±standard deviation) ratios of (A) Bifidobacterium spp., (B) Lactobacillus spp., (C) Firmicutes, and (D) Bacteroidetes levels after 24 h or 48 h of treatment of a simulated colonic microbiota with 5 g/L AADE (artichoke aqueous dry extract) or FOS (fructo-oligosaccharides) versus the initial levels (24 h/0 h or 48 h/0 h, respectively) as measured via quantitative polymerase chain reaction (qPCR). For each microbial group and within each time point (24 or 48 h), a bar indicated with a different letter (a, b, or c) indicates a statistical difference between AADE, FOS, and/or the blank at a given time point, as tested with a two-way ANOVA with post-hoc Tukey test (p < 0.05). In contrast, when at least one letter is shared between two bars, there was no significant between these treatments.
Nutrients 12 01552 g001
Table 1. Primers used for quantitative polymerase chain reaction (qPCR) quantification of species-specific 16S rDNA.
Target SpeciesPrimer Sequences 5′-3′ and 3′-5′
Bacteroidetes [27]GGAACATGTGGTTTAATTCGATGAT
AGCTGACGACAACCATGCAG
Firmicutes [27]GGAGCATGTGGTTTAATTCGAAGCA
AGCTGACGACAACCATGCAC
Lactobacillus spp. [20]AGCAGTAGGGAATCTTCCA
CGCCACTGGTGTTCYTCCATATA
Bifidobacterium spp. [28]TCGCGTCYGGTGTGAAAG
CCACATCCAGCYTCCAC
Akkermansia muciniphila [29]CAGCACGTGAAGGTGGGGAC
CCTTGCGGTTGGCTTCAGAT
Table 2. Mean (±standard deviation) levels of microbial groups as measured via quantitative polymerase chain reaction (qPCR) after 0, 24, and 48 h of treatment of a simulated colonic microbiota with 5 g/L AADE (artichoke aqueous dry extract) or FOS (fructo-oligosaccharides). For each microbial group and within each time point (24 h or 48 h), a value indicated with a different letter (a, b, or c) indicates a statistical difference between AADE, FOS, and/or the blank, as tested with a two-way ANOVA with post-hoc Tukey test (p < 0.05). In contrast, when at least one letter is shared between two treatments, there was no significant between these groups.
Levels of Microbial Groups (log (16S rRNA Copies/mL))
Incubation Time (h)0 h24 h48 h
BlankAADEFOSBlankAADEFOS
Firmicutes9.96 ± 0.3610.36 ± 0.13 a10.83 ± 0.06 b11.00 ± 0.03 b10.44 ± 0.14 a10.70 ± 0.25 a11.08 ± 0.10 b
Bacteroidetes9.73 ± 0.4610.64 ± 0.4711.09 ± 0.0510.72 ± 0.0410.44 ± 0.10 a10.99 ± 0.23 b10.87 ± 0.06 a,b
Bifidobacteria8.26 ± 0.258.94 ± 0.13 a9.71 ± 0.06 b10.24 ± 0.06 c9.12 ± 0.14 a9.60 ± 0.22 b10.32 ± 0.04 c
Lactobacillus spp.6.58 ± 0.196.84 ± 0.10 a7.06 ± 0.03 a7.54 ± 0.03 b6.87 ± 0.06 a7.01 ± 0.15 b7.63 ± 0.06 c
Akkermansia mucinphila7.02 ± 0.518.23 ± 0.398.30 ± 0.037.72 ± 0.088.08 ± 0.17 a,b8.19 ± 0.25 b7.85 ± 0.08 a
Table 3. Mean (±standard deviation) pH and gas pressure after 0, 6, 24, and 48 h of treatment of a simulated colonic microbiota with 5 g/L AADE (artichoke aqueous dry extract) or FOS (fructo-oligosaccharides). For each time point (0, 6, 24, or 48 h), a value indicated with a different letter (a, b, or c) indicates a statistical difference between AADE, FOS, and/or the blank as tested with a two-way ANOVA with post-hoc Tukey test (p < 0.05).
Incubation Time (h)pH
BlankAADEFOS
06.49 ± 0.026.51 ± 0.006.51 ± 0.00
66.39 ± 0.01 a6.22 ± 0.01 b5.64 ± 0.13 c
246.46 ± 0.02 a6.21 ± 0.01 b5.66 ± 0.02 c
486.40 ± 0.04 a6.20 ± 0.02 b5.69 ± 0.03 c
Incubation Time (h)Gas Pressure(kPa)
BlankAADEFOS
6 h13.2 ± 0.2 a22.8 ± 1.6 b29.9 ± 1.6 c
24 h27.3 ± 0.6 a45.5 ± 0.5 b 52.0 ± 2.8 c
48 h31.4 ± 0.6 a48.8 ± 0.6 b 54.2 ± 1.1 c
Table 4. Mean (±standard deviation) carbohydrate- and protein-derived metabolites after 0, 24, and 48 h of treatment of a simulated colonic microbiota with 5 g/L AADE (artichoke aqueous dry extract) or FOS (fructo-oligosaccharides). For each endpoint and within each time point (24 h or 48 h), a value indicated with a different letter (a, b, or c) indicates a statistical difference between AADE, FOS and/or the blank, as tested with a two-way ANOVA with post-hoc Tukey test (p < 0.05). In contrast, when at least one letter is shared between two treatments, there was no significant between these groups.
Incubation Time (h)6 h24 h48 h
Blank AADEFOSBlankAADEFOSBlank AADEFOS
Carbohydrate Metabolite Levels (mean ± SD) (mM)
Acetate8.1 ± 0.3 a17.2 ± 1.0 b31.4 ± 3.0 c 19.2 ± 0.3 a34.9 ± 0.3 b40.1 ± 0.4 c20.8 ± 0.3 a37.1 ± 0.9 b43.7 ± 0.7 c
Butyrate0.41 ± 0.030.26 ± 0.050.48 ± 0.012.47 ± 0.03 a2.89 ± 0.53 a5.53 ± 0.64 b3.78 ± 0.02 a3.9 ± 0.55 a7.17 ± 0.22 b
Propionate3.5 ± 0.2 a7.6 ± 0.6 b8.7 ± 0.8 c7.1 ± 0.1 a15.6 ± 0.2 b23.6 ± 0.6 c7.8 ± 0.20 a16.3 ± 0.4 b24.1 ± 0.6 c
Total SCFAs12.1 ± 0.5 a25.0 ± 1.6 b40.6 ± 3.9 c31.6 ± 0.4 a56.7 ± 0.5 b69.5 ± 0.9 c38.3 ± 0.7 a65.6 ± 1.2 b75.7 ± 0.8 c
Lactate
(mean ± SD)
(mM)
1.55 ± 0.03 a3.79 ± 0.04 b8.84 ± 1.16 c0.25 ± 0.010.33 ± 0.070.85 ± 0.780.49 ± 0.050.47 ± 0.210.10 ± 0.07
Protein Metabolite Levels (mean ± SD) (mg/L)
BCFAs0.10 ± 0.000.00 ± 0.000.00 ± 0.001.34 ± 0.24 a1.70 ± 0.37 a0.00 ± 0.00 b4.01 ± 0.13 a3.42 ± 0.02 b0.34 ± 0.26 c
Ammonium0 ± 00 ± 00 ± 0328 ± 1 a322 ± 7 a122 ± 5 b414 ± 3 a384 ± 13 b1874 ± 12 c
BCFAs, branched short-chain fatty acid; SCFAs, short-chain fatty acids.

