Propolis as a Potential Disease-Modifying Strategy in Parkinson’s disease: Cardioprotective and Neuroprotective Effects in the 6-OHDA Rat Model

 , , , ,
Abstract
1. Introduction
2. Materials and Methods
2.1. Animals
2.2. Study Design
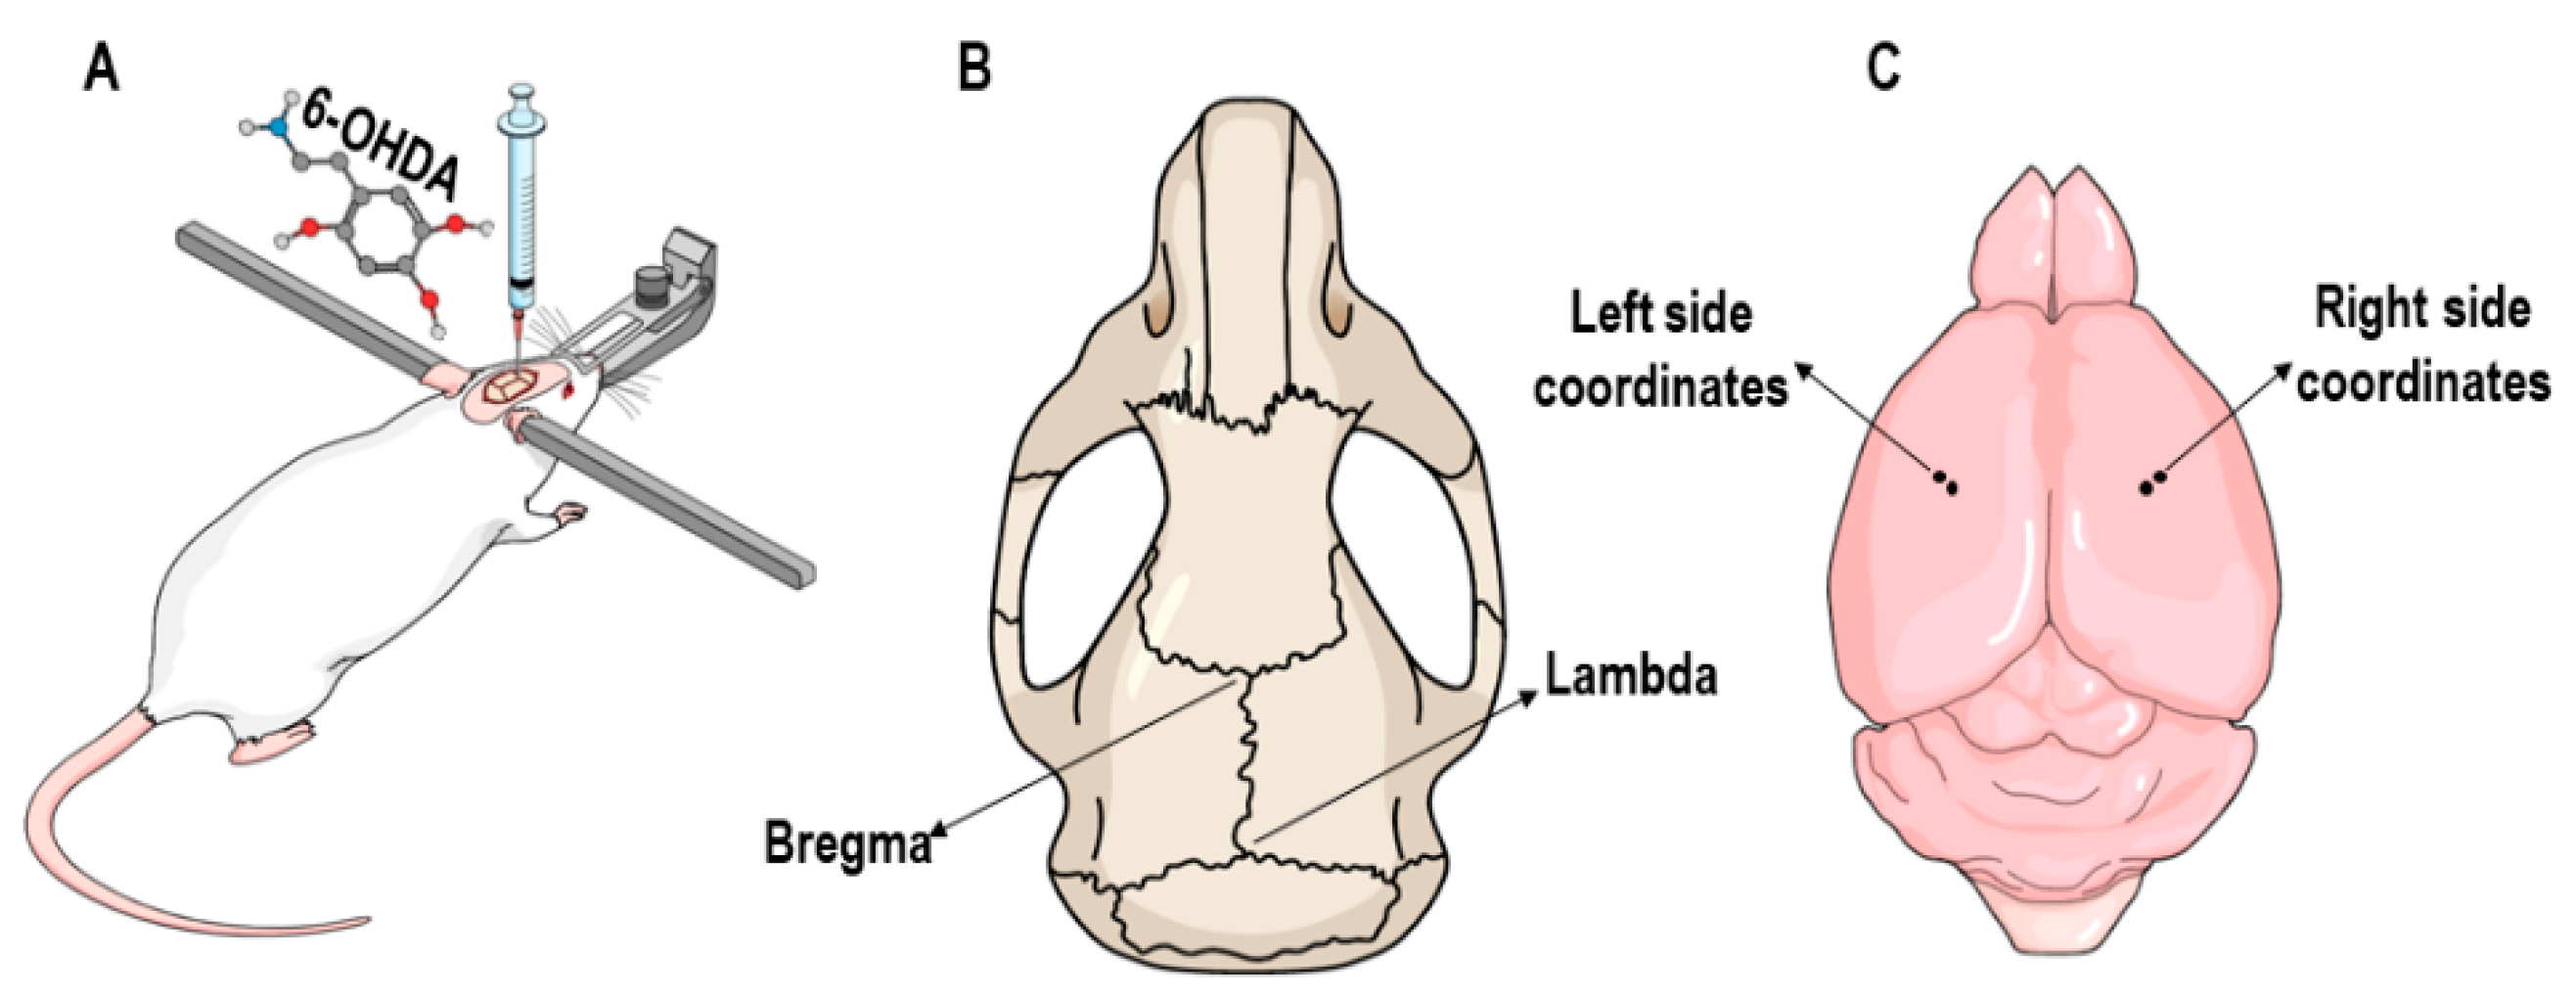
2.3. 6-OHDA Lesion
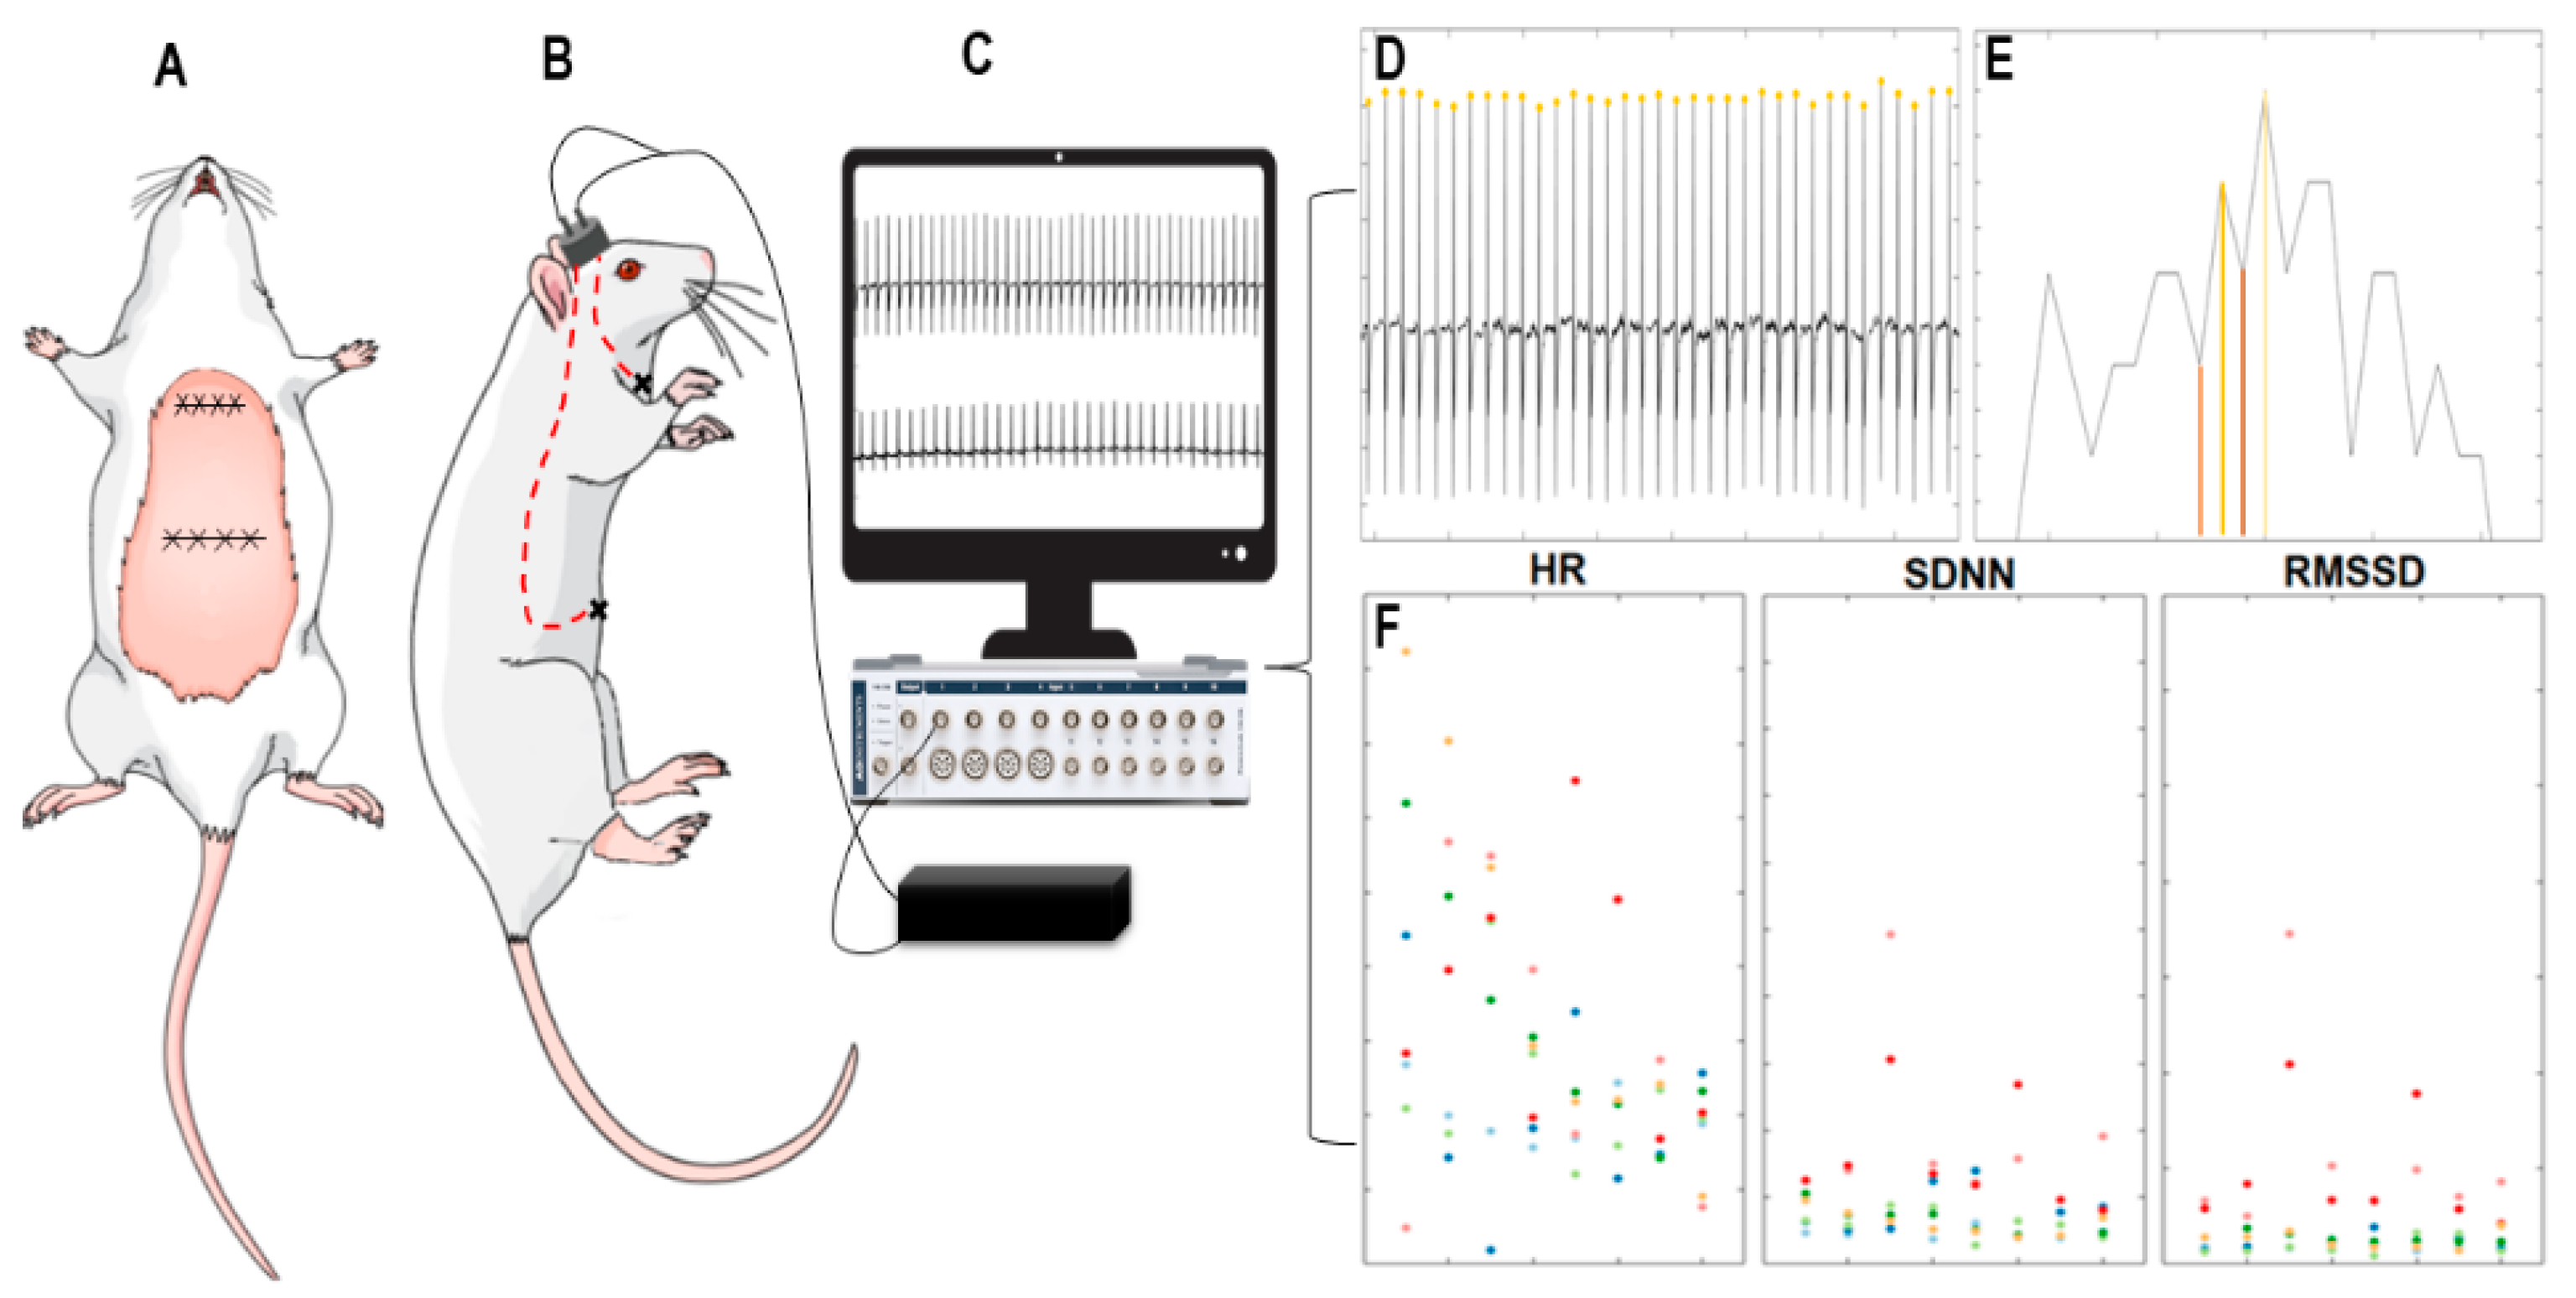
2.4. Implantation of Cardiac Electrodes and Electrocardiogram
2.5. Propolis Gavage
2.6. Animal Weighing
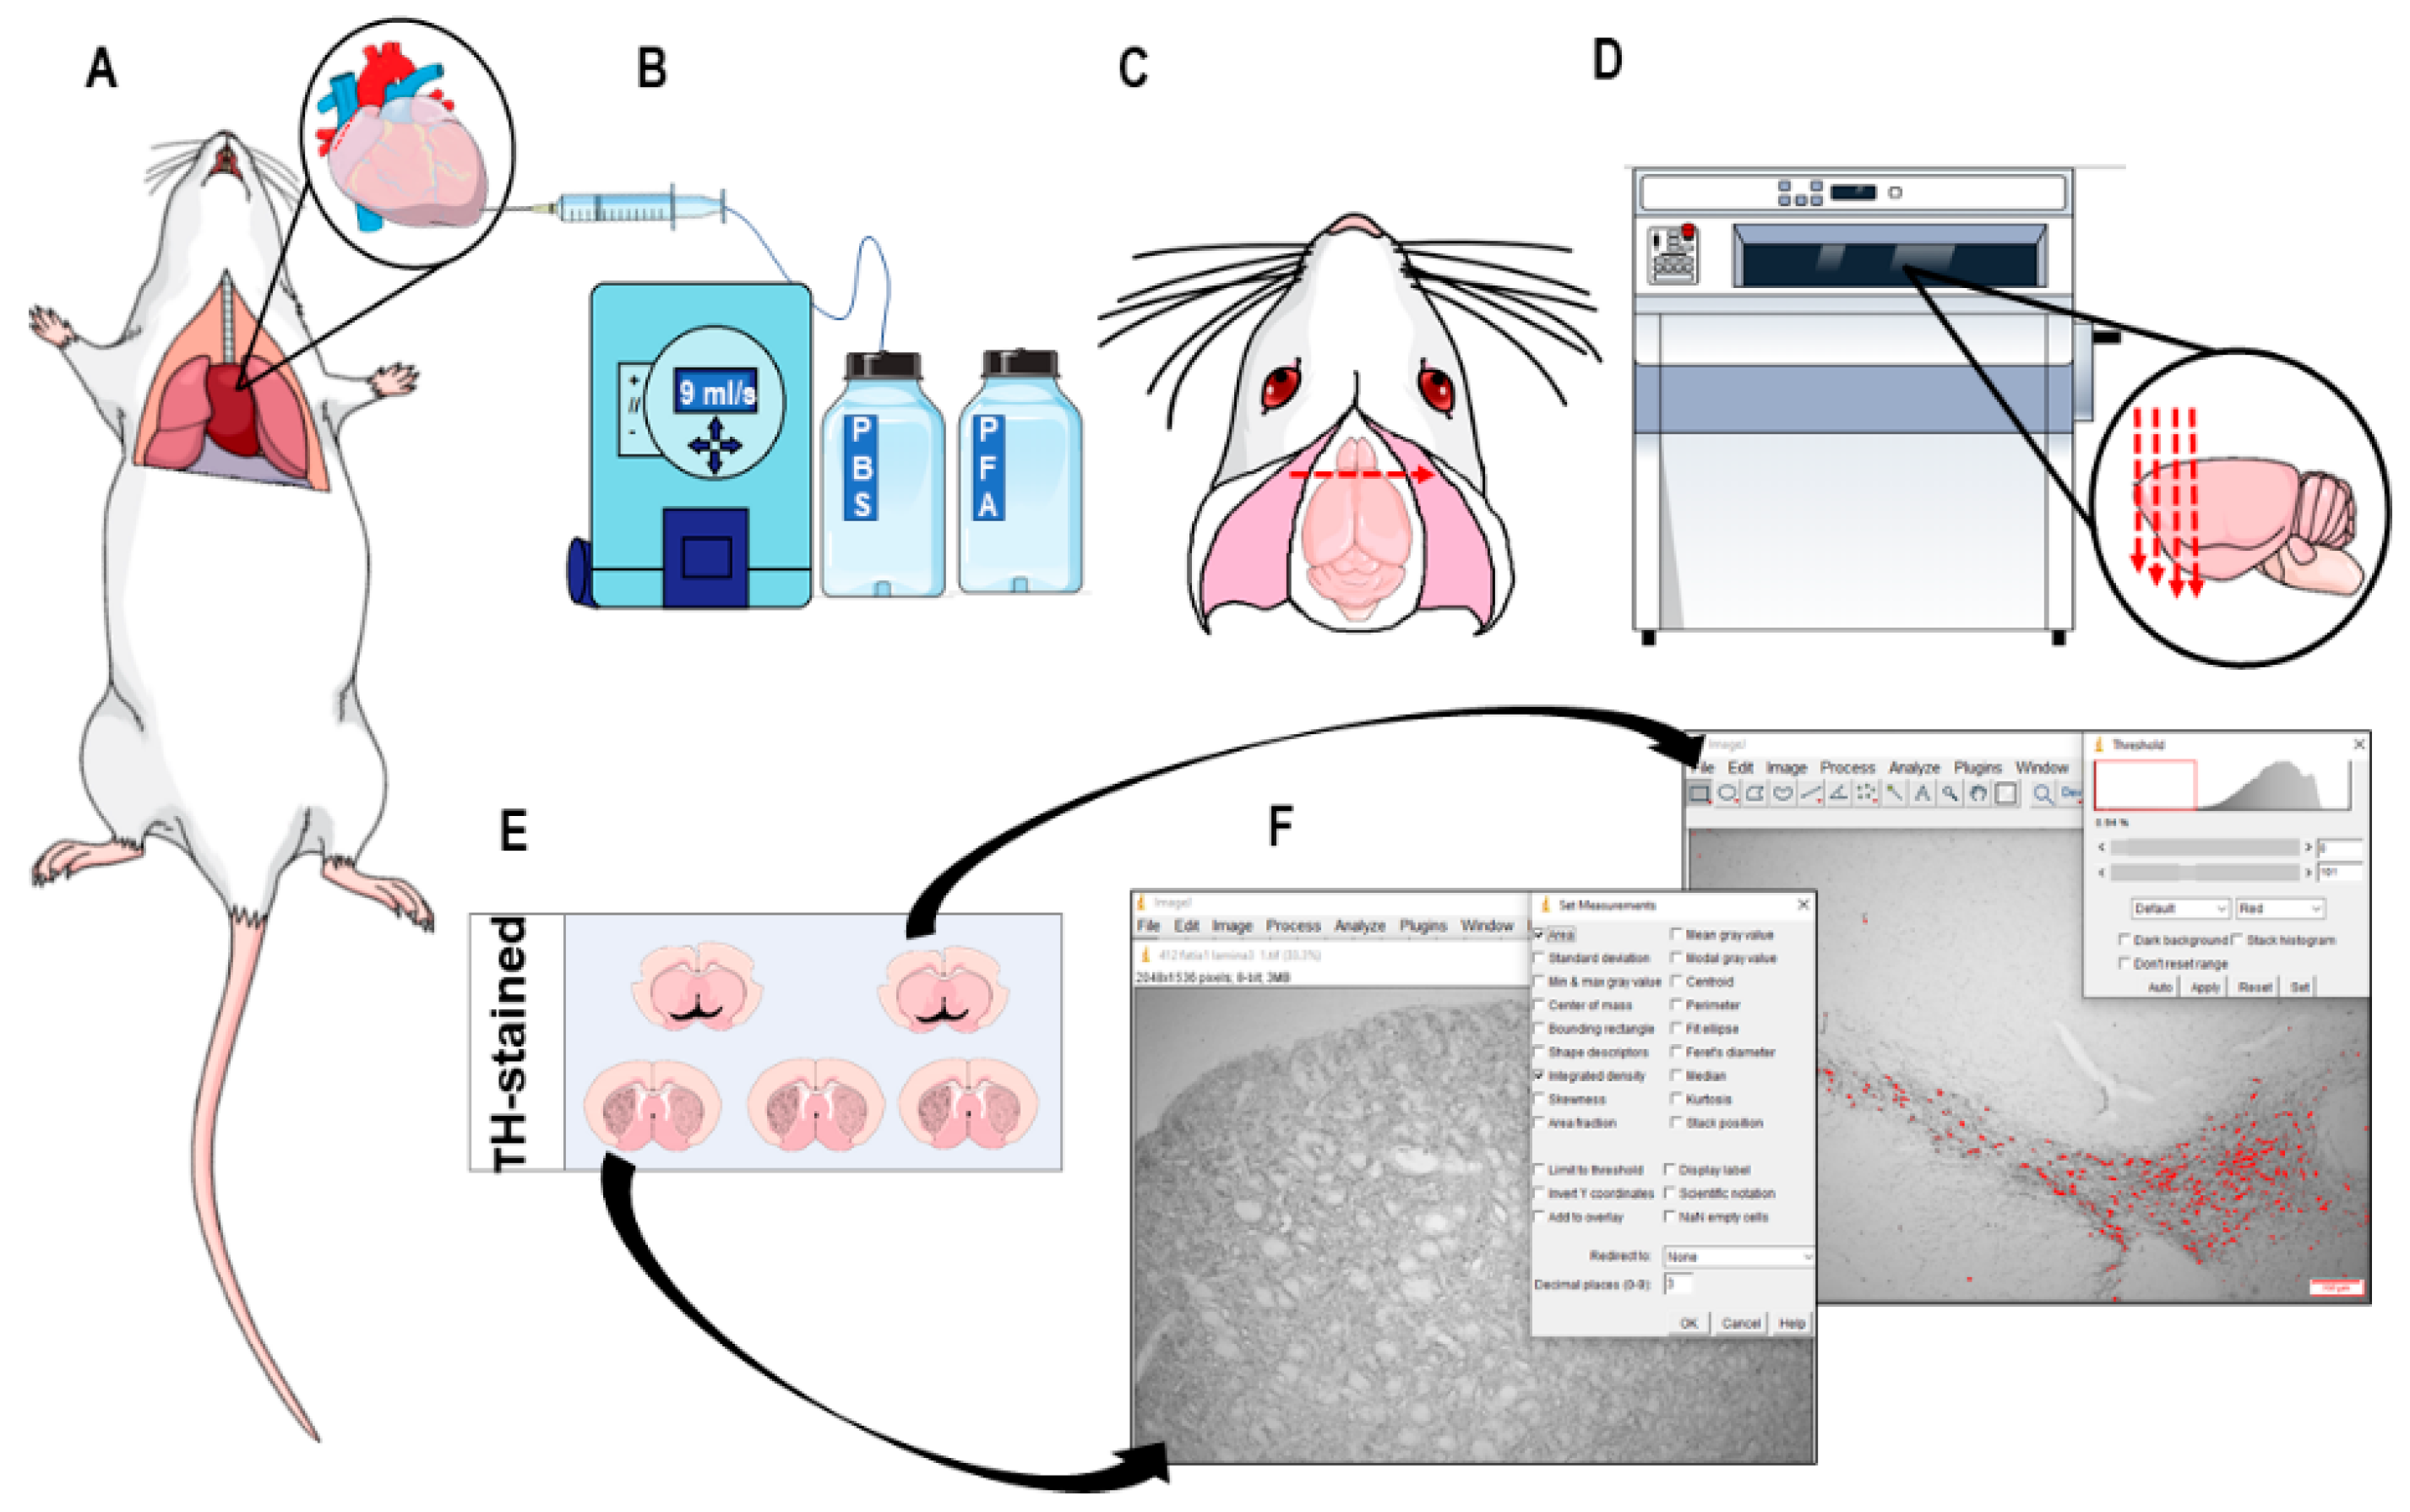
2.7. Immunohistochemistry and Neuronal Death Analysis
2.8. Statistics
3. Results
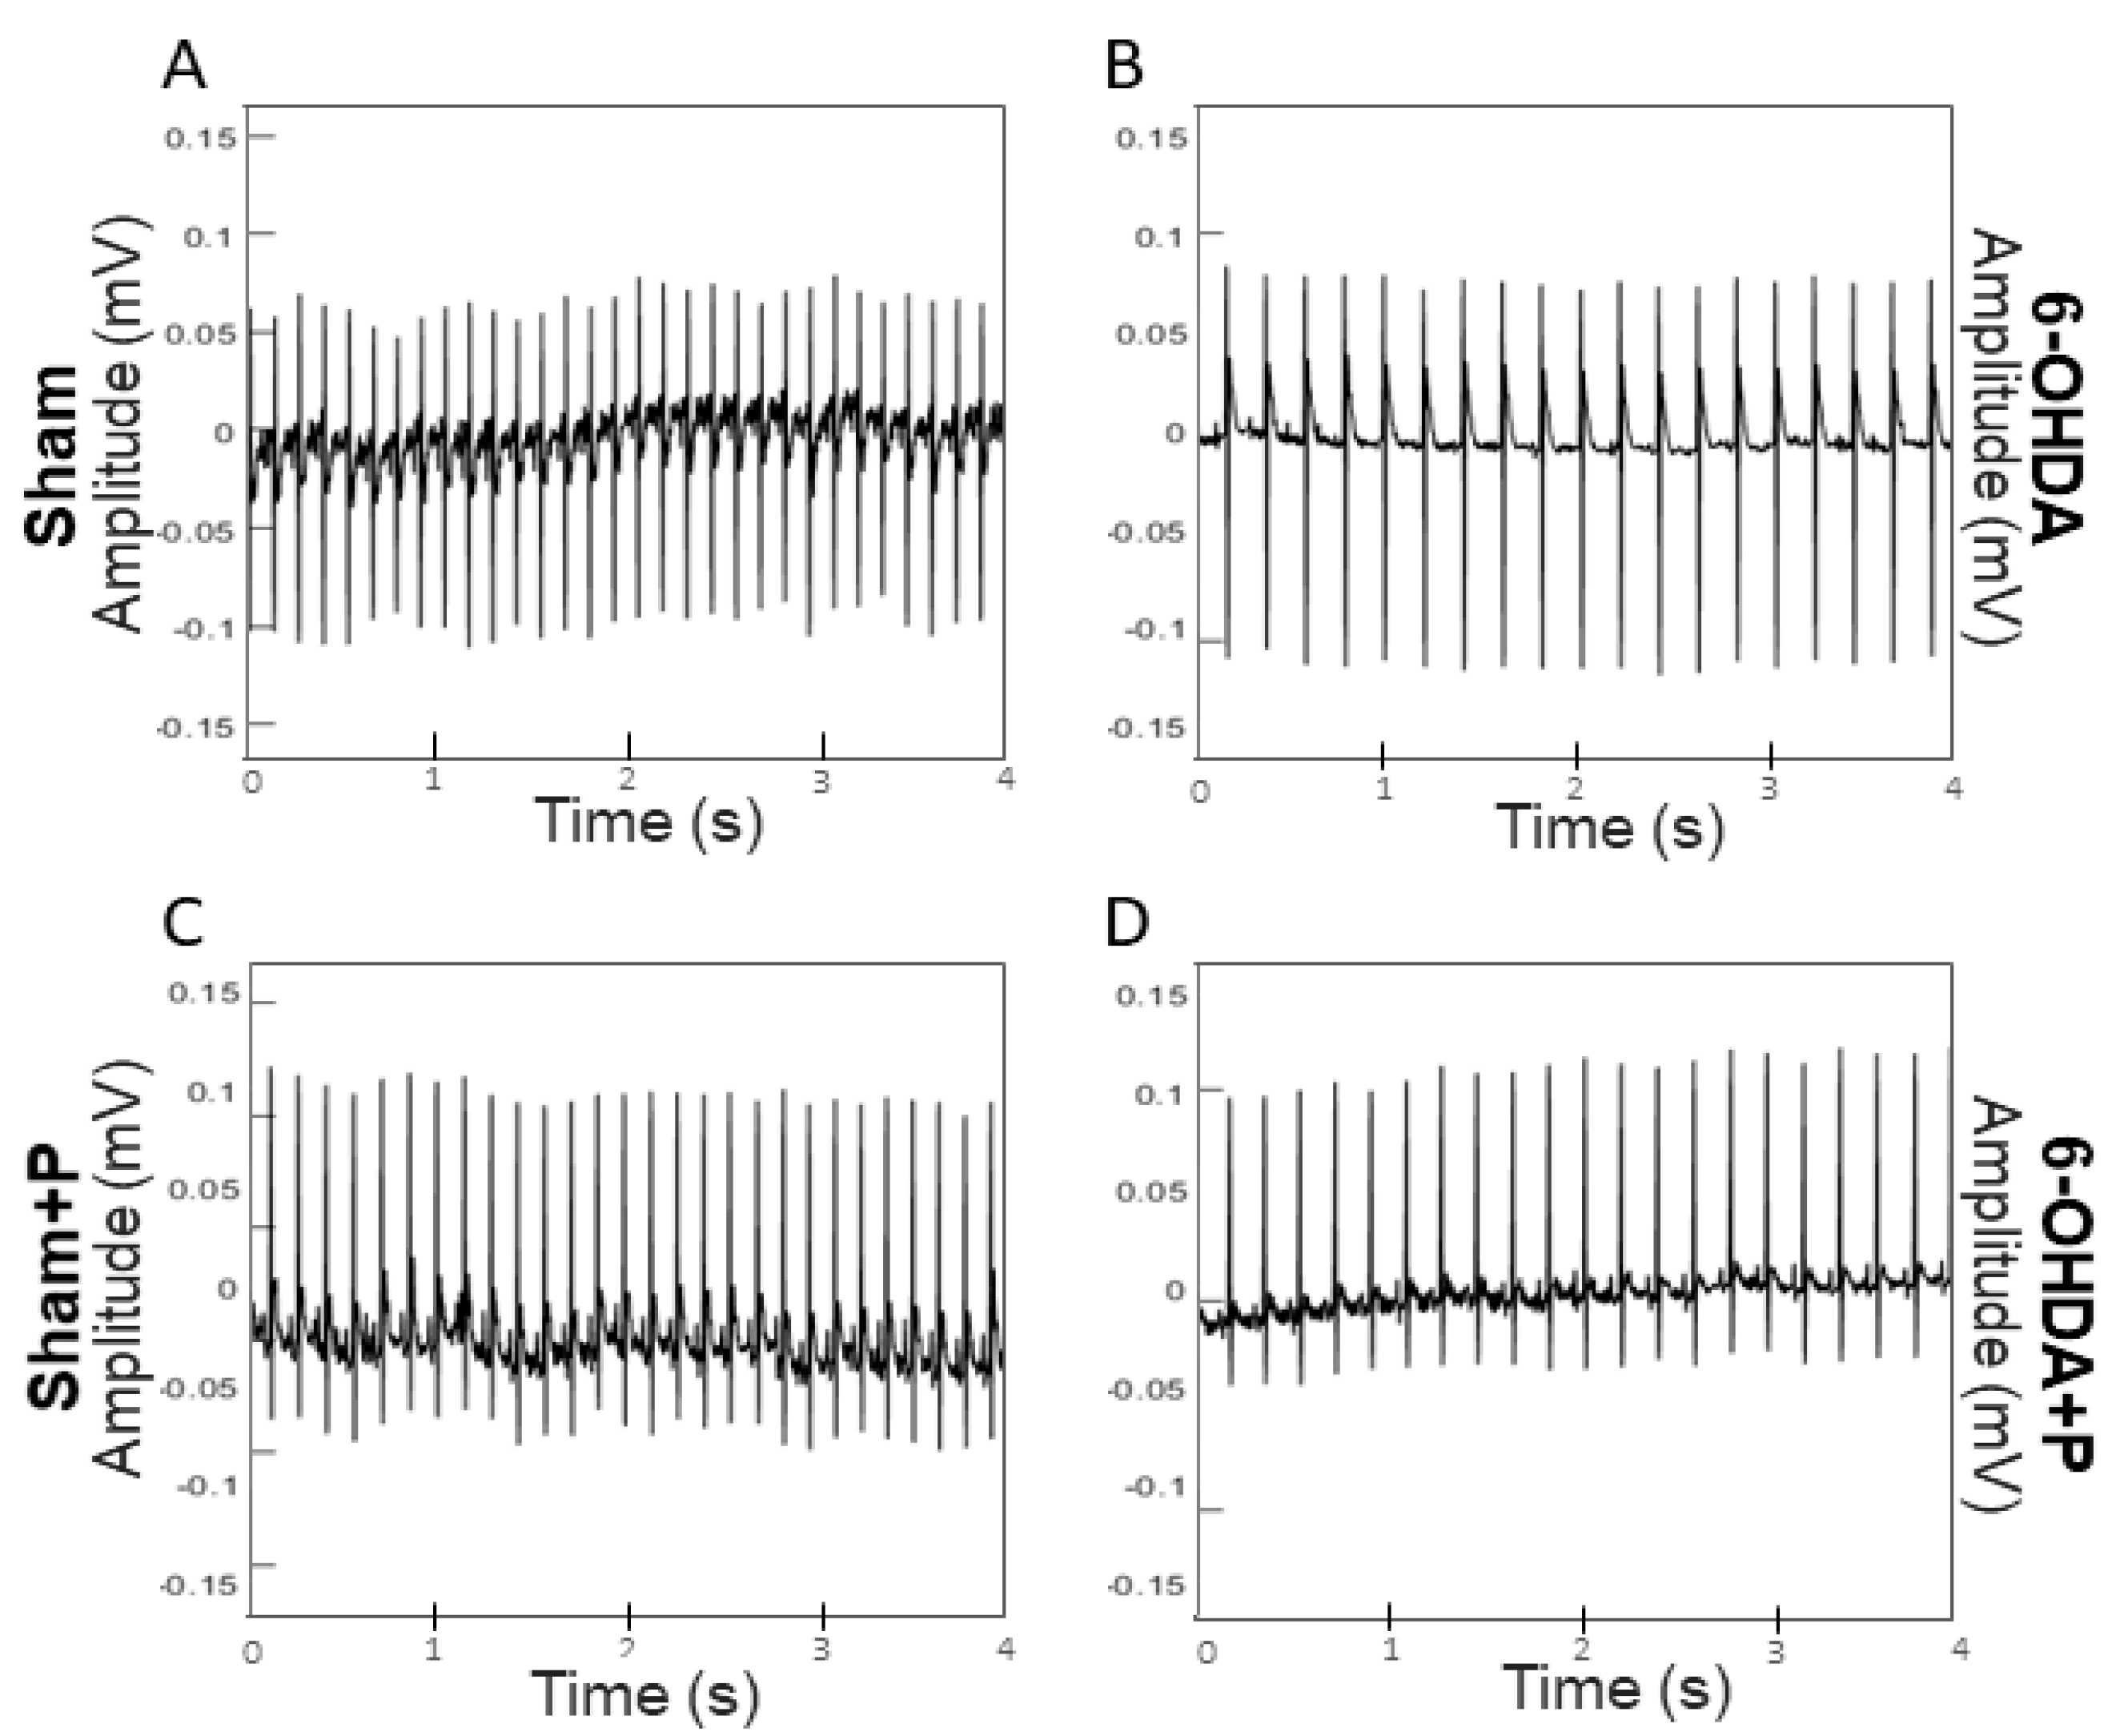
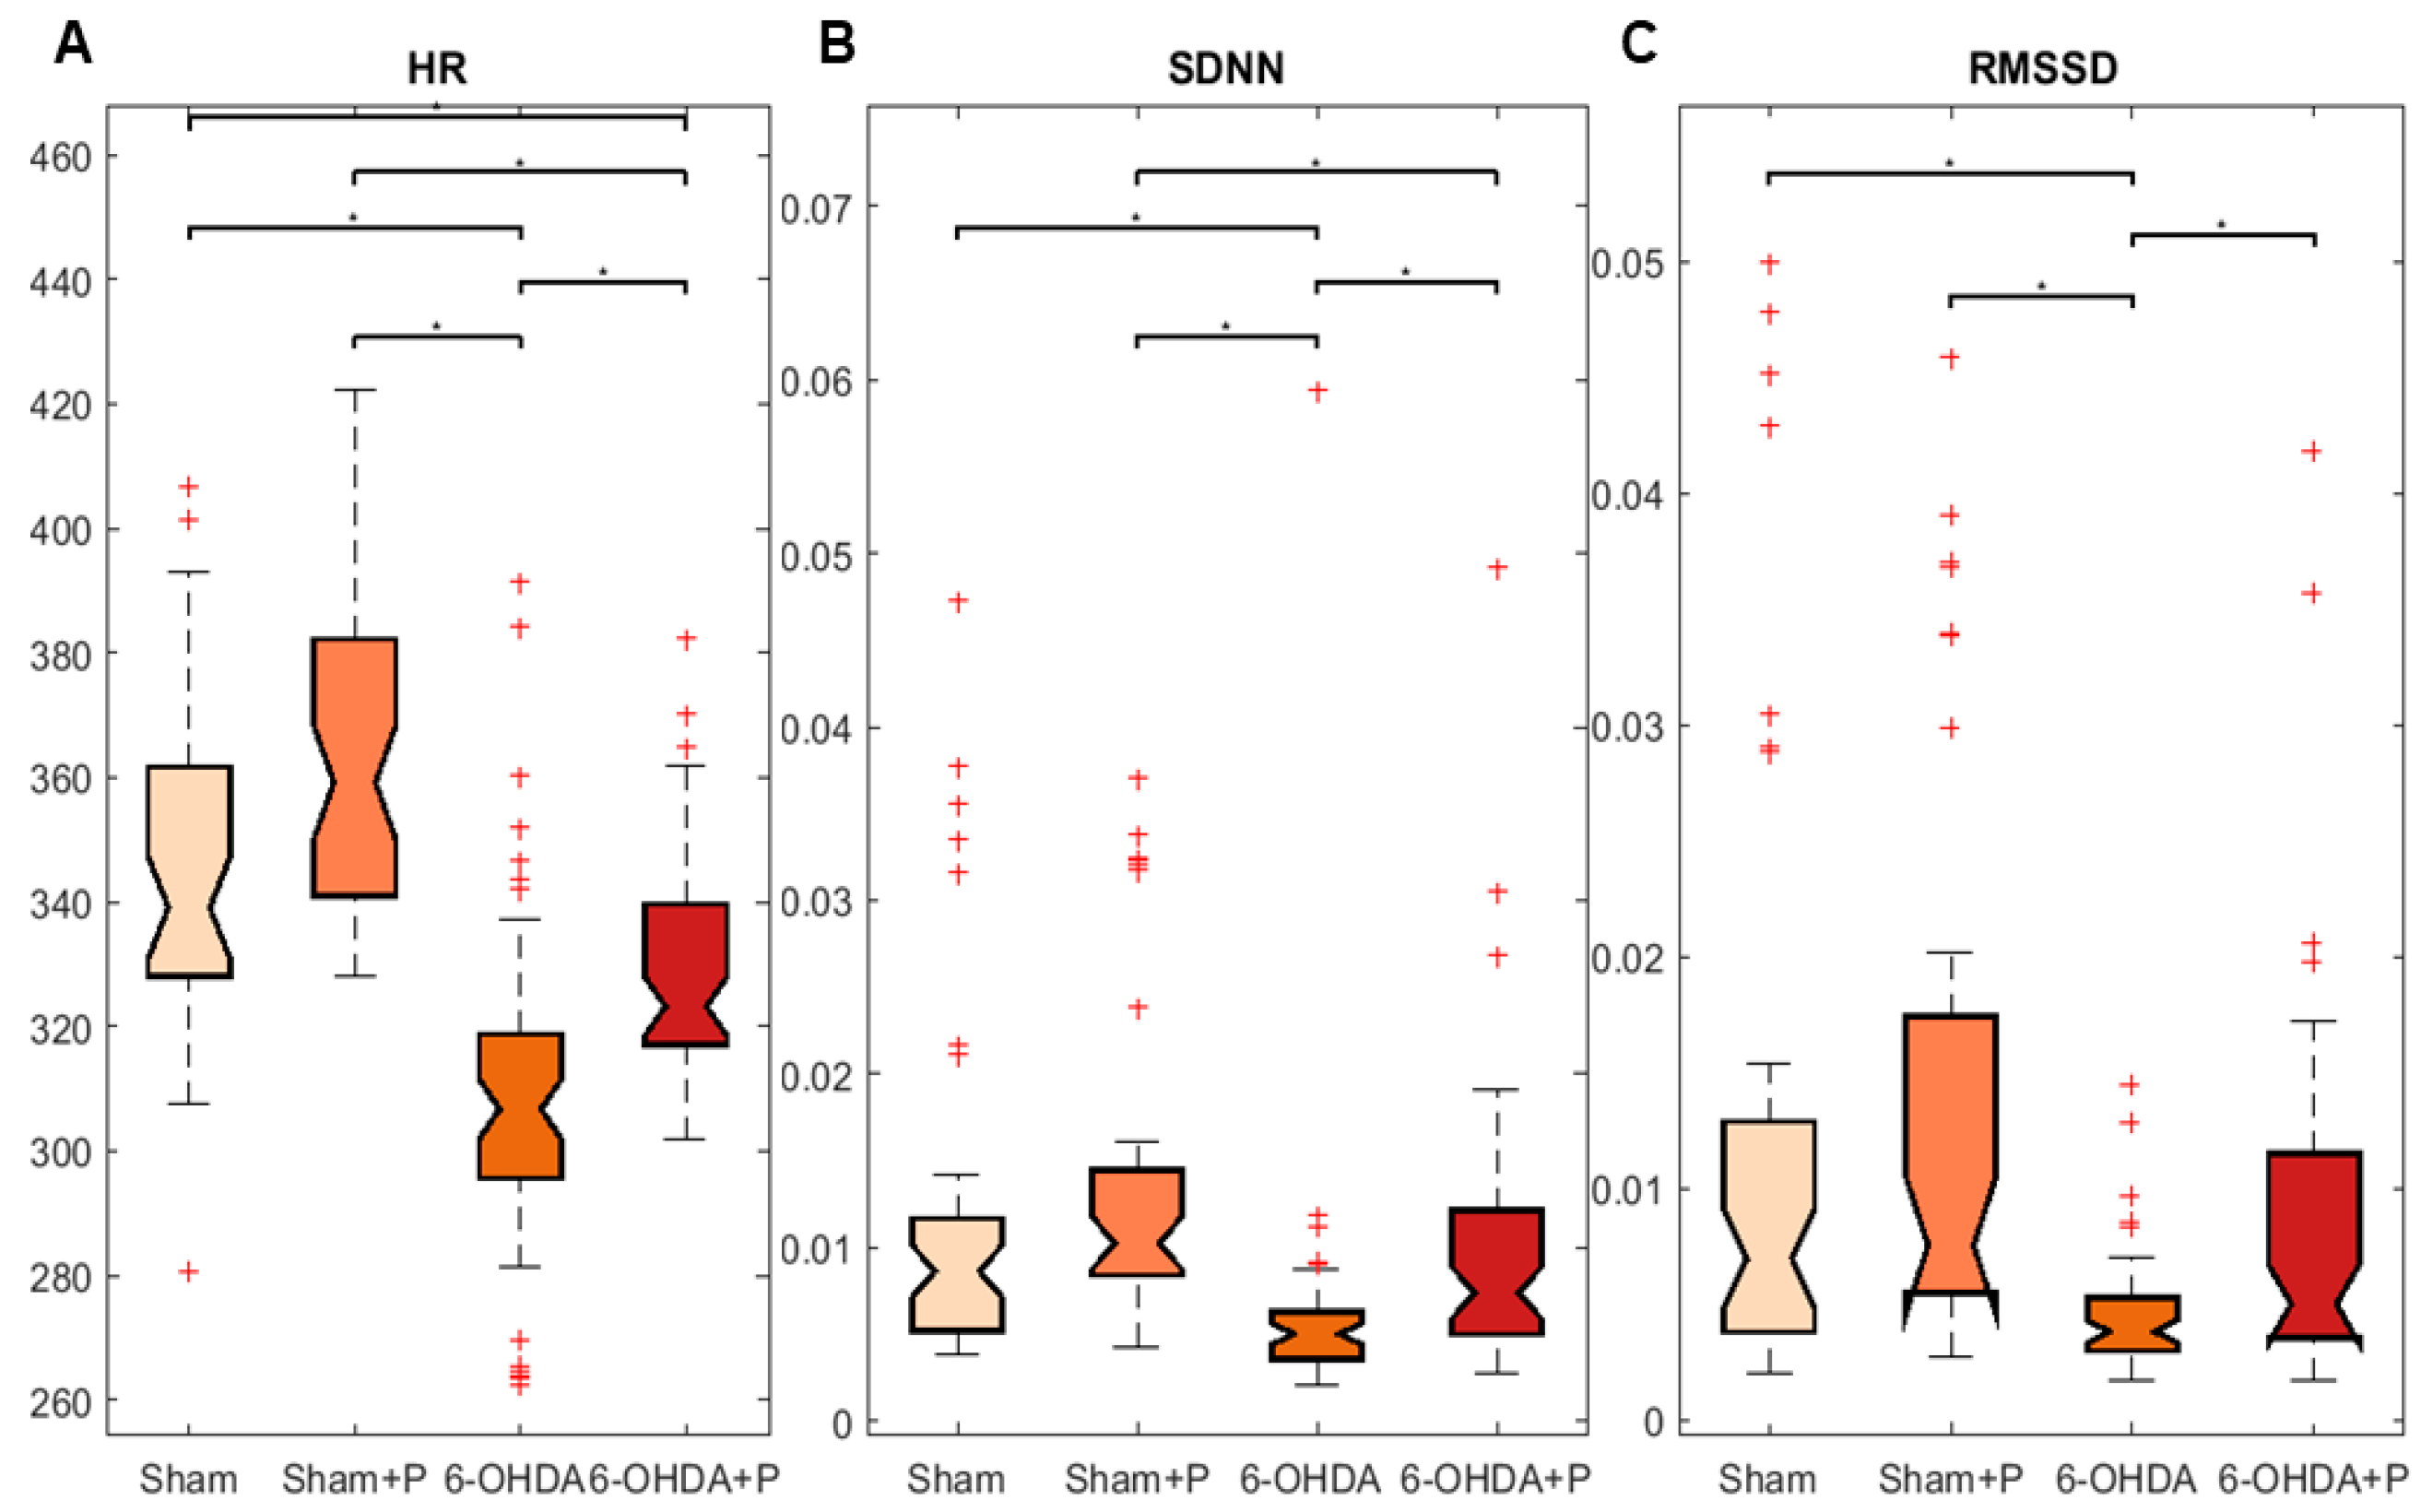
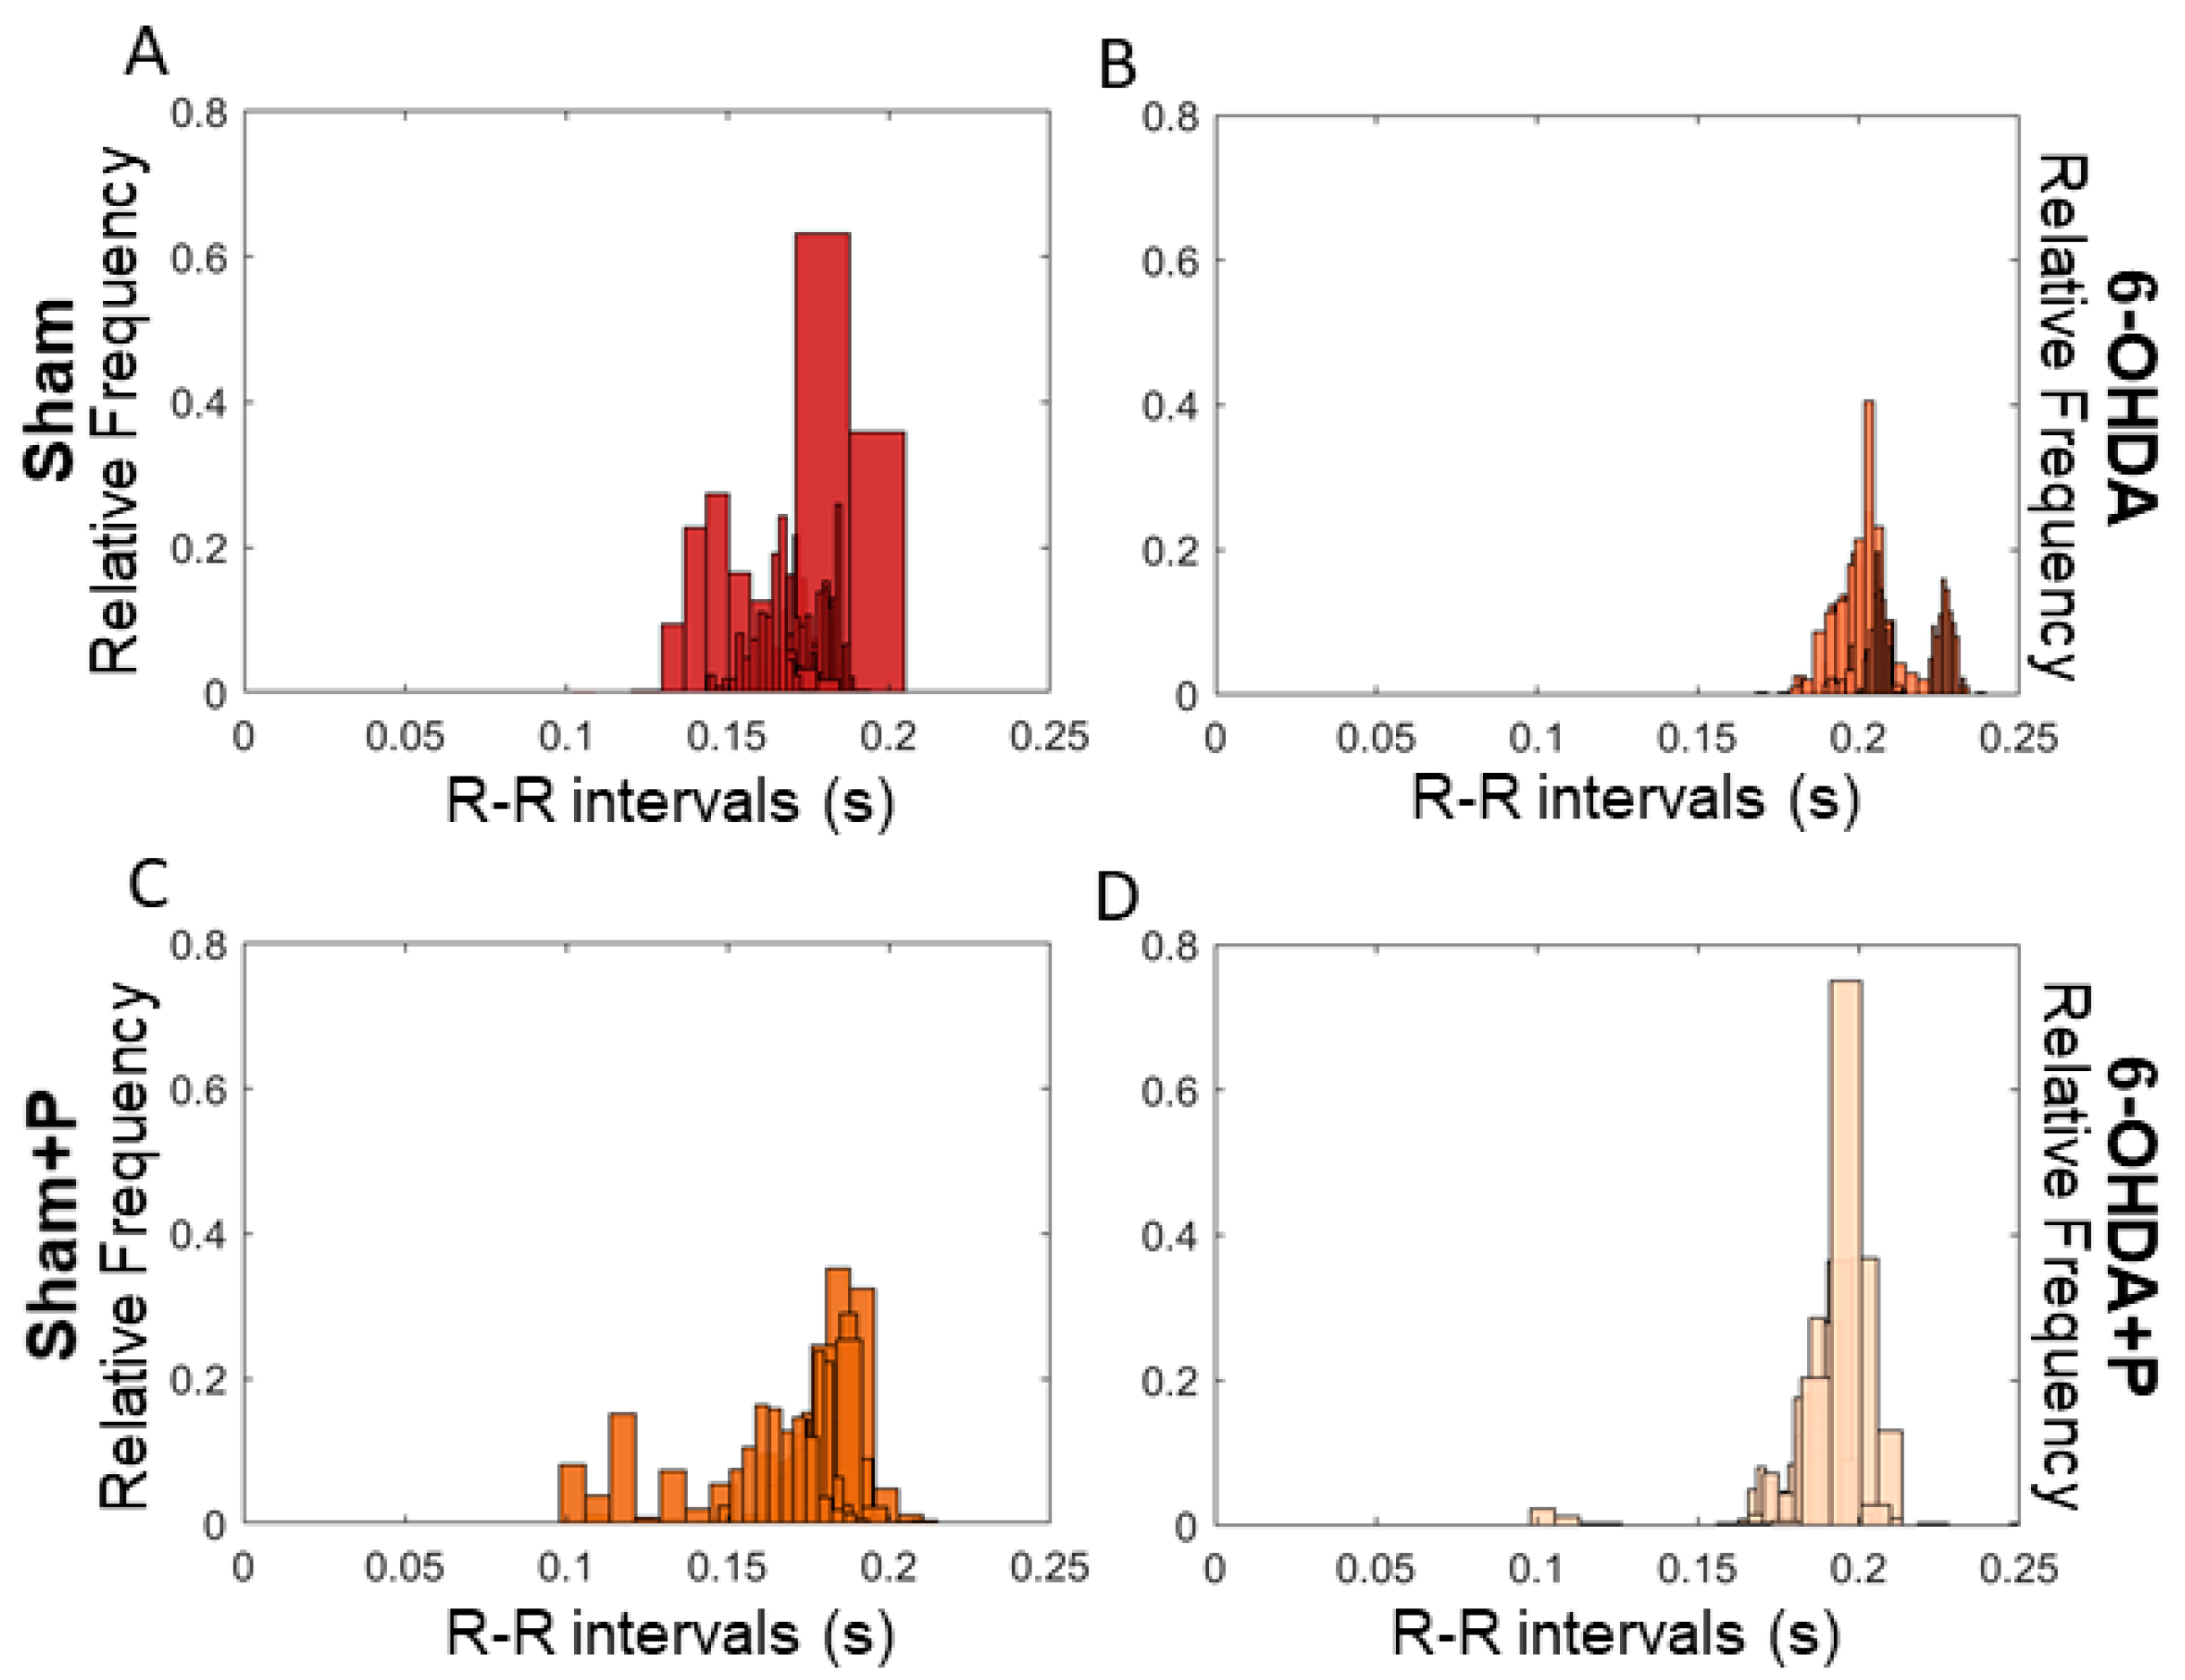
3.1. Analyses of Heart Rate and Heart Rate Variability
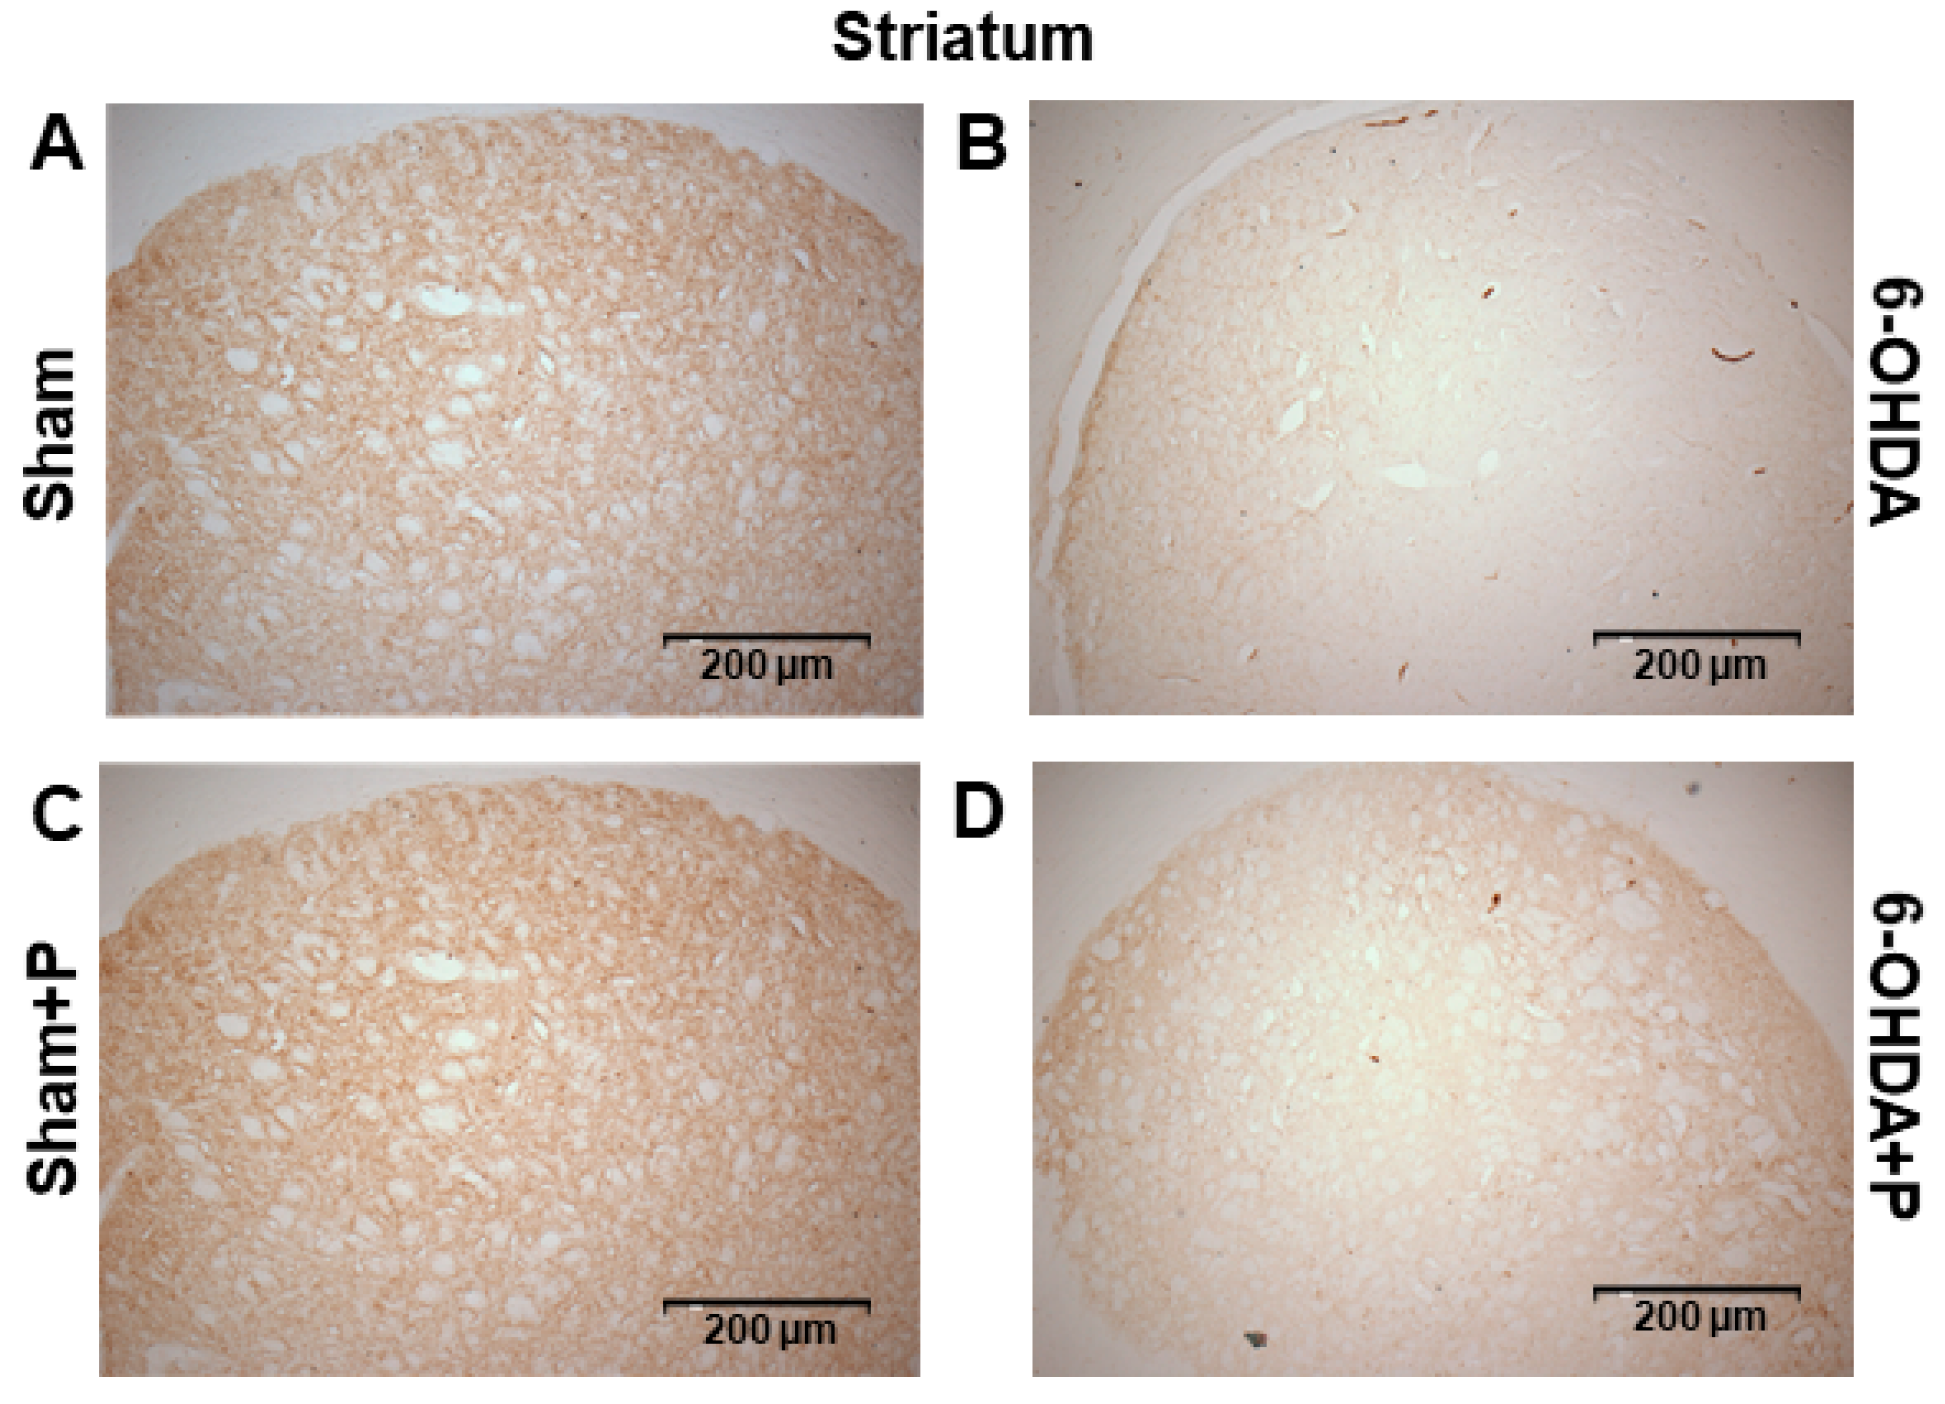
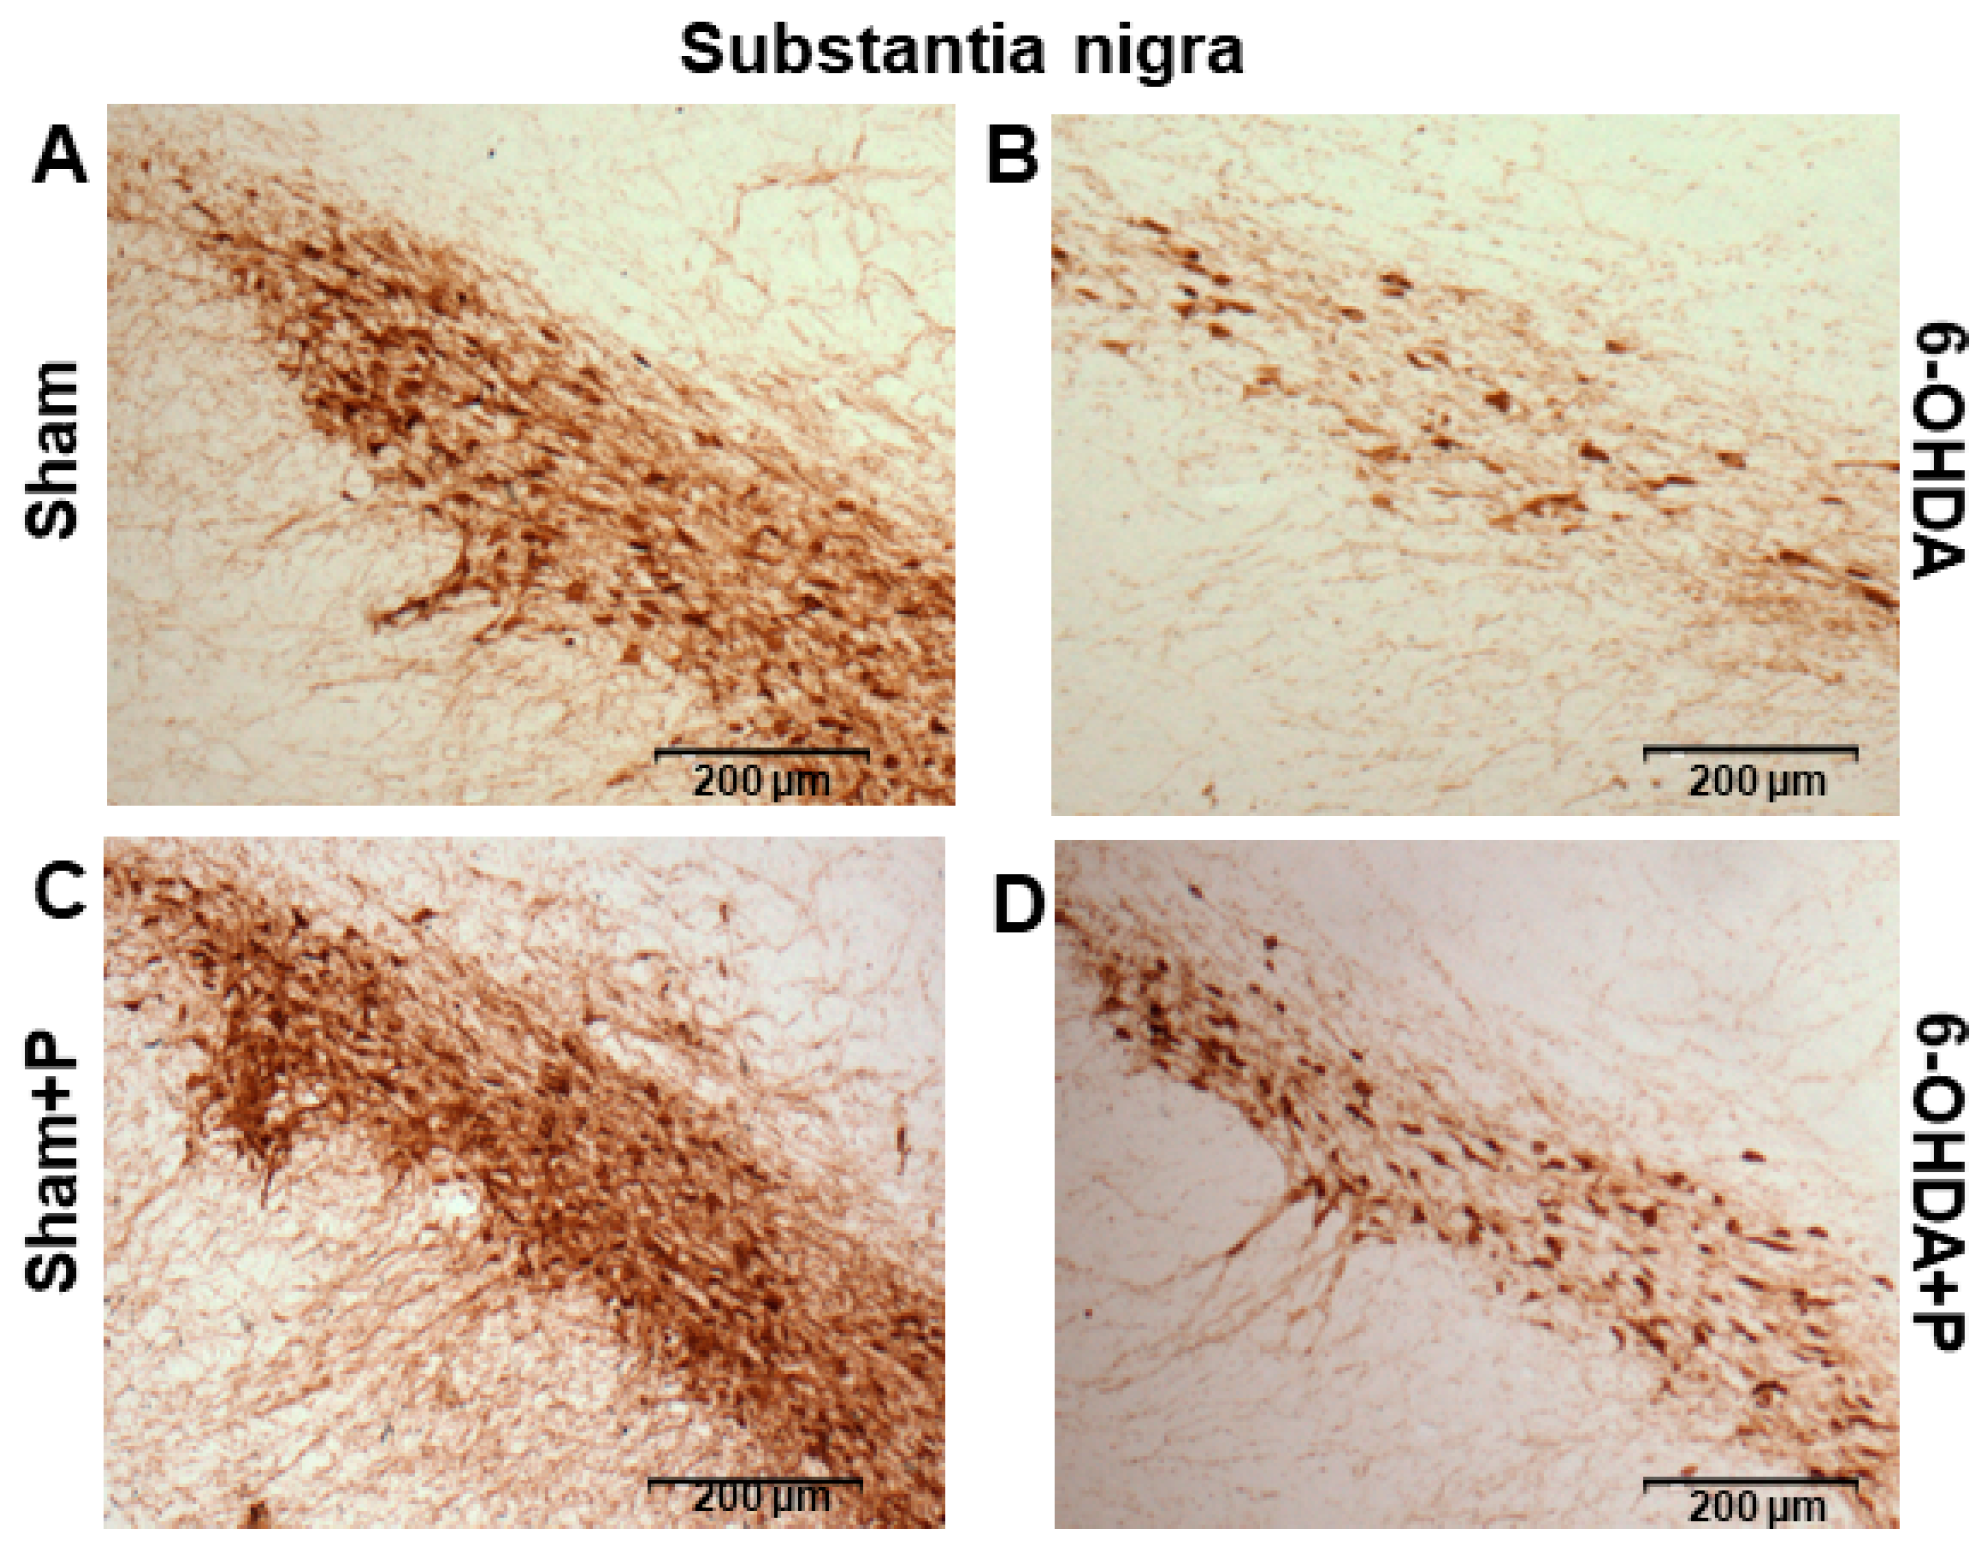
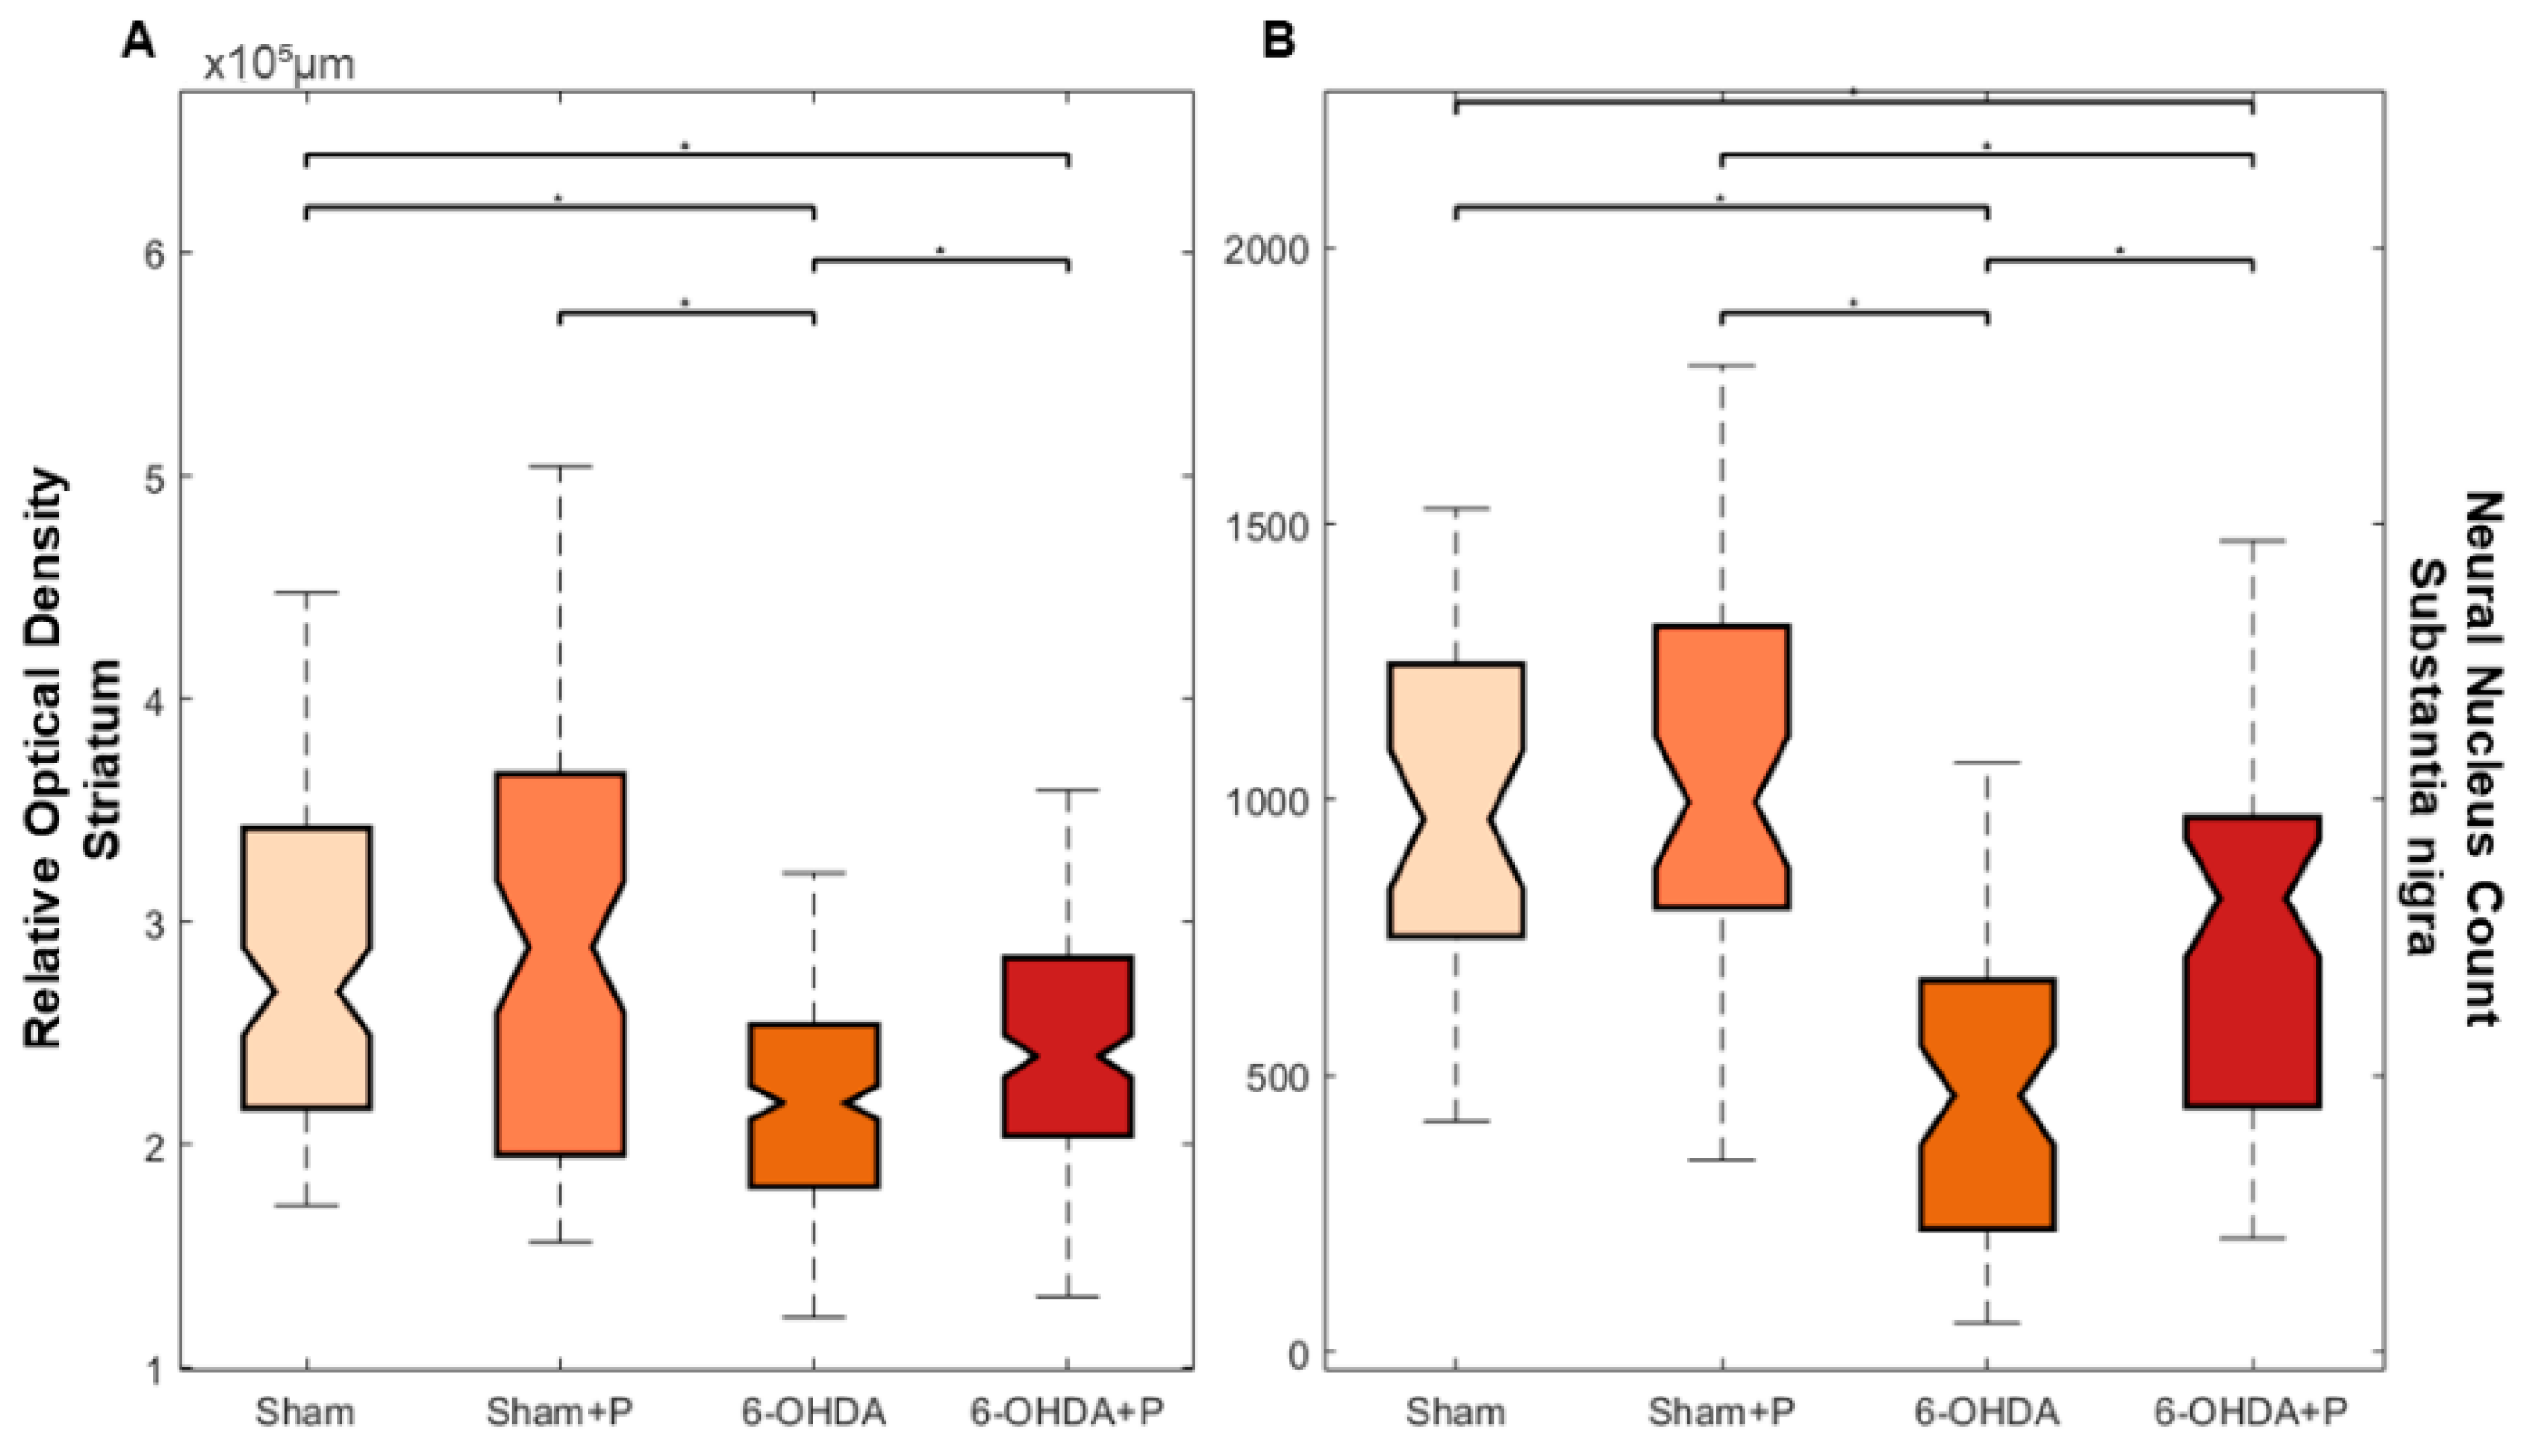
3.2. Tyrosine Hydroxylase Immunohistochemistry
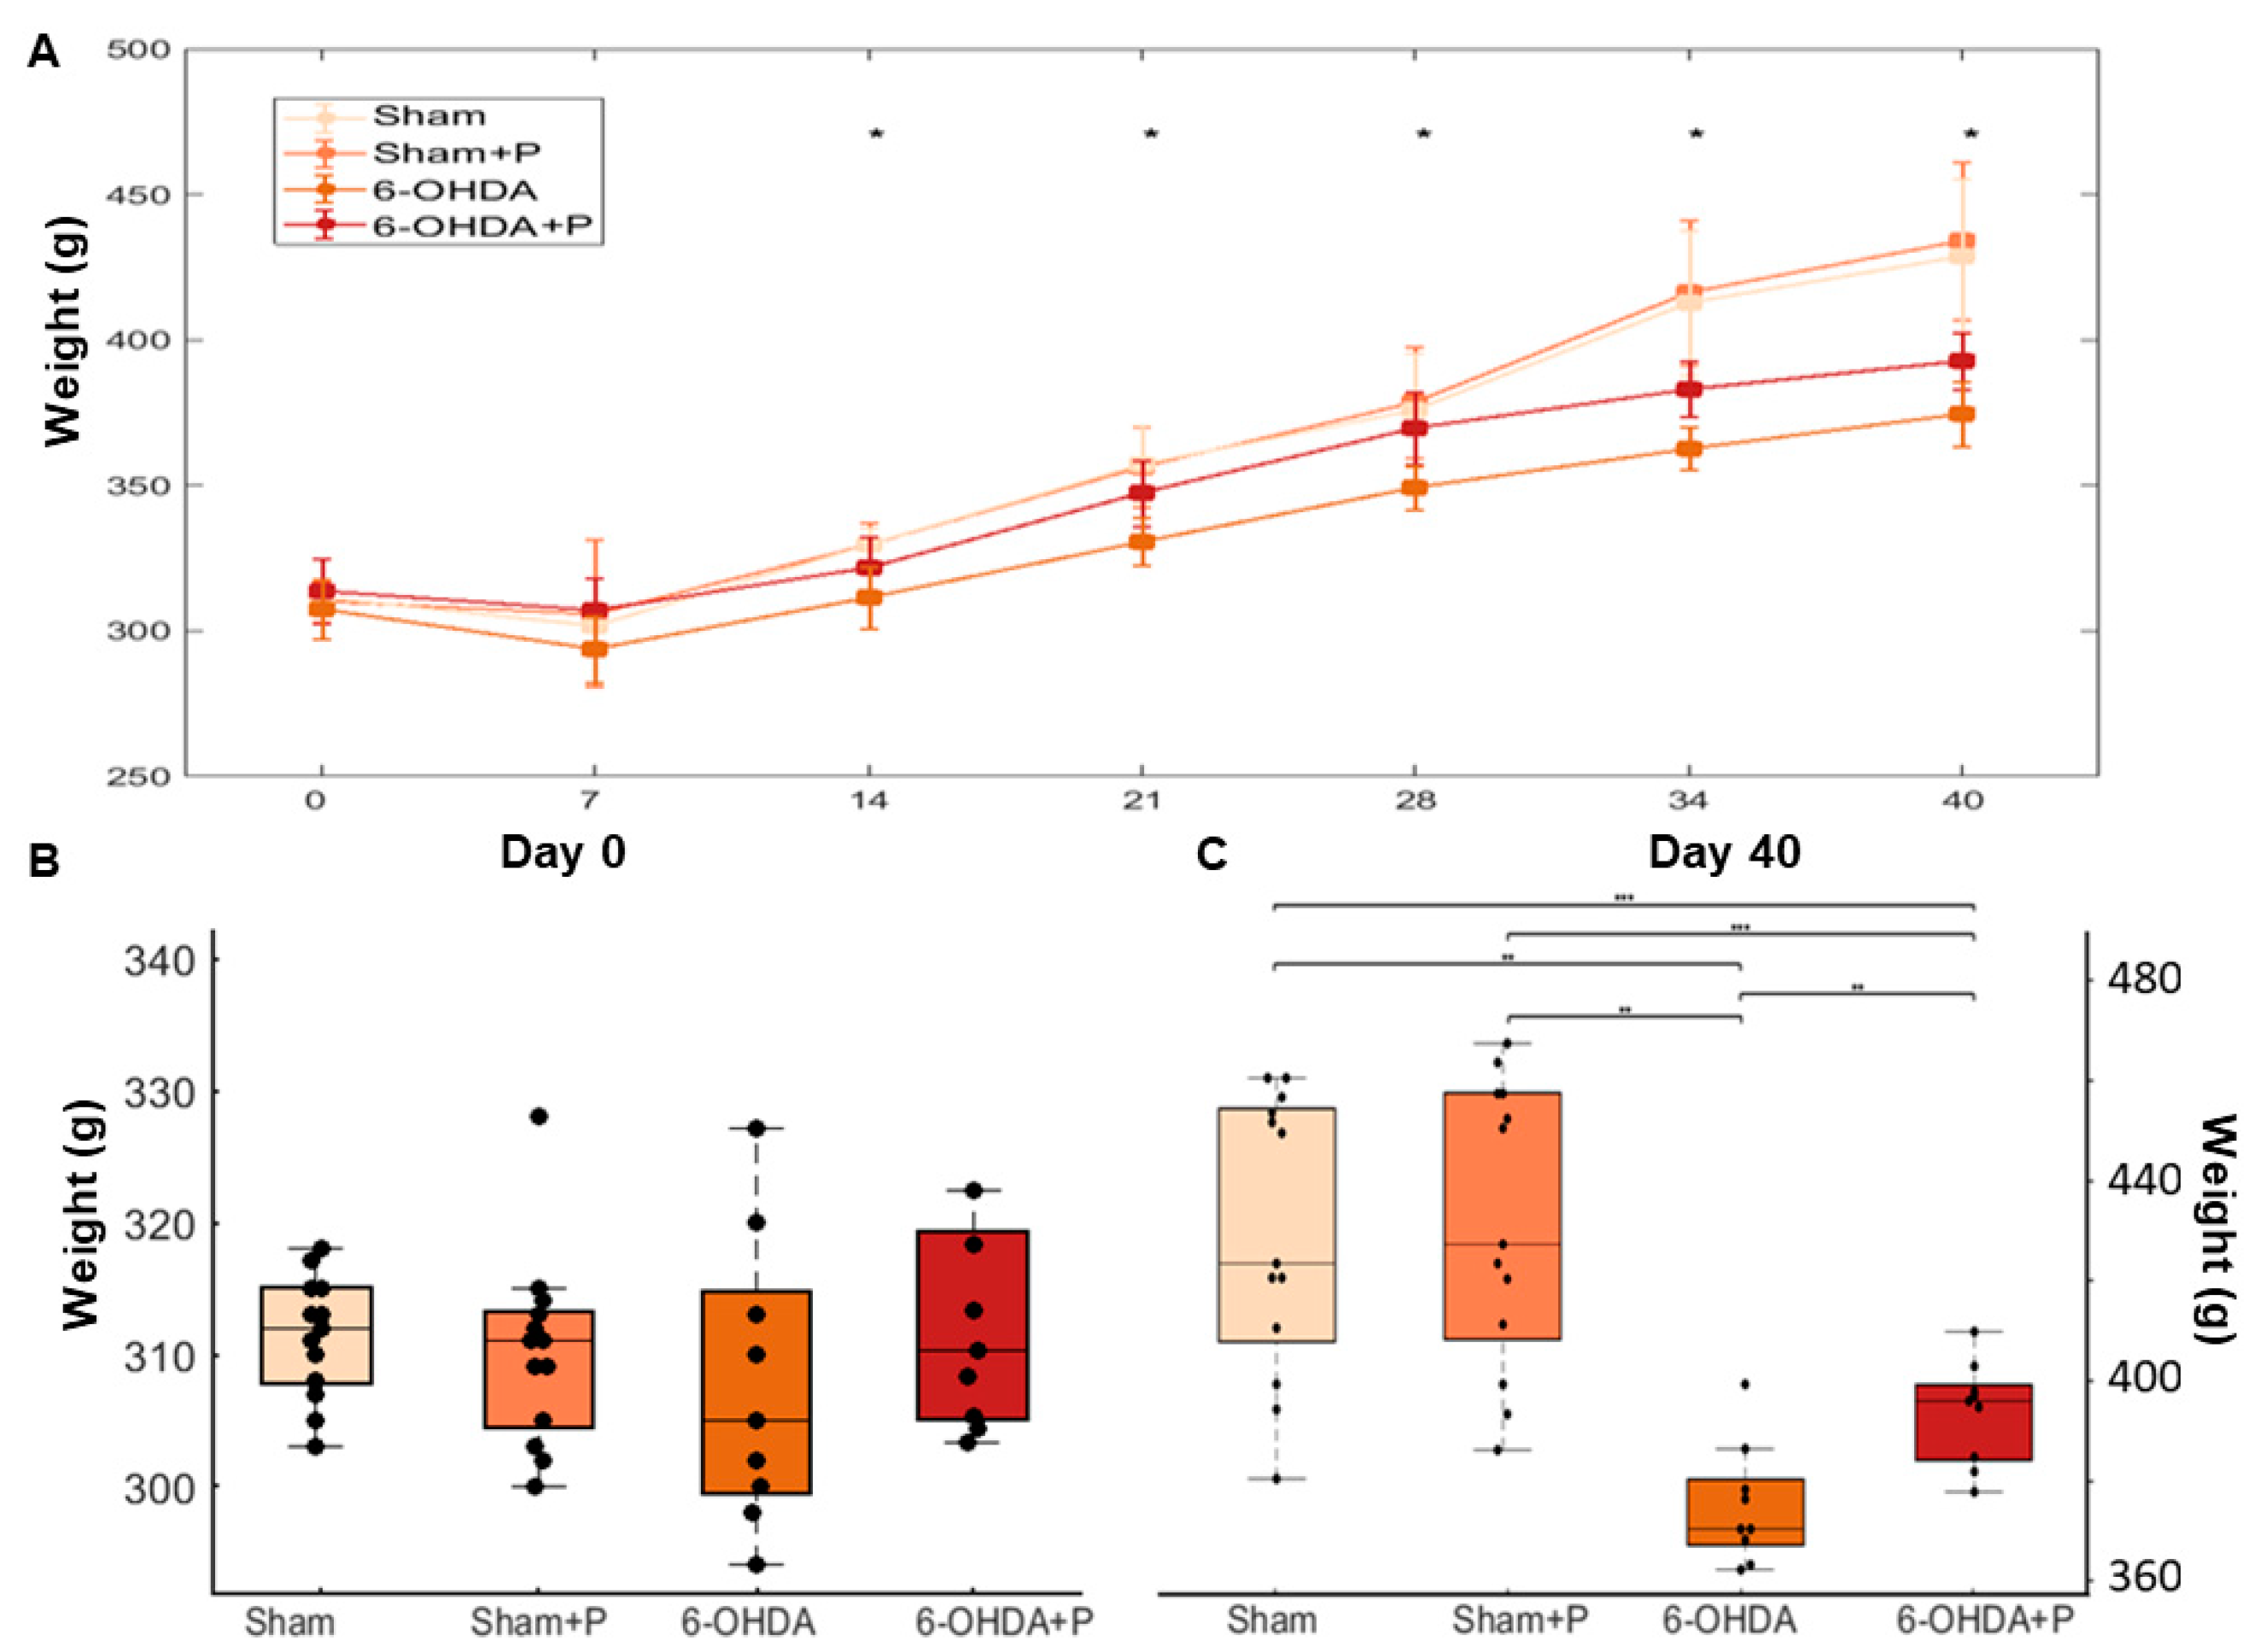
3.3. Animal Weight
4. Discussion
Author Contributions
Funding
Acknowledgments
Conflicts of Interest
References
- Saito, Y.; Nishio, K.; Ogawa, Y.; Kinumi, T.; Yoshida, Y.; Masuo, Y.; Niki, E. Molecular mechanisms of 6-hydroxydopamine-induced cytotoxicity in PC12 cells: Involvement of hydrogen peroxide-dependent and -independent action. Free Radic. Biol. Med. 2007, 42, 675–685. [Google Scholar] [CrossRef] [PubMed]
- Kalia, L.V.; Lang, A.E. Parkinson’s disease. Lancet 2015, 386, 896–912. [Google Scholar] [CrossRef]
- Kontis, V.; Bennett, J.E.; Mathers, C.D.; Li, G.; Foreman, K.; Ezzati, M. Future life expectancy in 35 industrialised countries: Projections with a Bayesian model ensemble. Lancet 2017, 389, 1323–1335. [Google Scholar] [CrossRef]
- Wanneveich, M.; Moisan, F.; Jacqmin-Gadda, H.; Elbaz, A.; Joly, P. Projections of prevalence, lifetime risk, and life expectancy of Parkinson’s disease (2010–2030) in France. Mov. Disord. 2018, 33, 1449–1455. [Google Scholar] [CrossRef]
- Postuma, R.B.; Berg, D.; Adler, C.H.; Bloem, B.R.; Chan, P.; Deuschl, G.; Stern, M. The new definition and diagnostic criteria of Parkinson’s disease. Lancet Neurol. 2016, 15, 546–548. [Google Scholar] [CrossRef]
- Klingelhoefer, L.; Reichmann, H. Parkinson’s disease as a multisystem disorder. J. Neural. Transm. 2017, 124, 709–713. [Google Scholar] [CrossRef]
- Dewey, R.B. Autonomic dysfunction in Parkinson’s disease. Neurol. Clin. 2004, 22, 127–139. [Google Scholar] [CrossRef]
- Goldman, J.G.; Postuma, R. Premotor and nonmotor features of Parkinson’s disease. Curr. Opin. Neurol. 2014, 27, 434–441. [Google Scholar] [CrossRef]
- Metzger, J.M.; Emborg, M.E. Autonomic dysfunction in Parkinson Disease and animal models. Clin. Auton. Res. 2019, 29, 397–414. [Google Scholar] [CrossRef]
- Alonso, A.; Huang, X.; Mosley, T.H.; Heiss, G.; Chen, H. Heart rate variability and the risk of Parkinson disease: The Atherosclerosis Risk in Communities study. Ann. Neurol. 2015, 77, 877–883. [Google Scholar] [CrossRef]
- Jain, S.; Goldstein, D.S. Cardiovascular dysautonomia in Parkinson disease: From pathophysiology to pathogenesis. Neurobiol. Dis. 2012, 46, 572–580. [Google Scholar] [CrossRef] [PubMed]
- Gibbons, C.H.; Simon, D.K.; Huang, M.; Tilley, B.; Aminoff, M.J.; Bainbridge, J.L.; Wong, P.S. Autonomic and electrocardiographic findings in Parkinson’s disease. Auton. Neurosci. 2017, 205, 93–98. [Google Scholar] [CrossRef] [PubMed]
- Tsao, J.; Evans, S.; Seidman, L.; Lung, K.C.; Zeltzer, L.; Naliboff, B. Heart rate variability as a biomarker for autonomic nervous system response differences between children with chronic pain and healthy control children. J. Pain. Res. 2013, 6, 449–457. [Google Scholar] [CrossRef] [PubMed]
- Ernst, G. Heart-Rate variability—More than heart beats? Public Health Front. 2017, 5, 240. [Google Scholar] [CrossRef]
- Ungerstedt, U. 6-hydroxy-dopamine induced degeneration of central monoamine neurons. Eur. J. Pharmacol. 1968, 5, 107–110. [Google Scholar] [CrossRef]
- Przedborski, S.; Tieu, K. Toxic animal models. J. Neurodegener. Dis. 2005, 2, 196–221. [Google Scholar]
- McDowell, K.; Chesselet, M.F. Animal models of the non-motor features of Parkinson’s disease. Neurobiol. Dis. 2012, 46, 597–606. [Google Scholar] [CrossRef]
- Slack, K.; Billing, R.; Matthews, S.; Allbutt, H.N.; Einstein, R.; Henderson, J.M. Subtle cardiovascular dysfunction in the unilateral 6-Hydroxydopamine-Lesioned rat. Parkinson’s Disease 2010, 2010, 427810. [Google Scholar] [CrossRef][Green Version]
- Ariza, D.; Sisdeli, L.; Crestani, C.C.; Fazan, R.; Martins-Pinge, M.C. Dysautonomias in Parkinson’s disease: Cardiovascular changes and autonomic modulation in conscious rats after infusion of bilateral 6-OHDA in substantia nigra. Am. J. Physiol.-Heart Circ. Physiol. 2015, 308, 250–257. [Google Scholar] [CrossRef]
- Rodrigues, L.D.; Oliveira, L.F.; Shinoda, L.; Scorza, C.A.; Faber, J.; Ferraz, H.B.; Britto, L.R.G.; Scorza, F.A. Cardiovascular alterations in rats with Parkinsonism induced by 6- OHDA and treated with Domperidone. Sci. Rep. 2019, 9, 8965. [Google Scholar] [CrossRef]
- Su, X.; Federoff, H.J. Immune responses in Parkinson’s disease: Interplay between central and peripheral immune systems. Biomed. Res. Int. 2014, 2014, 275178. [Google Scholar] [CrossRef] [PubMed]
- Tansey, M.G. Romero-Ramos, M.Immune system responses in Parkinson’s disease: Early and dynamic. Eur. J. Neurosci. 2018, 50, 2860–2876. [Google Scholar]
- Garretti, F.; Agalliu, D.; Arlehamn, C.S.L.; Sette, A.; Sulzer, D. Autoimmunity in Parkinson’s disease: The role of α-Synuclein-Specific T cells. Front. Immunol. 2019, 10, 303. [Google Scholar] [CrossRef] [PubMed]
- Simon, D.K.; Tanner, C.M.; Brundin, P. Parkinson Disease epidemiology, pathology, genetics and pathophysiology. Clin. Geriatr. Med. 2019, 36, 1–12. [Google Scholar] [CrossRef] [PubMed]
- Boulos, C.; Yaghi, N.; El Hayeck, R.; Heraoui, G.N.; Fakhoury-Sayegh, N. Nutritional risk factors, microbiota and Parkinson’s disease: What is the current evidence? Nutrients 2019, 11, 1896. [Google Scholar] [CrossRef]
- González-Burgos, E.; Fernandez-Moriano, C.; Gómez-Serranillos, M.P. Potential neuroprotective activity of Ginseng in Parkinson’s disease: A review. J. Neuroimmune Pharmacol. 2015, 10, 14–29. [Google Scholar] [CrossRef]
- Zhou, T.; Zu, G.; Zhang, X.; Wang, X.; Li, S.; Gong, X.; Liang, Z.; Zhao, J. Neuroprotective effects of ginsenoside Rg1 through the Wnt/β-catenin signaling pathway in both in vivo and in vitro models of Parkinson’s disease. Neuropharmacology 2016, 101, 480–489. [Google Scholar] [CrossRef]
- Lee, W.H.; Loo, C.Y.; Bebawy, M.; Luk, F.; Mason, R.S.; Rohanizadeh, R. Curcumin and its derivatives: Their application in neuropharmacology and neuroscience in the 21st century. Curr. Neuropharmacol. 2013, 11, 338–378. [Google Scholar] [CrossRef]
- Xie, C.J.; Gu, A.P.; Cai, J.; Wu, Y.; Chen, R.C. Curcumin protects neural cells against ischemic injury in N2a cells and mouse brain with ischemic stroke. Brain Behav. 2018, 8, e00921. [Google Scholar] [CrossRef]
- Chung, E.S.; Bok, E.; Chung, Y.C.; Baik, H.H.; Jin, B.K. Cannabinoids prevent lipopolysaccharide-induced neurodegeneration in the rat substantia nigra in vivo through inhibition of microglial activation and NADPH oxidase. Brain Res. 2012, 1451, 110–116. [Google Scholar] [CrossRef]
- Stampanoni, B.M.; Sancesario, A.; Morace, R.; Centonze, D.; Iezzi, E. Cannabinoids in parkinson’s disease. Cannabis Cannabinoid Res. 2017, 2, 21–29. [Google Scholar] [CrossRef] [PubMed]
- Sur, S.; Panda, C.K. Molecular aspects of cancer chemopreventive and therapeutic efficacies of tea and tea polyphenols. Nutrition 2017, 43, 8–15. [Google Scholar] [CrossRef] [PubMed]
- Zhou, T.; Zhu, M.; Liang, Z. (-)-Epigallocatechin-3-gallate modulates peripheral immunity in the MPTP-induced mouse model of Parkinson’s disease. Mol. Med. Rep. 2018, 17, 4883–4888. [Google Scholar] [CrossRef] [PubMed]
- Qi, H.; Li, S. Dose-response meta-analysis on coffee, tea and caffeine consumption with risk of Parkinson’s disease. Geriatr. Gerontol. Int. 2014, 14, 430–439. [Google Scholar] [CrossRef]
- Camandola, S.; Plick, N.; Mattson, M.P. Impact of coffee and cacao purine metabolites on neuroplasticity and neurodegenerative disease. Neurochem. Res. 2019, 44, 214–227. [Google Scholar] [CrossRef] [PubMed]
- Fontanilla, C.V.; Ma, Z.; Wei, X.; Klotsche, J.; Zhao, L.; Wisniowski, P.; Dodel, R.C.; Farlow, M.R.; Oertel, W.H.; Du, Y. Caffeic acid phenethyl ester prevents 1-methyl-4-phenyl-1,2,3,6-tetrahydropyridineinduced neurodegeneration. Neuroscience 2011, 188, 135–141. [Google Scholar] [CrossRef]
- Franchin, M.; Rosalen, P.L.; da Cunha, M.G.; Silva, R.L.; Colón, D.F.; Bassi, G.S.; Cunha, T.M. Cinnamoyloxy-mammeisin isolated from geopropolis attenuates inflammatory process by inhibiting cytokine production: Involvement of MAPK, AP-1, and NF-κB. J. Nat. Prod. 2016, 79, 1828–1833. [Google Scholar] [CrossRef]
- Franchin, M.; Freires, I.A.; Lazarini, J.G.; Nani, B.D.; da Cunha, M.G.; Colón, D.F.; de Alencar, S.M.; Rosalen, P.L. The use of Brazilian propolis for discovery and development of novel anti-inflammatory drugs. Eur. J. Med. Chem. 2018, 153, 49–55. [Google Scholar] [CrossRef]
- Braakhuis, A. Evidence on the health benefits of supplemental propolis. Nutrients 2019, 11, 2705. [Google Scholar] [CrossRef]
- Huang, X.Y.; Guo, X.L.; Luo, H.L.; Fang, X.W.; Zhu, T.G.; Zhang, X.L.; Chen, H.W.; Luo, L.P. Fast differential analysis of propolis using surface desorption atmospheric pressure chemical ionization mass spectrometry. Int. J. Anal. Chem. 2015, 2015, 176475. [Google Scholar] [CrossRef]
- Freires, I.A.; Pingueiro, J.M.S.; Miranda, S.L.F.; Bueno-Silva, B. Red propolis: Phenolics, polyphenolics, and applications to microbiological health and disease. In Polyphenols: Prevention and Treatment of Human Disease, 2nd ed.; Academic Press: London, UK, 2018; pp. 293–300. [Google Scholar]
- Menezes, H. Própolis: Uma revisão dos recentes estudos de suas propriedades farmacológicas. Arq. Inst. Biol. 2005, 72, 405–411. [Google Scholar]
- Funari, C.S.; Ferro, V.O. Propolisanalysis. Ciência Tecnol. Aliment. 2006, 26, 171–178. [Google Scholar] [CrossRef]
- Parlakpinar, H.; Tasdemir, S.; Polat, A.; Bay-Karabulut, A.; Vardi, N.; Ucar, M.; Acet, A. Protective role of caffeic acid phenethyl ester (cape) on gentamicin-induced acute renal toxicity in rats. Toxicology 2005, 207, 169–177. [Google Scholar] [CrossRef] [PubMed]
- Alyane, M.; Kebsa, L.B.; Boussenane, H.N.; Rouibah, H.; Lahouel, M. Cardioprotective effects and mechanism of action of polyphenols extracted from propolis against doxorubicin toxicity. Pak. J. Pharm. Sci. 2008, 21, 201–209. [Google Scholar] [PubMed]
- Teles, F.; Silva, T.M.; Júnior, F.P.C.; Honorato, V.H.; Costa, H.O.; Barbosa, A.P.F.; Fanelli, C. Brazilian red propolis attenuates hypertension and renal damage in 5/6 renal ablation model. PLoS ONE 2015, 10, e0116535. [Google Scholar] [CrossRef] [PubMed]
- Ahmed, R.; Tanvir, E.M.; Hossen, M.S.; Afroz, R.; Ahmmed, I.; Rumpa, N.-E.N.; Paul, S.; Gan, S.H.; Sulaiman, S.A.; Khalil, M.I. Antioxidant properties and cardioprotective mechanism of Malaysian Propolis in rats. Evid. Based Complement. Alternat. Med. 2017, 2017, 5370545. [Google Scholar] [CrossRef]
- Ni, J.; Wu, Z.; Meng, J.; Zhu, A.; Zhong, X.; Wu, S.; Nakanishi, H. The neuroprotective effects of Brazilian green propolis on neurodegenerative damage in human neuronal SH-SY5Y cells. Oxid. Med. Cell. Longev. 2017, 2017, 7984327. [Google Scholar] [CrossRef]
- Bojić, M.; Antolić, A.; Tomičić, M.; Debeljak, Ž.; Maleš, Ž. Propolis ethanolic extracts reduce adenosine diphosphate induced platelet aggregation determined on whole blood. Nutr. J. 2018, 17, 52. [Google Scholar] [CrossRef]
- Oršolić, N.; LandekaJurčević, I.; Đikić, D.; Rogić, D.; Odeh, D.; Balta, V.; Jutrić, D. Effect of propolis on diet-induced hyperlipidemia and atherogenic indices in mice. Antioxidants 2019, 8, 156. [Google Scholar] [CrossRef]
- Takashima, M.; Ichihara, K.; Hirata, Y. Neuroprotective effects of Brazilian green propolis on oxytosis/ferroptosis in mouse hippocampal HT22 cells. Food Chem. Toxicol. 2019, 132, 110669. [Google Scholar] [CrossRef]
- Paxinos, G.; Watson, C. The Rat Brain in Stereotaxic Coordinates, 6th ed.; Academic Press: San Diego, CA, USA, 2007; p. 456. [Google Scholar]
- Arabameri, A.; Sameni, H.; Bandeji, A. The effects of propolis extract on ovarian tissue and oxidative stress in rats with maternal separation stress. Int. J. Reprod. Biomed. 2017, 15, 509–520. [Google Scholar] [CrossRef]
- Takeda, K.; Nagamatsu, K.; Okumura, K. A water-soluble derivative of propolis augments the cytotoxic activity of natural killer cells. J. Ethnopharmacol. 2018, 218, 51–58. [Google Scholar] [CrossRef] [PubMed]
- Tandean, S.; Japardi, I.; Loe, M.L.; Riawan, W.; July, J. Protective effects of propolis extract in a rat model of traumatic brain injury via Hsp70 induction. Open Access Maced. J. Med. Sci. 2019, 7, 2763–2766. [Google Scholar] [CrossRef] [PubMed]
- Perlbarg, V.; Lambert, J.; Butler, B.; Felfli, M.; Valabrègue, R.; Privat, A.L.; Lehéricy, S.; Petiet, A. Alterations of the nigrostriatal pathway in a 6-OHDA rat model of Parkinson’s disease evaluated with multimodal MRI. PLoS ONE 2018, 13, e0202597. [Google Scholar] [CrossRef]
- Shimohama, S.; Sawada, H.; Kitamura, Y.; Taniguchi, T. Disease model: Parkinson’s disease. Trends Neurosci. 2003, 9, 360–365. [Google Scholar] [CrossRef]
- Berretta, A.A.; Nascimento, A.P.; Bueno, P.C.; Vaz, M.M.; Marchetti, J.M. PropolisStandardized extract (EPP-AF®), an innovative chemically and biologically reproducible pharmaceutical compound for treating wounds. Int. J. Biol. Sci. 2012, 8, 512–521. [Google Scholar] [CrossRef]
- Reich, S.G.; Savitt, J.M. Parkinson Disease. Med. Clin. North. Am. 2018, 103, 337–350. [Google Scholar] [CrossRef]
- GBD 2015 Neurological Disorders Collaborator Group. Global, regional, and national burden of neurological disorders during 1990–2015: A systematic analysis for the Global Burden of Disease Study 2015. Lancet Neurol. 2017, 16, 877–897. [Google Scholar] [CrossRef]
- Dorsey, E.R.; Elbaz, A.; Nichols, E.; Abd-Allah, F.; Abdelalim, A.; Adsuar, J.C.; Collado-Mateo, D. Global, regional, and national burden of Parkinson’s disease, 1990–2016: A systematic analysis for the Global Burden of Disease Study 2016. Lancet Neurol. 2018, 17, 939–953. [Google Scholar] [CrossRef]
- Cheong, S.L.; Federico, S.; Spalluto, G.; Klotz, K.-N.; Pastorin, G. The current status of pharmacotherapy for the treatment of Parkinson’s disease: Transition from single-target to multitarget therapy. Drug Discov. Today 2019, 24, 1769–1783. [Google Scholar] [CrossRef]
- Hayes, M.T. Parkinson’s disease and Parkinsonism. Am. J. Med. 2019, 132, 802–807. [Google Scholar] [CrossRef] [PubMed]
- Cuenca, L.; Gil-Martinez, A.L.; Cano-Fernandez, L.; Sanchez-Rodrigo, C.; Estrada, C.; Fernandez-Villalba, E.; Herrero, M.T. Parkinson’s disease: A short story of 200 years. Histol. Histopathol. 2019, 34, 573–591. [Google Scholar]
- Dauer, W.; Przedborski, S. Parkinson’s disease: Mechanisms and models. Neuron 2003, 39, 889–909. [Google Scholar] [CrossRef]
- Hernandez-Baltazar, D.; Zavala-Flores, L.M.; Villanueva-Olivo, A. El modelo de 6-hidroxidopamina y la fisiopatología parkinsoniana: Nuevos hallazgos en un viejo modelo. Neurología 2017, 32, 533–539. [Google Scholar] [CrossRef]
- Noelker, C.; Bacher, M.; Gocke, P.; Wei, X.; Klockgether, T.; Du, Y.; Dodel, R. The flavanoide caffeic acid phenethyl ester blocks 6-hydroxydopamine-induced neurotoxicity. Neurosci. Lett. 2015, 383, 39–43. [Google Scholar] [CrossRef]
- Zhang, Y.; Wu, Q.; Zhang, L.; Wang, Q.; Yang, Z.; Liu, J.; Feng, L. Caffeic acid reduces A53T α-synuclein by activating JNK/Bcl-2-mediated autophagy in vitro and improves behaviour and protects dopaminergic neurons in a mouse model of Parkinson’s disease. Pharmacol Res. 2019, 150, 104538. [Google Scholar] [CrossRef]
- Daleprane, J.B.; Abdalla, D.S. Emerging roles of propolis: Antioxidant, cardioprotective, and antiangiogenic actions. Evid. Based Complement. Alternat. Med. 2013, 2013, 175135. [Google Scholar] [CrossRef]
- Jin, X.; Liu, Q.; Jia, L.; Li, M.; Wang, X. Pinocembrin attenuates 6-OHDA-induced neuronal cell death through Nrf2/ARE pathway in SH-SY5Y cells. Cell. Mol. Neurobiol. 2014, 35, 323–333. [Google Scholar] [CrossRef]
- Bazmandegan, G.; Boroushaki, M.T.; Shamsizadeh, A.; Ayoobi, F.; Hakimizadeh, E.; Allahtavakoli, M. Brown propolis attenuates cerebral ischemia-induced oxidative damage via affecting antioxidant enzyme system in mice. Biomed. Pharmacother. 2017, 85, 503–510. [Google Scholar] [CrossRef]
- Farooqui, T.; Farooqui, A.A. Apitherapy. Neuroprotective Effects Phytochem. Neurol. Disord. 2017, 16, 335–358. [Google Scholar]
- Goes, A.T.R.; Jesse, C.R.; Antunes, M.S.; Lobo Ladd, F.V.; Lobo Ladd, A.A.B.; Luchese, C.; Paroul, N.; Boeira, S.P. Protective role of chrysin on 6-hydroxydopamine-induced neurodegeneration a mouse model of Parkinson’s disease: Involvement of neuroinflammation and neurotrophins. Chem. Biol. Interact. 2018, 5, 111–120. [Google Scholar] [CrossRef] [PubMed]
- Barros Silva, R.; Santos, N.A.; Martins, N.M.; Ferreira, D.A.; Barbosa, F.J.; Oliveira Souza, V.C.; Kinoshita, A.; Baffa, O.; Del-Bel, E.; Santos, A.C. Caffeic acid phenethyl ester protects against the dopaminergic neuronal loss induced by 6-hydroxydopamine in rats. Neuroscience 2013, 13, 86–94. [Google Scholar] [CrossRef] [PubMed]
- Filograna, R.; Beltramini, M.; Bubacco, L.; Bisaglia, M. Anti-Oxidants in Parkinson’s disease therapy: A critical point of view. Curr. Neuropharmacol. 2016, 14, 260–271. [Google Scholar] [CrossRef] [PubMed]
- Medeiros, M.S.; Schumacher-Schuh, A.; Cardoso, A.M.; Bochi, G.V.; Baldissarelli, J.; Kegler, A.; Santana, D.; Chaves, C.M.; Schetinger, M.R.; Moresco, R.N.; et al. Iron and oxidative stress in Parkinson’s disease: An observational study of injury biomarkers. PLoS ONE 2016, 11, e0146129. [Google Scholar] [CrossRef] [PubMed]
- Isobe, C.; Abe, T.; Terayama, Y. Levels of reduced and oxidized coenzyme Q-10 1309 and 8-hydroxy-20 -deoxyguanosine in the cerebrospinal fluid of patients with 1310 living Parkinson’s disease demonstrate that mitochondrial oxidative damage 1311 and/or oxidative DNA damage contributes to the neurodegenerative process. Neurosci. Lett. 2010, 469, 159–163. [Google Scholar] [PubMed]
- Zaitone, S.A.; Ahmed, E.; Elsherbiny, N.M.; Mehanna, E.T.; El-Kherbetawy, M.K.; ElSayed, M.H.; Alshareef, D.M.; Moustafa, Y.M. Caffeic acid improves locomotor activity and lessens inflammatory burden in a mouse model of rotenone-induced nigral neurodegeneration: Relevance to Parkinson’s disease therapy. Pharmacol. Rep. 2019, 71, 32–41. [Google Scholar] [CrossRef] [PubMed]
- Prorok, T.; Jana, M.; Patel, D.; Pahan, K. Cinnamic acid protects the nigrostriatum in a mouse model of Parkinson’s disease via peroxisome proliferator-activated receptorα. Neurochem Res. 2019, 44, 751–762. [Google Scholar] [CrossRef]
- Campos, J.F.; Dos Santos, U.P.; da Rocha, P.S.; Damião, M.J.; Balestieri, J.B.; Cardoso, C.A.; Paredes-Gamero, E.J.; Estevinho, L.M.; de Picoli Souza, K.; Dos Santos, E.L. Antimicrobial, antioxidant, anti-inflammatory, and cytotoxic activities of propolis from the stingless bee Tetragonisca fiebrigi (Jataí). Evid. Based Complement. Alternat. Med. 2015, 2015, 296186. [Google Scholar] [CrossRef] [PubMed]
- Haapaniemi, T.H. Ambulatory ECG and analysis of heart rate variability in Parkinson’s disease. J. Neurol. Neurosurg. Psychiatry 2001, 70, 305–310. [Google Scholar] [CrossRef] [PubMed]
- Maheshwari, A.; Norby, F.L.; Soliman, E.Z.; Adabag, S.; Whitsel, E.A.; Alonso, A.; Chen, L.Y. Low Heart Rate Variability in a 2-Minute Electrocardiogram Recording Is Associated with an Increased Risk of Sudden Cardiac Death in the General Population: The Atherosclerosis Risk in Communities Study. PLoS ONE 2016, 11, e0161648. [Google Scholar] [CrossRef] [PubMed]
- Ariza, D.; Lopes, F.N.; Crestani, C.C.; Martins-Pinge, M.C. Chemorefex and barorefex alterations in Parkinsonism induced by 6-OHDA in unanesthetized rats. Neurosci. Lett. 2015, 607, 77–82. [Google Scholar] [CrossRef] [PubMed]
- Falquetto, B.; Tuppy, M.; Potje, S.R.; Moreira, T.S.; Antoniali, C.; Takakura, A.C. Cardiovascular dysfunction associated with neurodegeneration in an experimental model of Parkinson’s disease. Brain Res. 2017, 1657, 156–166. [Google Scholar] [CrossRef] [PubMed]
- Nejm, M.B.; Guimarães-Marques, M.J.; Oliveira, L.F.; Damasceno, L.; Andersen, M.L.; Tufik, S.; Fonseca, F.; Olszewer, E.; Leça, R.; de Almeida, A.C.G.; et al. Assessment of vitamin D and inflammatory markers profile in cardiac tissue on Parkinson disease animal model. Pharmacol. Rep. 2020, 72, 296–304. [Google Scholar] [CrossRef] [PubMed]
- Metzger, J.M.; Moore, C.F.; Boettcher, C.A.; Brunner, K.G.; Fleddermann, R.A.; Matsof, H.N.; Resnikof, H.A.; Bondarenko, V.; Kamp, T.J.; Hacker, T.A.; et al. In vivo imaging of infammation and oxidative stress in a nonhuman primate model of cardiac sympathetic neurodegeneration. NPJ Parkinsons Dis. 2018, 4, 22. [Google Scholar] [CrossRef]
- De Jager, L.; Amorim, E.D.T.; Lucchetti, B.F.C.; Lopes, F.N.C.; Crestani, C.C.; Pinge-Filho, P.; Martins-Pinge, M.C. Nitric oxide alterations in cardiovascular system of rats with Parkinsonism induced by 6-OHDA and submitted to previous exercise. Life Sci. 2018, 204, 78–86. [Google Scholar] [CrossRef]
- Lessard, A.; Couture, R. Modulation of cardiac activity by tachykinins in the rat substantia nigra. Br. J. Pharmacol. 2001, 134, 1749–1759. [Google Scholar] [CrossRef]
- Thornton, J.M.; Aziz, T.; Schlugman, D.; Paterson, D.J. Electrical stimulation of the midbrain increases heart rate and arterial blood pressure in awake humans. J. Physiol. 2002, 539, 615–621. [Google Scholar] [CrossRef]
- Lin, M.T.; Yang, J.J. Stimulation of the nigrostriatal dopamine system produces hypertension and tachycardia in rats. Am. J. Physiol.-Heart C 1994, 266, H2489–H2496. [Google Scholar] [CrossRef]
- Angyán, L. Role of the substantia nigra in the behavioural-cardiovascular integration in the cat. Acta Physiol. Hung. 1989, 74, 175–187. [Google Scholar]
- Roedter, A.; Winkler, C.; Samii, M.; Walter, G.F.; Brandis, A.; Nikkhah, G. Comparison of unilateral and bilateral intrastriatal 6-hydroxydopamine-induced axon terminal lesions: Evidence for interhemispheric functional coupling of the two nigrostriatal pathways. J. Comp. Neurol. 2001, 432, 217–229. [Google Scholar] [CrossRef]
- Stott, S.R.W.; Barker, R.A. Time course of dopamine neuron loss and glial response in the 6-OHDA striatal mouse model of Parkinson’s disease. Eur. J. Neurosci. 2013, 39, 1042–1056. [Google Scholar] [CrossRef]
- Ciccone, A.B.; Siedlik, J.A.; Wecht, J.M.; Deckert, J.A.; Nguyen, N.D.; Weir, J.P. Reminder: RMSSD and SD1 are identical heart rate variability metrics. Muscle Nerve 2017, 56, 674–678. [Google Scholar] [CrossRef] [PubMed]
- Mastrocola, C.; Vanacore, N.; Giovani, A.; Locuratolo, N.; Vella, C.; Alessandri, A.; Meco, G. Twenty-four-hour heart rate variability to assess autonomic function in Parkinson’s disease. Acta Neurol. Scand. 1999, 99, 245–247. [Google Scholar] [CrossRef] [PubMed]
- Devos, D.; Kroumova, M.; Bordet, R.; Vodougnon, H.; Guieu, J.D.; Libersa, C.; Destee, A. Heart rate variability and Parkinson’s disease severity. J. Neural Transm. Suppl. 2003, 110, 997–1011. [Google Scholar]
- Pilotto, A.; Turrone, R.; Liepelt-Scarfone, I.; Bianchi, M.; Poli, L.; Borroni, B.; Alberici, A.; Premi, E.; Formenti, A.; Bigni, B.; et al. Vascular risk factors and cognition in Parkinson’s disease. J. Alzheimers Dis. 2016, 51, 563–570. [Google Scholar] [CrossRef] [PubMed]
- Ke, J.Q.; Shao, S.M.; Zheng, Y.Y.; Fu, F.W.; Zheng, G.Q.; Liu, C.F. Sympathetic skin response and heart rate variability in predicting autonomic disorders in patients with parkinson disease. Medicine 2017, 96, e6523. [Google Scholar] [CrossRef] [PubMed]
- Yoon, J.H.; Kim, M.S.; Lee, S.M.; Kim, H.J.; Hong, J.M. Heart rate variability to differentiate essential tremor from early-stage tremor-dominant Parkinson’s disease. J. Neurol. Sci. 2016, 368, 55–58. [Google Scholar] [CrossRef] [PubMed]
- Lanza, G.A.; Sgueglia, G.A.; Cianflone, D.; Rebuzzi, A.G.; Angeloni, G.; Sestito, A.; Infusino, F.; Crea, F.; Maseri, A. Stratificazione prognosticadell’ angina instabile investigators. Relation of heart rate variability to serum levels of C-reactive protein in patients with unstable angina pectoris. Am. J. Cardiol. 2006, 97, 1702–1706. [Google Scholar] [CrossRef]
- Ridker, P.; Rifai, N.; Stampfer, M.J.; Hennekens, C.H. Plasma concentration of interleukin-6 and the risk of future myocardial infarction among apparently healthy men. Circulation 2000, 101, 1767–1772. [Google Scholar] [CrossRef]
- Lobbes, M.B.; Lutgens, E.; Heeneman, S.; Cleutjens, K.B.; Kooi, M.E.; van Engelshoven, J.M.; Daemen, M.J.; Nelemans, P.J. Is there more than C-reactive protein and fibrinogen? The prognostic value of soluble CD40 ligand, interleukin-6 and oxidized low-density lipoprotein with respect to coronary and cerebral vascular disease. Atherosclerosis 2006, 187, 18–25. [Google Scholar] [CrossRef]
- Ben, V.; Bruguerolle, B. Efects of bilateral striatal 6-OHDA lesions on circadian rhythms in the rat: A radiotelemetric study. Life Sci. 2000, 67, 1549–1558. [Google Scholar] [CrossRef]
- Boulamery, A.; Simon, N.; Vidal, J.; Bruguerolle, B. Efects of L-Dopa on circadian rhythms of 6-OHDA striatal lesioned rats: A radiotelemetric study. Chronobiol. Int. 2010, 27, 251–264. [Google Scholar] [CrossRef] [PubMed]
- Silva, A.S.; Ariza, D.; Dias, D.P.; Crestani, C.C.; Martins-Pinge, M.C. Cardiovascular and autonomic alterations in rats with Parkinsonism induced by 6-OHDA and treated with L-DOPA. Life Sci. 2015, 127, 82–89. [Google Scholar] [CrossRef] [PubMed]
- Wong, K.K.; Raffel, D.M.; Bohnen, N.I.; Altinok, G.; Gilman, S.; Frey, K.A. 2-Year natural decline of cardiac sympathetic innervation in idiopathic Parkinson Disease studied with 11C-Hydroxyephedrine PET. J. Nucl. Med. 2017, 58, 326–331. [Google Scholar] [CrossRef]
- Wills, A.M.; Pérez, A.; Wang, J.; Su, X.; Morgan, J.; Rajan, S.S.; Leehey, M.A.; Pontone, G.M.; Chou, K.L.; Umeh, C.; et al. Association between change in body mass index, unified Parkinson’s disease rating scale scores, and survival among persons with Parkinson Disease: Secondary analysis of longitudinal data from NINDS exploratory trials in Parkinson Disease long-term study 1. JAMA Neurol. 2016, 73, 321–328. [Google Scholar] [CrossRef]
- Ma, K.; Xiong, N.; Shen, Y.; Han, C.; Liu, L.; Zhang, G.; Wang, L.; Guo, S.; Guo, X.; Xia, Y.; et al. Weight loss and malnutrition in patients with Parkinson’s disease: Current knowledge and future prospects. Front. Aging Neurosci. 2018, 20. [Google Scholar] [CrossRef]
- Kashihara, K. Weight loss in Parkinson’s disease. J. Neurol. 2006, 253, 38–41. [Google Scholar] [CrossRef]
- Umehara, T.; Nakahara, A.; Matsuno, H.; Toyoda, C.; Oka, H. Body weight and dysautonomia in early Parkinson’s disease. Acta Neurol. Scand. 2016, 135, 560–567. [Google Scholar] [CrossRef]
- Cumming, K.; Macleod, A.D.; Myint, P.K.; Counsell, C.E. Early weight loss in parkinsonism predicts poor outcomes. Neurology 2017, 89, 2254–2261. [Google Scholar] [CrossRef]
- Guimarães, J.; Moura, E.; Silva, E.; Aquiar, P.; Garrett, C.; Vieira-Coelho, M.A. Locus coeruleus is involved in weight loss in a rat model of Parkinson’s disease: An effect reversed by deep brain stimulation. Brain Stimul. 2013, 6, 845–855. [Google Scholar] [CrossRef]


| Mean | Standard Deviation | Skewness | Kurtosis | |
|---|---|---|---|---|
| Sham | 0.1467 | 0.0072 | 1.5494 | 3.4277 |
| Sham + Propolis | 0.1723 | 0.0143 | −0.9413 | 4.9860 |
| 6-OHDA | 0.2415 | 0.1675 | 1.0905 | 3.3249 |
| 6-OHDA + Propolis | 0.1889 | 0.0080 | −0.9608 | 15.3378 |
© 2020 by the authors. Licensee MDPI, Basel, Switzerland. This article is an open access article distributed under the terms and conditions of the Creative Commons Attribution (CC BY) license (http://creativecommons.org/licenses/by/4.0/).
Share and Cite
C. Gonçalves, V.; J. L. L. Pinheiro, D.; de la Rosa, T.; G. de Almeida, A.-C.; A. Scorza, F.; A. Scorza, C. Propolis as a Potential Disease-Modifying Strategy in Parkinson’s disease: Cardioprotective and Neuroprotective Effects in the 6-OHDA Rat Model. Nutrients 2020, 12, 1551. https://doi.org/10.3390/nu12061551
C. Gonçalves V, J. L. L. Pinheiro D, de la Rosa T, G. de Almeida A-C, A. Scorza F, A. Scorza C. Propolis as a Potential Disease-Modifying Strategy in Parkinson’s disease: Cardioprotective and Neuroprotective Effects in the 6-OHDA Rat Model. Nutrients. 2020; 12(6):1551. https://doi.org/10.3390/nu12061551
Chicago/Turabian StyleC. Gonçalves, Valeria, Daniel J. L. L. Pinheiro, Tomás de la Rosa, Antônio-Carlos G. de Almeida, Fúlvio A. Scorza, and Carla A. Scorza. 2020. "Propolis as a Potential Disease-Modifying Strategy in Parkinson’s disease: Cardioprotective and Neuroprotective Effects in the 6-OHDA Rat Model" Nutrients 12, no. 6: 1551. https://doi.org/10.3390/nu12061551
APA StyleC. Gonçalves, V., J. L. L. Pinheiro, D., de la Rosa, T., G. de Almeida, A.-C., A. Scorza, F., & A. Scorza, C. (2020). Propolis as a Potential Disease-Modifying Strategy in Parkinson’s disease: Cardioprotective and Neuroprotective Effects in the 6-OHDA Rat Model. Nutrients, 12(6), 1551. https://doi.org/10.3390/nu12061551