Article

Total Energy Expenditure, Body Composition, Physical Activity, and Step Count in Japanese Preschool Children: A Study Based on Doubly Labeled Water

1
National Institute of Health and Nutrition, National Institutes of Biomedical Innovation, Health and Nutrition, Tokyo 162-8636, Japan
2
Institute for Active Health, Kyoto University of Advanced Science, Kyoto 621-8555, Japan
3
Faculty of Health and Sport Sciences, University of Tsukuba, Ibaraki 305-8577, Japan
4
Department of Health, Sports and Nutrition, Faculty of Health and Welfare, Kobe Women’s University, Hyogo 650-0046, Japan
5
Faculty of Education, Bukkyo University, Kyoto 603-8301, Japan
6
Kyoto Compulsory Education School Attached to Kyoto University of Education, Kyoto 603-8163, Japan
7
Fukuoka University Institute for Physical Activity and Faculty of Sports and Health Science, Fukuoka University, Fukuoka 814-0180, Japan
8
Faculty of Health and Medical Sciences, Kyoto University of Advanced Science, Kyoto 621-8555, Japan
*
Author to whom correspondence should be addressed.
Nutrients 2020, 12(5), 1223; https://doi.org/10.3390/nu12051223
Submission received: 26 March 2020 / Revised: 19 April 2020 / Accepted: 23 April 2020 / Published: 26 April 2020
(This article belongs to the Special Issue Dietary Intake and Physical Activity for Human Health)

Abstract

:
Adequate energy intake is essential for the healthy development of children, and the estimated energy requirement of children is determined by total daily energy expenditure (TDEE) and energy deposition for growth. A previous study in Japanese tweens indicated that TDEE could be estimated by fat-free mass (FFM) and step count. The aims of this study were to measure TDEE in Japanese preschool children and to confirm whether TDEE can be estimated by FFM and step count in preschool children. Twenty-one children aged 4–6 years old (11 girls and 10 boys; age, 5.1 (0.9) years; height, 107.2 (6.6) cm; weight, 17.5 (1.7) kg; BMI, 15.3 (1.3); mean (SD)) participated in this study. FFM and 7-day TDEE were obtained by doubly labeled water (DLW). Participants wore accelerometers during the DLW measurement period. No significant differences were observed in age-adjusted height, weight, BMI, FFM (13.0 (1.5) kg), or TDEE (1300 (174) kcal/day) between girls and boys. Girls had significantly higher percent fat and a lower daily step count than boys. Stepwise regression analysis revealed that FFM and step count were significant predictors of TDEE; TDEE (kcal/day) = 85.0 × FFM (kg) + 0.0135 × step count (steps/day). This accounted for 74% of TDEE variance. The current study confirmed that FFM and step count are major determinants of TDEE in Japanese preschool children as well as adolescents, although further research is needed to obtain precise equations.

1. Introduction

Nutrition-related factors contribute to approximately 45% of deaths in children aged under 5 years (mainly due to undernutrition) as well as malnutrition in all its forms, such as wasting, stunting, and overweight or obesity, interrupting the healthy growth and development of children worldwide [1,2]. The double burden of malnutrition is considered to be one of the greatest global health issues. Stunting and wasting are the result of poor nutrient intake and/or disease; globally, approximately 149 million children and over 49 million children under 5 years old suffer from stunting and wasting, respectively. Overweight and obesity are another emerging face of malnutrition; currently, over 40 million children globally are overweight or obese, an increase of 10 million since 2000 [1]. The first law of thermodynamics indicates that excess energy intake compared with energy expenditure induces weight gain [3,4]. On the contrary, energy deficiency induces stunting and/or wasting during childhood growth, particularly under the conditions of physically active lifestyle and a heavy burden of infectious disease [5]. Therefore, the assessment of today daily energy expenditure (TDEE) is an essential component of clinical nutrition in children. To measure TDEE in a free-living environment, the doubly labeled water (DLW) technique is considered a standard method. However, the DLW method is limited for research purposes because it is very expensive and involves time-consuming analysis. Therefore, to establish prediction equations for TDEE, more convenient and practical variables, such as daily step counts and body size or composition, are needed in the clinical setting.
The current study aimed to investigate TDEE and to establish a prediction equation of TDEE in Japanese preschool children aged 4–6 years old. At present, there are little data available on TDEE of preschool children in Asia. A previous study examined the TDEE of Japanese tweens (10–12 years old) using DLW and found that their TDEE was comparable to the United States and Canada dietary reference intakes after adjusting for age, body weight, and height [6]. In addition, the authors reported that the participants’ TDEE could be predicted by fat-free mass (FFM) and daily step count [6]. We hypothesized that TDEE could be predicted with FFM and daily step count in preschool children as well as tweens, but the prediction equation is slightly different from that used for tweens because the proportions of basal metabolic rate (BMR) and activity energy expenditure against TDEE differ between preschool children and tweens [7,8,9,10]. A previous study underscored that the choice of pedometer had a substantial impact on step counts in preschool children [11]. Therefore, we conducted an additional experiment to compare pedometers in our study cohort.

2. Materials and Methods

2.1. Participants

We recruited 23 healthy preschool children aged 4–6 years old from one kindergarten in an urban area in Osaka city, Osaka prefecture, Japan. One child had a fever and canceled their appointment, and one child was unable to completely ingest the DLW. Therefore, we analyzed data from 21 children (11 girls and 10 boys). The measurements were taken in December 2014. Climate statistics during the study period were acquired from the official Japanese government website (Japan Meteorological Agency). The inclusion criteria were healthy subjects without acute or chronic illness, with informed consent to participate in the study obtained from their parents. The experimental protocol was compliant with the Declaration of Helsinki and conducted with the approval of the ethics committee of Bukkyo University (H26-45) and Kyoto Prefectural University of Medicine (E-382). Body weight was measured using an electronic scale to the nearest 0.1 kg with the participants dressed in light clothing. Barefoot standing height was measured to the nearest 0.1 cm using a stadiometer. The BMI percentile was not an exclusion criterion in this study. Overweight and obesity were determined using the international definitions for childhood obesity developed in a workshop organized by the International Obesity Task Force (IOTF) [12]. The IOTF used six nationally representative growth studies and constructed BMI growth curves such that the curves at 18 years of age pass through BMI cutoff points of 25 and 30 for adults [13]. Thinness, which was determined using a previous study that used the same dataset from IOTF, was defined as the curve passing through a BMI of 18.5 at age 18 [14].

2.2. TEE and Body Composition Measurement with DLW

TEE was measured for 7 days using the DLW method. Upon arrival at the kindergarten on day 0, a urine sample was acquired for the measurement of baseline 2H and 18O enrichment before the DLW dose. Each participant drank DLW containing a premixed dose of approximately 0.12 g/kg estimated total body water (TBW) of 2H2O (99.8 at.%, Taiyo Nippon Sanso, Tokyo, Japan) and 2.5 g/kg estimated TBW of H218O (10.0 at.%, Taiyo Nippon Sanso) [15]. Urine samples were collected in the morning and evening of the next day (day 1, Dec. 9th) as well as day 8 (Dec. 16th). The urine samples were stored frozen at −15 °C for later analysis by isotope ratio mass spectrometry (IRMS, Hydra 20-20, Sercon Ltd., Crewe, UK) at Fukuoka University Research Institute for Physical Activity (FUIPA). Detailed analysis using IRMS was conducted as previously described [15,16].
The dilution space of 18O and 2H (No and Nd, respectively) was determined by dividing the dose of the administered tracer by the intercept method using two day 1 samples and two day 8 samples. All samples collected on day 8 exceeded 8‰ from baseline. The Nd/No values of the present study (1.032 ± 0.015, range 1.007–1.055) were similar to those of previous studies [17,18]. Thus, total body water (TBW) (g) was calculated as the average of the value obtained with Nd divided by 1.041 and No divided by 1.007. TBW (mol) was obtained as TBW (g)/18.02. The elimination rate of 18O and 2H (ko and kd, respectively) was determined, and the carbon dioxide production rate (rCO2) (mol/day) was calculated as 0.4554 × TBW (mol) × (1.007ko − 1.041kd), with the assumption that isotope fractionation applies only to breath water using Equation (A6) by Schoeller et al. [19], with the revised dilution space constant provided by Racette et al. [17]. The rCO2 (L/d) was obtained as 22.4 × rCO2 (mol/day). We assumed that the respiratory quotient (RQ) was 0.87 [20], and TEE was calculated using the modified Weir’s equation [21] as follows: TDEE (kcal/d) = 1.1rCO2 + 3.9rCO2/RQ. The quality checklist is described in International Atomic Energy Agency (IAEA) documents [22]. FFM was calculated using TBW with the age-dependent hydration factor of children [23]. Fat mass (FM) and percent fat (%fat) were calculated using FFM and body weight.
The predicted BMR was calculated using the equation of the Recommended Dietary Allowances for Japanese [24] as in previous studies [16], which systematically reviewed the previous BMR measurements in the Japanese population and established equations with age categories from infants to older adults. The physical activity level (PAL) was calculated as TDEE divided by the BMR predicted by the Japanese equation [25,26]. For further analysis, we also calculated BMR from the Schofield equation [27,28].

2.3. Step Count Measurement with Accelerometer-Based Pedometers

Daily step counts were monitored by a triaxial accelerometer (Actimarker, Panasonic, Osaka, Japan) [15,29,30,31]. Preschool children have a variety of physical movements and are forgetful and may easily lose or break their pedometers. Therefore, the accelerometers were placed into a small waist pouch (Kid’s SPIbelt®, Austin, TX, USA) and immobilized by taping on cardboard in the pocket. This small waist pouch was made for children to carry various medical monitoring devices during their daily living condition. The pocket is expandable, secure, low-profile, and can tightly hold medical monitoring supplies, such as an insulin pump, continuous glucose monitoring, or EpiPens close to their hips without tangling or bouncing. The pouch is very light and has an adjustable strap for the waist circumferences for children. Its elastic belt fits waist size of 46 to 68 cm. The pocket size is 3 cm x 14 cm. The fastener of the pouch was locked by researchers and children and parents could not access and manipulate the accelerometers during the measurement. We confirmed that the accelerometers tightly contacted their hip. We explained the importance to fasten the belt of the waist pouch to tight around subject’s waist to their parents and kindergarten teachers, and let them to check the tightness regularly for the length of the study. We had compared our current method to simply wearing the accelerometer on an elastic band that ensures that it is tight against the hips of preschool children. No statistical difference was found between step counts of an Actimarker simply worn on an elastic band against the hip and that of an Actimarker placed in the SPIbelt pouch. The subjects wore the accelerometer from the morning of day 0 to the morning of day 9. The participants were requested to wear these devices at all times, with the exception of special circumstances, such as when dressing, bathing, swimming, and sleeping. We analyzed seven consecutive days’ data (days 1 and 8), excluding the days that subjects started wearing and removed the accelerometers. As in previous studies [11,32], we excluded values below 1000 steps/day and above 30,000 steps/day and treated them as missing data. Two days from one child and one day from two other children were excluded because both Actimarker and Lifecorder recorded <1000 steps/day; the excluded days accounted for 2.7% of the total observed days. We excluded non-valid days based on the previous recommendation [33,34]. Wear time was determined by subtracting non-wear time from 24 h. Non-wear time was defined by an interval of at least 60 convective minutes of zero activity intensity [33], and a recent recommendation of not allowing any interruptions in the child population was followed [34].

2.4. Statistical Analysis

The sample size was calculated using multiple linear regression analysis to establish a prediction equation for TDEE with two predictors (FFM and step counts) with an effect size f2 of 0.5, α of 0.5, and power of 0.80, requiring a sample size of 18 (G*Power 3.1.9.7, Universität Kiel, Germany). The results are presented as mean ± SD except where indicated. Analysis of covariance (ANCOVA) was used to analyze sex differences, and data were adjusted for age because age is a critical determining factor during the rapid growth phase (from 0 to 6 years old). Simple correlations were conducted using both the Pearson and Spearman methods to confirm the relationship because of the small sample size. To examine factors related to TDEE, partial correlation analysis was applied, with sex, age, height, weight or FFM, and FM or %fat as adjusting variables. To standardize FFM or FM, FFM and FM were treated as covariates because the intercept of the linear regression of TDEE against FFM or FM is significantly different from zero. Multiple linear regression analyses for predicting TDEE, FFM, and daily step counts were entered into the regression equation simultaneously. To confirm the result, stepwise regression analysis was also conducted; age, weight, height, BMI, percent body fat, as well as FFM and step counts were independent variables, and TDEE was the dependent variable, with 0.05 entry and 0.10 removal for the probability of F. Differences between the two accelerometers were analyzed using Pearson correlation and a Bland–Altman plot. The threshold for statistical significance was p < 0.05. SPSS ver. 22 (IBM Inc., Tokyo, Japan) was used for all statistical analyses.

3. Results

3.1. Climate Statistics during the Study Period

The mean monthly air temperature was 27.8 °C in July and August and 5.8 °C in February for 2014 in Osaka, Japan. During the study period, the mean air temperature was 7.2 °C, the daily maximum temperature was 10.4 °C, the daily minimum temperature was 4.3 °C, the mean wind speed was 3.1 m/s, and the relative humidity was 61.6%. Precipitation (rainfall) was countable on two days between Dec 9th and 16th, 2014. The latitude of Osaka is 34.7, and the longitude is 135.5; the study region is classified as a humid subtropical climate area.

3.2. Physical Characteristics and Sex Difference

Table 1 shows the physical characteristics, body composition, energy expenditure, and daily step counts of the participants. The mean (SD) of TDEE, weight, FFM, and step counts were 1300 (174) kcal/d, 17.5 (1.7) kg, and 13.0 (1.5) kg, respectively. No participants were classified as overweight or obese. One boy and two girls were classified as thin. The mean of TDEE of the three thin children was 1275 (233) kcal/day, and that of the other 18 children was 1305 (170) kcal/day. The mean (SD) of the wear time was 13.3 (1.5) hour/day. The mean (SD) of the step counts recorded by Actimarker and Lifecorder was 14,742 (4083) and 11,547 (3024) steps/day, respectively. The BMR estimated by the Japanese equation was slightly higher than but relatively similar to that of Schofield (3.8%). The BMR estimated by the Japanese equation was highly correlated with that of Schofield (r = 0.907, p < 0.001).

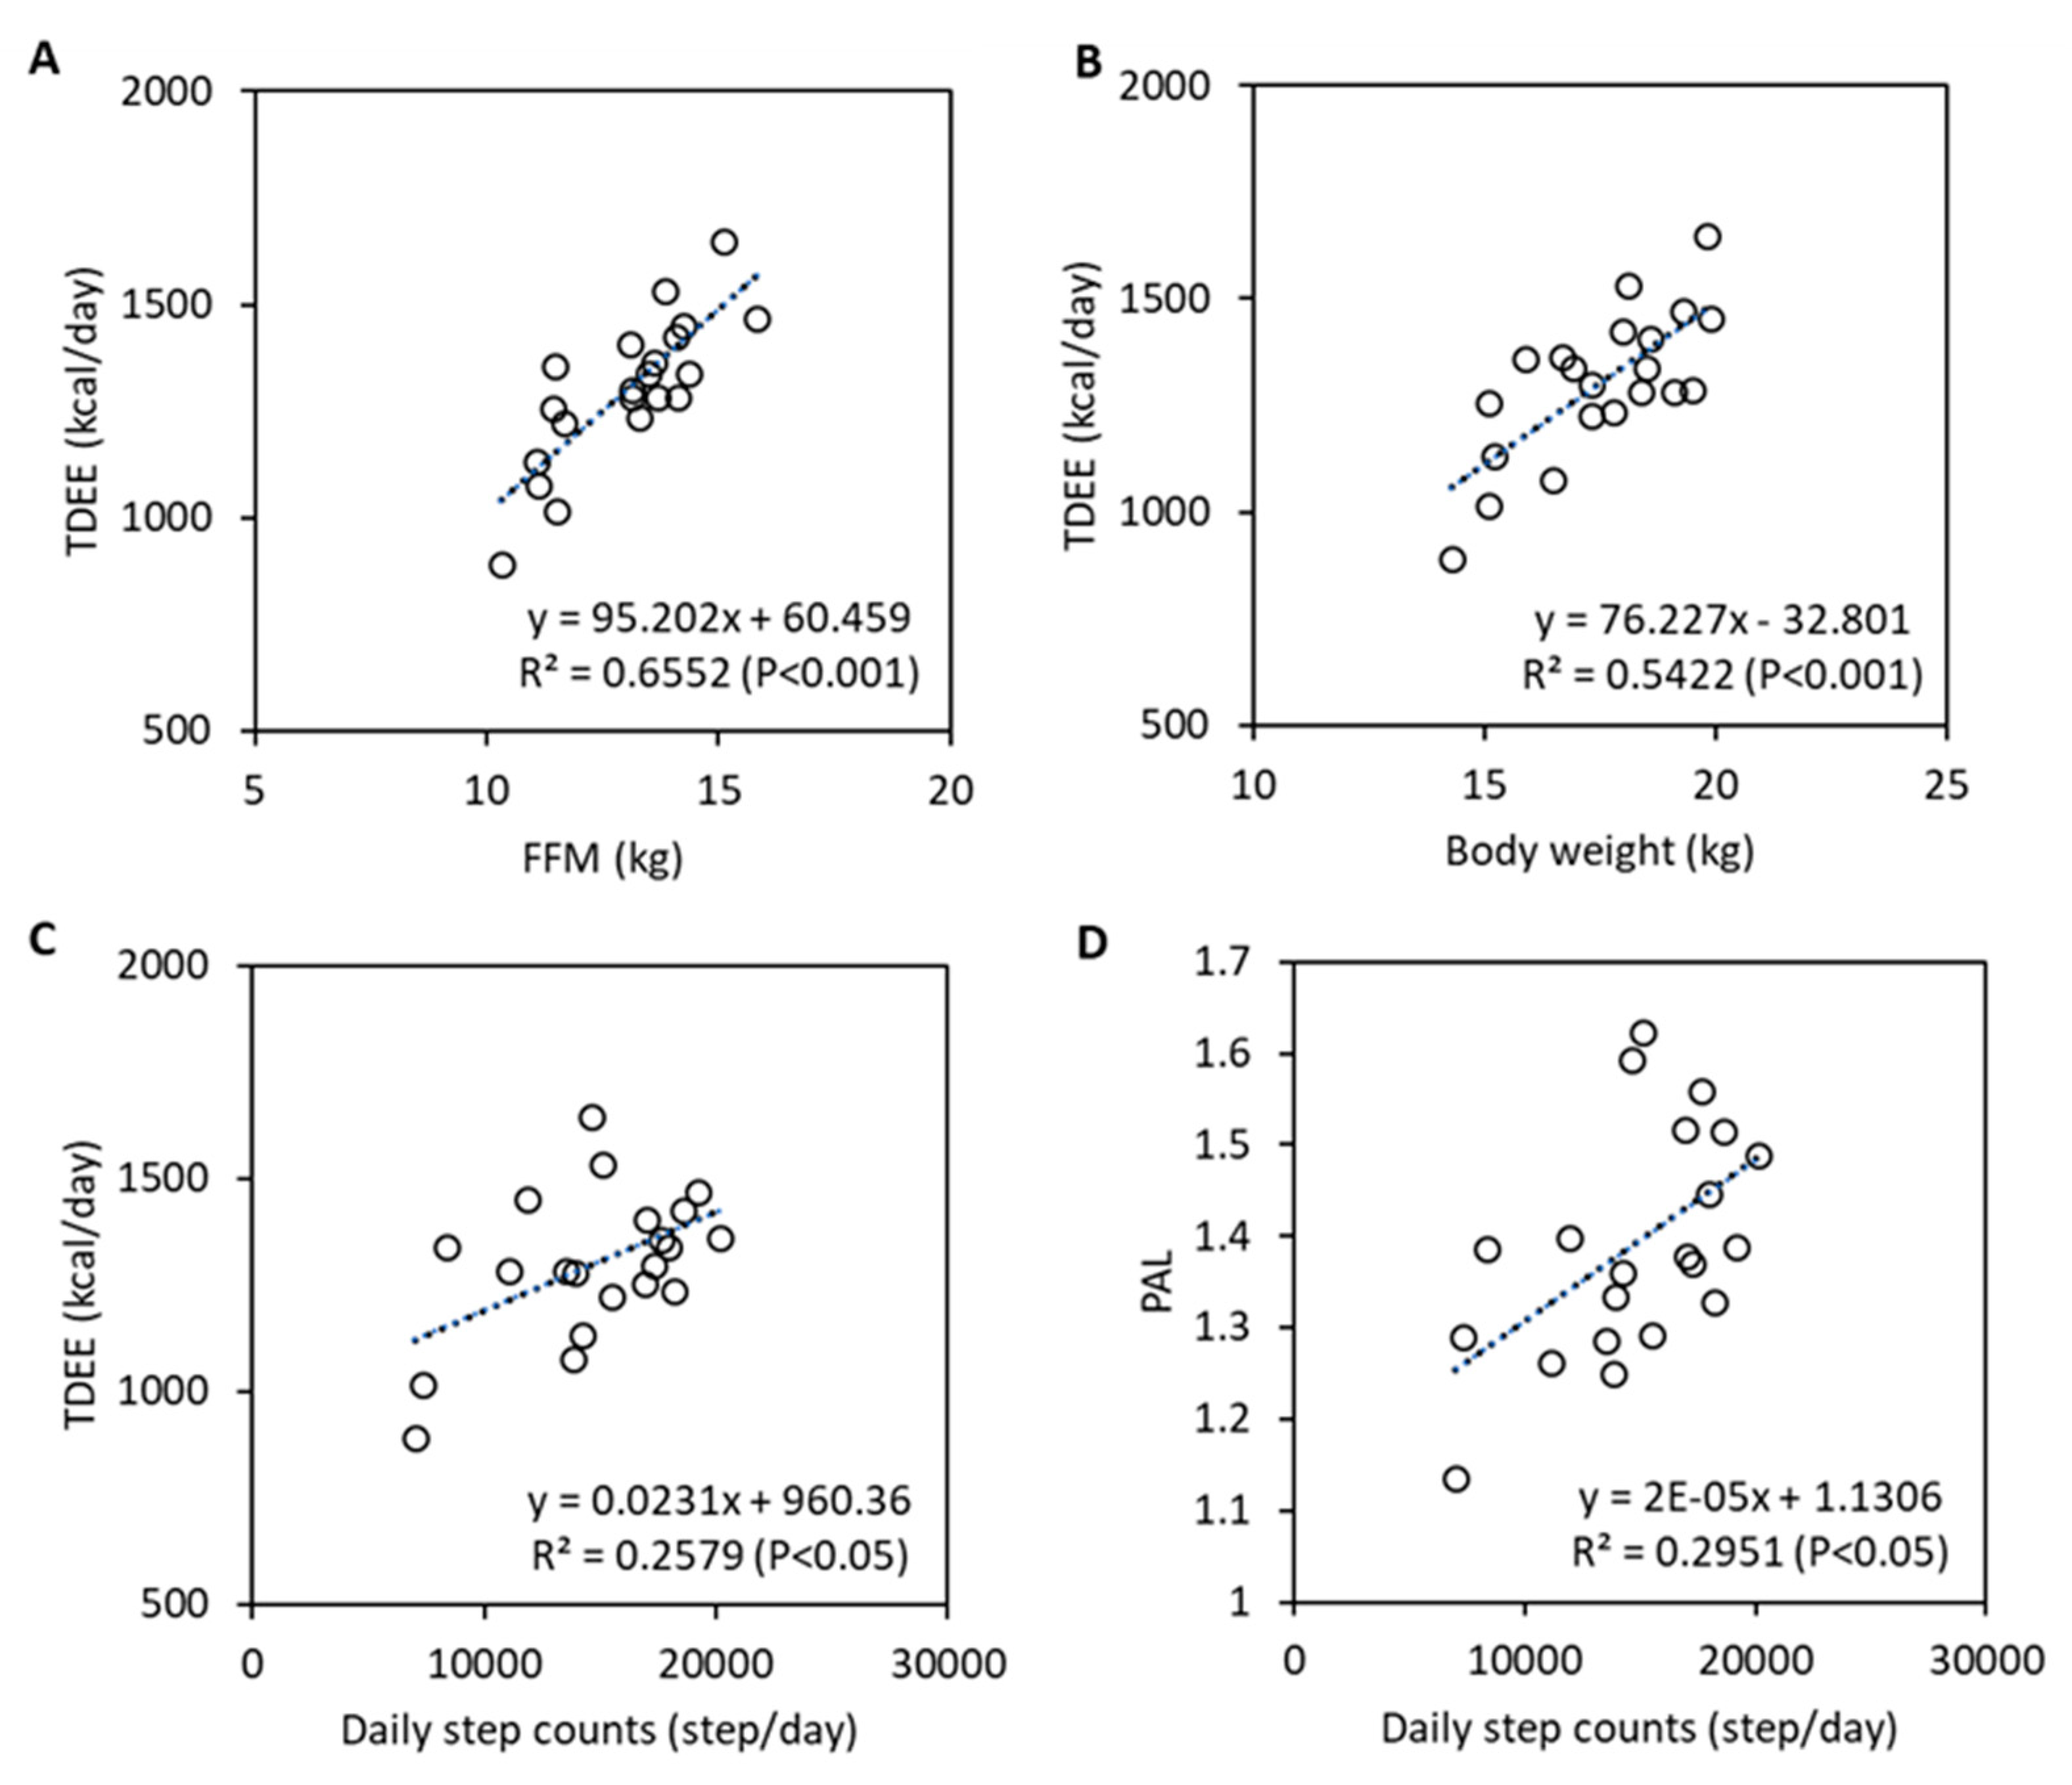
3.3. Determinants of TDEE

To examine the sex differences of the measured variables, ANCOVA was used with adjustments for age because age is a critical factor for preschool children. The marginal mean and standard error of the mean (SEM) were obtained with age as a covariate (mean age of 5.1 years) and are shown in Table 2. There were no significant differences between girls and boys in height, weight, BMI, FFM, TDEE, estimated BMR, or PAL. Girls had significantly higher FM and %fat and lower step counts than boys.
Figure 1 shows the relationship between TDEE and FFM, body weight, or step counts, and between PAL and step counts. FFM, body weight, and step counts were significantly correlated with TDEE, and step counts were significantly correlated with PAL both in Pearson and Spearman correlation coefficients. Table 3 shows the partial correlation coefficients between TDEE and the other variables. Height, weight, FFM, and step counts were significantly correlated with TDEE, even after adjusting for sex and age. After adjusting for height as well as sex and age, the weight, FFM, and step counts were still significantly correlated with TDEE. Step counts were still significantly correlated with TDEE, even after adjusting for age, height, weight or FFM, and FM or %fat.
We conducted stepwise multiple linear regression analysis with TDEE as a dependent variable. The potential predictors were sex, age, height, weight, FFM, FM, %fat, and step counts. FFM and step counts were selected as significant predictors of TDEE. Table 4 shows the regression coefficients and their 95% confidence intervals. The equation was TDEE (kcal/day) = 85.0 × FFM (kg) + 0.0135 × step count (steps/day) − 4.7. This accounted for 74% of the TDEE variance. If we used weight instead of FFM, the equation was TDEE (kcal/day) = 70.2 × Weight (kg) + 0.0187 × step count (steps/day) − 204.3. This accounted for 71% of the TDEE variance.

4. Discussion

This study aimed to examine TDEE and its determinants in Japanese preschool children aged 4–6 years old. We found that the mean (SD) of TDEE was 1300 (174) kcal/day for the total sample of children. After controlling for age (with a value of 5.1), the marginal means and SEMs of TDEE in girls and boys were 1282 ± 57 and 1320 ± 60 kcal/day, respectively. Simple and partial correlation indicated that FFM and daily step counts were significantly correlated with TDEE, and the correlation was independent of their age, sex, and height. Stepwise regression analysis revealed that FFM and step count were significant predictors of TDEE. Although our study used a small sample size because of the high cost of isotopes and analysis of DLW, the result is important for establishing an accurate estimated energy requirement (EER) for Asian preschool children because, to date, such an analysis has been carried out in only one study (in the Japanese language) so far, which examined the TDEE of eight Japanese preschool children with short stature [35].
The current Japanese dietary reference intake (Japanese-DRI 2020) reviewed DLW studies in preschool children from North America or European countries to tentatively establish EER: the EERs are 1250 and 1300 for 3–5-year-old girls and boys, respectively [10]. In the DRI, the reference height is 103.2 and 103.6, and the reference weight is 16.1 and 16.5 kg in girls and boys, respectively. The present TDEE values are comparable to the current EER and demonstrate the usefulness of the current EER for Japanese preschool children aged around 5 years. A previous study on eight Japanese children with short stature (mean (SD) age, 5.2 (0.5) years; height 96.2 (2.5) cm; 13.4 (1.2) kg) found a TDEE of 1133 (162) kcal/day [35]. This value is lower than that in our current study and the current DRI because the height and weight were lower than reference values. Several studies suggest that there are potential racial/ethnic differences in energy metabolism, body size, and whole-body or organ-specific composition [36,37,38]. At present, we do not have enough data for Asian populations, so further studies are needed.
We found that the FFM and step counts correlated with TDEE, and the relationship was independent of age, sex, height, or %fat. Additionally, TDEE could be predicted by FFM and step counts. Our sample size was small, and the age range was limited, so the contribution of age, sex, or FM to the variance of TDEE is unknown, but the current results indicate the important effects of FFM and physical activity on TDEE. This conclusion is supported by previous research that found that FFM and step counts significantly contributed to the variance of TDEE in Japanese tweens aged 10–12 years [6]. The equation used in the current study was TDEE (kcal/day) = 85.0 × FFM (kg) + 0.0135 × step count (steps/day) for our preschool children, and this equation accounted for 74% of the TDEE variance. The established equation for tweens aged 10–12 years in previous research was TDEE (kcal/day) = 51.1 × FFM (kg) + 0.0505 × step count (steps/day) − 177 [6]. The limited sample size gave us a large 95% CI for the regression coefficients, and this limitation needs some attention. However, the coefficient of FFM was larger for preschool children compared with tweens. There are several possible reasons for these findings: the proportion of “metabolically active organs” which have a higher metabolic rate (such as heart and kidneys, brain, and liver [39,40]) against FFM decreases with growth [41]; the metabolic rate of organs such as the brain also decreases with growth [42,43]. By contrast, the standardized beta of the coefficients of FFM against TDEE is identical between our study and the previous study.
For step counts, the regression coefficients in the preschool children were about one-fourth that in tweens. A potential explanation is that the proportion of activity-based energy expenditure against TDEE is much lower in preschool children aged 4–6 (mean (SD) of PAL, 1.44 (0.15)) than in tweens aged 10–12 (1.60 (0.16) and 1.56 (0.19) in boys and girls, respectively). This phenomenon is confirmed by the description of several national dietary reference intake guidelines [8,9,10]. This may be a potential mechanism for the lower contribution of step counts to TDEE in our preschool children than the previously studied tweens [6]. Although the regression coefficients might be different between age groups, FFM and step counts were still important predictive variables for TDEE in children.
Previous studies have reported that the physical activity of children is different between spring, summer, fall, and winter: children are less active in winter in areas of a particular climate, including but not limited to Edmonton, Norway, South West England, Denmark, and Auckland [44,45,46,47,48]. We conducted our experiment in December in a humid subtropical climate area in which the mean air temperature was 7.2 °C. The experiments of the previous study in Japanese tweens [6] were also conducted in November, November–December, and February in an area with a climate similar to that of the Osaka prefecture. Therefore, we suggest comparing the current result with the previous study to explore seasonal effects on physical activity [6]. Another previous study also suggested that the rainfall decreased daily step counts, although most effects of day length, wind speed, and hours of bright sunshine on step counts were trivial or unclear [47]. However, as the previous study on Japanese tweens [6] did not describe rainfall or other weather information, further studies are needed to evaluate the influence of rainfall.
Estimated TDEE can be provided by Actimarker, and it has been validated against DLW and indirect calorimetry in adult populations [15,30,49]. However, a series of previous studies demonstrated that the relationship between accelerometer outputs and METs, and thus EE, was completely different between preschool children, tweens, and adults [50,51,52]. We, therefore, need to be especially careful if we use accelerometers to acquire data in children. The TDEE values provided by accelerometers are outside the scope of the current purpose as well as the scope of the previous research [6].
The current study has several limitations. In addition to a small sample size, the participants were recruited from one kindergarten in an urban area. There is variation in the obesity or undernutrition status and physical activity levels between rural and urban areas, even in the same country [13]. To generalize these observations, multisite studies are needed. A small sample size may induce unstable results in multiple-variable analysis, and studies with large sample sizes are also needed to confirm the current results. However, we underscore the fact that even with our small sample size, the variables (i.e., FFM and step counts) that were selected as significant predictors for the TDEE of Japanese preschool children were the same as those used in the previous study with Japanese tweens. Another potential influence factor is the choice of accelerometer. The accelerometers were made according as the Japanese Industrial Standards for pedometers (JIS S7200-1993; president of the committee, Dr. Yoshiro Hatano). The accelerometers were tested with an acceleration of 2.4 and 4.9 m/s2 induced by the oscillation generator, with a maximum acceptable error of ±3%. However, determining the actual “step” count of preschool children from accelerometer output based on a given algorithm may be complicated. Previous studies have indicated that there is no single objective physical activity assessment instrument that is appropriate for all situations, populations, and research questions [53,54,55]. Further studies are needed to address this issue.

5. Conclusions

In conclusion, in our study, TDEE was measured using the DLW method in Japanese preschool children with standard body sizes. These data could be helpful when updating the current Japanese EER in the future. In addition, our study confirmed that the TDEE could be predicted by FFM and step counts in preschool children as well as tweens. The organ-specific metabolic rate or its change during growth and the proportion of activity energy expenditure against TDEE may result in differences in the regression equation between preschool children and tweens.

Author Contributions

Conceptualization, Y.Y., M.K., Y.A.; Methodology, Y.Y., H.S., Y.A.; Conducted the study, A.I., M.N., K.F.; Formal analysis, Y.Y.; Data curation, Y.Y., H.S., Y.A.; Writing—Original draft preparation, Y.Y., Y.A.; Writing—Review and editing, Y.Y., H.S., Y.A.; Project administration, Y.Y., Y.H., M.K., Y.A.; Funding acquisition, Y.A. All authors have read and agreed to the published version of the manuscript.

Funding

This research was funded by JSPS KAKENHI, grant number 15K01672 for YA, and supported by Fukuoka University Institute for Physical Activity (FUIPA).

Acknowledgments

We thank the participants and their parents, the staff at the kindergarten, and the support of research staff in our universities and institutes. This paper is dedicated to the memory of Taketoshi Morimoto, a physiologist, who had supervised our isotope dilution studies.

Conflicts of Interest

There is no conflicts of interest in this study.

References

  1. UNICEF/WHO/World Bank. Levels and Trends in Child Malnutrition: Key Findings of the 2019 Edition of the Joint Child Malnutrition Estimates; World Health Organization: Geneva, Switzerland, 2019. [Google Scholar]
  2. WHO. The Double Burden of Malnutrition; Policy brief; World Health Organization: Geneva, Switzerland, 2017. [Google Scholar]
  3. Hill, J.O.; Wyatt, H.R.; Peters, J.C. Energy Balance and Obesity. Circulation 2012, 126, 126–132. [Google Scholar] [CrossRef]
  4. Roberts, S.B.; Leibel, R.L. Excess energy intake and low energy expenditure as predictors of obesity. Int. J. Obes. Relat. Metab. Disord. 1998, 22, 385–386. [Google Scholar] [CrossRef] [PubMed] [Green Version]
  5. Urlacher, S.S.; Snodgrass, J.J.; Dugas, L.R.; Sugiyama, L.S.; Liebert, M.A.; Joyce, C.J.; Pontzer, H. Constraint and trade-offs regulate energy expenditure during childhood. Sci. Adv. 2019, 5, eaax1065. [Google Scholar] [CrossRef] [PubMed] [Green Version]
  6. Komura, K.; Nakae, S.; Hirakawa, K.; Ebine, N.; Suzuki, K.; Ozawa, H.; Yamada, Y.; Kimura, M.; Ishii, K. Total energy expenditure of 10- to 12-year-old Japanese children measured using the doubly labeled water method. Nutr. Metab. 2017, 14, 70. [Google Scholar] [CrossRef] [PubMed]
  7. Westerterp, K.R. Changes in physical activity over the lifespan: Impact on body composition and sarcopenic obesity. Obes. Rev. 2018, 19, 8–13. [Google Scholar] [CrossRef] [Green Version]
  8. UK Scientific Advisory Committee on Nutrition. Identifying PAL values, in Energy reference values for infants, children and adolescents. In Dietary Reference Values for Energy; The Stationery Office Limited: London, UK, 2011; pp. 47–56. [Google Scholar]
  9. Lupton, J.R.; Brooks, J.A.; Butte, N.F.; Caballero, B.; Flatt, J.P.; Fried, S.K. Dietary Reference Intakes for Energy, Carbohydrate, Fiber, Fat, Fatty Acids, Cholesterol, Protein, and Amino Acids; Food and Nutrition Board, Institute of Medicine Energy; National Academies Press: Washington, DC, USA, 2005; pp. 107–264. [Google Scholar]
  10. Ministry of Health Labour and Welfare Japan. Japanese Dietary Reference Intake; Dai-ichi Shuppan: Tokyo, Japan, 2020. [Google Scholar]
  11. Tanaka, C.; Hikihara, Y.; Inoue, S.; Tanaka, S. The Choice of Pedometer Impacts on Daily Step Counts in Primary School Children under Free-Living Conditions. Int. J. Environ. Res. Public Health 2019, 16, 4375. [Google Scholar] [CrossRef] [Green Version]
  12. Cole, T.J.; Bellizzi, M.C.; Flegal, K.M.; Dietz, W.H. Establishing a standard definition for child overweight and obesity worldwide: International survey. BMJ 2000, 320, 1240–1243. [Google Scholar] [CrossRef] [Green Version]
  13. Itoi, A.; Yamada, Y.; Watanabe, Y.; Kimura, M. Physical activity, energy intake, and obesity prevalence among urban and rural schoolchildren aged 11-12 years in Japan. Appl. Physiol. Nutr. Metab. Physiol. Appl. Nutr. Metab. 2012, 37, 1189–1199. [Google Scholar] [CrossRef]
  14. Cole, T.J.; Flegal, K.M.; Nicholls, D.; Jackson, A.A. Body mass index cut offs to define thinness in children and adolescents: International survey. BMJ 2007, 335, 194. [Google Scholar] [CrossRef] [Green Version]
  15. Yamada, Y.; Hashii-Arishima, Y.; Yokoyama, K.; Itoi, A.; Adachi, T.; Kimura, M. Validity of a triaxial accelerometer and simplified physical activity record in older adults aged 64-96 years: A doubly labeled water study. Eur. J. Appl. Physiol. 2018, 118, 2133–2146. [Google Scholar] [CrossRef]
  16. Yamada, Y.; Yokoyama, K.; Noriyasu, R.; Osaki, T.; Adachi, T.; Itoi, A.; Naito, Y.; Morimoto, T.; Kimura, M.; Oda, S. Light-intensity activities are important for estimating physical activity energy expenditure using uniaxial and triaxial accelerometers. Eur. J. Appl Physiol. 2009, 105, 141–152. [Google Scholar] [CrossRef] [PubMed]
  17. Racette, S.B.; Schoeller, D.A.; Luke, A.H.; Shay, K.; Hnilicka, J.; Kushner, R.F. Relative dilution spaces of 2H- and 18O-labeled water in humans. Am. J. Physiol. Endocrinol. Metab. 1994, 267, E585–E590. [Google Scholar] [CrossRef] [PubMed]
  18. Sagayama, H.; Yamada, Y.; Racine, N.M.; Shriver, T.C.; Schoeller, D.A. Dilution space ratio of 2H and 18O of doubly labeled water method in humans. J. Appl. Physiol. 2016, 120, 1349–1354. [Google Scholar] [CrossRef] [PubMed] [Green Version]
  19. Schoeller, D.A.; Ravussin, E.; Schutz, Y.; Acheson, K.J.; Baertschi, P.; Jequier, E. Energy expenditure by doubly labeled water: Validation in humans and proposed calculation. Am. J. Physiol. Regul. Integr. Comp. Physiol. 1986, 250, R823–R830. [Google Scholar] [CrossRef] [PubMed]
  20. Black, A.E.; Prentice, A.M.; Coward, W.A. Use of food quotients to predict respiratory quotients for the doubly-labelled water method of measuring energy expenditure. Hum. Nutr. Clin. Nutr. 1986, 40, 381–391. [Google Scholar] [PubMed]
  21. Weir, J.B. New methods for calculating metabolic rate with special reference to protein metabolism. J. Physiol. 1949, 109, 1–9. [Google Scholar] [CrossRef]
  22. International Atomic Energy Agency. IAEA Human Health Series No. 3. Assessment of Body Composition and Total Energy Expenditure in Humans Using Stable Isotope Techniques; Vienna International Centre: Vienna, Austria, 2009. [Google Scholar]
  23. International Atomic Energy Agency. IAEA Human Health Series No 13 Introduction to Body Composition Assessment Using the Deuterium Dilution Technique with Analysis of Urine Samples by Isotope Ratio Mass Spectrometry; Vienna International Centre: Vienna, Austria, 2011; pp. 9–11. [Google Scholar]
  24. Health Promotion and Nutrition Division-Health Service Bureau Ministry of Health and Welfare. Recommended Dietary Allowances for the Japanese; 4th revision; Dai-ichi Shuppan: Tokyo, Japan, 1995. [Google Scholar]
  25. Westerterp, K.R. Physical activity and physical activity induced energy expenditure in humans: Measurement, determinants, and effects. Front Physiol. 2013, 4, 90. [Google Scholar] [CrossRef] [Green Version]
  26. Westerterp, K.R. Exercise, energy expenditure and energy balance, as measured with doubly labelled water. Proc. Nutr. Soc. 2018, 77, 4–10. [Google Scholar] [CrossRef]
  27. Sentongo, T.A.; Tershakovec, A.M.; Mascarenhas, M.R.; Watson, M.H.; Stallings, V.A. Resting energy expenditure and prediction equations in young children with failure to thrive. J. Pediatrics 2000, 136, 345–350. [Google Scholar] [CrossRef]
  28. Schofield, W.N. Predicting basal metabolic rate, new standards and review of previous work. Hum. Nutr. Clin. Nutr. 1985, 39, 5–41. [Google Scholar]
  29. Gando, Y.; Yamamoto, K.; Murakami, H.; Ohmori, Y.; Kawakami, R.; Sanada, K.; Higuchi, M.; Tabata, I.; Miyachi, M. Longer time spent in light physical activity is associated with reduced arterial stiffness in older adults. Hypertension 2010, 56, 540–546. [Google Scholar] [CrossRef] [PubMed] [Green Version]
  30. Murakami, H.; Kawakami, R.; Nakae, S.; Yamada, Y.; Nakata, Y.; Ohkawara, K.; Sasai, H.; Ishikawa-Takata, K.; Tanaka, S.; Miyachi, M. Accuracy of 12 Wearable Devices for Estimating Physical Activity Energy Expenditure Using a Metabolic Chamber and the Doubly Labeled Water Method: Validation Study. JMIR mHealth uHealth 2019, 7, e13938. [Google Scholar] [CrossRef] [PubMed]
  31. Murakami, H.; Kawakami, R.; Nakae, S.; Nakata, Y.; Ishikawa-Takata, K.; Tanaka, S.; Miyachi, M. Accuracy of Wearable Devices for Estimating Total Energy Expenditure: Comparison With Metabolic Chamber and Doubly Labeled Water Method. JAMA Intern. Med. 2016, 176, 702–703. [Google Scholar] [CrossRef] [PubMed]
  32. Rowe, D.A.; Mahar, M.T.; Raedeke, T.D.; Lore, J. Measuring Physical Activity in Children with Pedometers: Reliability, Reactivity, and Replacement of Missing Data. Pediatric Exerc. Sci. 2004, 16, 343–354. [Google Scholar] [CrossRef] [Green Version]
  33. Troiano, R.P.; Berrigan, D.; Dodd, K.W.; Mâsse, L.C.; Tilert, T.; McDowell, M. Physical activity in the United States measured by accelerometer. Med. Sci. Sports Exerc. 2008, 40, 181–188. [Google Scholar] [CrossRef] [PubMed]
  34. Aadland, E.; Andersen, L.B.; Anderssen, S.A.; Resaland, G.K. A comparison of 10 accelerometer non-wear time criteria and logbooks in children. BMC Public Health 2018, 18, 323. [Google Scholar] [CrossRef]
  35. Nishimoto, Y.; Ida, S.; Etani, Y.; Ebine, N.; Nakae, S.; Miyatani, S. Determination of Total Energy Expenditure Using the Doubly labeled Water Method and Expired Gas Analysis in Short-stature Children. Nippon Eiyo Shokuryo Gakkaishi 2013, 66, 133–139. [Google Scholar] [CrossRef]
  36. Blanc, S.; Schoeller, D.A.; Bauer, D.; Danielson, M.E.; Tylavsky, F.; Simonsick, E.M.; Harris, T.B.; Kritchevsky, S.B.; Everhart, J.E. Energy requirements in the eighth decade of life. Am. J. Clin. Nutr. 2004, 79, 303–310. [Google Scholar] [CrossRef] [Green Version]
  37. Silva, A.M.; Wang, J.; Pierson, R.N., Jr.; Wang, Z.; Heymsfield, S.B.; Sardinha, L.B.; Heshka, S. Extracellular water: Greater expansion with age in African Americans. J. Appl. Physiol. 2005, 99, 261–267. [Google Scholar] [CrossRef] [Green Version]
  38. Gallagher, D.; Albu, J.; He, Q.; Heshka, S.; Boxt, L.; Krasnow, N.; Elia, M. Small organs with a high metabolic rate explain lower resting energy expenditure in African American than in white adults. Am. J. Clin. Nutr. 2006, 83, 1062–1067. [Google Scholar] [CrossRef] [Green Version]
  39. Wang, Z.; Ying, Z.; Bosy-Westphal, A.; Zhang, J.; Schautz, B.; Later, W.; Heymsfield, S.B.; Müller, M.J. Specific metabolic rates of major organs and tissues across adulthood: Evaluation by mechanistic model of resting energy expenditure. Am. J. Clin. Nutr. 2010, 92, 1369–1377. [Google Scholar] [CrossRef] [PubMed]
  40. Elia, M. Organ and tissue contribution to metabolic rate. In Energy Metabolism: Tissue Determinants and Cellular Corollaries; Kinney, J.M., Tucker, H.N., Eds.; Raven Press: New York, NY, USA, 1992. [Google Scholar]
  41. Hsu, A.; Heshka, S.; Janumala, I.; Song, M.-Y.; Horlick, M.; Krasnow, N.; Gallagher, D. Larger mass of high-metabolic-rate organs does not explain higher resting energy expenditure in children. Am. J. Clin. Nutr. 2003, 77, 1506–1511. [Google Scholar] [CrossRef] [PubMed] [Green Version]
  42. Kennedy, C.; Sokoloff, L. An adaptation of the nitrous oxide method to the study of the cerebral circulation in children; normal values for cerebral blood flow and cerebral metabolic rate in childhood. J. Clin. Investig. 1957, 36, 1130–1137. [Google Scholar] [CrossRef] [PubMed]
  43. Chugani, H.T.; Phelps, M.E.; Mazziotta, J.C. Positron emission tomography study of human brain functional development. Ann. Neurol. 1987, 22, 487–497. [Google Scholar] [CrossRef] [PubMed]
  44. Carson, V.; Spence, J.C.; Cutumisu, N.; Boule, N.; Edwards, J. Seasonal Variation in Physical Activity Among Preschool Children in a Northern Canadian City. Res. Q. Exerc. Sport 2010, 81, 392–399. [Google Scholar] [CrossRef] [PubMed]
  45. Kolle, E.; Steene-Johannessen, J.; Andersen, L.B.; Anderssen, S.A. Seasonal variation in objectively assessed physical activity among children and adolescents in Norway: A cross-sectional study. Int. J. Behav. Nutr. Phys. Act. 2009, 6, 36. [Google Scholar] [CrossRef] [Green Version]
  46. Cooper, A.R.; Page, A.S.; Wheeler, B.W.; Hillsdon, M.; Griew, P.; Jago, R. Patterns of GPS measured time outdoors after school and objective physical activity in English children: The PEACH project. Int. J. Behav. Nutr. Phys. Act. 2010, 7, 31. [Google Scholar] [CrossRef] [Green Version]
  47. Duncan, J.S.; Hopkins, W.G.; Schofield, G.; Duncan, E.K. Effects of Weather on Pedometer-Determined Physical Activity in Children. Med. Sci. Sports Exerc. 2008, 40, 1432–1438. [Google Scholar] [CrossRef]
  48. Hjorth, M.F.; Chaput, J.-P.; Michaelsen, K.; Astrup, A.; Tetens, I.; Sjödin, A. Seasonal variation in objectively measured physical activity, sedentary time, cardio-respiratory fitness and sleep duration among 8–11 year-old Danish children: A repeated-measures study. BMC Public Health 2013, 13, 808. [Google Scholar] [CrossRef] [Green Version]
  49. Matsumura, Y.; Yamamoto, M.; Kitado, T.; Nakamura, H.; Kidera, K.; Fujimoto, S. High-accuracy physical activity monitor utilizing three-axis accelerometer. Natl. Tech. Rep. 2008, 56, 60–66. [Google Scholar]
  50. Tanaka, C.; Hikihara, Y.; Ando, T.; Oshima, Y.; Usui, C.; Ohgi, Y.; Kaneda, K.; Tanaka, S. Prediction of Physical Activity Intensity with Accelerometry in Young Children. Int. J. Environ. Res. Public Health 2019, 16, 931. [Google Scholar] [CrossRef] [PubMed] [Green Version]
  51. Ohkawara, K.; Oshima, Y.; Hikihara, Y.; Ishikawa-Takata, K.; Tabata, I.; Tanaka, S. Real-time estimation of daily physical activity intensity by a triaxial accelerometer and a gravity-removal classification algorithm. BR J. Nutr. 2011, 105, 1681–1691. [Google Scholar] [CrossRef] [PubMed]
  52. Hikihara, Y.; Tanaka, C.; Oshima, Y.; Ohkawara, K.; Ishikawa-Takata, K.; Tanaka, S. Prediction models discriminating between nonlocomotive and locomotive activities in children using a triaxial accelerometer with a gravity-removal physical activity classification algorithm. PLoS ONE 2014, 9, e94940. [Google Scholar] [CrossRef] [PubMed] [Green Version]
  53. McClain, J.J.; Sisson, S.B.; Washington, T.L.; Craig, C.L.; Tudor-Locke, C. Comparison of Kenz Lifecorder EX and ActiGraph accelerometers in 10-yr-old children. Med. Sci. Sports Exerc. 2007, 39, 630–638. [Google Scholar] [CrossRef]
  54. Schneider, P.L.; Crouter, S.E.; Lukajic, O.; Bassett, D.R., Jr. Accuracy and reliability of 10 pedometers for measuring steps over a 400-m walk. Med. Sci. Sports Exerc. 2003, 35, 1779–1784. [Google Scholar] [CrossRef]
  55. McClain, J.J.; Tudor-Locke, C. Objective monitoring of physical activity in children: Considerations for instrument selection. J. Sci. Med. Sport 2009, 12, 526–533. [Google Scholar] [CrossRef]
Figure 1. Simple correlation between total daily energy expenditure (TDEE) and fat free mass (A), body weight (B), or daily step counts (C). Relationship between physical activity level (PAL) and daily step counts is also shown in panel (D).
Nutrients 12 01223 g001
Table 1. Physical characteristics, body composition, energy expenditure, and daily step counts of the participants (n = 21).
Mean±SD
Age (year)5.1±0.9
Height (cm)107.2±6.6
Weight (kg)17.5±1.7
BMI (kg/m2)15.3±1.3
n (%) of overweight or obesity by IOTF (Cole et al. 2000)0 (0%)
n (%) of thinness by Cole et al. (2007)3 (14%)
FFM (kg)13.0±1.5
FM (kg)4.5±0.9
%fat (%)25.5±4.3
TDEE (kcal/day)1300±174
TDEE (kcal/day) for normal BMI group (n = 18)1305±170
BMRJapanese (kcal/day)903±50.0
BMRSchofield (kcal/day)868±33.0
PAL1.44±0.15
Step count (step/day) by Actimarker14,742±4083
BMI, body mass index; FFM, fat-free mass; %fat, percent body fat; TDEE, total daily energy expenditure; BMRJapanese, predicted basal metabolic rate with the equation for the Japanese population; BMRSchofield, predicted basal metabolic rate with the Schofield equation; PAL, physical activity level based on BMRJapanese.
Table 2. Comparison between girls and boys using ANCOVA adjusted for age.
Girls (n = 11)Boys (n =12)p-Value
Mean±SEMMean±SEM
Height (cm)108.2±1.1106.1±1.10.26
Weight (kg)18.0±0.516.9±0.50.19
BMI (kg/m2)15.4±0.315.1±0.30.49
FFM (kg)12.9±0.413.1±0.40.75
FM (kg)5.1±0.23.8±0.20.002 **
%fat (%)28.2±1.022.6±1.00.002 **
TDEE (kcal/d)1282±571320±600.68
BMRJapanese (kcal/d)899±17.8907±18.80.81
BMRSchofield (kcal/d)852±10.5885±11.10.07
PAL1.42±0.051.45±0.050.70
Step count (step/d) by Actimarker12,326±121517,400±12870.018 *
Step count (step/d) by Lifecorder9790±89813,479±9520.020 *
Mean and standard error of the mean (SEM) were estimated as the marginal mean with a covariate appearing in the model at the following value: age = 5.1; BMI, body mass index; FFM, fat-free mass; %fat, percent body fat; TDEE, total daily energy expenditure; BMRJapanese, predicted basal metabolic rate with the equation for the Japanese population; BMRSchofield, predicted basal metabolic rate with the Schofield equation; PAL, physical activity level based on BMRJapanese. p-values in bold show significant differences between girls and boys in ANCOVA. * p < 0.05, ** p < 0.01.
Table 3. Partial correlation coefficients between TDEE (kcal/day) and other variables.
VariablesAgeHeightWeightFFMFM%fatStep Counts
Control Variables
Sex0.3650.650 **0.767 ***0.816 ***−0.007−0.3940.626 **
Sex, Age0.648 ***0.756 ***0.804 ***0.311−0.1900.585 **
Sex, Age, Height0.529 *0.626 **0.101−0.1450.665 **
Sex, Age, Height, Weight0.405−0.405−0.4030.567 *
Sex, Age, Height, FFM0.0990.0970.500 *
Sex, Age, Height, FFM, FM−0.0070.498 *
Sex, Age, Height, FFM, %fat0.498 *
TDEE, total daily energy expenditure; FFM, fat-free mass; FM, fat mass; %fat, percent body fat. Step counts obtained by Actimarker. * p < 0.05, ** p < 0.01, *** p < 0.001.
Table 4. Multiple linear regression analysis for predicting TDEE (kcal/day) in 4–6-year-old children.
Predictor VariablesBβp-Value95%CI for B
FFM (kg)85.00.723<0.001(53.6, 11.3)
Step counts (n/day)0.01350.2960.032(0.0013, 0.0256)
(Constant)−4.7 0.98(−401, 392)
Dependent variable was TDEE, total daily energy expenditure (kcal/day). FFM, fat-free mass; B, unstandardized regression coefficient; β, standardized regression coefficient; CI, confidence interval. Stepwise regression analysis was applied: sex, age, height, weight, fat mass, and percent body fat were not included in the model based on the criteria of 0.05 entry and 0.10 removal for the probability of F. R2 = 0.735 and adjusted R2 = 0.706.

