Effect of Two Meal Replacement strategies on Cardiovascular Risk Parameters in Advanced Age Patients with Obesity and Osteoarthritis

 , , and
Abstract
1. Background
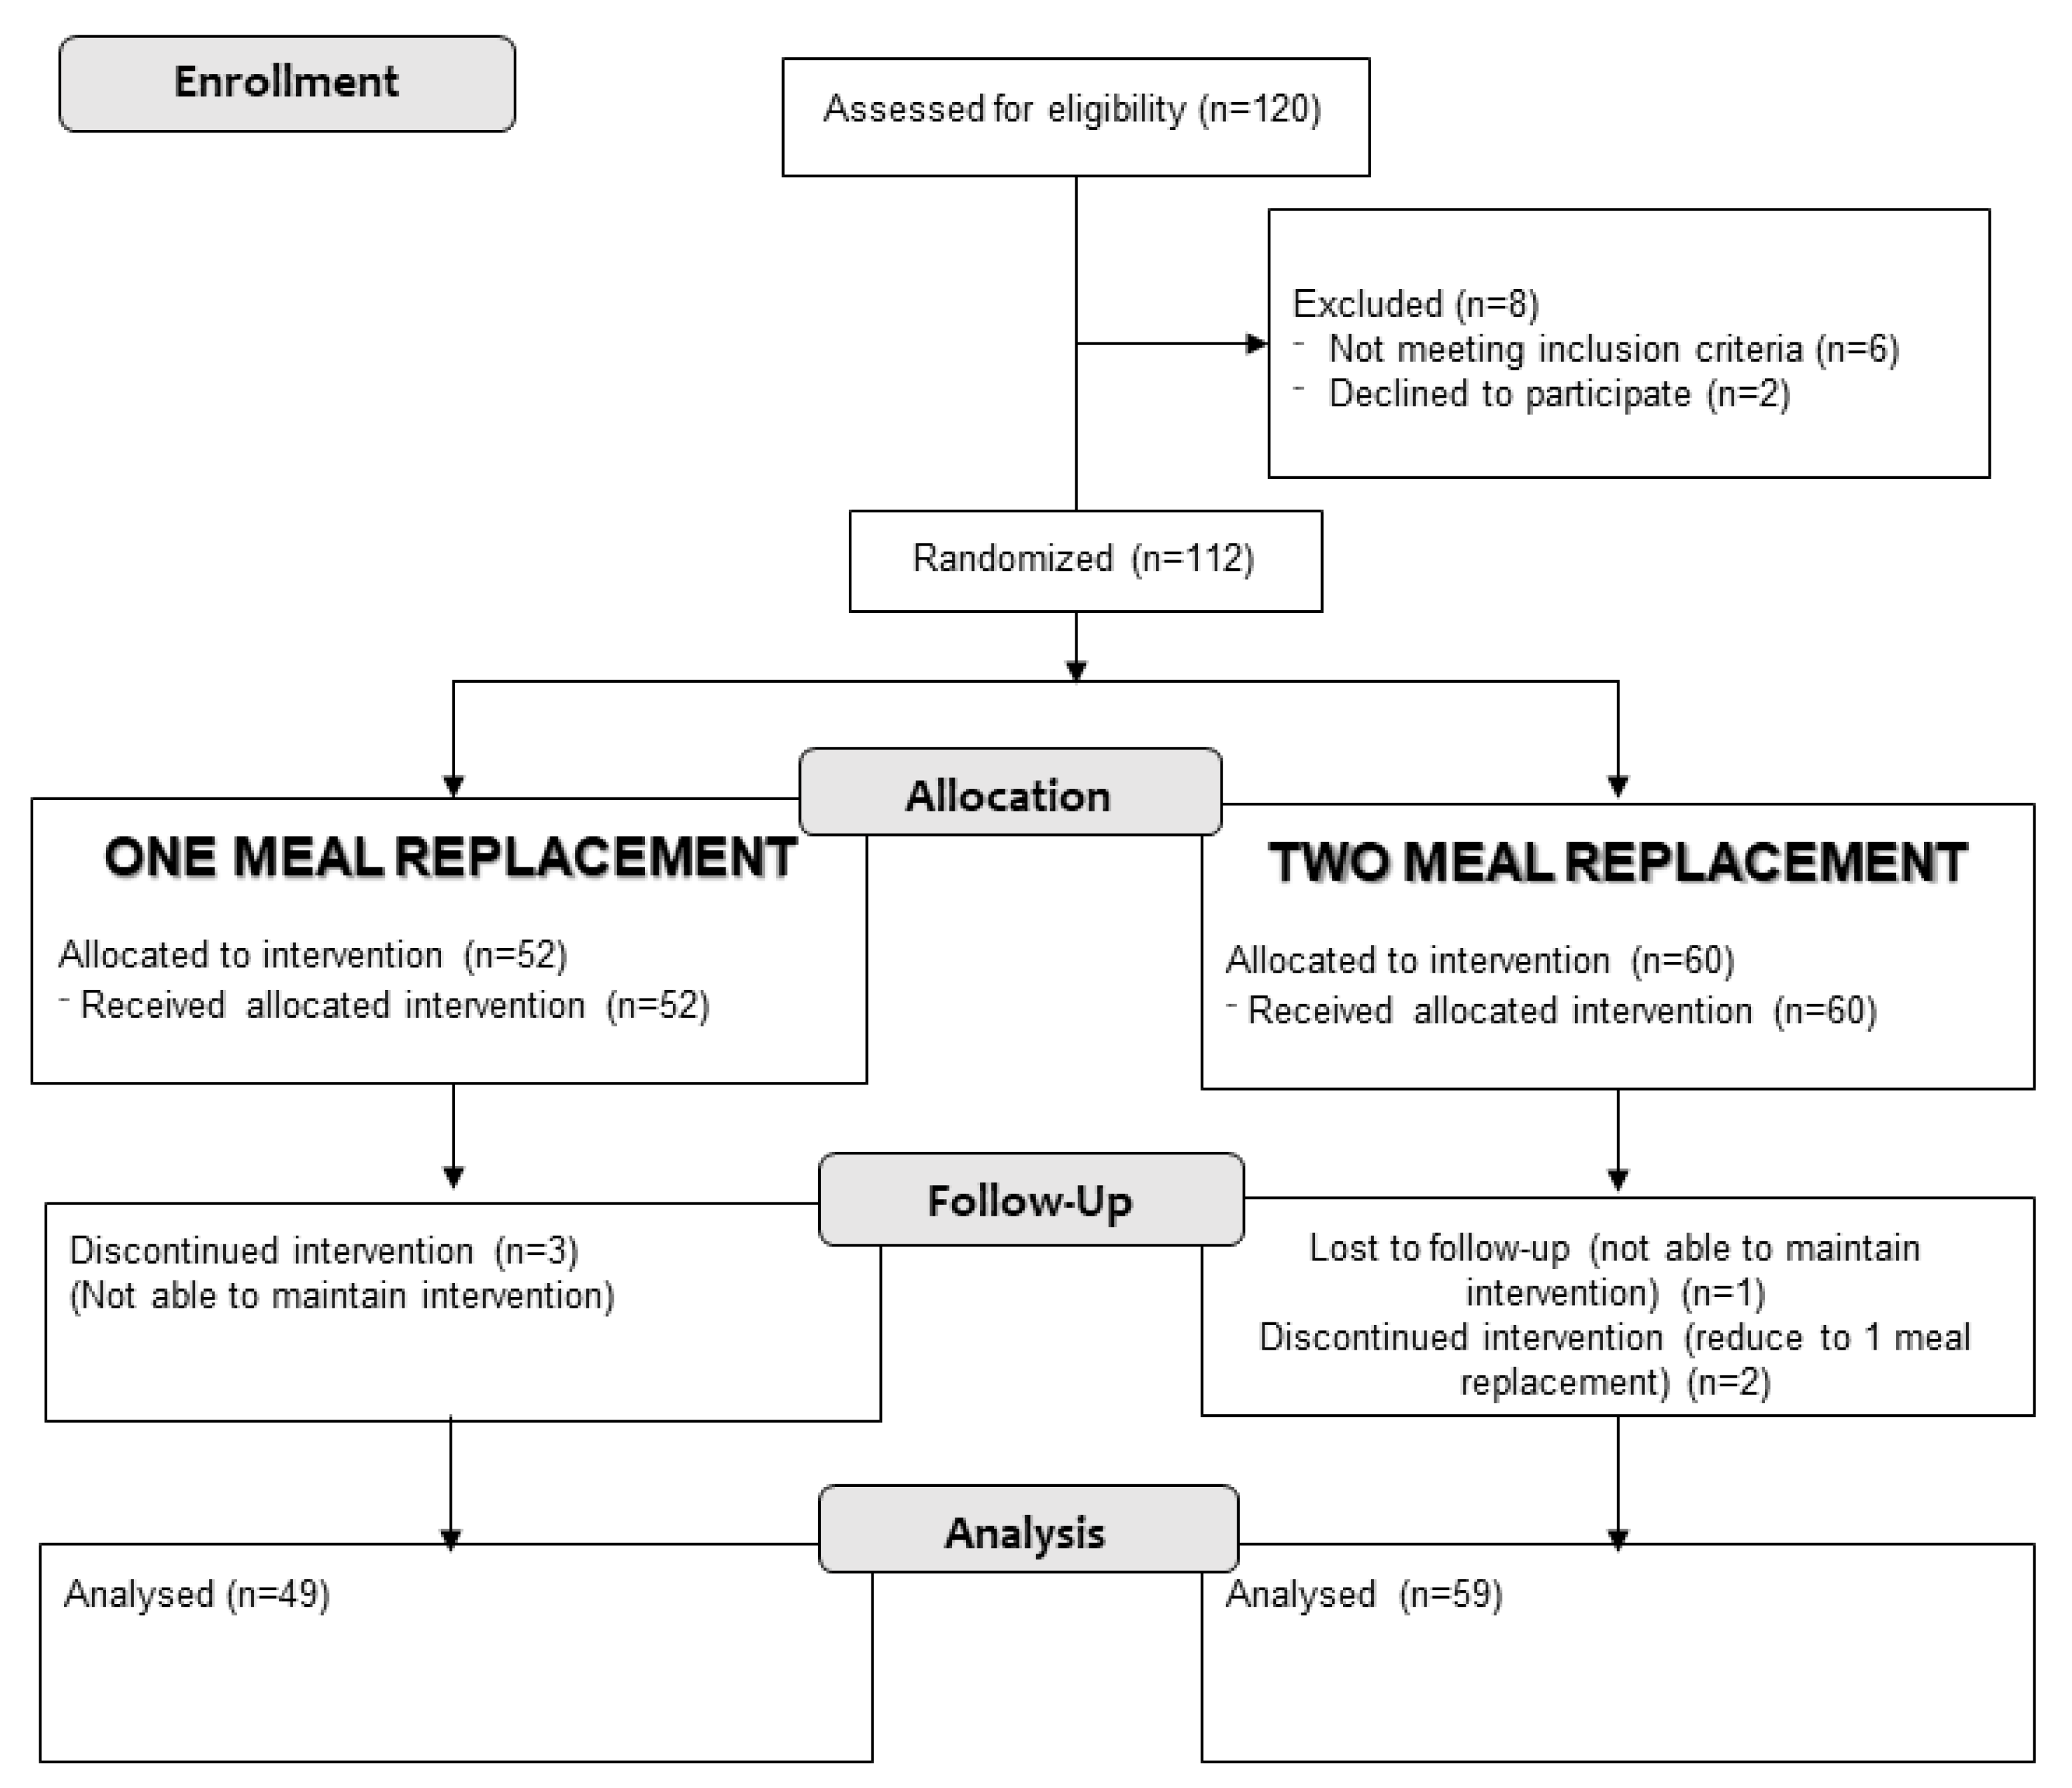
2. Methods
2.1. Scope
2.2. Intervention
- A fasting baseline analysis, a baseline anthropometric assessment, was performed, and a measurement of body composition was performed using a bioelectrical impedance measurement.
- Patients received nutritional education and were randomized into two groups: a hyperproteic low-fat hypocaloric diet with a meal replacement with a hyperproteic normocaloric artificial nutritional supplement (Vegestart ®); a hypocaloric hyperproteic low-fat diet with a replacement of two meals with a hyperproteic normocaloric artificial nutritional supplement (Vegestart ®). A different diet was assigned to men and women. The diet in both groups was structured into 5 meals (breakfast, mid-morning, lunch, snack, and dinner). The lunch and/or dinner were replaced by an artificial nutritional supplement called Vegestart ® (200 mL bottle: 200 kcal caloric content; protein: 15.4 g (31% total caloric value (VCT)); lipids: 5.2 g (23% VCT); carbohydrates: 21 g (42% VCT)). The characteristics of the macronutrient composition of both diets are shown in Table 1. The composition of all the oral nutritional supplements used in meal replacement diets are regulated by the European Commission Directive 98/6/CD, which is included in the Spanish legal system by the “Real Decreto 1430/1997”.
- The patients were reevaluated three months after the start of the intervention with anthropometry, a measurement of body composition, and a fasting baseline analysis.
2.3. Variables
2.3.1. Demographic Variables
2.3.2. Clinic Variables
2.3.3. Anthropometry
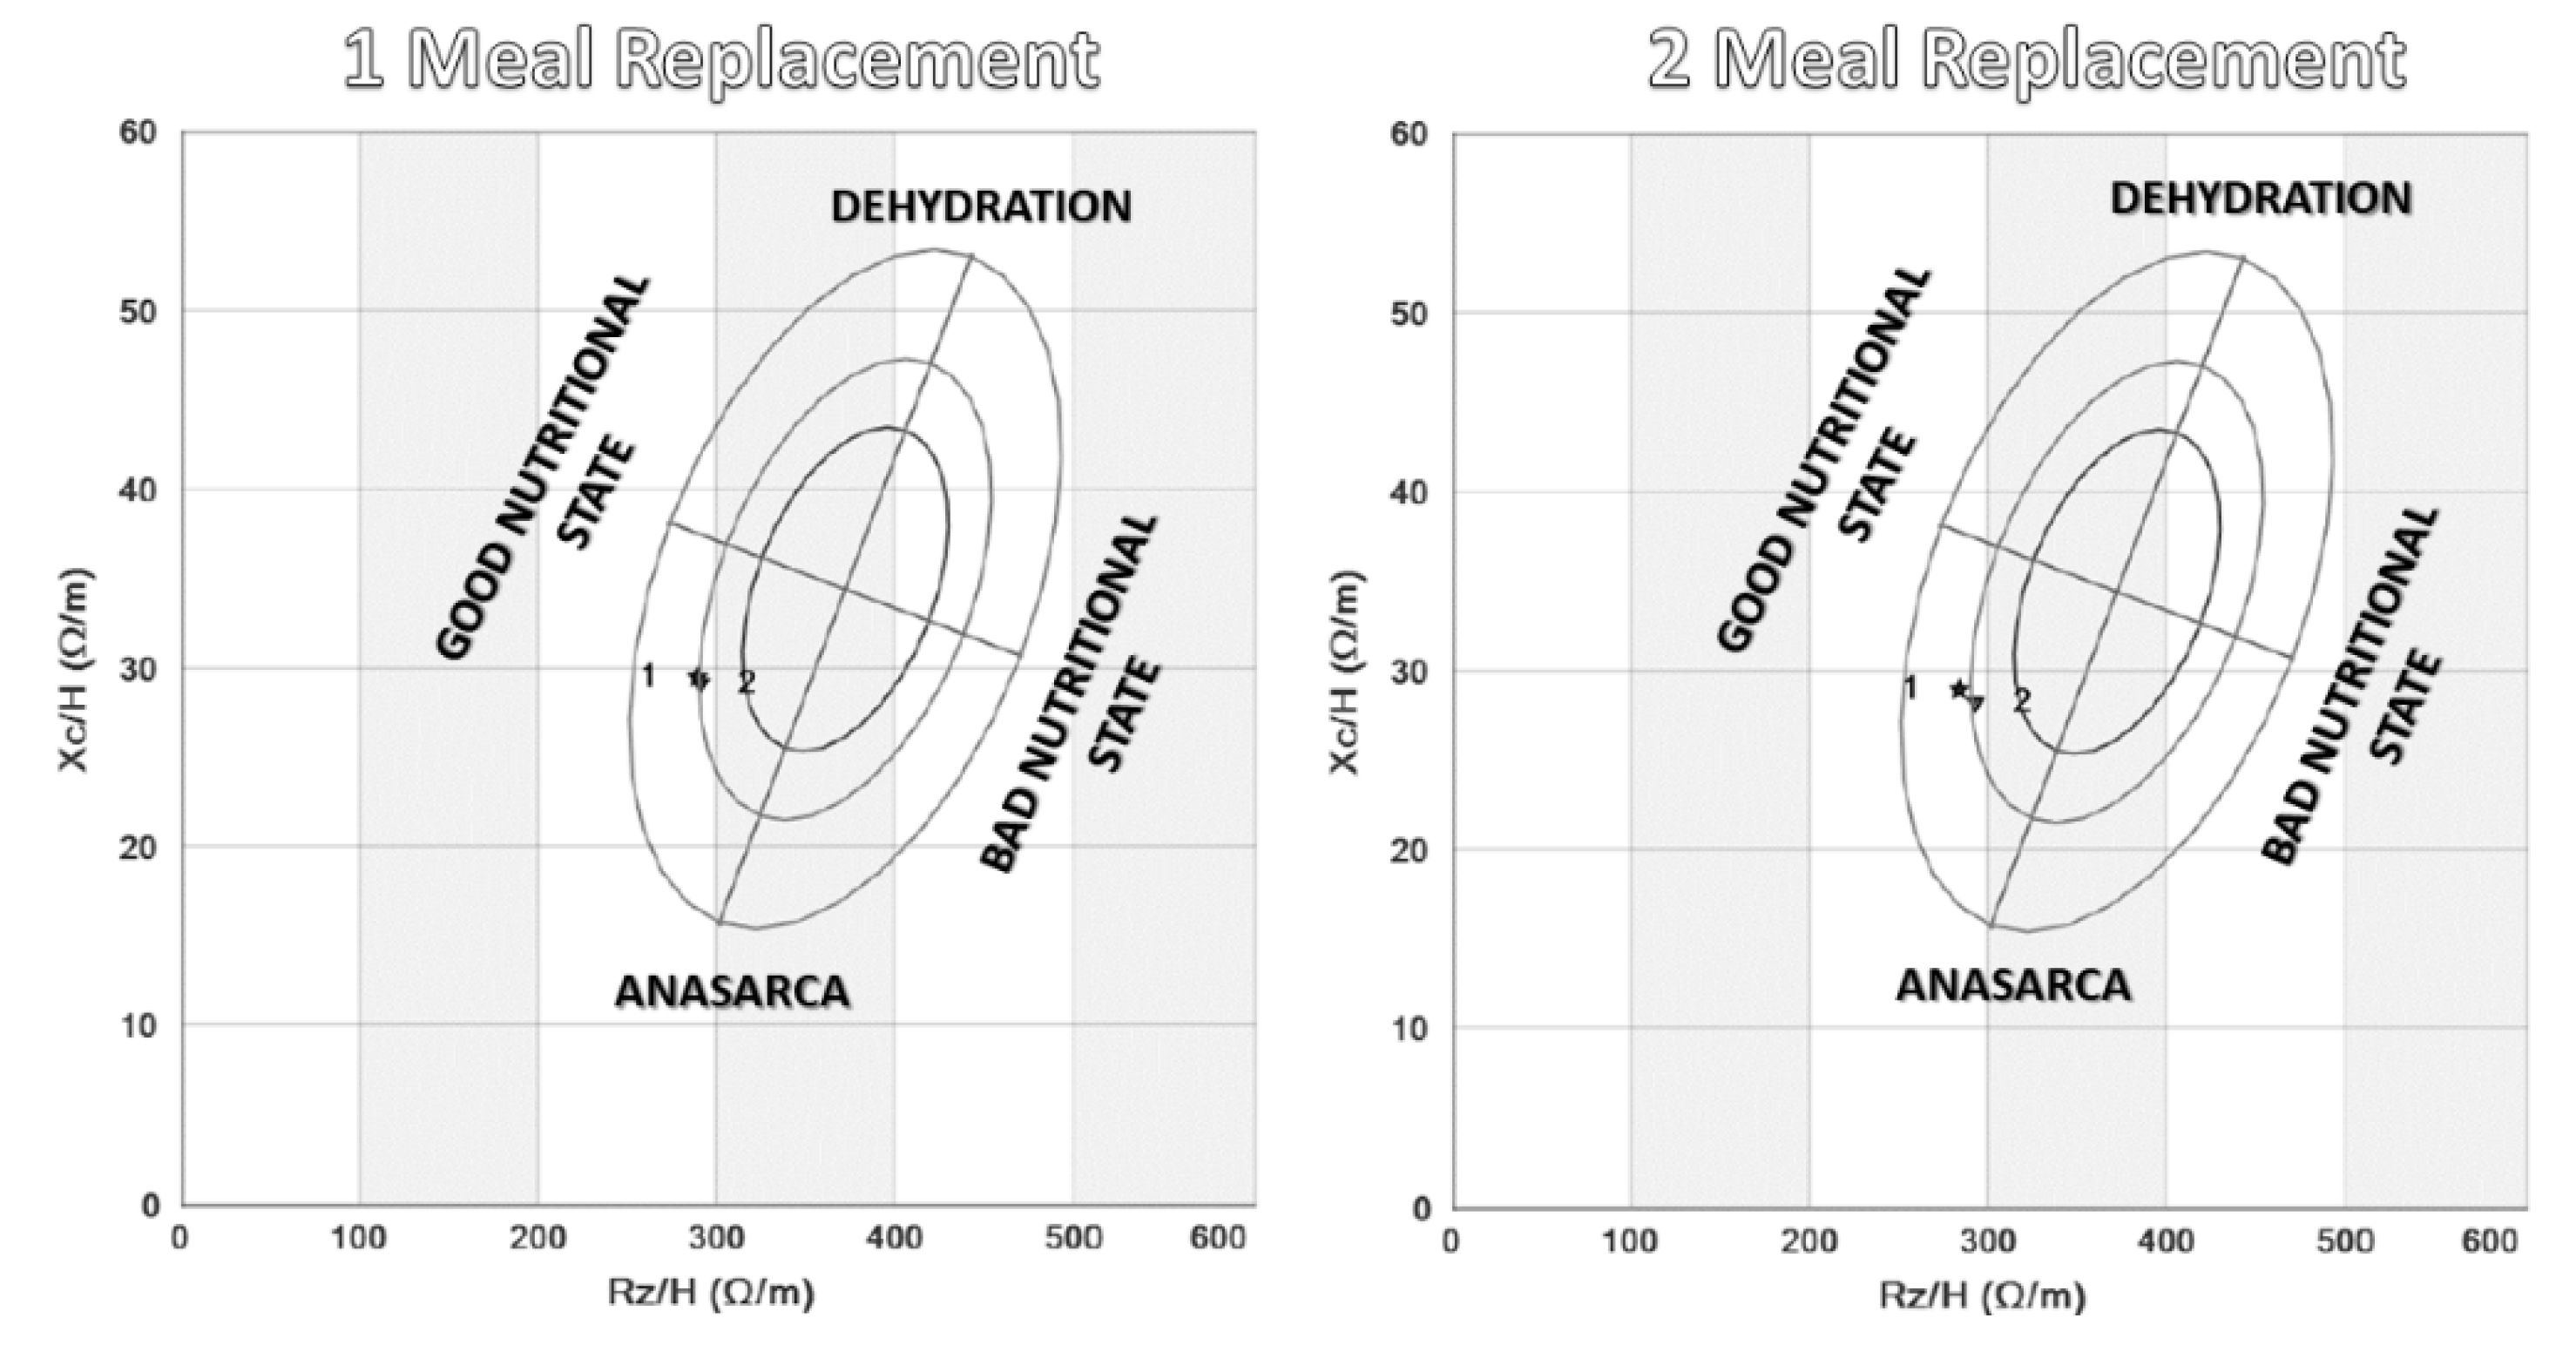
2.3.4. Body Composition
2.3.5. Biochemistry
Lipid Profile
Glucose Metabolism
2.4. Statistical Analysis
3. Results
3.1. Anthropometry
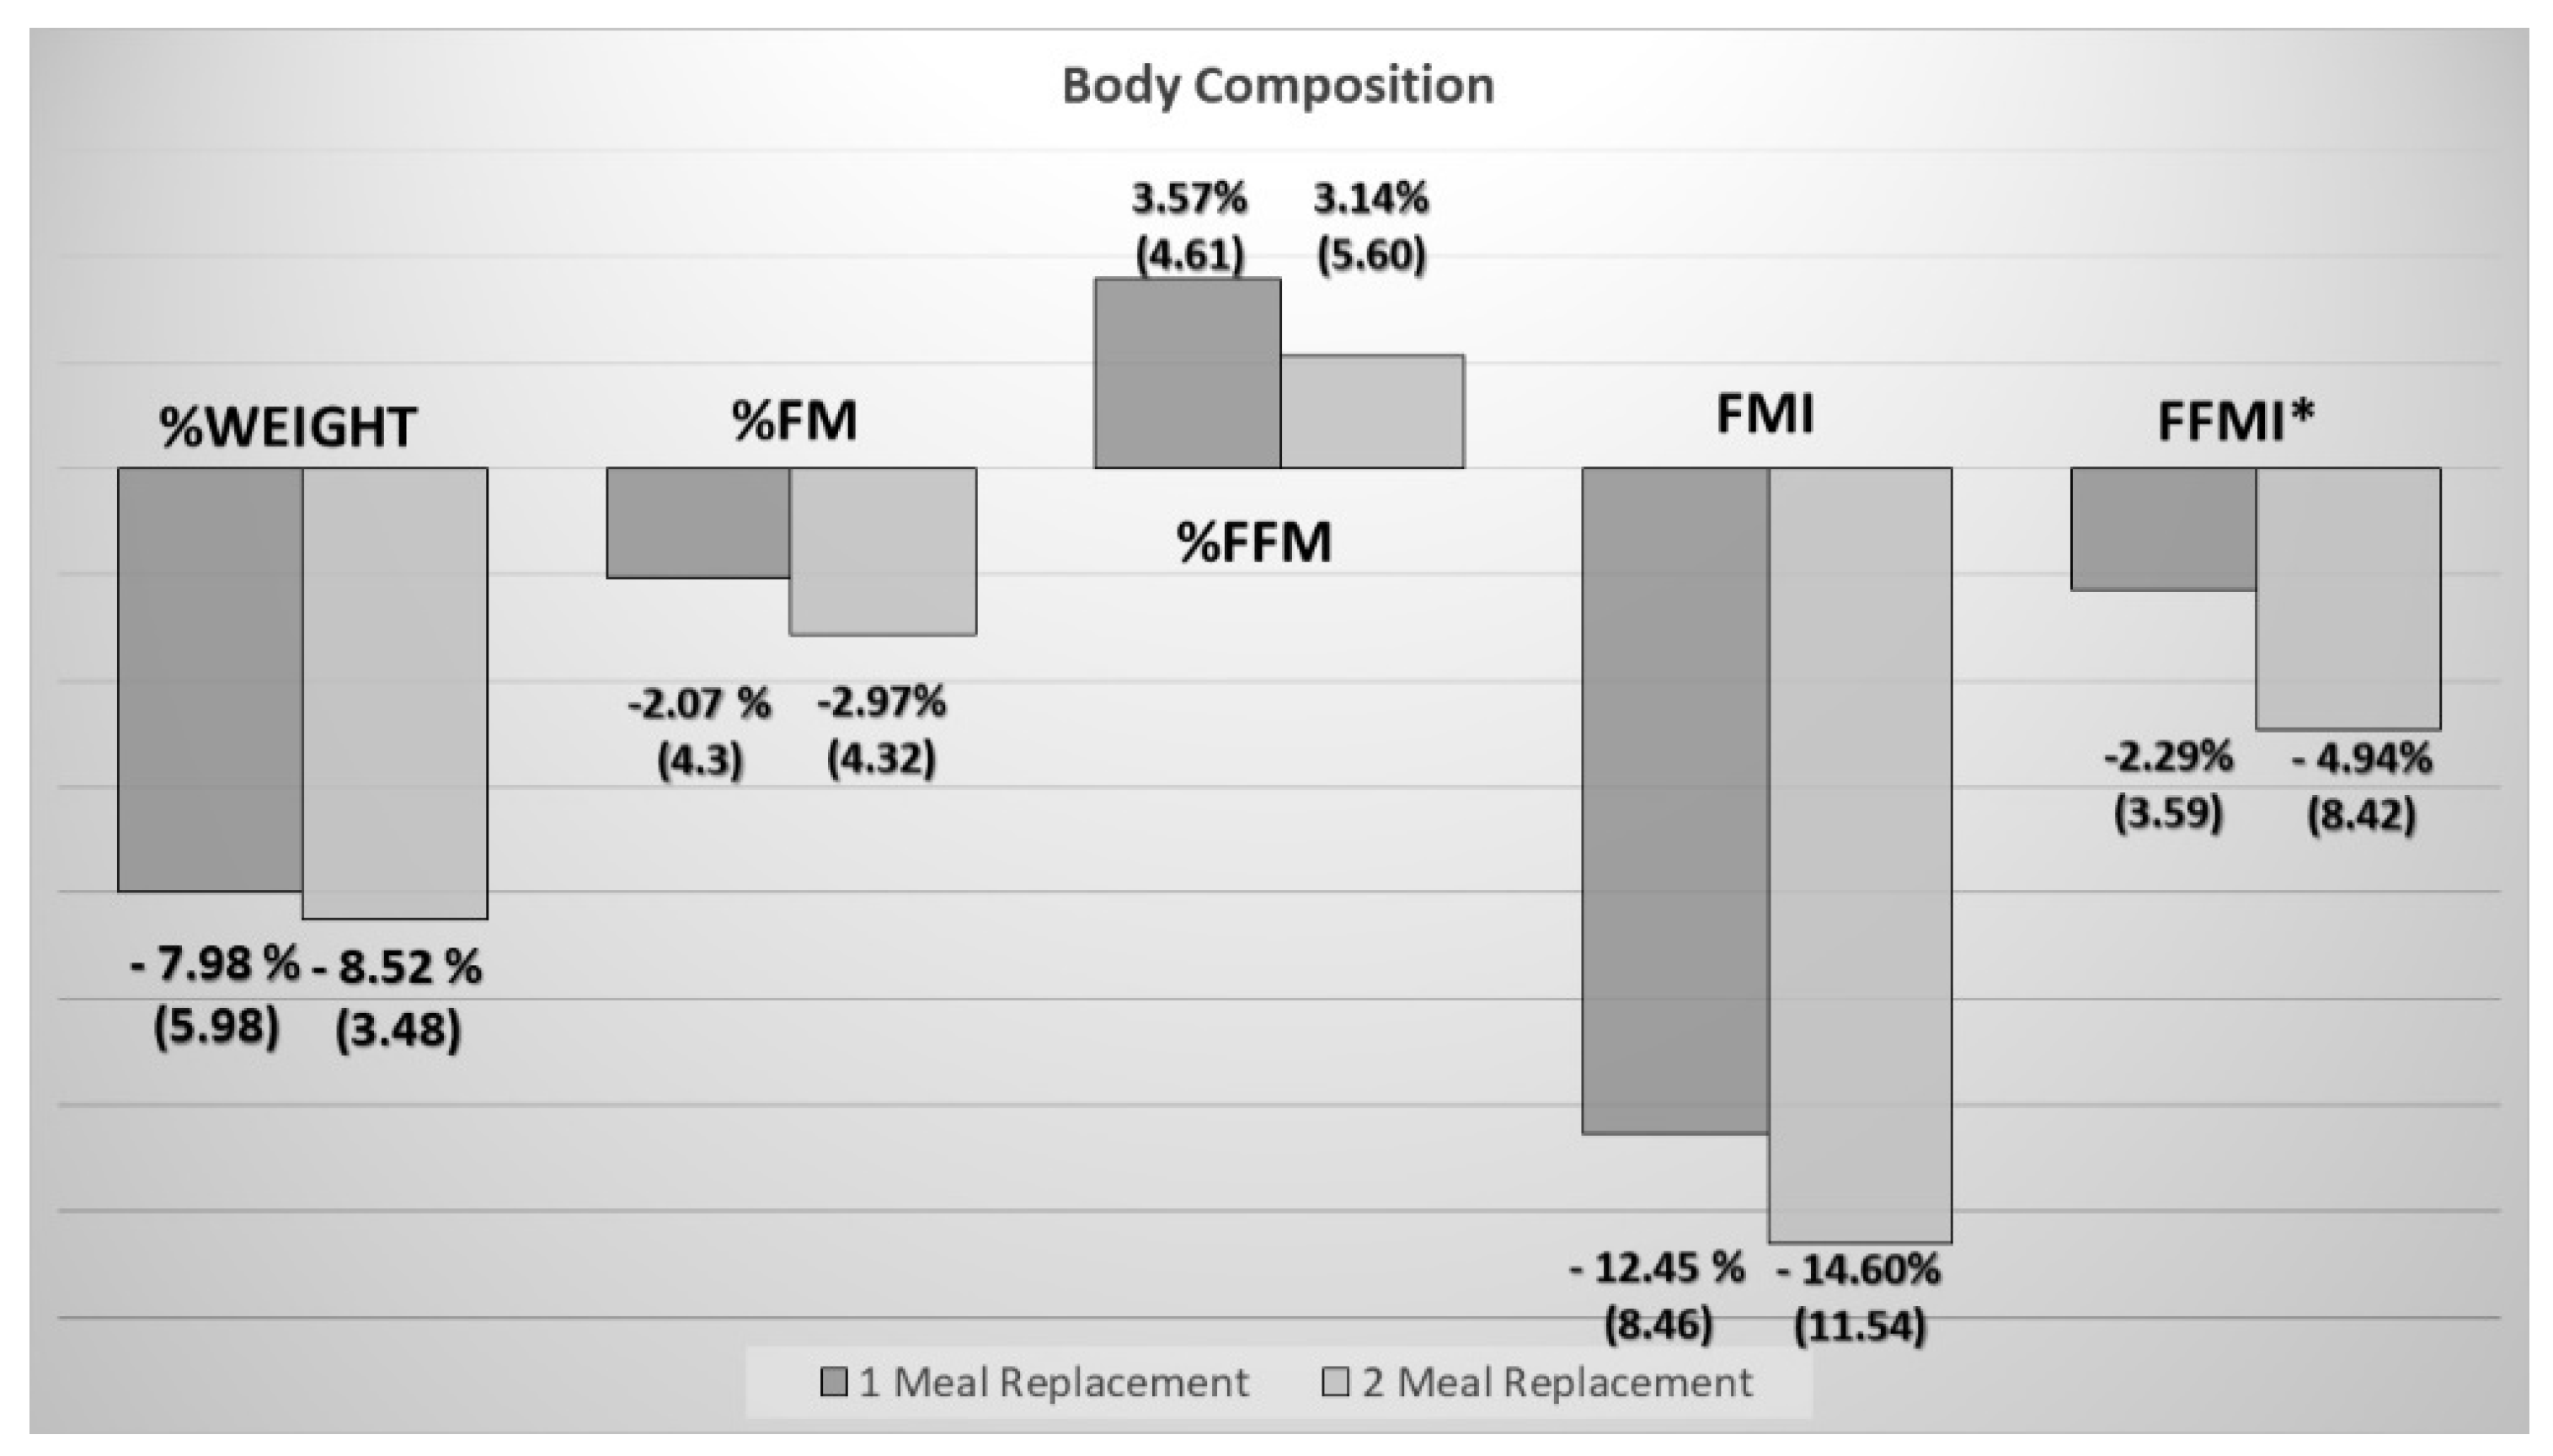
3.2. Body Composition
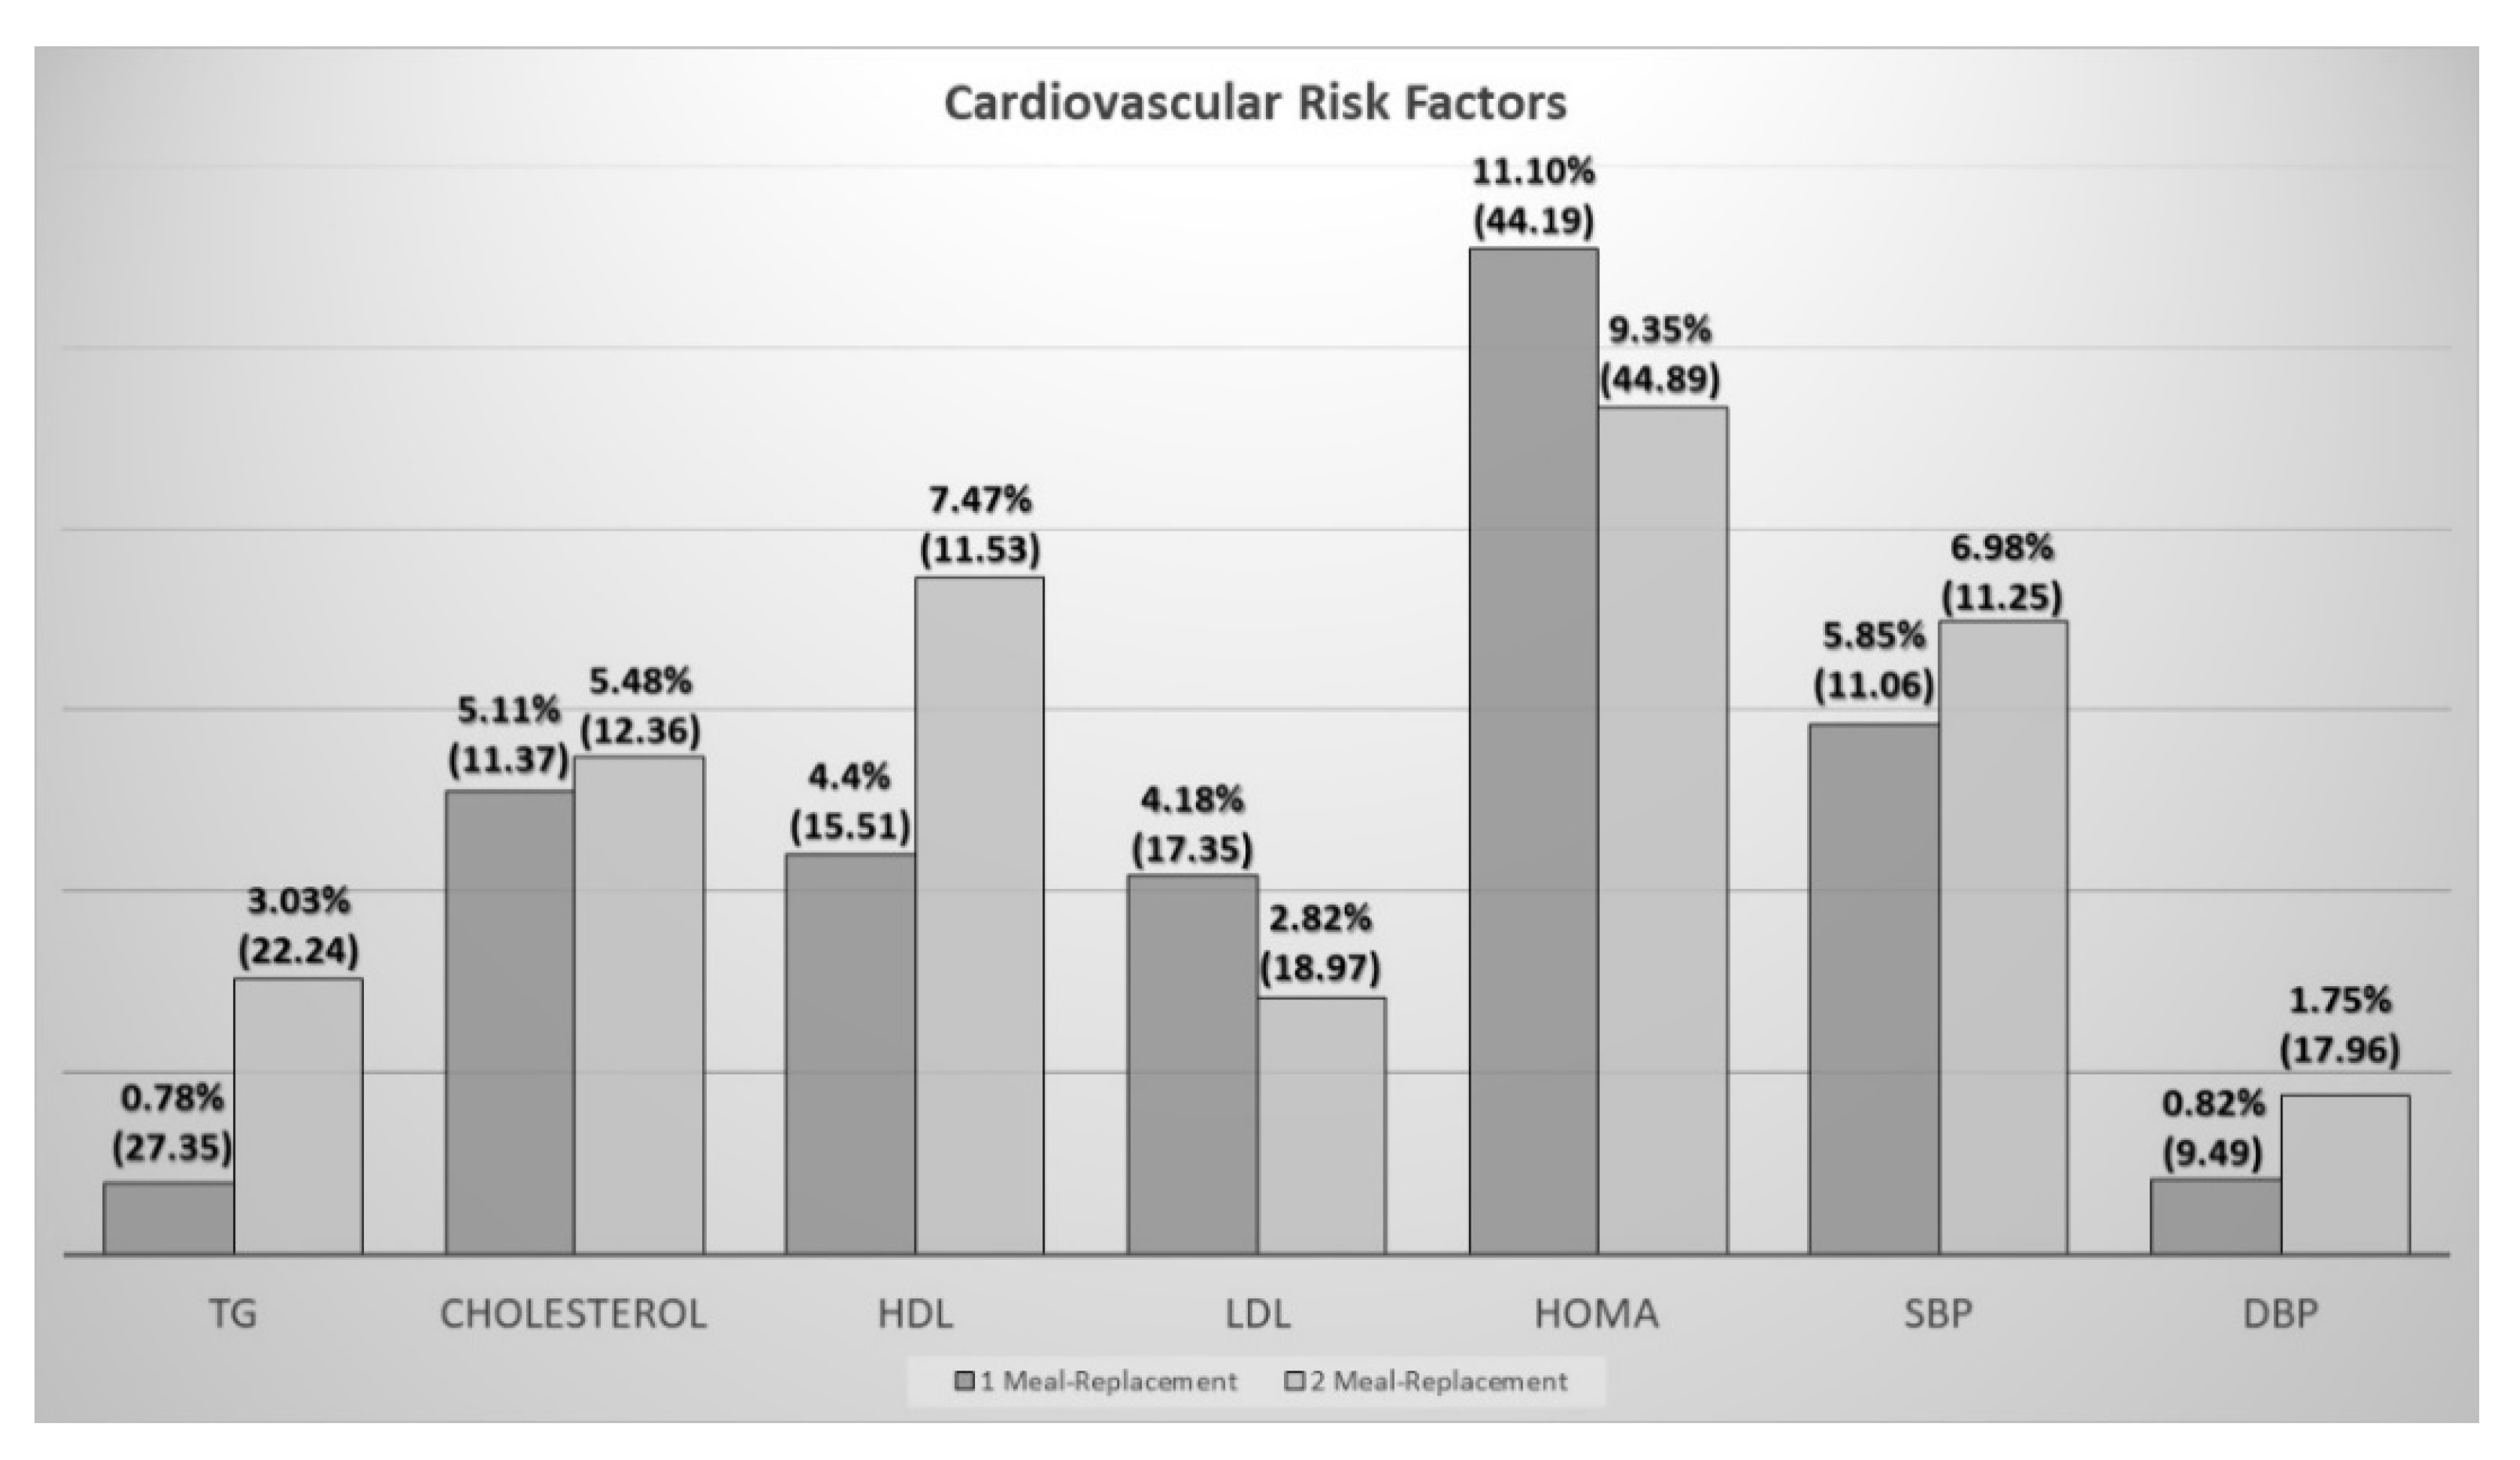
3.3. Cardiovascular Risk Factors:
4. Discussion
5. Conclusions
Author Contributions
Funding
Conflicts of Interest
References
- World Health Organization. Obesity: Preventing and Managing the Global Epidemic: Report of a WHO Consultation. In WHO Technical Report Series; World Health Organization: Geneva, Switzerland, 2000; p. 253. [Google Scholar]
- Jensen, G.L.; Hsiao, P.Y. Obesity in older adults: Relationship to functional limitation. Curr. Opin. Clin. Nutr. Metab. Care 2010, 13, 46–51. [Google Scholar] [CrossRef]
- Batsis, J.A.; Villareal, D.T. Sarcopenic obesity in older adults: Aetiology, epidemiology and treatment strategies. Nat. Rev. Endocrinol. 2018, 14, 513–537. [Google Scholar] [CrossRef]
- Alberti, K.G.M.M.; Eckel, R.H.; Grundy, S.M.; Zimmet, P.Z.; Cleeman, J.I.; Donato, K.A.; Fruchart, J.-C.; James, W.P.T.; Loria, C.M.; Smith, S.C., Jr. Harmonizing the metabolic syndrome: A joint interim statement of the International Diabetes Federation Task Force on Epidemiology and Prevention; National Heart, Lung, and Blood Institute; American Heart Association; World Heart Federation; International Atherosclerosis Society; and International Association for the Study of Obesity. Circulation 2009, 120, 1640–1645. [Google Scholar]
- Douketis, J.D.; Macie, C.; Thabane, L.; Williamson, D.F. Systematic review of long-term weight loss studies in obese adults: Clinical significance and applicability to clinical practice. Int. J. Obes. 2005, 29, 1153–1167. [Google Scholar] [CrossRef]
- Decaria, J.E.; Sharp, C.; Petrella, R.J. Scoping review report: Obesity in older adults. Int. J. Obes. 2012, 36, 1141–1150. [Google Scholar] [CrossRef]
- Heymsfield, S.; Van Mierlo, C.A.J.; Van der Knaap, H.C.M.; Heo, M.; Frier, H.I. Weight management using a meal replacement strategy: Meta and pooling analysis from six studies. Int. J. Obes. Relat. Metab. Disord J. Int. Assoc. Study Obes. 2003, 27, 537–549. [Google Scholar] [CrossRef]
- Anderson, J.W.; Luan, J.; Høie, L.H. Structured weight-loss programs: Meta-analysis of weight loss at 24 weeks and assessment of effects of intervention intensity. Adv. Ther. 2004, 21, 61–75. [Google Scholar] [CrossRef]
- Gargallo, M.F.; Marset, J.B.; Lesmes, I.B.; Izquierdo, J.Q.; Sala, X.F.; Salas-Salvadó, J. FESNAD-SEEDO consensus summary: Evidence-based nutritional recommendations for the prevention and treatment of overweight and obesity in adults. Endocrinol. Nutr. Organo Soc. Espanola Endocrinol. Nutr. 2012, 59, 429–437. [Google Scholar]
- Treyzon, L.; Chen, S.; Hong, K.; Yan, E.; Carpenter, C.L.; Thames, G.; Bowerman, S.; Wang, H.-J.; Elashoff, R.; Li, Z. A controlled trial of protein enrichment of meal replacements for weight reduction with retention of lean body mass. Nutr. J. 2008, 7, 23. [Google Scholar] [CrossRef]
- Witham, M.D.; Avenell, A. Interventions to achieve long-term weight loss in obese older people: A systematic review and meta-analysis. Age Ageing 2010, 39, 176–184. [Google Scholar] [CrossRef]
- Henriksen, M.; Christensen, R.; Danneskiold-Samsøe, B.; Bliddal, H. Changes in lower extremity muscle mass and muscle strength after weight loss in obese patients with knee osteoarthritis: A prospective cohort study. Arthritis Rheum. 2012, 64, 438–442. [Google Scholar] [CrossRef]
- Gómez, J.J.L.; Jáuregui, O.I.; Torres, B.T.; Hoyos, E.G.; Lozano, M.Á.C.; Buigues, A.O.; Martín Ferrero, M.A.; de Luis Román, D.A. Influence of a meal replacement diet on quality of life in women with obesity and knee osteoarthritis before orthopedic surgery. Nutr. Hosp. 2018, 35, 71–77. [Google Scholar]
- López-Gómez, J.J.; Izaola-Jauregui, O.; Primo-Martín, D.; Torres-Torres, B.; Gómez-Hoyos, E.; Ortolá-Buigues, A.; Martín-Ferrero, M.A.; Pérez-Castrillón, J.L.; De Luis-Román, D.A. Effect of weight loss on bone metabolism in postmenopausal obese women with osteoarthritis. Obes. Res. Clin. Pract. 2019, 13, 378–384. [Google Scholar] [CrossRef]
- Kyle, U.G.; Bosaeus, I.; De Lorenzo, A.D.; Deurenberg, P.; Elia, M.; Gómez, J.M.; Heitmann, B.L.; Kent-Smith, L.; Pirlich, M.; Scharfetter, H.; et al. Bioelectrical impedance analysis--part I: Review of principles and methods. Clin. Nutr. Edinb. Scotl. 2004, 23, 1226–1243. [Google Scholar] [CrossRef]
- Matthews, D.R.; Hosker, J.P.; Rudenski, A.S.; Naylor, B.A.; Treacher, D.F.; Turner, R.C. Homeostasis model assessment: Insulin resistance and beta-cell function from fasting plasma glucose and insulin concentrations in man. Diabetologia 1985, 28, 412–419. [Google Scholar] [CrossRef]
- Visser, A.W.; de Mutsert, R.; Loef, M.; Le Cessie, S.; den Heijer, M.; Bloem, J.L.; Reijnierse, M.; Rosendaal, F.R.; Kloppenburg, M.; NEO Study Group. The role of fat mass and skeletal muscle mass in knee osteoarthritis is different for men and women: The NEO study. Osteoarthr. Cartil. 2014, 22, 197–202. [Google Scholar] [CrossRef]
- Ertürk, C.; Altay, M.A.; Sert, C.; Levent, A.; Yaptı, M.; Yüce, K. The body composition of patients with knee osteoarthritis: Relationship with clinical parameters and radiographic severity. Aging Clin. Exp. Res. 2015, 27, 673–679. [Google Scholar] [CrossRef]
- Astbury, N.M.; Piernas, C.; Hartmann-Boyce, J.; Lapworth, S.; Aveyard, P.; Jebb, S.A. A systematic review and meta-analysis of the effectiveness of meal replacements for weight loss. Obes. Rev. Off. J. Int. Assoc. Study Obes. 2019, 20, 569–587. [Google Scholar] [CrossRef]
- De Luis, D.A.; Izaola, O.; García, A.M.; González, S.M.; Conde, R.; Aller, R.; Cabezas, G.; Rojo, S. Randomized clinical trial between nutritional counselling and commercial hypocaloric diet in weight loss in obese patients with chronic arthropathy. Med. Clin. 2009, 132, 735–739. [Google Scholar] [CrossRef]
- Basulto, J.; Bultó, L.; Chamorro, M.; Lafuente, C.; Martín, E.; Porta, G. Analysis of a weight loss program with meal replacement products on weight and biochemical markers in overweight or type I obese patients. Nutr. Hosp. 2008, 23, 388–394. [Google Scholar]
- Davis, L.M.; Coleman, C.; Kiel, J.; Rampolla, J.; Hutchisen, T.; Ford, L.; Andersen, W.S.; Hanlon-Mitola, A. Efficacy of a meal replacement diet plan compared to a food-based diet plan after a period of weight loss and weight maintenance: A randomized controlled trial. Nutr. J. 2010, 9, 11. [Google Scholar] [CrossRef]
- König, D.; Deibert, P.; Frey, I.; Landmann, U.; Berg, A. Effect of meal replacement on metabolic risk factors in overweight and obese subjects. Ann. Nutr. Metab. 2008, 52, 74–78. [Google Scholar] [CrossRef]
- Ashley, J.M.; Herzog, H.; Clodfelter, S.; Bovee, V.; Schrage, J.; Pritsos, C. Nutrient adequacy during weight loss interventions: A randomized study in women comparing the dietary intake in a meal replacement group with a traditional food group. Nutr. J. 2007, 6, 12. [Google Scholar] [CrossRef]
- Lee, K.; Lee, J.; Bae, W.K.; Choi, J.K.; Kim, H.J.; Cho, B. Efficacy of low-calorie, partial meal replacement diet plans on weight and abdominal fat in obese subjects with metabolic syndrome: A double-blind, randomised controlled trial of two diet plans—One high in protein and one nutritionally balanced. Int. J. Clin. Pract. 2009, 63, 195–201. [Google Scholar] [CrossRef]
- Smith, T.J.; Sigrist, L.D.; Bathalon, G.P.; McGraw, S.; Karl, J.P.; Young, A.J. Efficacy of a meal replacement program for promoting blood lipid changes and weight and body fat loss in US Army soldiers. J. Am. Diet. Assoc. 2010, 110, 268–273. [Google Scholar] [CrossRef]
- Magrans-Courtney, T.; Wilborn, C.; Rasmussen, C.; Ferreira, M.; Greenwood, L.; Campbell, B.; Kerksick, C.M.; Nassar, E.; Li, R.; Cooke, M.; et al. Effects of diet type and supplementation of glucosamine, chondroitin, and MSM on body composition, functional status, and markers of health in women with knee osteoarthritis initiating a resistance-based exercise and weight loss program. J. Int. Soc. Sports Nutr. 2011, 8, 8. [Google Scholar] [CrossRef]
- Guo, X.; Xu, Y.; He, H.; Cai, H.; Zhang, J.; Li, Y.; Yan, X.; Zhang, M.; Zhang, N.; Nicodemus-Johnson, J.; et al. Effects of a Meal Replacement on Body Composition and Metabolic Parameters among Subjects with Overweight or Obesity. J. Obes. 2018, 2018, 2837367. [Google Scholar] [CrossRef]
- Vázquez, C.; Montagna, C.; Alcaraz, F.; Balsa, J.A.; Zamarrón, I.; Arrieta, F.; Botella-Carretero, J.I. Meal replacement with a low-calorie diet formula in weight loss maintenance after weight loss induction with diet alone. Eur. J. Clin. Nutr. 2009, 63, 1226–1232. [Google Scholar] [CrossRef]
- Mathus-Vliegen, E.M.H. Obesity Management Task Force of the European Association for the Study of Obesity. Prevalence, pathophysiology, health consequences and treatment options of obesity in the elderly: A guideline. Obes Facts 2012, 5, 460–483. [Google Scholar] [CrossRef]
- Santarpia, L.; Contaldo, F.; Pasanisi, F. Body composition changes after weight-loss interventions for overweight and obesity. Clin. Nutr. Edinb. Scotl. 2013, 32, 157–161. [Google Scholar] [CrossRef]
- Deutz, N.E.; Bauer, J.M.; Barazzoni, R.; Biolo, G.; Boirie, Y.; Bosy-Westphal, A.; Cederholm, T.; Cruz-Jentoft, A.; Krznariç, Z.; Singer, P.; et al. Protein intake and exercise for optimal muscle function with aging: Recommendations from the ESPEN Expert Group. Clin. Nutr. Edinb. Scotl. 2014, 33, 929–936. [Google Scholar] [CrossRef]
- Kempf, K.; Schloot, N.C.; Gärtner, B.; Keil, R.; Schadewaldt, P.; Martin, S. Meal replacement reduces insulin requirement, HbA1c and weight long-term in type 2 diabetes patients with >100 U insulin per day. J. Hum. Nutr. Diet. Off. J. Br. Diet. Assoc. 2014, 27, 21–27. [Google Scholar] [CrossRef]
- Leader, N.J.; Ryan, L.; Molyneaux, L.; Yue, D.K. How best to use partial meal replacement in managing overweight or obese patients with poorly controlled type 2 diabetes. Obesity 2013, 21, 251–253. [Google Scholar] [CrossRef]
- Kempf, K.; Röhling, M.; Niedermeier, K.; Gärtner, B.; Martin, S. Individualized Meal Replacement Therapy Improves Clinically Relevant Long-Term Glycemic Control in Poorly Controlled Type 2 Diabetes Patients. Nutrients 2018, 10, 1022. [Google Scholar] [CrossRef]
- Metzner, C.E.; Folberth-Vögele, A.; Bitterlich, N.; Lemperle, M.; Schäfer, S.; Alteheld, B.; Stehle, P.; Siener, R. Effect of a conventional energy-restricted modified diet with or without meal replacement on weight loss and cardiometabolic risk profile in overweight women. Nutr. Metab. 2011, 8, 64. [Google Scholar] [CrossRef]
- Tovar, A.R.; Caamaño M del, C.; Garcia-Padilla, S.; García, O.P.; Duarte, M.A.; Rosado, J.L. The inclusion of a partial meal replacement with or without inulin to a calorie restricted diet contributes to reach recommended intakes of micronutrients and decrease plasma triglycerides: A randomized clinical trial in obese Mexican women. Nutr. J. 2012, 11, 44. [Google Scholar] [CrossRef]
- Jensen, M.D.; Ryan, D.H.; Apovian, C.M.; Ard, J.D.; Comuzzie, A.G.; Donato, K.A.; Hu, F.B.; Jakicic, J.M.; Kushner, R.F.; Loria, C.M.; et al. 2013 AHA/ACC/TOS guideline for the management of overweight and obesity in adults: A report of the American College of Cardiology/American Heart Association Task Force on Practice Guidelines and The Obesity Society. J. Am. Coll. Cardiol. 2014, 63, 2985–3023. [Google Scholar] [CrossRef]
- Siebenhofer, A.; Jeitler, K.; Horvath, K.; Berghold, A.; Siering, U.; Semlitsch, T. Long-term effects of weight-reducing drugs in hypertensive patients. Cochrane Database Syst. Rev. 2013. [Google Scholar] [CrossRef]


| 1 MEAL REPLACEMENT | 2 MEAL REPLACEMENTS | |||
|---|---|---|---|---|
| MEN | WOMEN | MEN | WOMEN | |
| Caloric Value (kcal) | 1152.2 | 1021.4 | 1192.7 | 1035.9 |
| Proteins (g (%TCV)) | 72 (25%) | 64.2 (25%) | 71.9 (24%) | 64.4 (25%) |
| Lipids (g(%TCV)) | 31 (24%) | 19.8 (17%) | 19.9 (15%) | 19.1 (17%) |
| Cholesterol (mg) | 21.1 | 23.1 | 22.9 | 21 |
| Carbohydrates (g(%TCV)) | 146.3 (51%) | 146.6 (57%) | 181.5 (61%) | 151.6 (59%) |
| Fiber (g) | 16.2 | 15.8 | 19.6 | 15.9 |
| VARIABLES | TOTAL | 1 MEAL REPLACEMENT n = 52 | 2 MEAL REPLACEMENTs n = 60 | p-Value |
|---|---|---|---|---|
| Sex (% Women) | 72.3 | 67.3% | 76.7% | 0.27 |
| Age (years) | 61.02 (11.03) | 60.58 (11.21) | 61.40 (10.95) | 0.69 |
| Osteoarthritis (%) (Knee/Hip/Spine) | 79.5/6.3/14.3 | 78.8/7.7/13.5 | 80/5/15 | 0.83 |
| Weight (kg) | 101.4 (13.9) | 100.9 (13.8) | 101.8 (14.3) | 0.75 |
| BMI (kg/m2) | 39.56 (5.22) | 38.89 (5.11) | 40.15 (5.27) | 0.21 |
| Waist (cm) | 117.9 (13.6) | 115.6 (17.2) | 120.1 (9.0) | 0.17 |
| Hip (cm) | 124.2 (15.1) | 122.3 (19.1) | 125.9 (10.4) | 0.41 |
| BIA Fat Mass (%) | 45.59 (7.45) | 44.79 (7.77) | 46.28 (7.16) | 0.29 |
| BIA Fat-Free Mass (%) | 54.29 (7.34) | 55.10 (7.64) | 53.58 (7.05) | 0.27 |
| BIA Phase Angle (o) | 5.81 (1.15) | 5.77 (1.13) | 5.85 (1.17) | 0.73 |
| FMI (kg/m2) | 18.38 (4.29) | 17.69 (4.45) | 18.97 (4.09) | 0.12 |
| FFMI (kg/m2) | 21.37 (3.47) | 21.43 (2.85) | 21.33 (3.96) | 0.88 |
| Hypertension (%) | 50% | 52.9% | 48.3% | 0.63 |
| SBP (mmHg) | 133 (15) | 132 (14) | 134 (15) | 0.51 |
| DBP (mmHg) | 81 (8) | 80 (6) | 82 (9) | 0.12 |
| Dyslipidemia (%) | 8.9% | 5.8% | 11.7% | 0.27 |
| Triglycerides (mg/dL) | 129 (50) | 122 (45) | 136 (53) | 0.17 |
| Total Cholesterol (mg/dL) | 191 (34) | 194 (33) | 189 (35) | 0.50 |
| HDL (mg/dL) | 53 (12) | 52 (13) | 54 (11) | 0.55 |
| LDL (mg/dL) | 113 (29) | 117 (27) | 109 (31) | 0.13 |
| Diabetes Mellitus (%) | 8% | 3.8% | 11.7% | 0.13 |
| Fasting Blood Glucose (mg/dL) | 109 (26) | 110 (31) | 109 (22) | 0.83 |
| Insulin mU/mL | 19.37 (15.11) | 19.18 (12.28) | 19.53 (17.33) | 0.90 |
| HOMA-IR | 5.03 (3.52) | 5.31 (4.01) | 4.79 (3.04) | 0.70 |
| VARIABLES | 1 MEAL REPLACEMENT n = 52 | 2 MEAL REPLACEMENTS n = 60 | ||||||
|---|---|---|---|---|---|---|---|---|
| START | 3 MONTHS | Change | p | START | 3 MONTHS | Change | p | |
| Weight (kg) | 100.9 (13.8) | 93.0 (15.1) | 7.9 (5.7) | <0.01 | 102 (14.3) | 93.1 (13.6) | 8.7 (3.6) | <0.01 |
| BMI (kg/m2) | 38.72 (5.23) | 36.18 (5.11) | 2.54 (3.04) | <0.01 | 39.96 (5.13) | 36.63 (4.79) | 3.34 (5.95) | <0.01 |
| Waist (cm) | 115.5 (17.4) | 110.7 (10.1) | 4.9 (16.3) | 0.04 | 120.2 (9.1) | 113.7 (9.8) | 6.5 (6.3) | <0.01 |
| Hip (cm) | 122.3 (19.1) | 120.1 (16.7) | 2.2 (19.8) | 0.43 | 125.9 (10.5) | 119.1 (10.3) | 6.8 (5.1) | <0.01 |
| Fat Mass (%) | 44.79 (7.77) | 42.71 (8.64) | 2.07 (4.3) | <0.01 | 46.28 (7.16) | 43.14 (8.5) | 3.14 (5.60) | <0.01 |
| Fat-Free Mass (%) | 55.10 (7.64) | 58.67 (8.50) | 3.57 (4.61) | <0.01 | 53.58 (7.05) | 55.72 (8.91) | 2.14 (4.45) | <0.01 |
| Phase Angle (o) | 5.77 (1.13) | 5.74 (0.98) | 0.03 (1.01) | 0.82 | 5.86 (1.18) | 5.57 (0.85) | 0.29 (1.08) | 0.04 |
| FMI (kg/m2) | 17.69 (4.45) | 15.54 (4.42) | 2.15 (1.45) | <0.01 | 18.97 (4.09) | 16.19 (4.16) | 2.78 (2.55) | <0.01 |
| FFMI (kg/m2) | 21.43 (2.84) | 20.91 (2.65) | 0.52 (0.83) | <0.01 | 21.33 (3.96) | 20.44 (3.71) | 0.89 (0.98) | <0.01 |
| FFM/FM | 1.32 (0.53) | 1.48 (0.59) | 0.16 (0.16) | <0.01 | 1.22 (0.43) | 1.40 (0.59) | 0.17 (0.34) | <0.01 |
| VARIABLES | 1 MEAL REPLACEMENT | 2 MEAL REPLACEMENTS | ||||||
|---|---|---|---|---|---|---|---|---|
| START | 3 MONTHS | p | START | 3 MONTHS | p | |||
| SBP (mmHg) | 131.92 (14.48) | 123.26 (12.52) | 8.65 (15.18) | <0.01 | 133.77 (14.99) | 123.30 (10.91) | 10.47 (16.06) | <0.01 |
| DBP (mmHg) | 79.56 (6.33) | 78.61 (6.86) | 0.94 (7.5) | 0.37 | 81.67 (8.91) | 79.85 (14.03) | 2.01 (14.94) | 0.30 |
| Triglycerides (mg/dL) | 121.59 (44.73) | 113.98 (39.03) | 7.61 (36.33) | 0.14 | 136.15 (53.53) | 125.75 (40.11) | 10.41 (32.75) | 0.02 |
| Total Cholesterol (mg/dL) | 192.33 (31.98) | 181.07 (29.59) | 11.26 (21.45) | <0.01 | 189.17 (35.61) | 177.44 (34.52) | 11.73 (24.67) | <0.01 |
| HDL (mg/dL) | 51.43 (12.62) | 48.61 (12.20) | 2.82 (8.01) | 0.01 | 53.05 (10.89) | 48.30 (7.64) | 4,75 (6.81) | <0.01 |
| LDL (mg/dL) | 116.63 (26.88) | 109.75 (25.06) | 6.88 (18.43) | 0.01 | 108.86 (31.09) | 103.98 (31.61) | 4.87 (19.83) | 0.06 |
| Blood Plasma Glucose (mg/dL) | 110.41 (30.85) | 104.53 (20.72) | 5.88 (15.05) | <0.01 | 109.15 (22.13) | 99.84 (19.69) | 9.31 (21.32) | <0.02 |
| Insulin (U/mL) | 19.19 (12.28) | 15.16 (8.01) | 4.02 (7.91) | <0.01 | 19.74 (17.77) | 15.95 (10.30) | 3.79 (17.21) | 0.11 |
| HOMA-IR | 5.37 (4.02) | 3.95 (2.27) | 1.42 (2.81) | <0.01 | 4.81 (3.12) | 3.91 (2.58) | 0.89 (2.33) | <0.01 |
© 2020 by the authors. Licensee MDPI, Basel, Switzerland. This article is an open access article distributed under the terms and conditions of the Creative Commons Attribution (CC BY) license (http://creativecommons.org/licenses/by/4.0/).
Share and Cite
López-Gómez, J.J.; Izaola-Jauregui, O.; Primo-Martín, D.; Torres-Torres, B.; Gómez-Hoyos, E.; Ortolá-Buigues, A.; Martín-Ferrero, M.A.; De Luis-Román, D.A. Effect of Two Meal Replacement strategies on Cardiovascular Risk Parameters in Advanced Age Patients with Obesity and Osteoarthritis. Nutrients 2020, 12, 976. https://doi.org/10.3390/nu12040976
López-Gómez JJ, Izaola-Jauregui O, Primo-Martín D, Torres-Torres B, Gómez-Hoyos E, Ortolá-Buigues A, Martín-Ferrero MA, De Luis-Román DA. Effect of Two Meal Replacement strategies on Cardiovascular Risk Parameters in Advanced Age Patients with Obesity and Osteoarthritis. Nutrients. 2020; 12(4):976. https://doi.org/10.3390/nu12040976
Chicago/Turabian StyleLópez-Gómez, Juan José, Olatz Izaola-Jauregui, David Primo-Martín, Beatriz Torres-Torres, Emilia Gómez-Hoyos, Ana Ortolá-Buigues, Miguel A. Martín-Ferrero, and Daniel A. De Luis-Román. 2020. "Effect of Two Meal Replacement strategies on Cardiovascular Risk Parameters in Advanced Age Patients with Obesity and Osteoarthritis" Nutrients 12, no. 4: 976. https://doi.org/10.3390/nu12040976
APA StyleLópez-Gómez, J. J., Izaola-Jauregui, O., Primo-Martín, D., Torres-Torres, B., Gómez-Hoyos, E., Ortolá-Buigues, A., Martín-Ferrero, M. A., & De Luis-Román, D. A. (2020). Effect of Two Meal Replacement strategies on Cardiovascular Risk Parameters in Advanced Age Patients with Obesity and Osteoarthritis. Nutrients, 12(4), 976. https://doi.org/10.3390/nu12040976