Bifidobacterium breve UCC2003 Exopolysaccharide Modulates the Early Life Microbiota by Acting as a Potential Dietary Substrate

 , and
, and 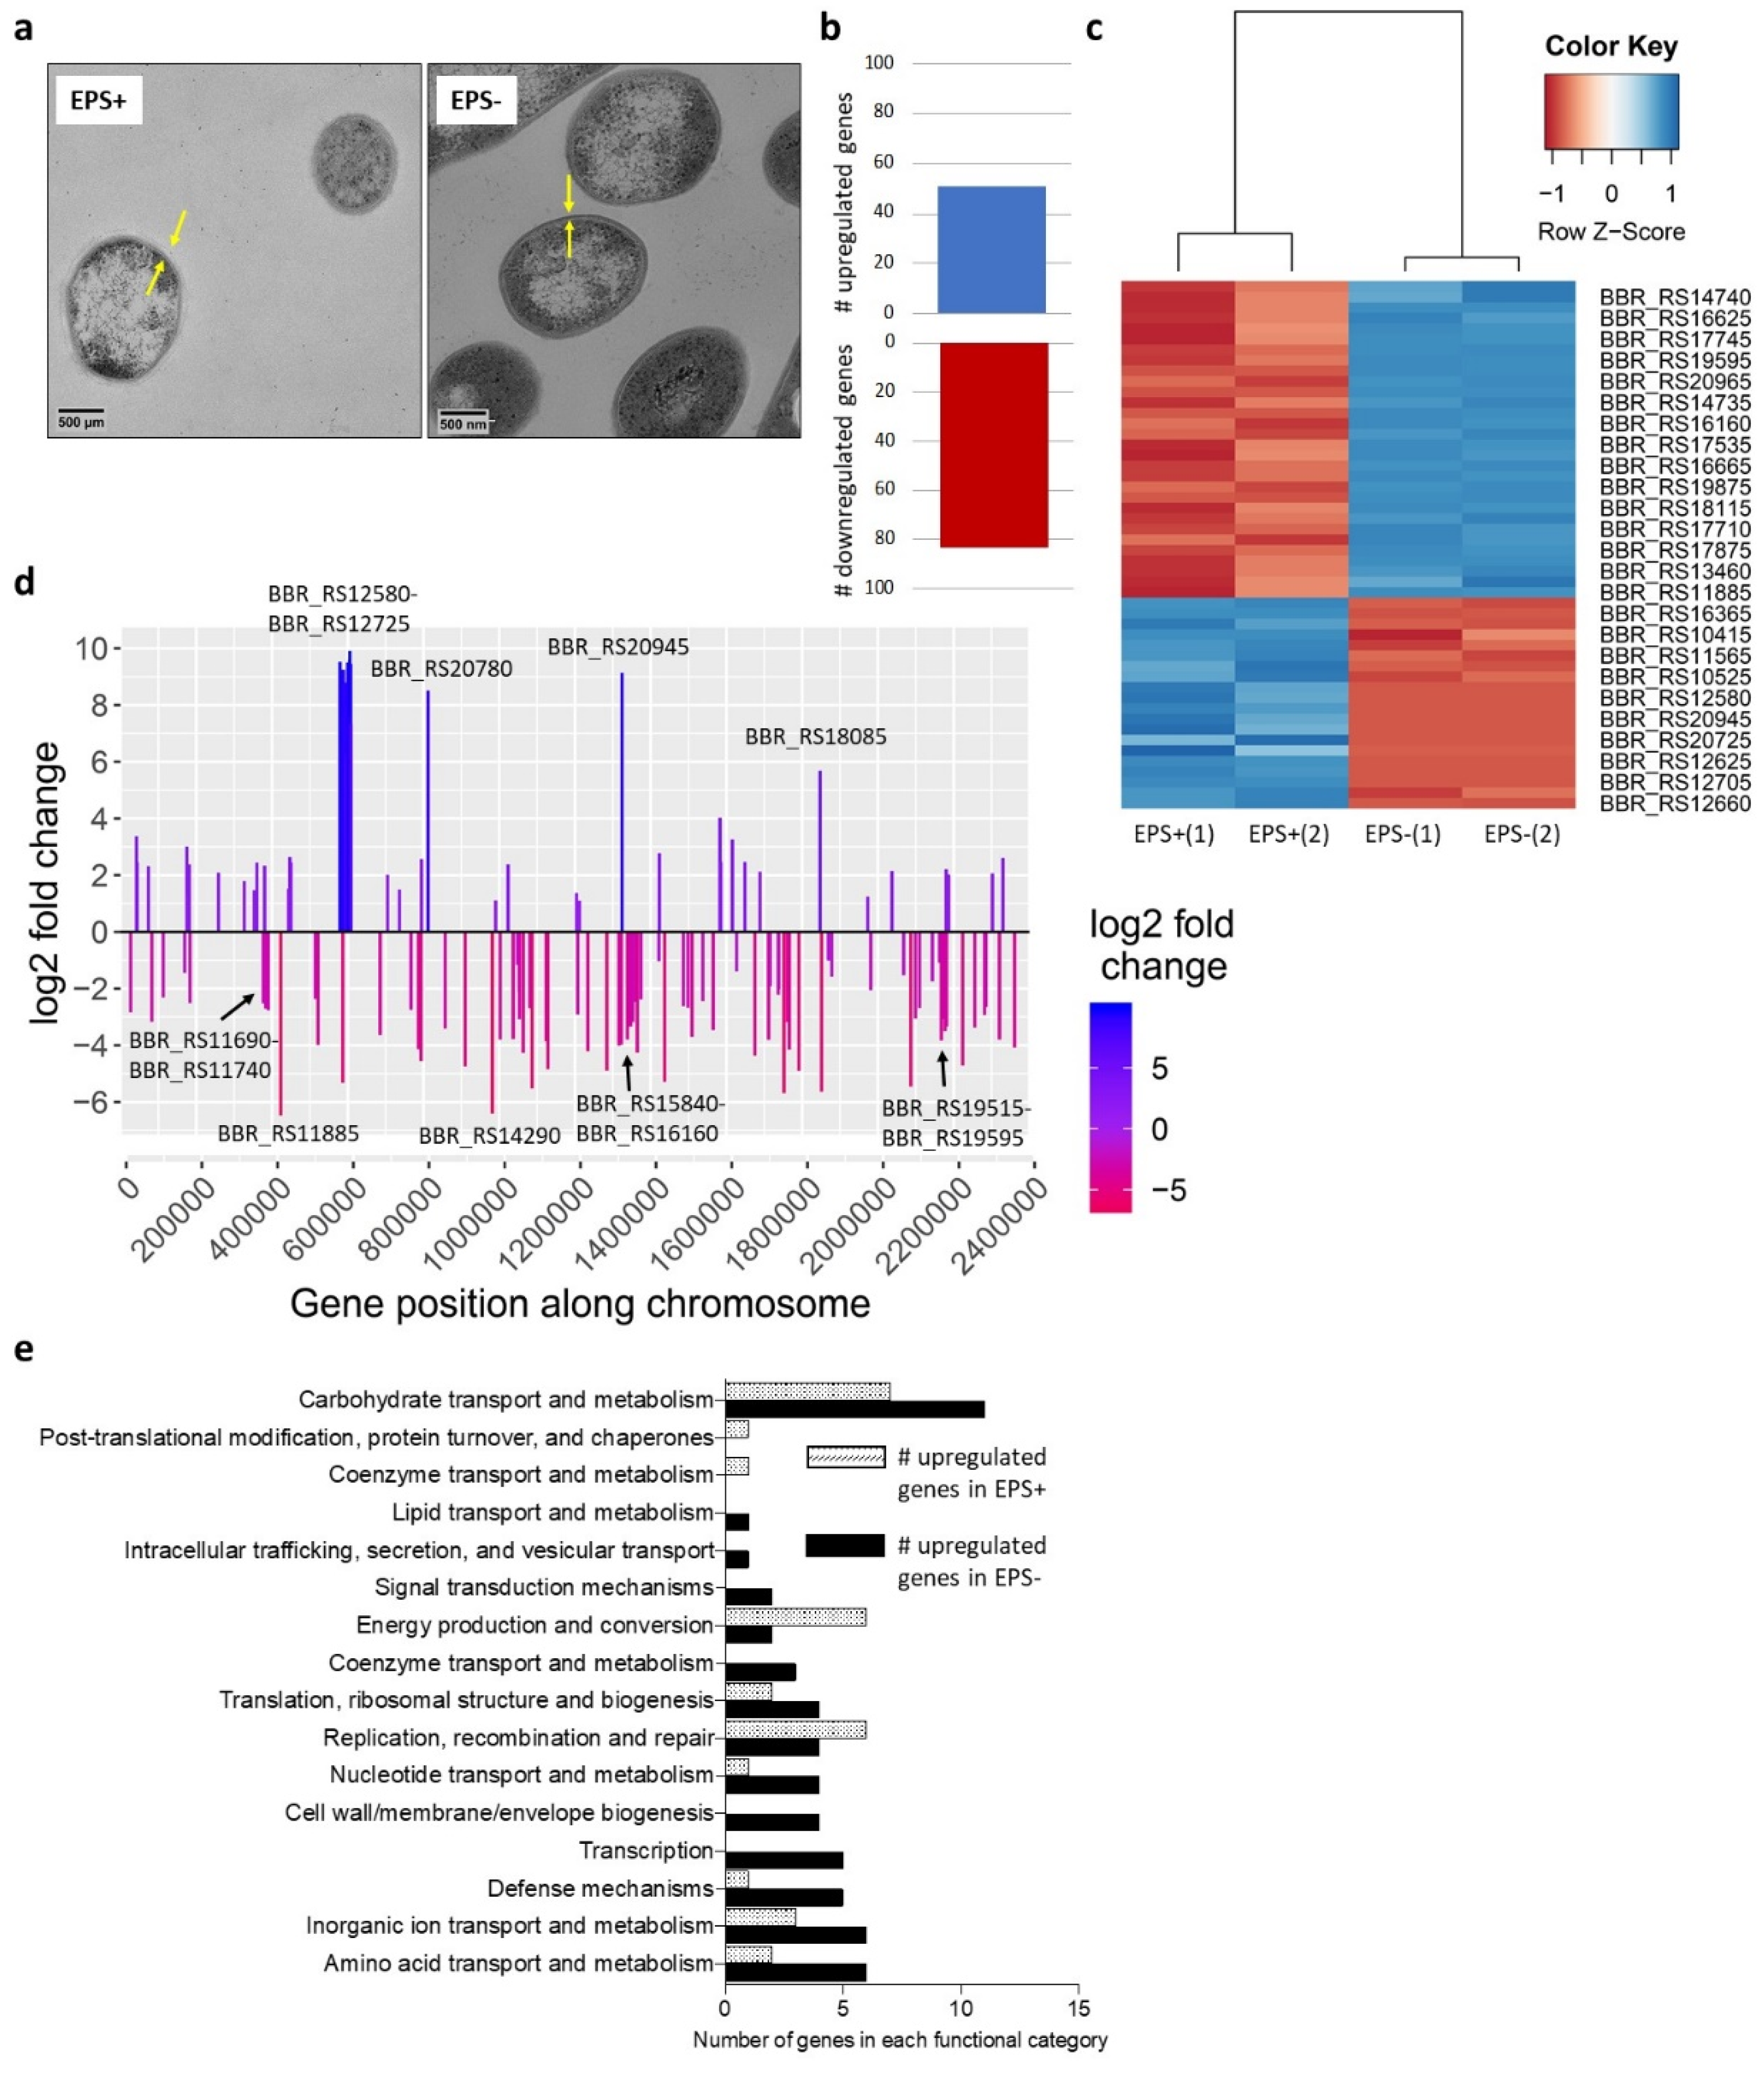
Abstract
:1. Introduction
2. Materials and Methods
2.1. Bacterial Strains and Growth Conditions
2.2. B. breve Transcriptomics and Bioinformatics Analysis
2.3. Transmission Electron Microscopy (TEM)
2.4. Infant Model Colon System
2.5. DNA Extraction, 16S rRNA Library Preparation, Sequencing, and Bioinformatics Analysis
2.6. 1H NMR Analyses
2.7. Statistical Analyses and Plotting
3. Results
3.1. Surface-Associated EPS Influences B. breve Gene Expression
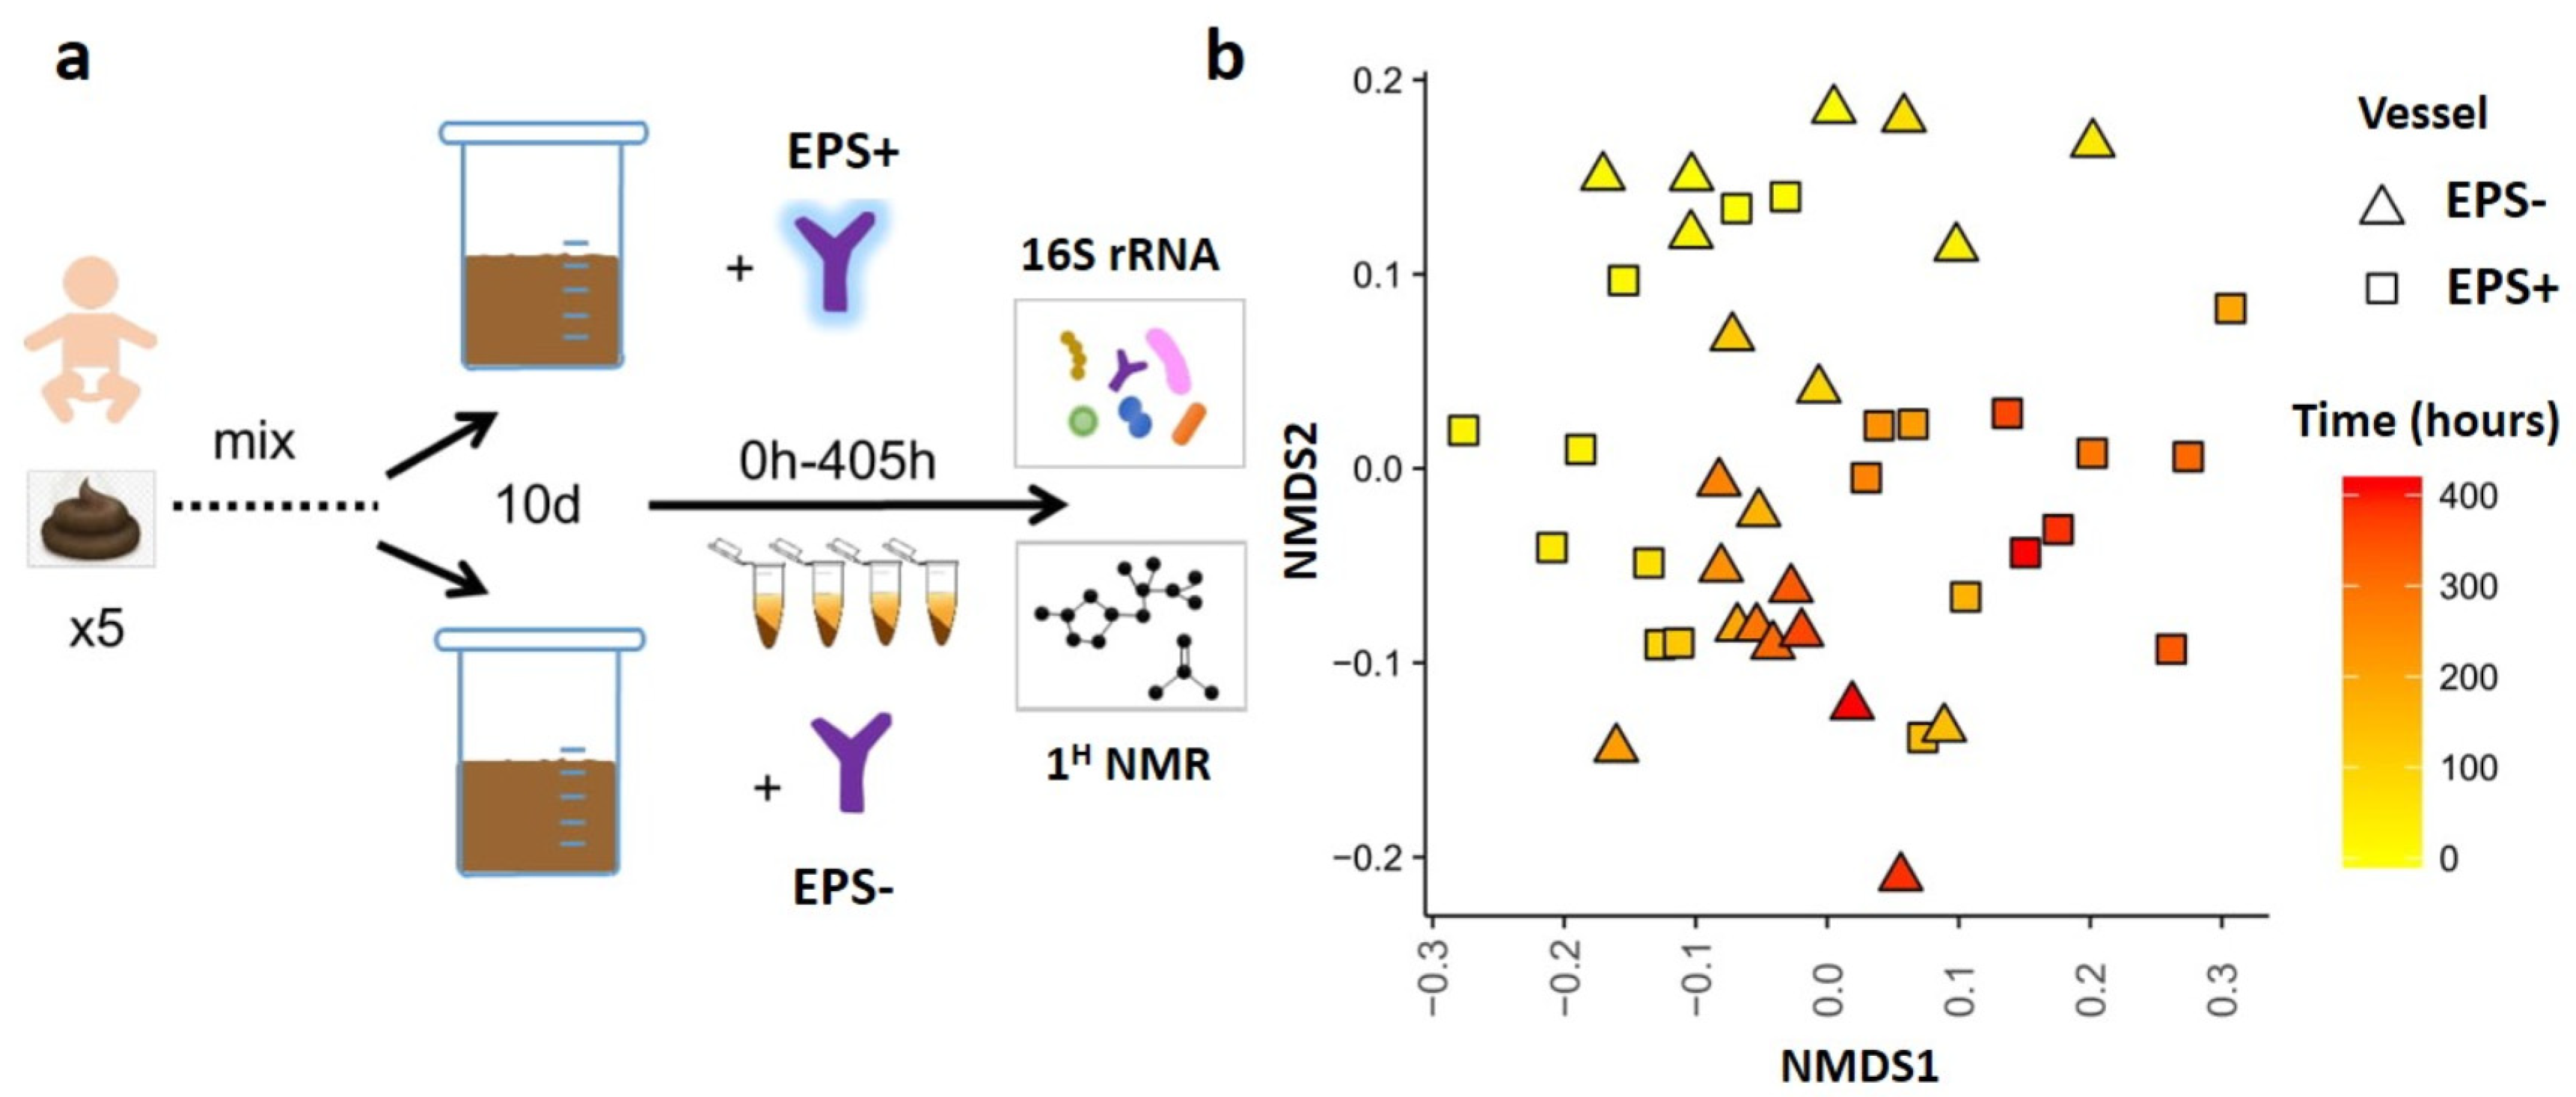
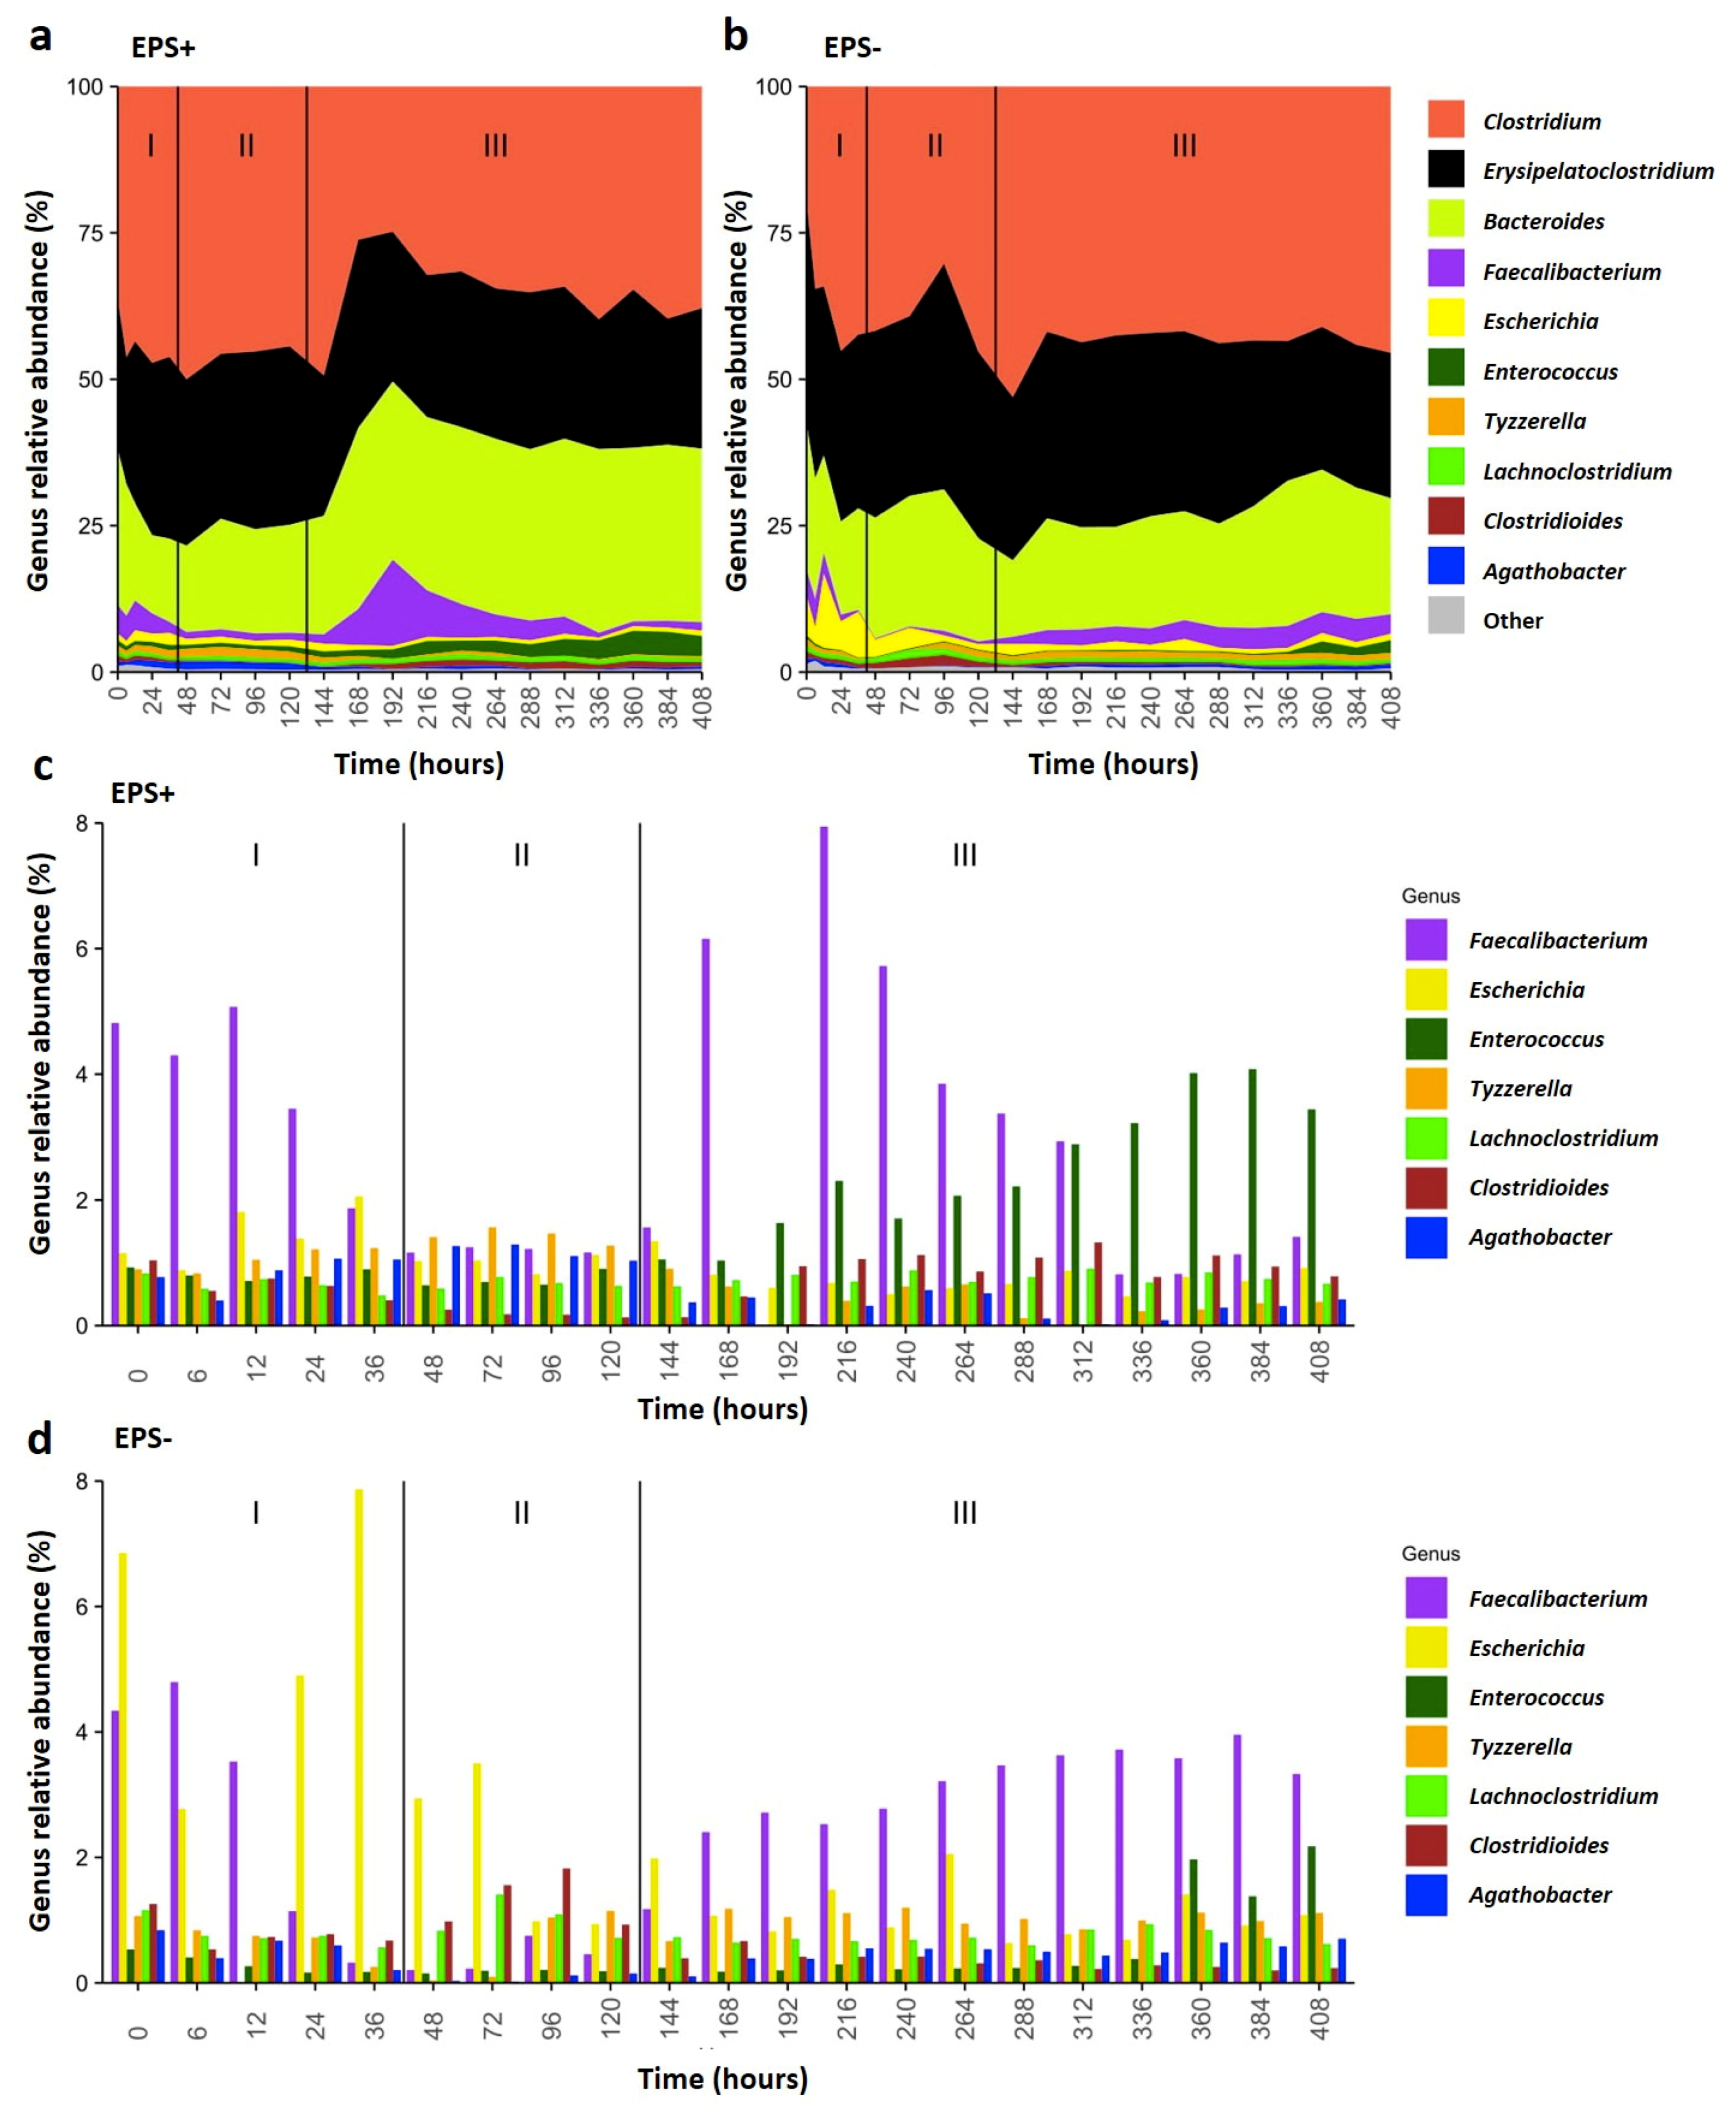
3.2. B. breve EPS Influences Infant Microbiome Composition over Time
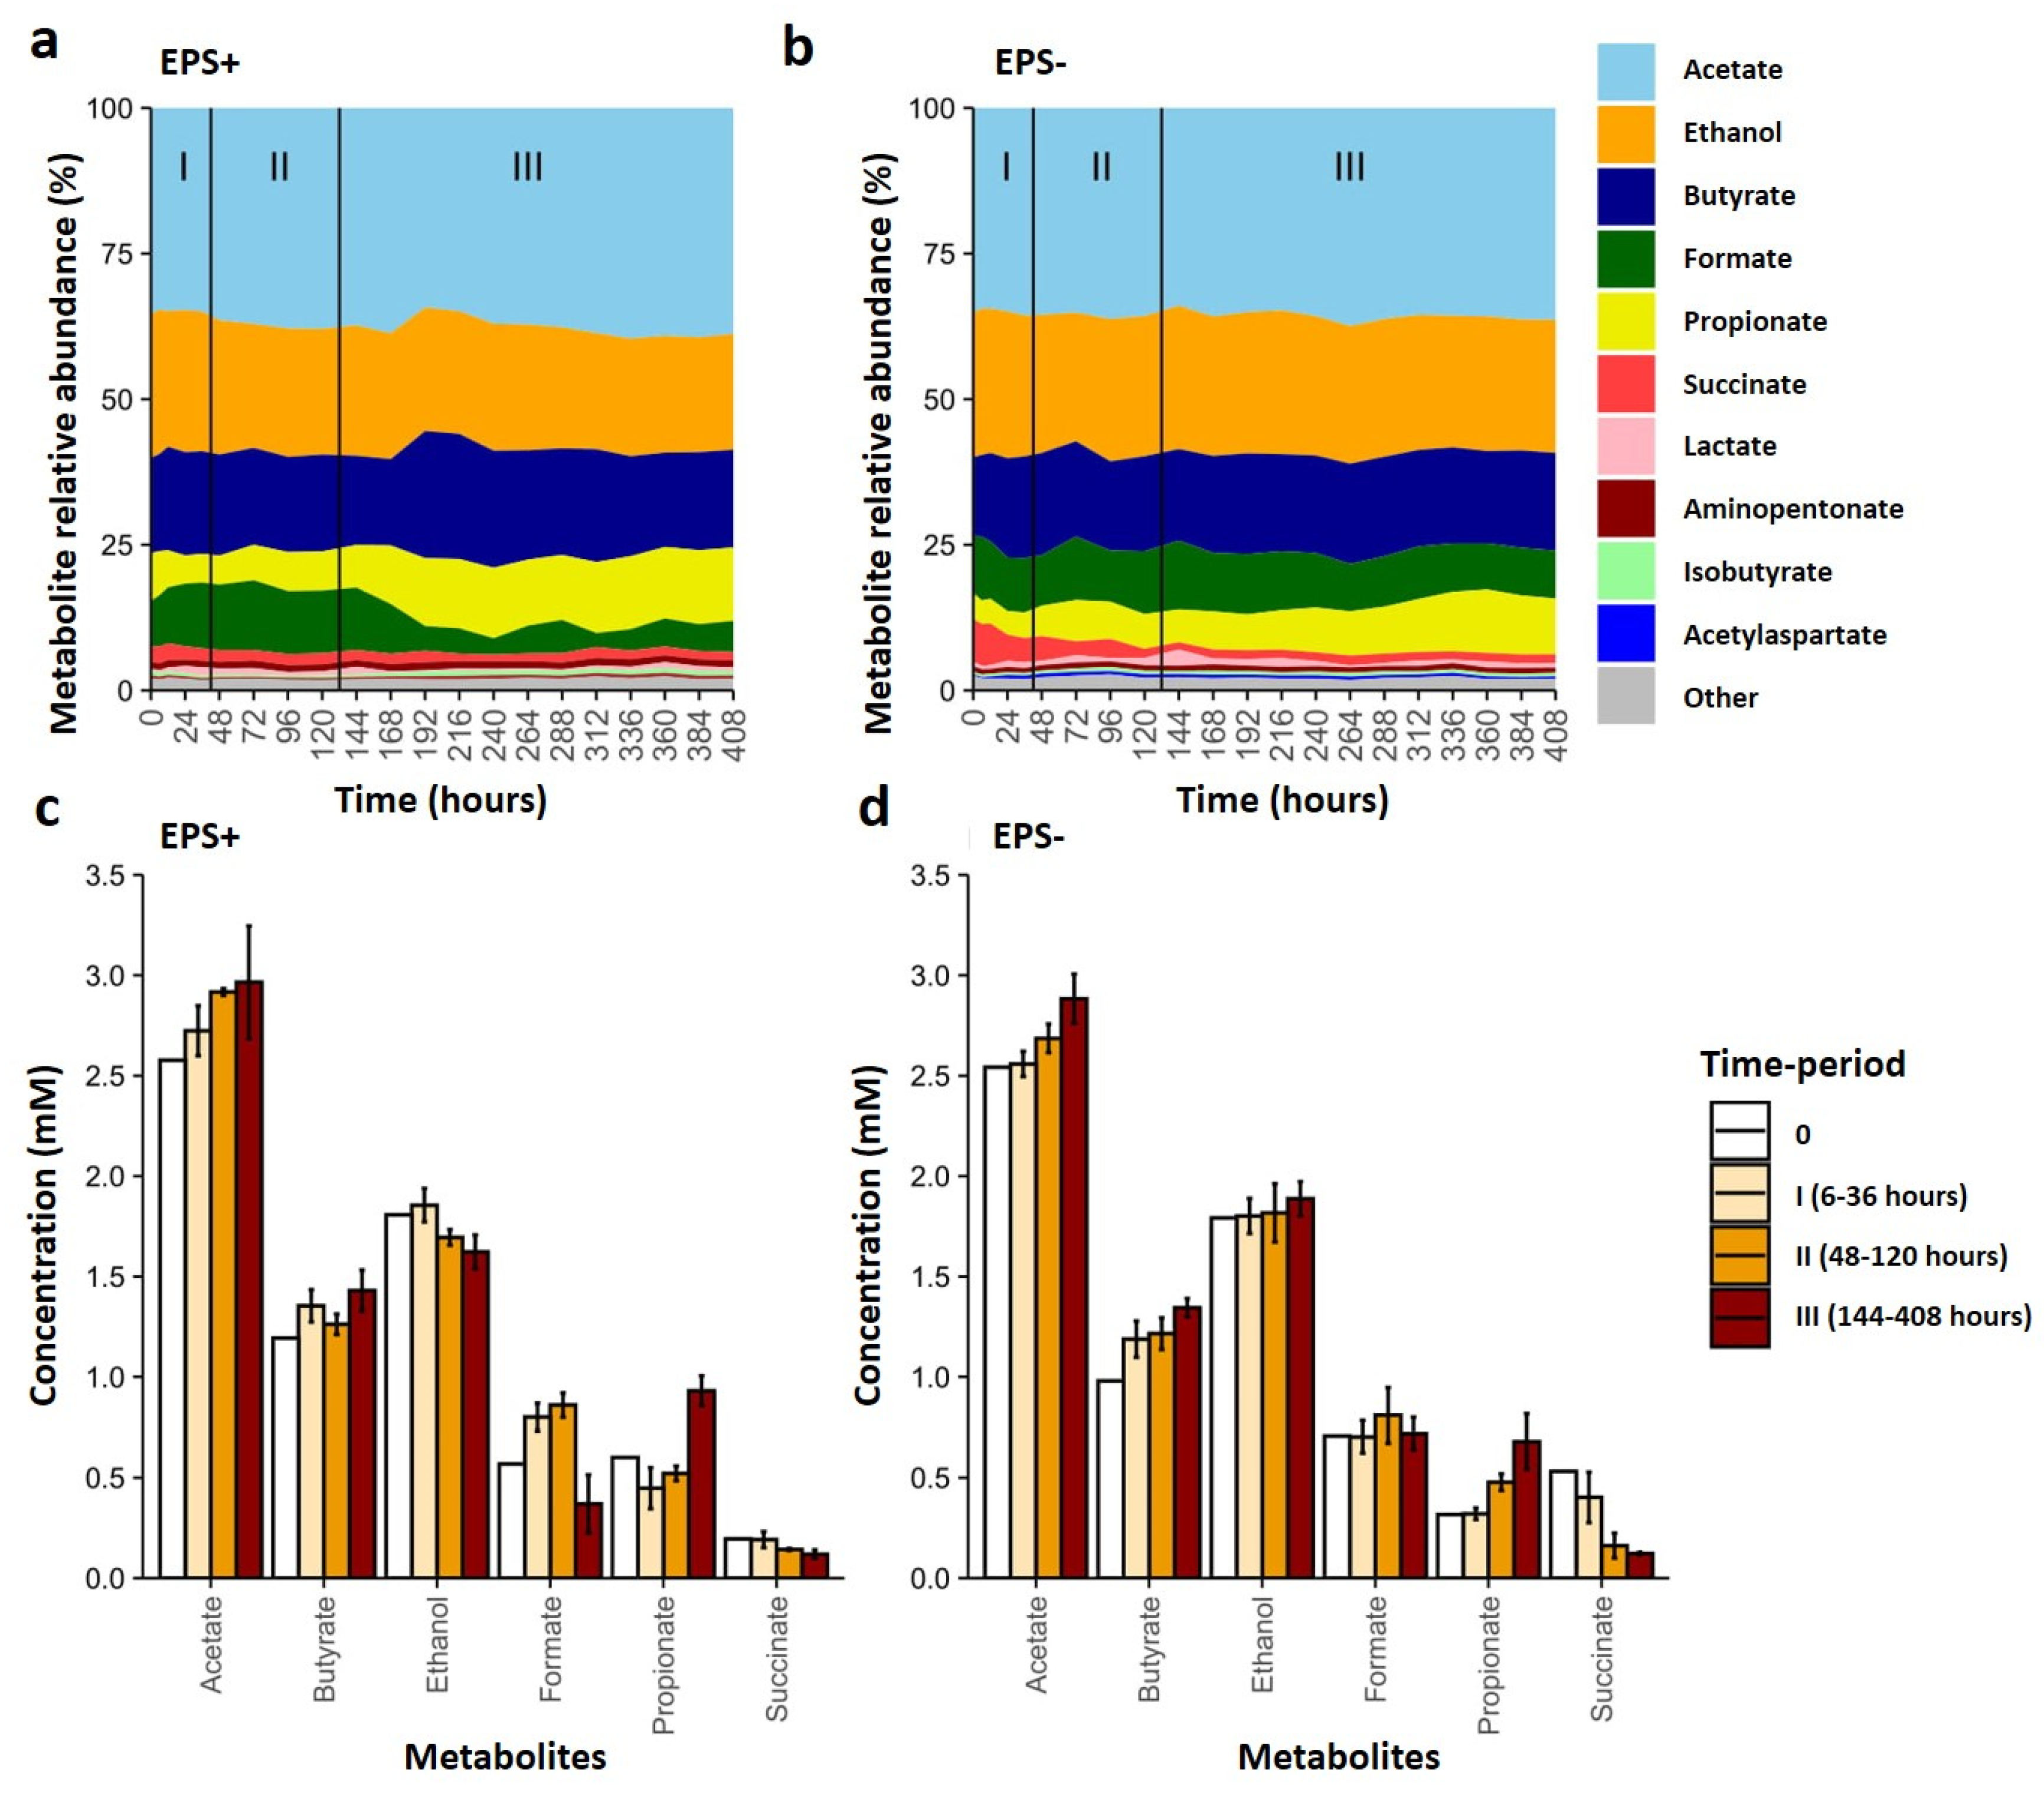
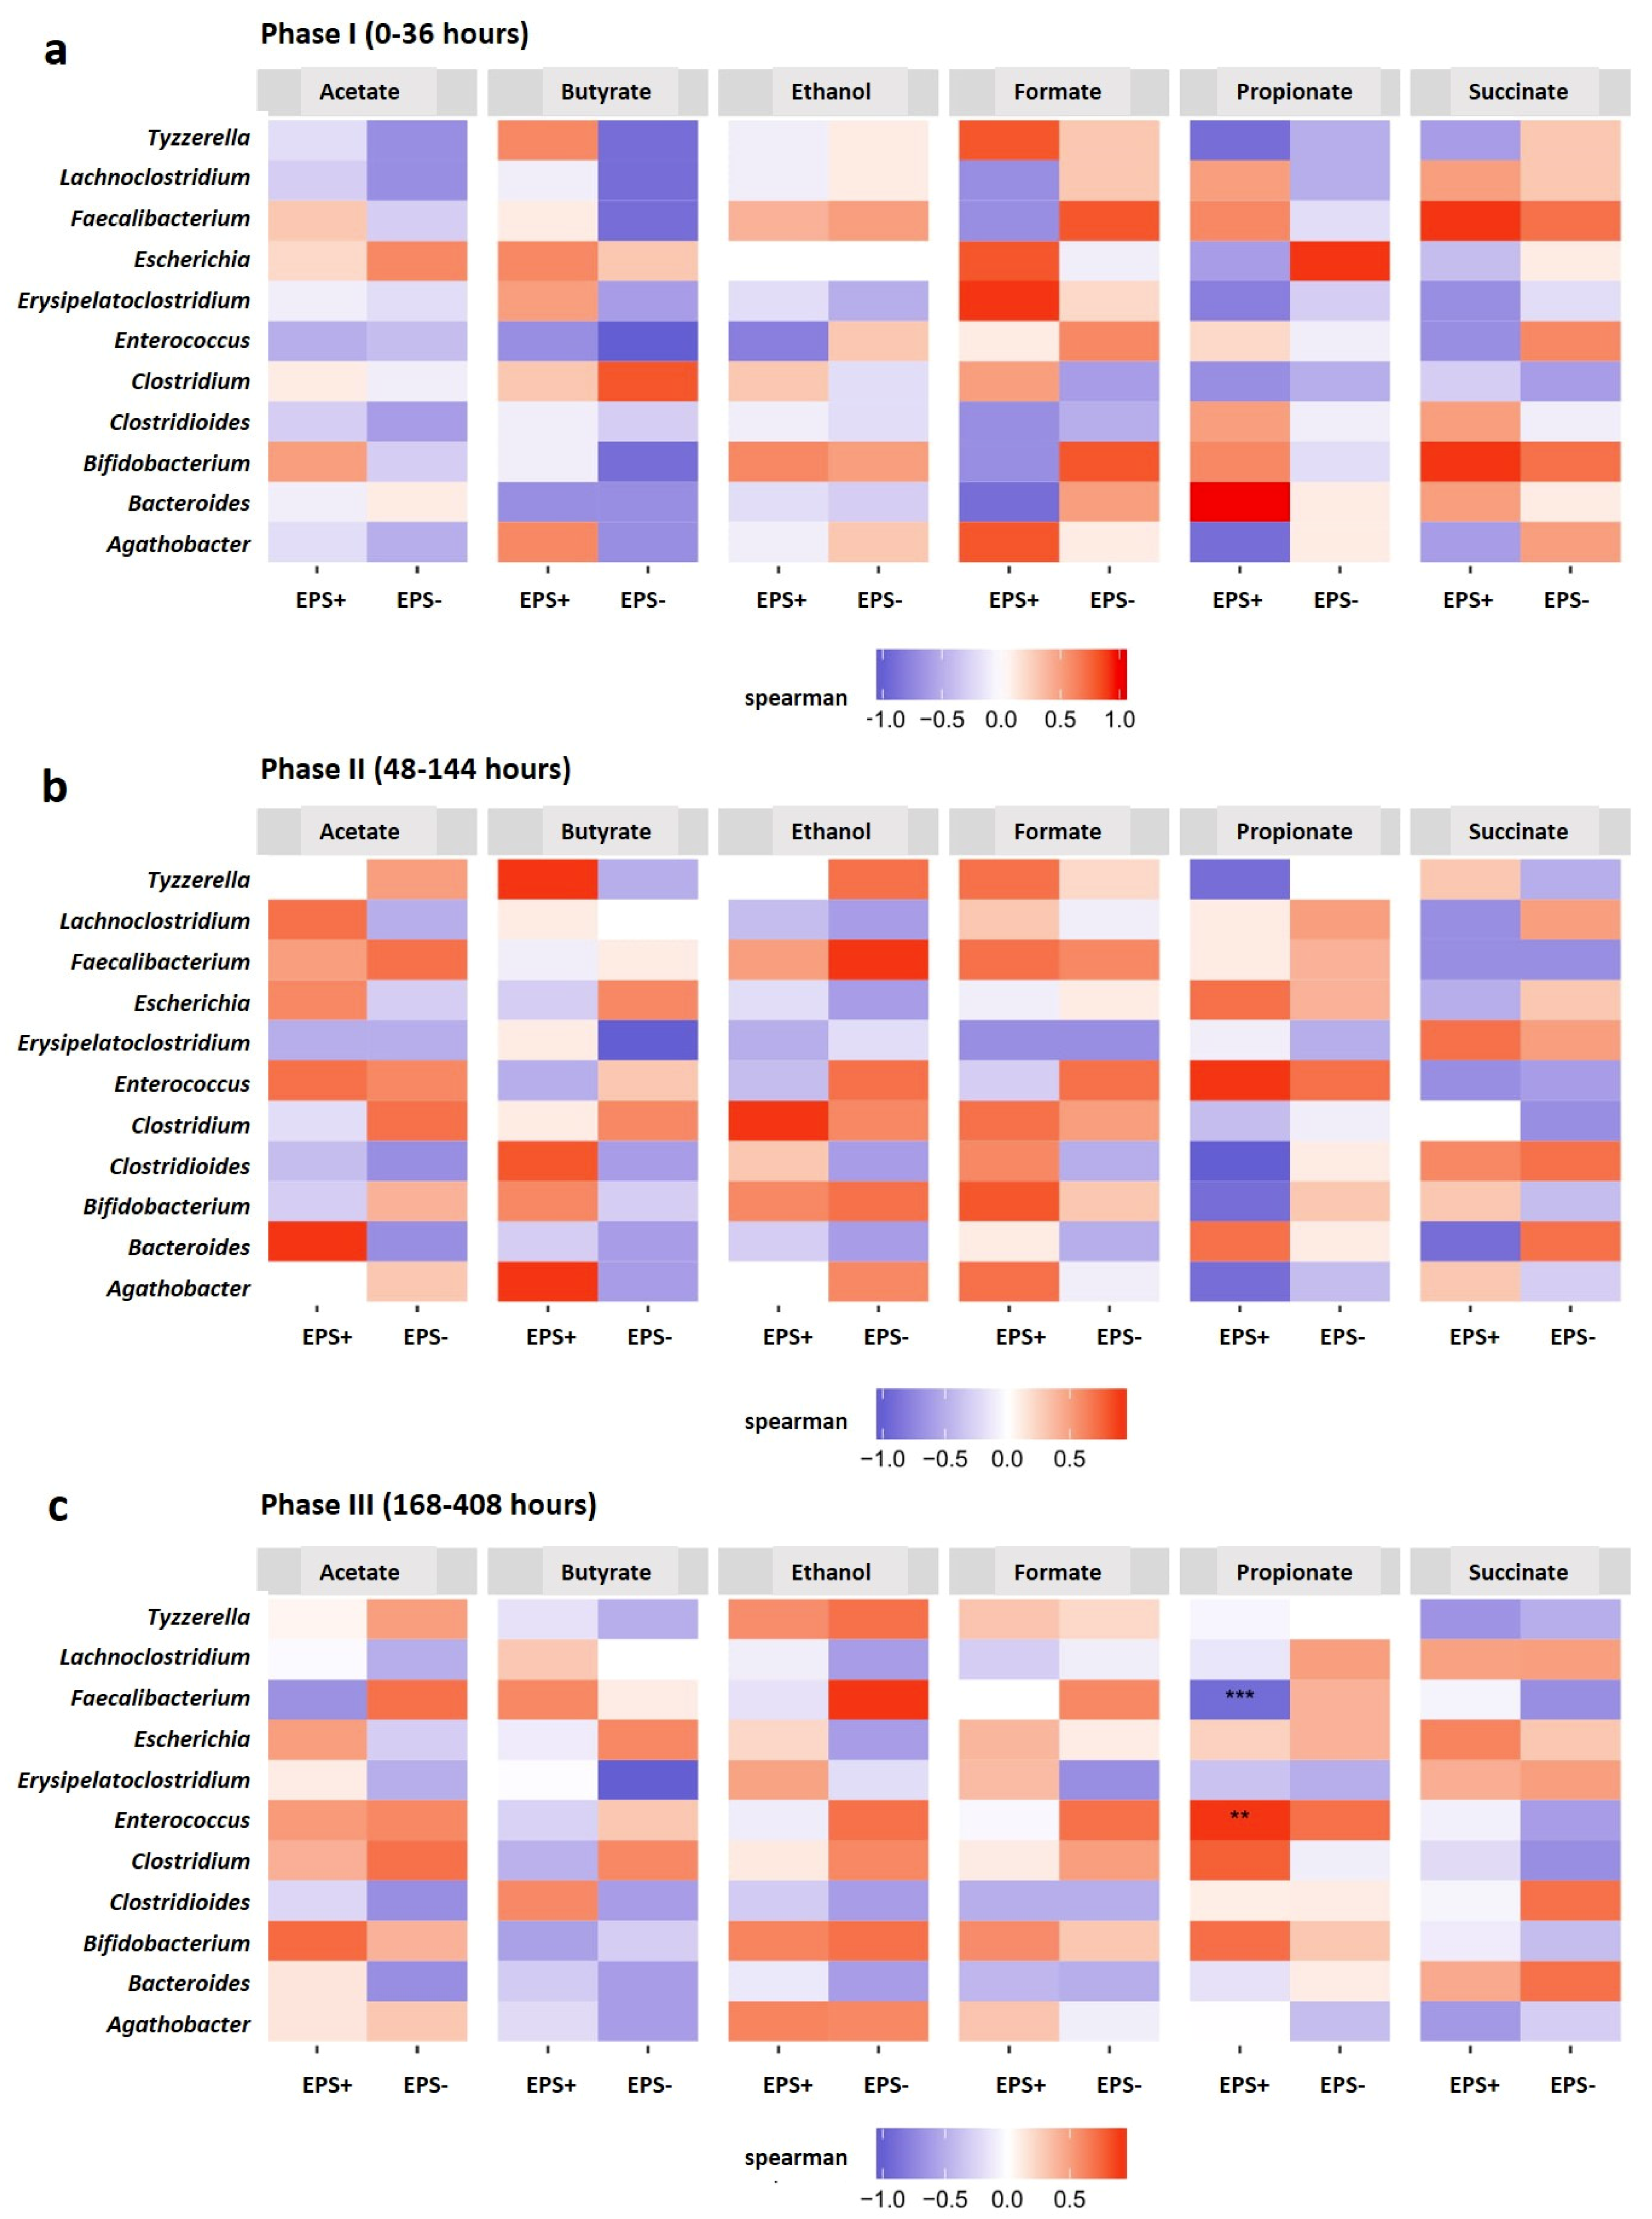
3.3. Metabolite Profiles Shift in Response to Bifidobacterial EPS
4. Discussion
5. Conclusions
Supplementary Materials
Author Contributions
Funding
Acknowledgments
Conflicts of Interest
References
- Bottacini, F.; van Sinderen, D.; Ventura, M. Omics of bifidobacteria: Research and insights into their health-promoting activities. Biochem. J. 2017, 474, 4137–4152. [Google Scholar] [CrossRef] [PubMed]
- Fallani, M.; Young, D.; Scott, J.; Norin, E.; Amarri, S.; Adam, R.; Aguilera, M.; Khanna, S.; Gil, A.; Edwards, C.A.; et al. Intestinal microbiota of 6-week-old infants across Europe: Geographic influence beyond delivery mode, breast-feeding, and antibiotics. J. Pediatr. Gastroenterol. Nutr. 2010, 51, 77–84. [Google Scholar] [CrossRef] [PubMed]
- Koenig, J.E.; Spor, A.; Scalfone, N.; Fricker, A.D.; Stombaugh, J.; Knight, R.; Angenent, L.T.; Ley, R.E. Succession of microbial consortia in the developing infant gut microbiome. Proc. Natl Acad. Sci. USA 2011, 108 (Suppl. 1), 4578–4585. [Google Scholar] [CrossRef] [PubMed] [Green Version]
- Stewart, C.J.; Ajami, N.J.; O’Brien, J.L.; Hutchinson, D.S.; Smith, D.P.; Wong, M.C.; Ross, M.C.; Lloyd, R.E.; Doddapaneni, H.; Metcalf, G.A.; et al. Temporal development of the gut microbiome in early childhood from the TEDDY study. Nature 2018, 562, 583–588. [Google Scholar] [CrossRef]
- Yassour, M.; Vatanen, T.; Siljander, H.; Hamalainen, A.M.; Harkonen, T.; Ryhanen, S.J.; Franzosa, E.A.; Vlamakis, H.; Huttenhower, C.; Gevers, D.; et al. Natural history of the infant gut microbiome and impact of antibiotic treatment on bacterial strain diversity and stability. Sci. Transl. Med. 2016, 8, 343ra381. [Google Scholar] [CrossRef] [Green Version]
- Spor, A.; Koren, O.; Ley, R. Unravelling the effects of the environment and host genotype on the gut microbiome. Nat. Rev. Microbiol. 2011, 9, 279–290. [Google Scholar] [CrossRef]
- Yatsunenko, T.; Rey, F.E.; Manary, M.J.; Trehan, I.; Dominguez-Bello, M.G.; Contreras, M.; Magris, M.; Hidalgo, G.; Baldassano, R.N.; Anokhin, A.P.; et al. Human gut microbiome viewed across age and geography. Nature 2012, 486, 222–227. [Google Scholar] [CrossRef]
- Lawson, M.A.E.; O’Neill, I.J.; Kujawska, M.; Gowrinadh Javvadi, S.; Wijeyesekera, A.; Flegg, Z.; Chalklen, L.; Hall, L.J. Breast milk-derived human milk oligosaccharides promote Bifidobacterium interactions within a single ecosystem. ISME J. 2020, 14, 635–648. [Google Scholar] [CrossRef] [Green Version]
- Turroni, F.; Peano, C.; Pass, D.A.; Foroni, E.; Severgnini, M.; Claesson, M.J.; Kerr, C.; Hourihane, J.; Murray, D.; Fuligni, F.; et al. Diversity of bifidobacteria within the infant gut microbiota. PLoS ONE 2012, 7, e36957. [Google Scholar] [CrossRef] [Green Version]
- Ho, N.T.; Li, F.; Lee-Sarwar, K.A.; Tun, H.M.; Brown, B.P.; Pannaraj, P.S.; Bender, J.M.; Azad, M.B.; Thompson, A.L.; Weiss, S.T.; et al. Meta-analysis of effects of exclusive breastfeeding on infant gut microbiota across populations. Nat. Commun. 2018, 9, 4169. [Google Scholar] [CrossRef] [PubMed]
- Roger, L.C.; Costabile, A.; Holland, D.T.; Hoyles, L.; McCartney, A.L. Examination of faecal Bifidobacterium populations in breast- and formula-fed infants during the first 18 months of life. Microbiology 2010, 156, 3329–3341. [Google Scholar] [CrossRef] [Green Version]
- Castro-Bravo, N.; Wells, J.M.; Margolles, A.; Ruas-Madiedo, P. Interactions of Surface Exopolysaccharides From Bifidobacterium and Lactobacillus Within the Intestinal Environment. Front. Microbiol. 2018, 9, 2426. [Google Scholar] [CrossRef] [Green Version]
- Ferrario, C.; Milani, C.; Mancabelli, L.; Lugli, G.A.; Duranti, S.; Mangifesta, M.; Viappiani, A.; Turroni, F.; Margolles, A.; Ruas-Madiedo, P.; et al. Modulation of the eps-ome transcription of bifidobacteria through simulation of human intestinal environment. FEMS Microbiol. Ecol. 2016, 92, fiw056. [Google Scholar] [CrossRef] [PubMed] [Green Version]
- Alhudhud, M.; Sadiq, S.; Ngo, H.N.; Hidalgo-Cantabrana, C.; Ruas-Madiedo, P.; van Sinderen, D.; Humphreys, P.N.; Laws, A.P. Extraction of the same novel homoglycan mixture from two different strains of Bifidobacterium animalis and three strains of Bifidobacterium breve. Benef. Microbes 2018, 9, 663–674. [Google Scholar] [CrossRef] [PubMed]
- Hidalgo-Cantabrana, C.; Sanchez, B.; Milani, C.; Ventura, M.; Margolles, A.; Ruas-Madiedo, P. Genomic overview and biological functions of exopolysaccharide biosynthesis in Bifidobacterium spp. Appl. Environ. Microbiol. 2014, 80, 9–18. [Google Scholar] [CrossRef] [PubMed] [Green Version]
- Fanning, S.; Hall, L.J.; Cronin, M.; Zomer, A.; MacSharry, J.; Goulding, D.; Motherway, M.O.; Shanahan, F.; Nally, K.; Dougan, G.; et al. Bifidobacterial surface-exopolysaccharide facilitates commensal-host interaction through immune modulation and pathogen protection. Proc. Natl. Acad. Sci. USA 2012, 109, 2108–2113. [Google Scholar] [CrossRef] [PubMed] [Green Version]
- Hughes, K.R.; Harnisch, L.C.; Alcon-Giner, C.; Mitra, S.; Wright, C.J.; Ketskemety, J.; van Sinderen, D.; Watson, A.J.; Hall, L.J. Bifidobacterium breve reduces apoptotic epithelial cell shedding in an exopolysaccharide and MyD88-dependent manner. Open Biol. 2017, 7. [Google Scholar] [CrossRef] [Green Version]
- Salazar, N.; Binetti, A.; Gueimonde, M.; Alonso, A.; Garrido, P.; Gonzalez del Rey, C.; Gonzalez, C.; Ruas-Madiedo, P.; de los Reyes-Gavilan, C.G. Safety and intestinal microbiota modulation by the exopolysaccharide-producing strains Bifidobacterium animalis IPLA R1 and Bifidobacterium longum IPLA E44 orally administered to Wistar rats. Int. J. Food Microbiol. 2011, 144, 342–351. [Google Scholar] [CrossRef] [Green Version]
- Medlock, G.L.; Carey, M.A.; McDuffie, D.G.; Mundy, M.B.; Giallourou, N.; Swann, J.R.; Kolling, G.L.; Papin, J.A. Inferring Metabolic Mechanisms of Interaction within a Defined Gut Microbiota. Cell Syst. 2018, 7, 245–257. [Google Scholar] [CrossRef] [Green Version]
- Salazar, N.; Gueimonde, M.; Hernandez-Barranco, A.M.; Ruas-Madiedo, P.; de los Reyes-Gavilan, C.G. Exopolysaccharides produced by intestinal Bifidobacterium strains act as fermentable substrates for human intestinal bacteria. Appl. Environ. Microbiol. 2008, 74, 4737–4745. [Google Scholar] [CrossRef] [Green Version]
- Salazar, N.; Ruas-Madiedo, P.; Kolida, S.; Collins, M.; Rastall, R.; Gibson, G.; de Los Reyes-Gavilan, C.G. Exopolysaccharides produced by Bifidobacterium longum IPLA E44 and Bifidobacterium animalis subsp. lactis IPLA R1 modify the composition and metabolic activity of human faecal microbiota in pH-controlled batch cultures. Int. J. Food Microbiol. 2009, 135, 260–267. [Google Scholar] [CrossRef] [PubMed] [Green Version]
- Rios-Covian, D.; Cuesta, I.; Alvarez-Buylla, J.R.; Ruas-Madiedo, P.; Gueimonde, M.; de Los Reyes-Gavilan, C.G. Bacteroides fragilis metabolises exopolysaccharides produced by bifidobacteria. BMC Microbiol. 2016, 16, 150. [Google Scholar] [CrossRef] [PubMed] [Green Version]
- Huerta-Cepas, J.; Forslund, K.; Coelho, L.P.; Szklarczyk, D.; Jensen, L.J.; von Mering, C.; Bork, P. Fast Genome-Wide Functional Annotation through Orthology Assignment by eggNOG-Mapper. Mol. Biol. Evol. 2017, 34, 2115–2122. [Google Scholar] [CrossRef] [PubMed] [Green Version]
- Bray, N.L.; Pimentel, H.; Melsted, P.; Pachter, L. Near-optimal probabilistic RNA-seq quantification. Nat. Biotechnol. 2016, 34, 525–527. [Google Scholar] [CrossRef]
- Love, M.I.; Huber, W.; Anders, S. Moderated estimation of fold change and dispersion for RNA-seq data with DESeq2. Genome Biol. 2014, 15, 550. [Google Scholar] [CrossRef] [Green Version]
- Yu, G.; Wang, L.G.; Han, Y.; He, Q.Y. clusterProfiler: An R package for comparing biological themes among gene clusters. OMICS 2012, 16, 284–287. [Google Scholar] [CrossRef]
- Aguirre, M.; Ramiro-Garcia, J.; Koenen, M.E.; Venema, K. To pool or not to pool? Impact of the use of individual and pooled fecal samples for in vitro fermentation studies. J. Microbiol. Methods 2014, 107, 1–7. [Google Scholar] [CrossRef]
- Cinquin, C.; Le Blay, G.; Fliss, I.; Lacroix, C. Immobilization of infant fecal microbiota and utilization in an in vitro colonic fermentation model. Microb. Ecol. 2004, 48, 128–138. [Google Scholar] [CrossRef] [Green Version]
- Gibson, G.R.; Wang, X. Enrichment of bifidobacteria from human gut contents by oligofructose using continuous culture. FEMS Microbiol. Lett. 1994, 118, 121–127. [Google Scholar] [CrossRef]
- Alcon-Giner, C.; Caim, S.; Mitra, S.; Ketskemety, J.; Wegmann, U.; Wain, J.; Belteki, G.; Clarke, P.; Hall, L.J. Optimisation of 16S rRNA gut microbiota profiling of extremely low birth weight infants. BMC Genom. 2017, 18, 841. [Google Scholar] [CrossRef] [Green Version]
- Elsholz, A.K.; Wacker, S.A.; Losick, R. Self-regulation of exopolysaccharide production in Bacillus subtilis by a tyrosine kinase. Genes Dev. 2014, 28, 1710–1720. [Google Scholar] [CrossRef] [PubMed] [Green Version]
- Maldonado-Gomez, M.X.; Martinez, I.; Bottacini, F.; O’Callaghan, A.; Ventura, M.; van Sinderen, D.; Hillmann, B.; Vangay, P.; Knights, D.; Hutkins, R.W.; et al. Stable Engraftment of Bifidobacterium longum AH1206 in the Human Gut Depends on Individualized Features of the Resident Microbiome. Cell Host Microbe 2016, 20, 515–526. [Google Scholar] [CrossRef] [PubMed] [Green Version]
- Salazar, N.; Gueimonde, M.; de Los Reyes-Gavilan, C.G.; Ruas-Madiedo, P. Exopolysaccharides Produced by Lactic Acid Bacteria and Bifidobacteria as Fermentable Substrates by the Intestinal Microbiota. Crit. Rev. Food Sci. Nutr. 2016, 56, 1440–1453. [Google Scholar] [CrossRef] [PubMed]
- Gibson, G.R.; Hutkins, R.; Sanders, M.E.; Prescott, S.L.; Reimer, R.A.; Salminen, S.J.; Scott, K.; Stanton, C.; Swanson, K.S.; Cani, P.D.; et al. Expert consensus document: The International Scientific Association for Probiotics and Prebiotics (ISAPP) consensus statement on the definition and scope of prebiotics. Nat. Rev. Gastroenterol. Hepatol. 2017, 14, 491–502. [Google Scholar] [CrossRef] [Green Version]
- Sheridan, P.O.; Martin, J.C.; Lawley, T.D.; Browne, H.P.; Harris, H.M.; Bernalier-Donadille, A.; Duncan, S.H.; O’Toole, P.W.; Scott, K.P.; Flint, H.J. Polysaccharide utilization loci and nutritional specialization in a dominant group of butyrate-producing human colonic Firmicutes. Microb. Genom. 2016, 2, e000043. [Google Scholar] [CrossRef]
- Tailford, L.E.; Crost, E.H.; Kavanaugh, D.; Juge, N. Mucin glycan foraging in the human gut microbiome. Front. Genet. 2015, 6, 81. [Google Scholar] [CrossRef] [Green Version]
- Crost, E.H.; Le Gall, G.; Laverde-Gomez, J.A.; Mukhopadhya, I.; Flint, H.J.; Juge, N. Mechanistic Insights Into the Cross-Feeding of Ruminococcus gnavus and Ruminococcus bromii on Host and Dietary Carbohydrates. Front. Microbiol. 2018, 9, 2558. [Google Scholar] [CrossRef] [Green Version]
- McDonald, J.A.; Fuentes, S.; Schroeter, K.; Heikamp-deJong, I.; Khursigara, C.M.; de Vos, W.M.; Allen-Vercoe, E. Simulating distal gut mucosal and luminal communities using packed-column biofilm reactors and an in vitro chemostat model. J. Microbiol. Methods 2015, 108, 36–44. [Google Scholar] [CrossRef]
- McDonald, J.A.; Schroeter, K.; Fuentes, S.; Heikamp-Dejong, I.; Khursigara, C.M.; de Vos, W.M.; Allen-Vercoe, E. Evaluation of microbial community reproducibility, stability and composition in a human distal gut chemostat model. J. Microbiol. Methods 2013, 95, 167–174. [Google Scholar] [CrossRef]
- Macfarlane, G.T.; Macfarlane, S.; Gibson, G.R. Validation of a Three-Stage Compound Continuous Culture System for Investigating the Effect of Retention Time on the Ecology and Metabolism of Bacteria in the Human Colon. Microb. Ecol. 1998, 35, 180–187. [Google Scholar] [CrossRef]
- Henson, M.A.; Phalak, P. Byproduct Cross Feeding and Community Stability in an In Silico Biofilm Model of the Gut Microbiome. Processes 2017, 5, 13. [Google Scholar] [CrossRef] [Green Version]
- D’Hoe, K.; Vet, S.; Faust, K.; Moens, F.; Falony, G.; Gonze, D.; Llorens-Rico, V.; Gelens, L.; Danckaert, J.; De Vuyst, L.; et al. Integrated culturing, modeling and transcriptomics uncovers complex interactions and emergent behavior in a three-species synthetic gut community. Elife 2018, 7, e37090. [Google Scholar] [CrossRef] [PubMed]
- Nishiyama, K.; Yamamoto, Y.; Sugiyama, M.; Takaki, T.; Urashima, T.; Fukiya, S.; Yokota, A.; Okada, N.; Mukai, T. Bifidobacterium bifidum Extracellular Sialidase Enhances Adhesion to the Mucosal Surface and Supports Carbohydrate Assimilation. MBio 2017, 8, 00928-17. [Google Scholar] [CrossRef] [PubMed] [Green Version]
- D’Souza, G.; Shitut, S.; Preussger, D.; Yousif, G.; Waschina, S.; Kost, C. Ecology and evolution of metabolic cross-feeding interactions in bacteria. Nat. Prod. Rep. 2018, 35, 455–488. [Google Scholar] [CrossRef] [PubMed] [Green Version]
- O’Neill, I.; Schofield, Z.; Hall, L.J. Exploring the role of the microbiota member Bifidobacterium in modulating immune-linked diseases. Emerg. Top. Life Sci. 2017, 1, 333–349. [Google Scholar]
- Zmora, N.; Suez, J.; Elinav, E. You are what you eat: Diet, health and the gut microbiota. Nat. Rev. Gastroenterol. Hepatol. 2019, 16, 35–56. [Google Scholar] [CrossRef] [PubMed]


© 2020 by the authors. Licensee MDPI, Basel, Switzerland. This article is an open access article distributed under the terms and conditions of the Creative Commons Attribution (CC BY) license (http://creativecommons.org/licenses/by/4.0/).
Share and Cite
Püngel, D.; Treveil, A.; Dalby, M.J.; Caim, S.; Colquhoun, I.J.; Booth, C.; Ketskemety, J.; Korcsmaros, T.; van Sinderen, D.; Lawson, M.A.; et al. Bifidobacterium breve UCC2003 Exopolysaccharide Modulates the Early Life Microbiota by Acting as a Potential Dietary Substrate. Nutrients 2020, 12, 948. https://doi.org/10.3390/nu12040948
Püngel D, Treveil A, Dalby MJ, Caim S, Colquhoun IJ, Booth C, Ketskemety J, Korcsmaros T, van Sinderen D, Lawson MA, et al. Bifidobacterium breve UCC2003 Exopolysaccharide Modulates the Early Life Microbiota by Acting as a Potential Dietary Substrate. Nutrients. 2020; 12(4):948. https://doi.org/10.3390/nu12040948
Chicago/Turabian StylePüngel, Deborah, Agatha Treveil, Matthew J Dalby, Shabhonam Caim, Ian J Colquhoun, Catherine Booth, Jennifer Ketskemety, Tamas Korcsmaros, Douwe van Sinderen, Melissa AE Lawson, and et al. 2020. "Bifidobacterium breve UCC2003 Exopolysaccharide Modulates the Early Life Microbiota by Acting as a Potential Dietary Substrate" Nutrients 12, no. 4: 948. https://doi.org/10.3390/nu12040948
APA StylePüngel, D., Treveil, A., Dalby, M. J., Caim, S., Colquhoun, I. J., Booth, C., Ketskemety, J., Korcsmaros, T., van Sinderen, D., Lawson, M. A., & Hall, L. J. (2020). Bifidobacterium breve UCC2003 Exopolysaccharide Modulates the Early Life Microbiota by Acting as a Potential Dietary Substrate. Nutrients, 12(4), 948. https://doi.org/10.3390/nu12040948