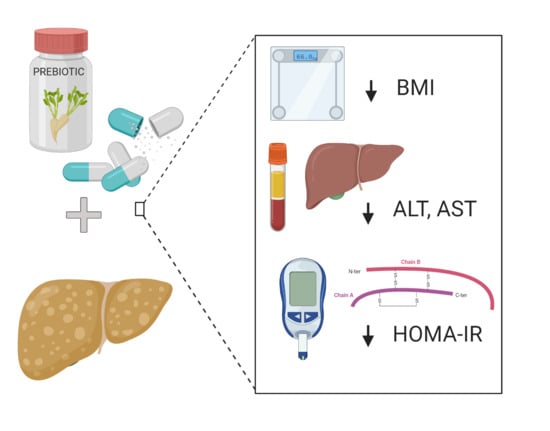
The Relationship between Prebiotic Supplementation and Anthropometric and Biochemical Parameters in Patients with NAFLD—A Systematic Review and Meta-Analysis of Randomized Controlled Trials

 ,
,  , ,
, ,  and
and 
Abstract
1. Introduction
2. Materials and Methods
2.1. Search Strategy and Inclusion Criteria
- (i)
- randomized controlled trial
- (ii)
- patients with confirmed NAFLD
- (iii)
- studies enrolling >20 patients
- (iv)
- treatment with prebiotic (soluble fiber or insoluble fiber) in the form of a supplement, e.g., pills, powder, etc.
- (v)
- randomization to prebiotic vs. placebo/other prebiotic/probiotic/synbiotic/no intervention (OPEN LABEL)
- (vi)
- studies reporting at least one of the following outcomes: available meta-analyzable change score/endpoint data on steatosis, alanine aminotransferase, aspartate aminotransferase, γ-glutamyltransferase, HOMA-IR, blood insulin level, blood glucose level, lipids profile (triglycerides, cholesterol, LDL-chol, HDL-chol), anthropometric data (BMI, weight, waist–hip ratio (WHR), percentage body fat (PBF), trunk mass bod fat (MBF), lean body mass (LBM), soft lean mass (SLM)).
2.2. Data Extraction
2.3. Outcomes
2.4. Data Synthesis and Statistical Analysis
2.5. Risk of Bias
3. Results
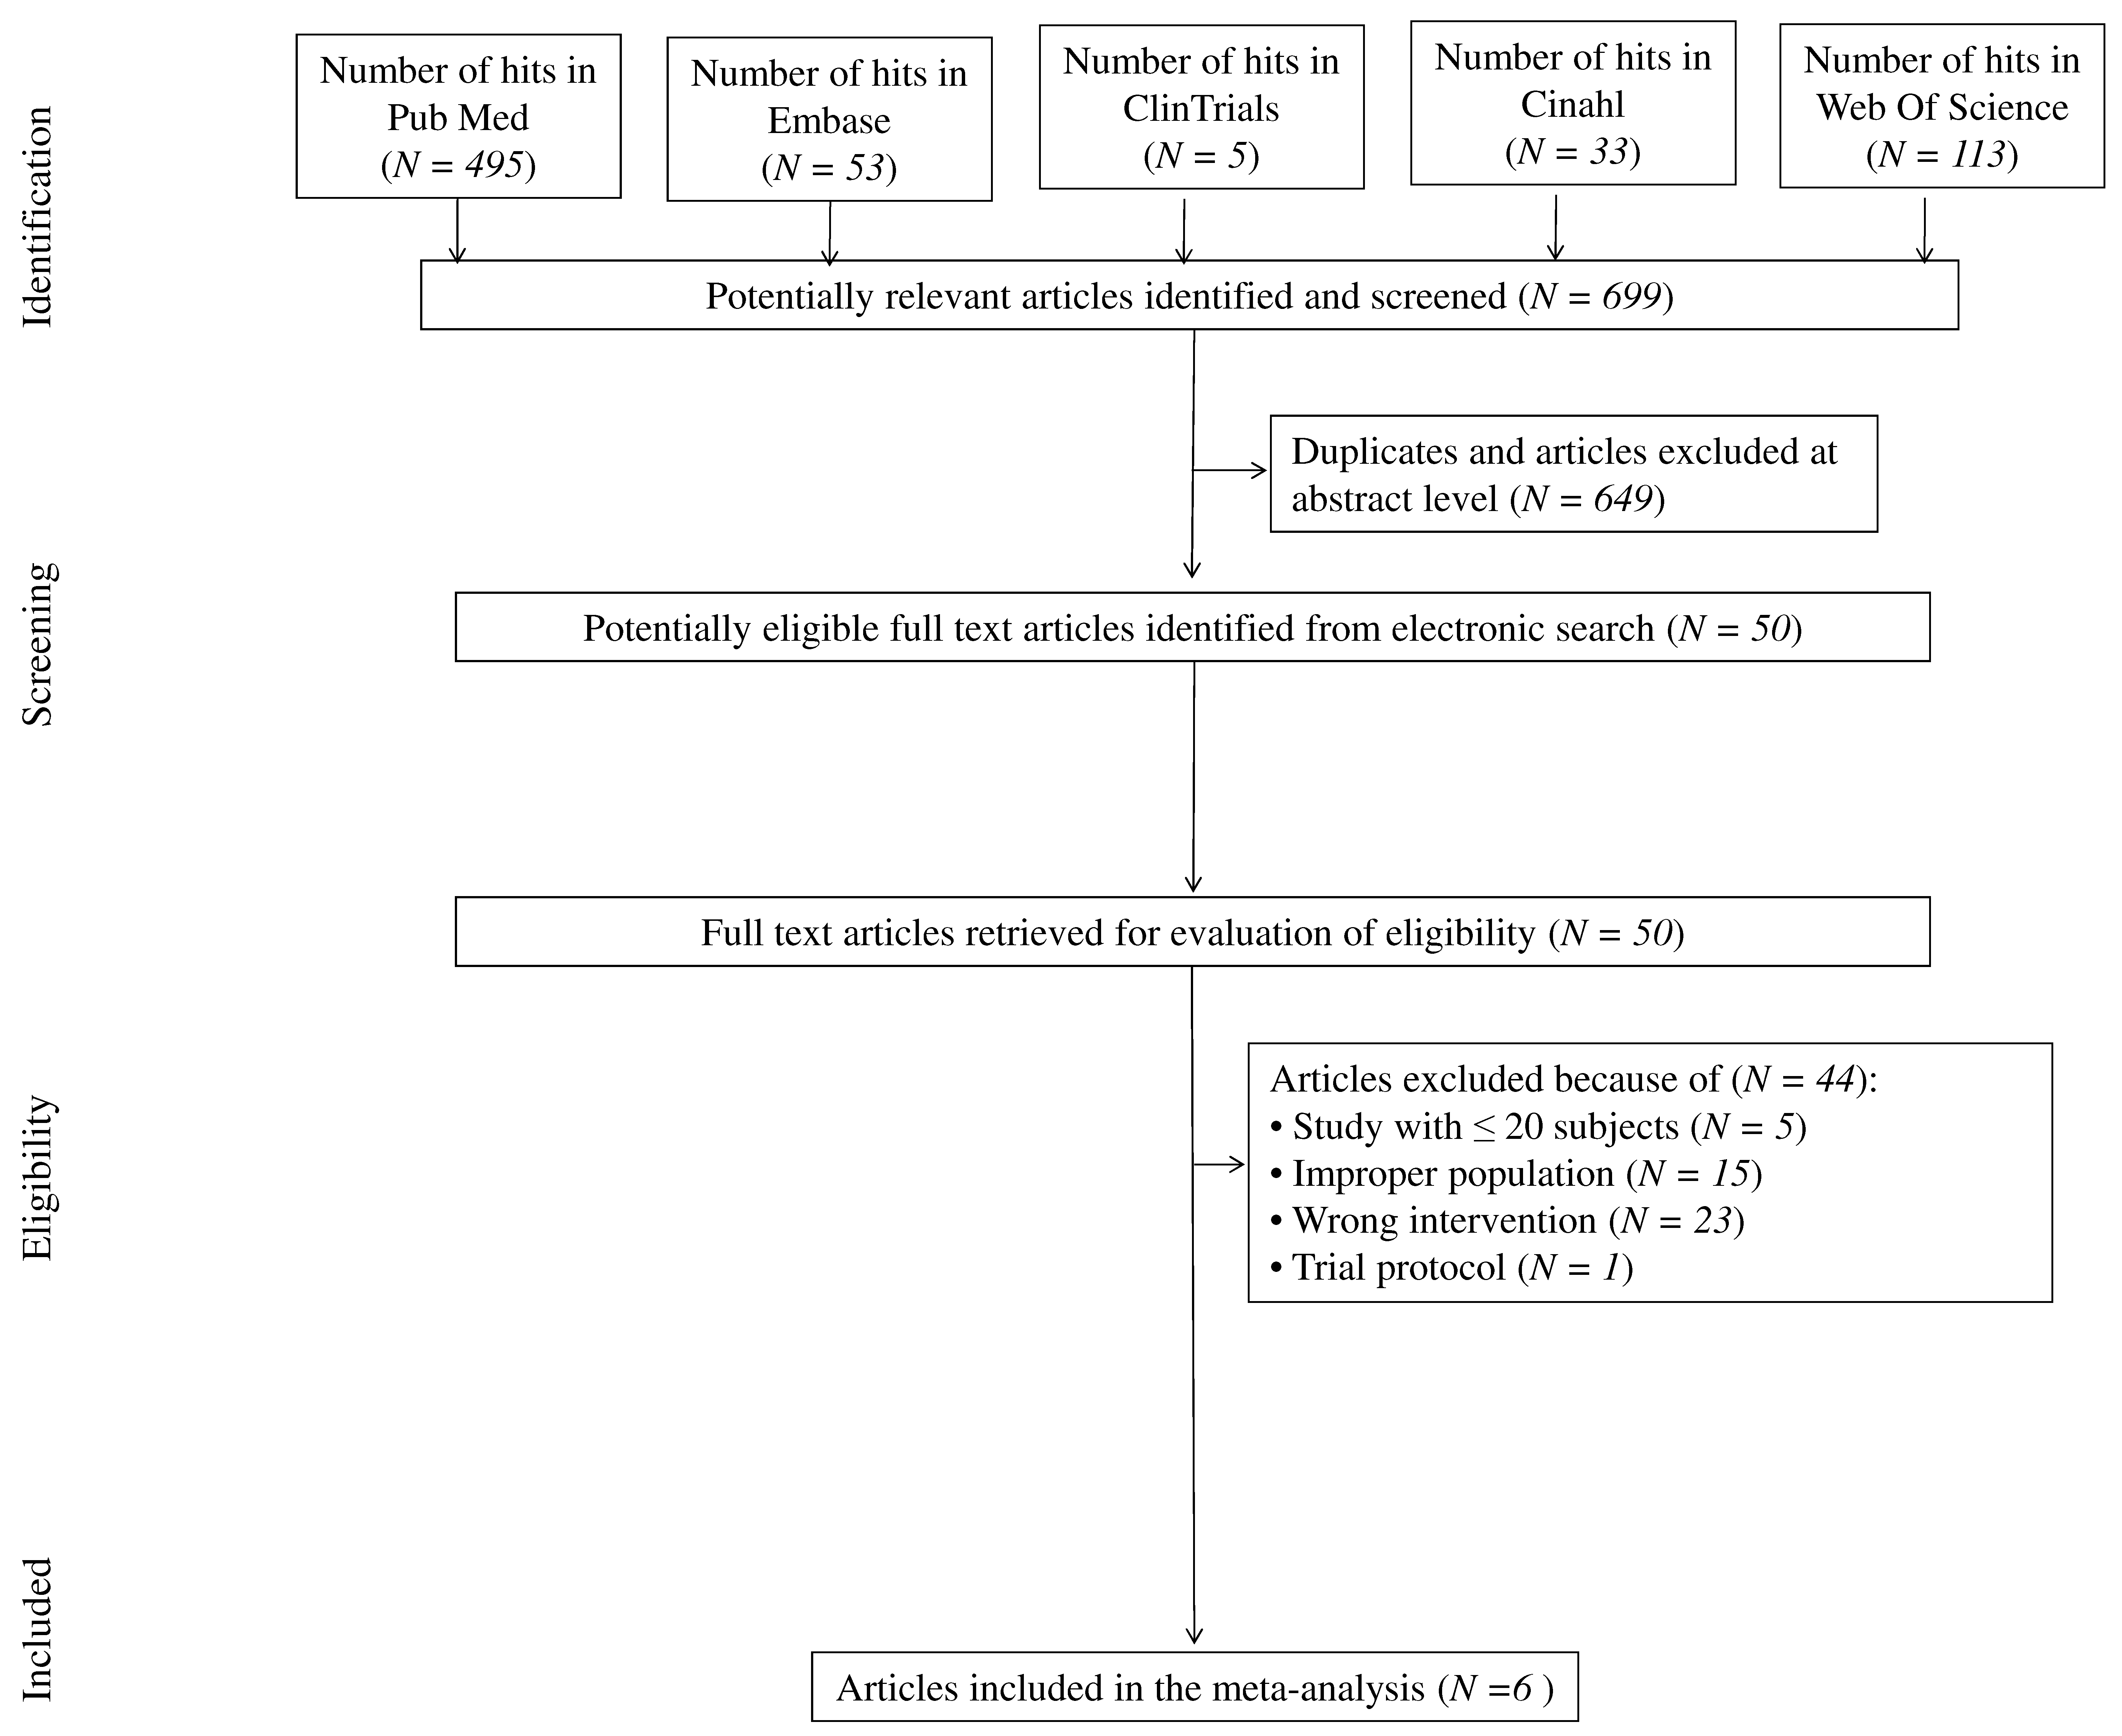
3.1. Search Results
3.2. Study, Patient and Treatment Characteristics
3.3. Risk of Bias
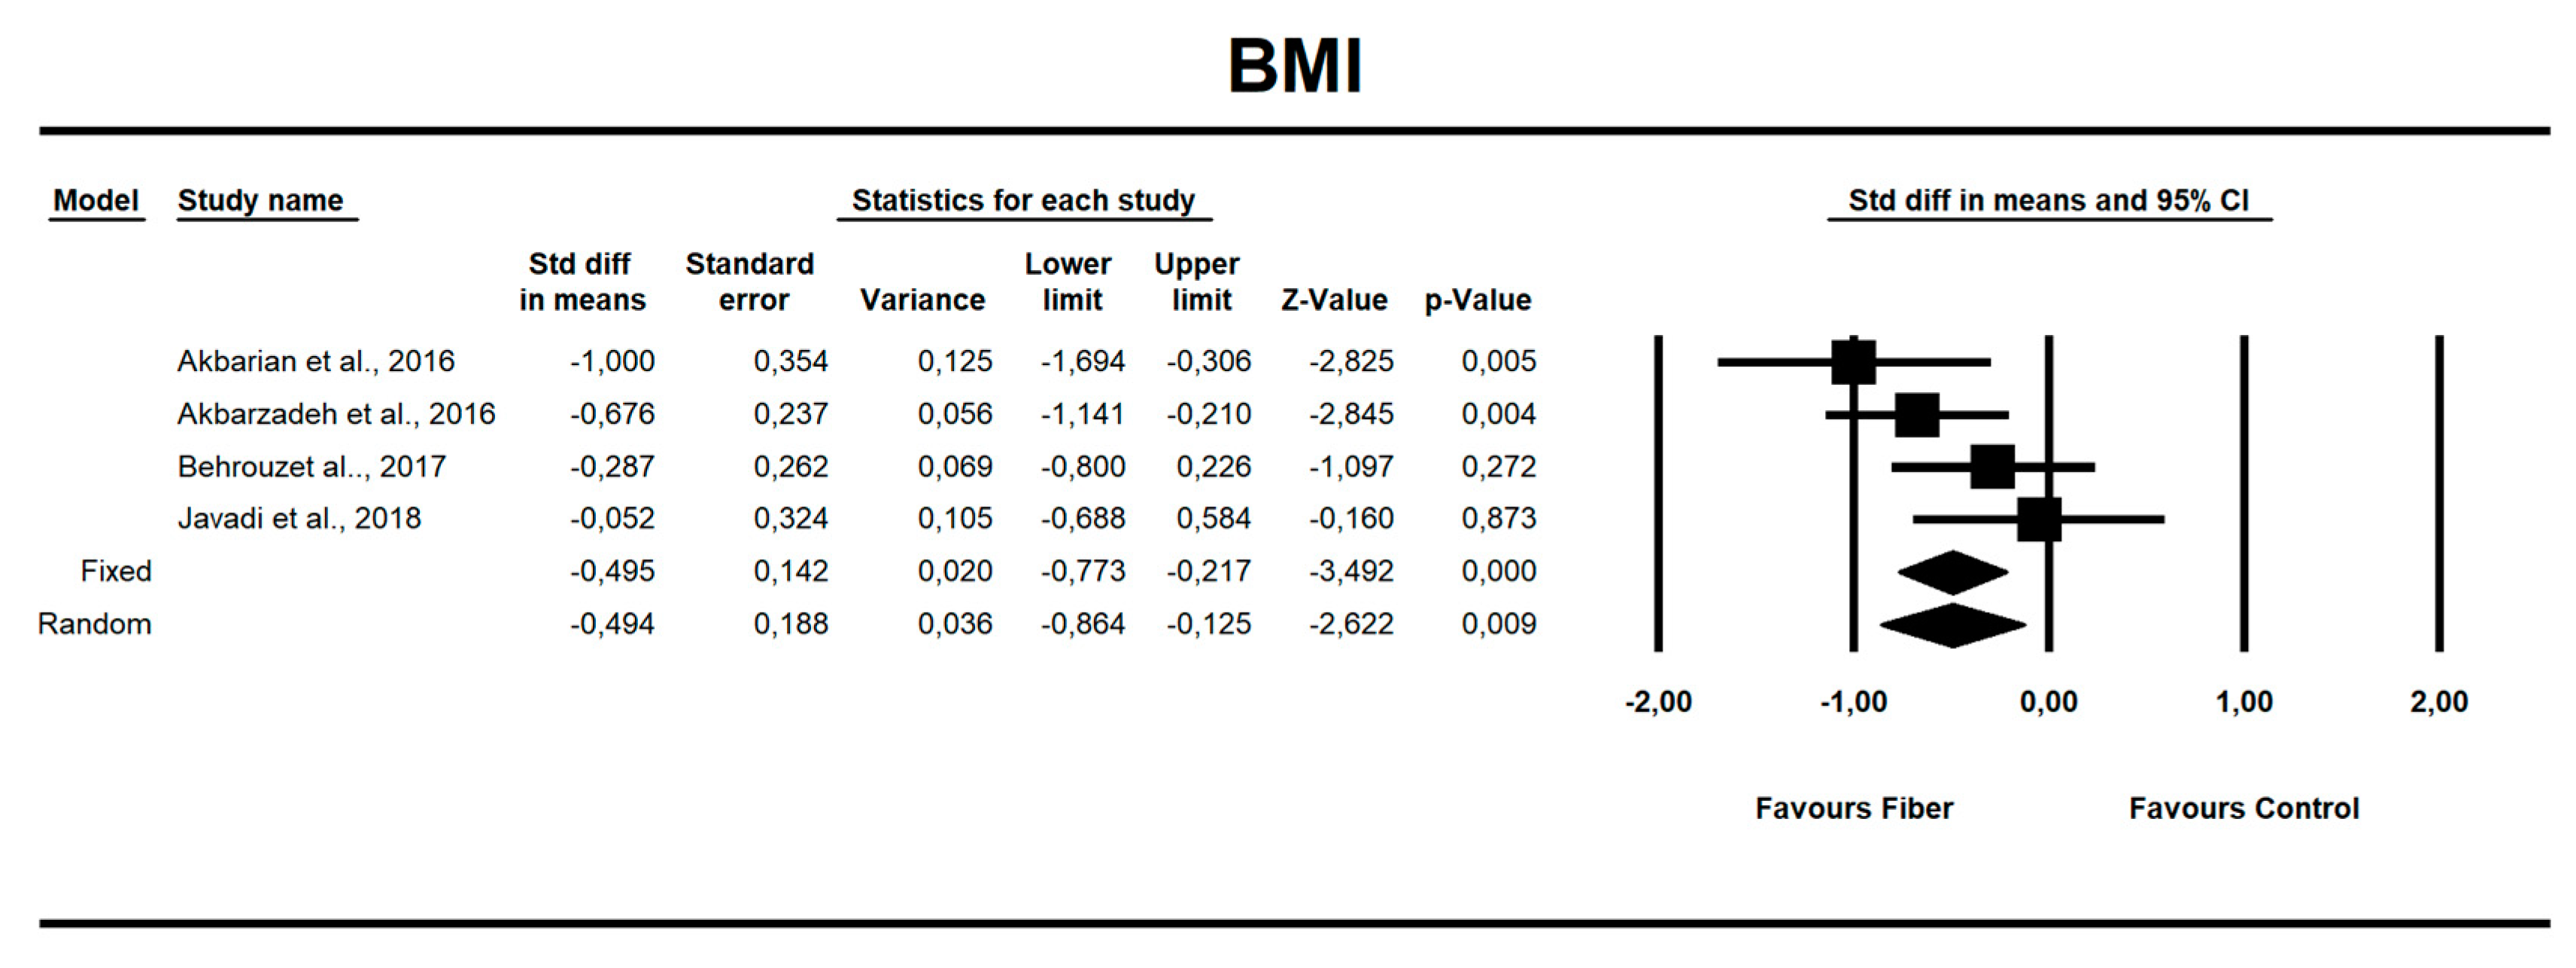
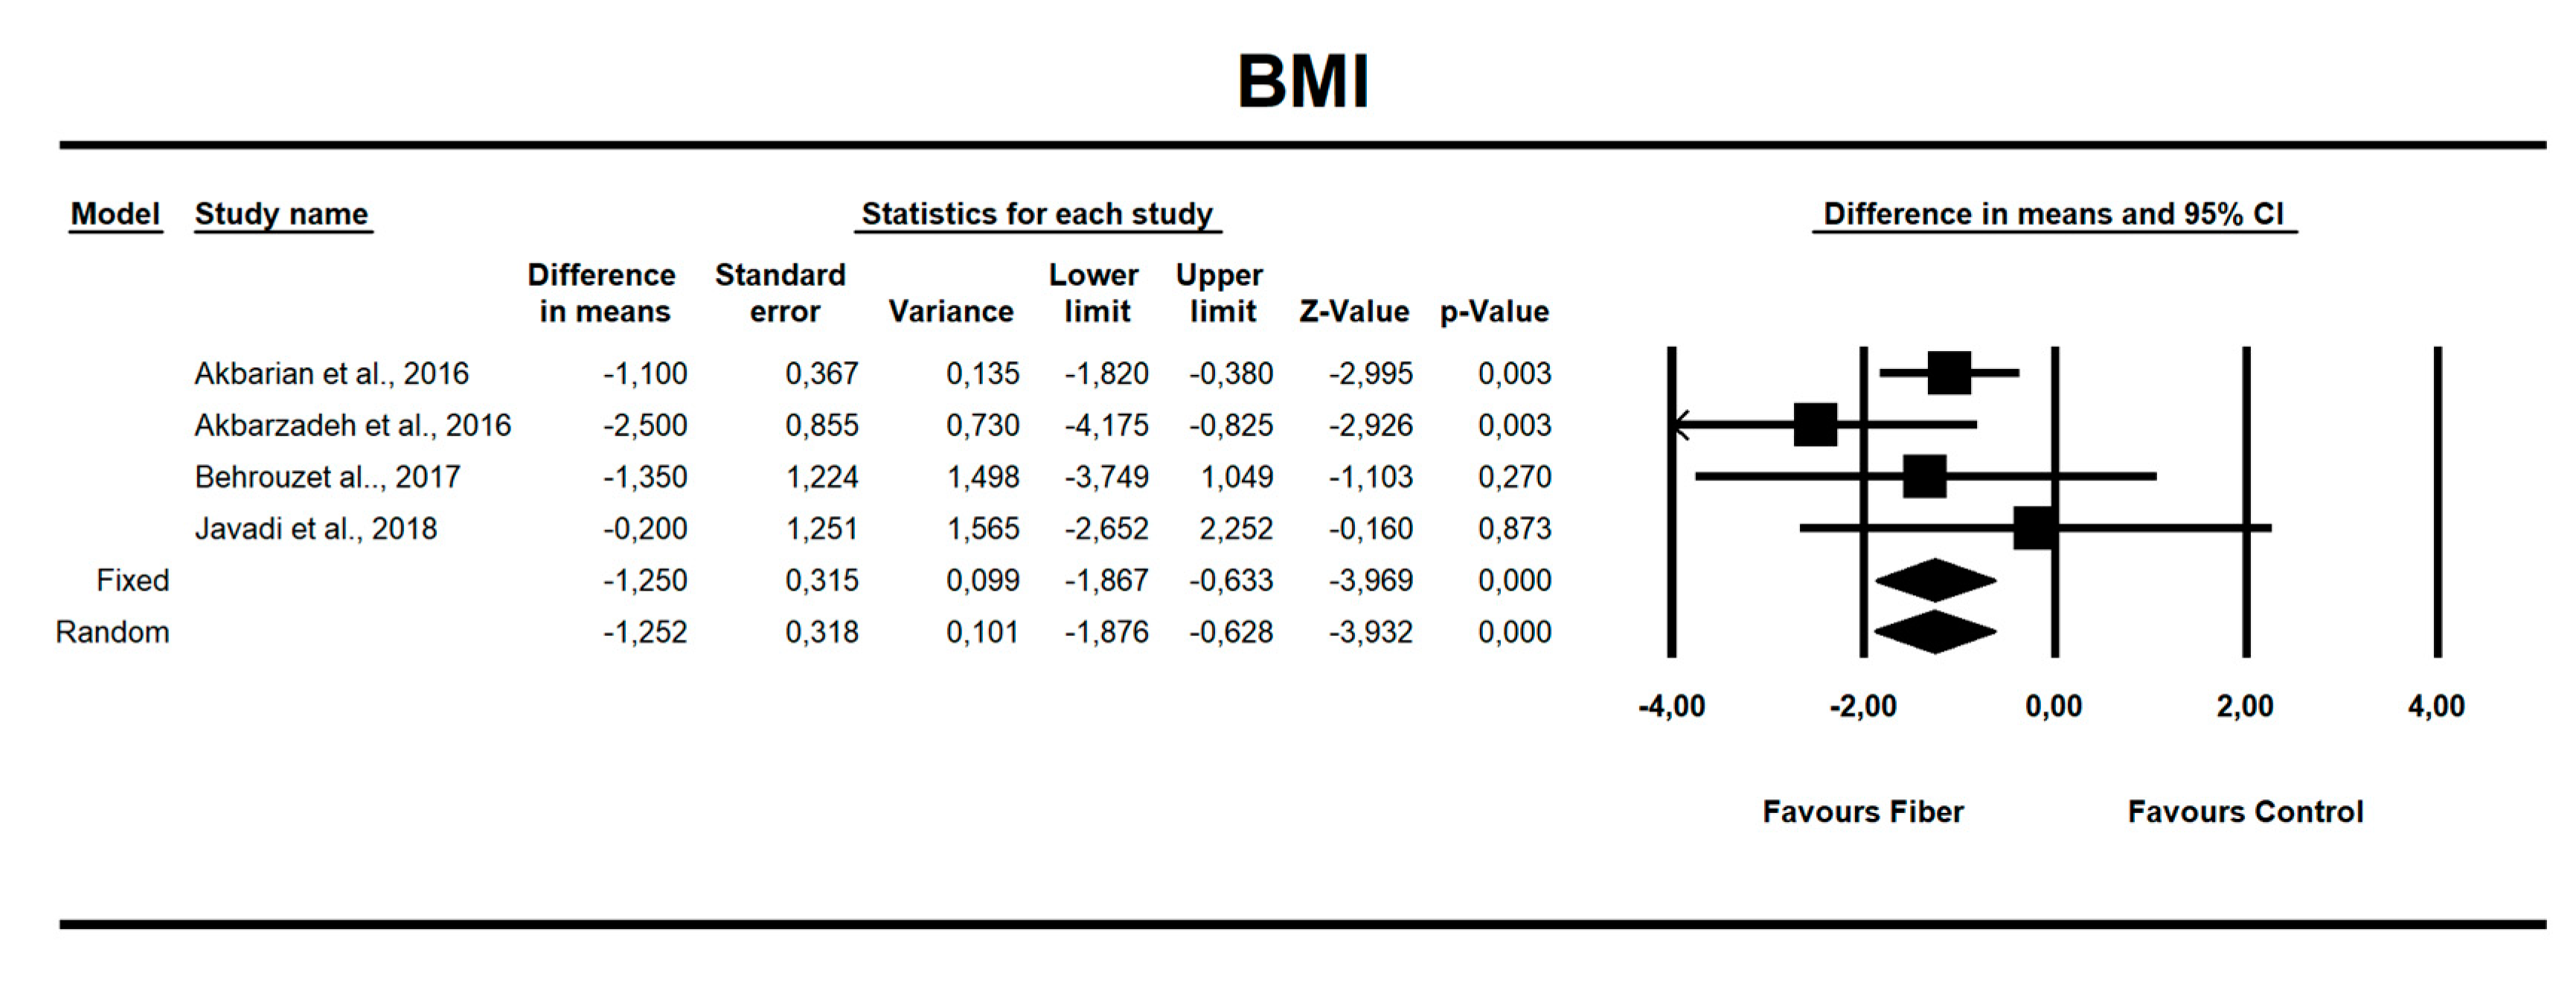
3.4. Fiber Effects on NAFLD-Related Parameters
4. Discussion
4.1. Body Mass Index
4.2. Glycemia
4.3. Hepatic Enzymes
5. Limitations
6. Conclusions
Supplementary Materials
Author Contributions
Funding
Conflicts of Interest
References
- Rinella, M.E. Nonalcoholic fatty liver disease: A systematic review. JAMA 2015, 313, 2263–2273. [Google Scholar] [CrossRef] [PubMed]
- Krawczyk, M.; Portincasa, P.; Lammert, F. PNPLA3-associated steatohepatitis: Toward a gene-based classification of fatty liver disease. Semin. Liver Dis. 2013, 33, 369–379. [Google Scholar] [CrossRef] [PubMed]
- Younossi, Z.M.; Koenig, A.B.; Abdelatif, D.; Fazel, Y.; Henry, L.; Wymer, M. Global epidemiology of nonalcoholic fatty liver disease-Meta-analytic assessment of prevalence, incidence, and outcomes. Hepatology 2016, 64, 73–84. [Google Scholar] [CrossRef] [PubMed]
- Mitra, S.; De, A.; Chowdhury, A. Epidemiology of non-alcoholic and alcoholic fatty liver diseases. Transl. Gastroenterol. Hepatol. 2020, 5. [Google Scholar] [CrossRef] [PubMed]
- El-Agroudy, N.N.; Kurzbach, A.; Rodionov, R.N.; O’Sullivan, J.; Roden, M.; Birkenfeld, A.L.; Pesta, D.H. Are Lifestyle Therapies Effective for NAFLD Treatment? Trends Endocrinol. Metab. 2019, 30, 701–709. [Google Scholar] [CrossRef] [PubMed]
- Molina-Molina, E.; Baccetto, R.L.; Wang, D.Q.-H.; de Bari, O.; Krawczyk, M.; Portincasa, P. Exercising the hepatobiliary-gut axis. The impact of physical activity performance. Eur. J. Clin. Investig. 2018, 48, e12958. [Google Scholar] [CrossRef]
- Molina-Molina, E.; Krawczyk, M.; Stachowska, E.; Lammert, F.; Portincasa, P. Non-alcoholic fatty liver disease in non-obese individuals: Prevalence, pathogenesis and treatment. Clin. Res. Hepatol. Gastroenterol. 2019, 43, 638–645. [Google Scholar] [CrossRef] [PubMed]
- Lichtman, S.N.; Keku, J.; Schwab, J.H.; Sartor, R.B. Hepatic injury associated with small bowel bacterial overgrowth in rats is prevented by metronidazole and tetracycline. Gastroenterology 1991, 100, 513–519. [Google Scholar] [CrossRef]
- Musso, G.; Cassader, M.; Rosina, F.; Gambino, R. Impact of current treatments on liver disease, glucose metabolism and cardiovascular risk in non-alcoholic fatty liver disease (NAFLD): A systematic review and meta-analysis of randomised trials. Diabetologia 2012, 55, 885–904. [Google Scholar] [CrossRef]
- Chalasani, N.; Younossi, Z.; Lavine, J.E.; Charlton, M.; Cusi, K.; Rinella, M.; Harrison, S.A.; Brunt, E.M.; Sanyal, A.J. The diagnosis and management of nonalcoholic fatty liver disease: Practice guidance from the American Association for the Study of Liver Diseases. Hepatology 2018, 67, 328–357. [Google Scholar] [CrossRef]
- Kirk, E.; Reeds, D.N.; Finck, B.N.; Mayurranjan, S.M.; Mayurranjan, M.S.; Patterson, B.W.; Klein, S. Dietary fat and carbohydrates differentially alter insulin sensitivity during caloric restriction. Gastroenterology 2009, 136, 1552–1560. [Google Scholar] [CrossRef] [PubMed]
- Haufe, S.; Engeli, S.; Kast, P.; Böhnke, J.; Utz, W.; Haas, V.; Hermsdorf, M.; Mähler, A.; Wiesner, S.; Birkenfeld, A.L.; et al. Randomized comparison of reduced fat and reduced carbohydrate hypocaloric diets on intrahepatic fat in overweight and obese human subjects. Hepatology 2011, 53, 1504–1514. [Google Scholar] [CrossRef] [PubMed]
- Anania, C.; Perla, F.M.; Olivero, F.; Pacifico, L.; Chiesa, C. Mediterranean diet and nonalcoholic fatty liver disease. World J. Gastroenterol. 2018, 24, 2083–2094. [Google Scholar] [CrossRef] [PubMed]
- Mantzioris, E.; Villani, A. Translation of a Mediterranean-Style Diet into the Australian Dietary Guidelines: A Nutritional, Ecological and Environmental Perspective. Nutrients 2019, 11, 2507. [Google Scholar] [CrossRef] [PubMed]
- Abenavoli, L.; Di Renzo, L.; Boccuto, L.; Alwardat, N.; Gratteri, S.; De Lorenzo, A. Health benefits of Mediterranean diet in nonalcoholic fatty liver disease. Expert Rev. Gastroenterol. Hepatol. 2018, 12, 873–881. [Google Scholar] [CrossRef]
- Guarino, M.P.L.; Altomare, A.; Emerenziani, S.; Di Rosa, C.; Ribolsi, M.; Balestrieri, P.; Iovino, P.; Rocchi, G.; Cicala, M. Mechanisms of action of prebiotics and their effects on gastro-intestinal disorders in adults. Nutrients 2020, 12, 1037. [Google Scholar] [CrossRef] [PubMed]
- Rebello, C.J.; O’Neil, C.E.; Greenway, F.L. Dietary fiber and satiety: The effects of oats on satiety. Nutr. Rev. 2016, 74, 131–147. [Google Scholar] [CrossRef]
- Ye, Z.; Arumugam, V.; Haugabrooks, E.; Williamson, P.; Hendrich, S. Soluble dietary fiber (Fibersol-2) decreased hunger and increased satiety hormones in humans when ingested with a meal. Nutr. Res. 2015, 35, 393–400. [Google Scholar] [CrossRef]
- Reverri, E.J.; Randolph, J.M.; Kappagoda, C.T.; Park, E.; Edirisinghe, I.; Burton-Freeman, B.M. Assessing beans as a source of intrinsic fiber on satiety in men and women with metabolic syndrome. Appetite 2017, 118, 75–81. [Google Scholar] [CrossRef]
- Makki, K.; Deehan, E.C.; Walter, J.; Bäckhed, F. The impact of dietary fiber on gut microbiota in host health and disease. Cell Host Microbe 2018, 23, 705–715. [Google Scholar] [CrossRef]
- Howarth, N.C.; Saltzman, E.; Roberts, S.B. Dietary fiber and weight regulation. Nutr. Rev. 2001, 59, 129–139. [Google Scholar] [CrossRef]
- Delzenne, N.M.; Olivares, M.; Neyrinck, A.M.; Beaumont, M.; Kjølbæk, L.; Larsen, T.M.; Benítez-Páez, A.; Romaní-Pérez, M.; Garcia-Campayo, V.; Bosscher, D.; et al. Nutritional interest of dietary fiber and prebiotics in obesity: Lessons from the MyNewGut consortium. Clin. Nutr. 2020, 39, 414–424. [Google Scholar] [CrossRef] [PubMed]
- De Angelis, M.; Garruti, G.; Minervini, F.; Bonfrate, L.; Portincasa, P.; Gobbetti, M. The Food-gut Human Axis: The effects of diet on gut microbiota and metabolome. Curr. Med. Chem. 2019, 26, 3567–3583. [Google Scholar] [CrossRef] [PubMed]
- Elleuch, M.; Bedigian, D.; Roiseux, O.; Besbes, S.; Blecker, C.; Attia, H. Dietary fibre and fibre-rich by-products of food processing: Characterisation, technological functionality and commercial applications: A review. Food Chem. 2011, 124, 411–421. [Google Scholar] [CrossRef]
- Holscher, H.D. Dietary fiber and prebiotics and the gastrointestinal microbiota. Gut Microbes 2017, 8, 172–184. [Google Scholar] [CrossRef]
- King, D.E.; Mainous, A.G.; Lambourne, C.A. Trends in dietary fiber intake in the United States, 1999–2008. J. Acad. Nutr. Diet. 2012, 112, 642–648. [Google Scholar] [CrossRef]
- EFSA Panel on Dietetic Products, Nutrition, and Allergies (NDA). Scientific Opinion on Dietary Reference Values for carbohydrates and dietary fibre. EFSA J. 2010, 8, 1462. [Google Scholar] [CrossRef]
- Dominguez, L.J.; Bes-Rastrollo, M.; Toledo, E.; Gea, A.; Fresán, U.; Barbagallo, M.; Martínez-González, M.A. Dietary fiber intake and mortality in a Mediterranean population: The “Seguimiento Universidad de Navarra” (SUN) project. Eur. J. Nutr. 2019, 58, 3009–3022. [Google Scholar] [CrossRef]
- Slavin, J.L. Position of the American Dietetic Association: Health implications of dietary fiber. J. Am. Diet. Assoc. 2008, 108, 1716–1731. [Google Scholar] [CrossRef]
- Loman, B.R.; Hernández-Saavedra, D.; An, R.; Rector, R.S. Prebiotic and probiotic treatment of nonalcoholic fatty liver disease: A systematic review and meta-analysis. Nutr. Rev. 2018, 76, 822–839. [Google Scholar] [CrossRef]
- Tarantino, G.; Finelli, C. Systematic review on intervention with prebiotics/probiotics in patients with obesity-related nonalcoholic fatty liver disease. Future Microbiol. 2015, 10, 889–902. [Google Scholar] [CrossRef] [PubMed]
- Buss, C.; Valle-Tovo, C.; Miozzo, S.; Alves de Mattos, A. Probiotics and synbiotics may improve liver aminotransferases levels in non-alcoholic fatty liver disease patients. Ann. Hepatol. 2014, 13, 482–488. [Google Scholar] [CrossRef]
- Vajro, P.; Lenta, S.; Pignata, C.; Salerno, M.; D’Aniello, R.; De Micco, I.; Paolella, G.; Parenti, G. Therapeutic options in pediatric non alcoholic fatty liver disease: Current status and future directions. Ital. J. Pediatr. 2012, 38, 55. [Google Scholar] [CrossRef] [PubMed]
- PRISMA. Available online: http://www.prisma-statement.org/Protocols/ (accessed on 19 March 2020).
- Akbarian, S.-A.; Asgary, S.; Feizi, A.; Iraj, B.; Askari, G. Comparative Study on the Effect of Plantago psyllium and Ocimum basilicum Seeds on Anthropometric Measures in Nonalcoholic Fatty Liver Patients. Int. J. Prev. Med. 2016, 7, 114. [Google Scholar] [CrossRef] [PubMed]
- PRISMA. Available online: http://www.prisma-statement.org/ (accessed on 23 October 2019).
- Akbarzadeh, Z.; Nourian, M.; Askari, G.; Maracy, M.R. The effect of Psyllium on body composition measurements and liver enzymes in overweight or obese adults with nonalcoholic fatty liver disease (NAFLD). Int. J. Adv. Biotechnol. Res. 2016, 7, 1545–1554. [Google Scholar]
- Behrouz, V.; Jazayeri, S.; Aryaeian, N.; Zahedi, M.J.; Hosseini, F. Effects of probiotic and prebiotic supplementation on leptin, adiponectin, and glycemic parameters in non-alcoholic fatty liver disease: A randomized clinical trial. Middle East. J. Dig. Dis. 2017, 9, 150–157. [Google Scholar] [CrossRef]
- Javadi, L.; Khoshbaten, M.; Safaiyan, A.; Ghavami, M.; Abbasi, M.M.; Gargari, B.P. Pro- and prebiotic effects on oxidative stress and inflammatory markers in non-alcoholic fatty liver disease. Asia Pac. J. Clin. Nutr. 2018, 27, 1031–1039. [Google Scholar] [CrossRef]
- Javadi, L.; Ghavami, M.; Khoshbaten, M.; Safaiyan, A.; Barzegari, A.; Pourghassem Gargari, B. The effect of probiotic and/or prebiotic on liver function tests in patients with nonalcoholic fatty liver disease: A double blind randomized clinical trial. Iran. Red Crescent Med. J. 2017, 19. [Google Scholar] [CrossRef]
- Javadi, L.; Ghavami, M.; Khoshbaten, M.; Safaiyan, A.; Barzegari, A.; Gargari, B.P. The potential role of probiotics or/and prebiotic on serum lipid profile and insulin resistance in non-alcoholic fatty liver disease: A double blind randomized clinical trial (vol 4, pg 131, 2017). Crescent J. Med. Biol. Sci. 2018, 5, 69. [Google Scholar]
- DerSimonian, R.; Laird, N. Meta-analysis in clinical trials. Control. Clin. Trials 1986, 7, 177–188. [Google Scholar] [CrossRef]
- Egger, M.; Davey Smith, G.; Schneider, M.; Minder, C. Bias in meta-analysis detected by a simple, graphical test. BMJ 1997, 315, 629–634. [Google Scholar] [CrossRef] [PubMed]
- Higgins, J.P.T.; Altman, D.G.; Gøtzsche, P.C.; Jüni, P.; Moher, D.; Oxman, A.D.; Savovic, J.; Schulz, K.F.; Weeks, L.; Sterne, J.A.C.; et al. The Cochrane Collaboration’s tool for assessing risk of bias in randomised trials. BMJ 2011, 343, d5928. [Google Scholar] [CrossRef] [PubMed]
- Kunnackal John, G.; Wang, L.; Nanavati, J.; Twose, C.; Singh, R.; Mullin, G. Dietary alteration of the gut microbiome and its impact on weight and fat mass: A systematic review and meta-analysis. Genes 2018, 9, 167. [Google Scholar] [CrossRef] [PubMed]
- Rahmani, J.; Miri, A.; Černevičiūtė, R.; Thompson, J.; de Souza, N.N.; Sultana, R.; Kord Varkaneh, H.; Mousavi, S.M.; Hekmatdoost, A. Effects of cereal beta-glucan consumption on body weight, body mass index, waist circumference and total energy intake: A meta-analysis of randomized controlled trials. Complement. Ther. Med. 2019, 43, 131–139. [Google Scholar] [CrossRef]
- Reynolds, A.N.; Akerman, A.P.; Mann, J. Dietary fibre and whole grains in diabetes management: Systematic review and meta-analyses. PLoS Med. 2020, 17, e1003053. [Google Scholar] [CrossRef]
- Thompson, S.V.; Hannon, B.A.; An, R.; Holscher, H.D. Effects of isolated soluble fiber supplementation on body weight, glycemia, and insulinemia in adults with overweight and obesity: A systematic review and meta-analysis of randomized controlled trials. Am. J. Clin. Nutr. 2017, 106, 1514–1528. [Google Scholar] [CrossRef]
- Bäckhed, F.; Ding, H.; Wang, T.; Hooper, L.V.; Koh, G.Y.; Nagy, A.; Semenkovich, C.F.; Gordon, J.I. The gut microbiota as an environmental factor that regulates fat storage. Proc. Natl. Acad. Sci. USA 2004, 101, 15718–15723. [Google Scholar] [CrossRef]
- Hendrikx, T.; Schnabl, B. Antimicrobial proteins: Intestinal guards to protect against liver disease. J. Gastroenterol. 2019, 54, 209–217. [Google Scholar] [CrossRef]
- Ghetti, F.D.F.; De Oliveira, D.G.; De Oliveira, J.M.; de Castro Ferreira, L.E.; Cesar, D.E.; Moreira, A.P.B. Effects of dietary intervention on gut microbiota and metabolic-nutritional profile of outpatients with non-alcoholic steatohepatitis: A randomized clinical trial. J. Gastrointest. Liver Dis. 2019, 28, 279–287. [Google Scholar] [CrossRef]
- Kobyliak, N.; Abenavoli, L.; Mykhalchyshyn, G.; Kononenko, L.; Boccuto, L.; Kyriienko, D.; Dynnyk, O. A multi-strain probiotic reduces the fatty liver index, cytokines and aminotransferase levels in NAFLD patients: Evidence from a randomized clinical trial. J. Gastrointest. Liver Dis. 2018, 27, 41–49. [Google Scholar] [CrossRef]
- Di Palo, D.M.; Garruti, G.; Di Ciaula, A.; Molina-Molina, E.; Shanmugam, H.; De Angelis, M.; Portincasa, P. Increased colonic permeability and lifestyles as contributing factors to obesity and liver steatosis. Nutrients 2020, 12, 564. [Google Scholar] [CrossRef] [PubMed]
- Di Ciaula, A.; Baj, J.; Garruti, G.; Celano, G.; De Angelis, M.; Wang, H.H.; Di Palo, D.M.; Bonfrate, L.; Wang, D.Q.-H.; Portincasa, P. Liver steatosis, gut-liver axis, microbiome and environmental factors. A never-ending bidirectional cross-talk. J. Clin. Med. 2020, 9, 2648. [Google Scholar] [CrossRef] [PubMed]
- Flint, A.; Raben, A.; Astrup, A.; Holst, J.J. Glucagon-like peptide 1 promotes satiety and suppresses energy intake in humans. J. Clin. Investig. 1998, 101, 515–520. [Google Scholar] [CrossRef] [PubMed]
- Mandard, S.; Zandbergen, F.; van Straten, E.; Wahli, W.; Kuipers, F.; Müller, M.; Kersten, S. The fasting-induced adipose factor/angiopoietin-like protein 4 is physically associated with lipoproteins and governs plasma lipid levels and adiposity. J. Biol. Chem. 2006, 281, 934–944. [Google Scholar] [CrossRef]
- Turnbull, W.H.; Thomas, H.G. The effect of a Plantago ovata seed containing preparation on appetite variables, nutrient and energy intake. Int. J. Obes. Relat. Metab. Disord. 1995, 19, 338–342. [Google Scholar]
- Seinelä, L.; Sairanen, U.; Laine, T.; Kurl, S.; Pettersson, T.; Happonen, P. Comparison of polyethylene glycol with and without electrolytes in the treatment of constipation in elderly institutionalized patients: A randomized, double-blind, parallel-group study. Drugs Aging 2009, 26, 703–713. [Google Scholar] [CrossRef]
- Solà, R.; Godàs, G.; Ribalta, J.; Vallvé, J.-C.; Girona, J.; Anguera, A.; Ostos, M.; Recalde, D.; Salazar, J.; Caslake, M.; et al. Effects of soluble fiber (Plantago ovata husk) on plasma lipids, lipoproteins, and apolipoproteins in men with ischemic heart disease. Am. J. Clin. Nutr. 2007, 85, 1157–1163. [Google Scholar] [CrossRef]
- Cicero, A.F.G.; Colletti, A.; Bajraktari, G.; Descamps, O.; Djuric, D.M.; Ezhov, M.; Fras, Z.; Katsiki, N.; Langlois, M.; Latkovskis, G.; et al. Lipid lowering nutraceuticals in clinical practice: Position paper from an International Lipid Expert Panel. Arch. Med. Sci. 2017, 13, 965–1005. [Google Scholar] [CrossRef]
- Kamalpour, M.; Ghalandari, H.; Nasrollahzadeh, J. Short-term supplementation of a moderate carbohydrate diet with psyllium reduces fasting plasma insulin and tumor necrosis factor-α in patients with type 2 diabetes mellitus. J. Diet. Suppl. 2018, 15, 507–515. [Google Scholar] [CrossRef]
- Anderson, J.W.; Zettwoch, N.; Feldman, T.; Tietyen-Clark, J.; Oeltgen, P.; Bishop, C.W. Cholesterol-lowering effects of psyllium hydrophilic mucilloid for hypercholesterolemic men. Arch. Intern. Med. 1988, 148, 292–296. [Google Scholar] [CrossRef]
- Buddington, R.K.; Kapadia, C.; Neumer, F.; Theis, S. Oligofructose provides laxation for irregularity associated with low fiber intake. Nutrients 2017, 9, 1372. [Google Scholar] [CrossRef] [PubMed]
- Pol, K.; de Graaf, C.; Meyer, D.; Mars, M. The efficacy of daily snack replacement with oligofructose-enriched granola bars in overweight and obese adults: A 12-week randomised controlled trial. Br. J. Nutr. 2018, 119, 1076–1086. [Google Scholar] [CrossRef] [PubMed]
- Lightowler, H.; Thondre, S.; Holz, A.; Theis, S. Replacement of glycaemic carbohydrates by inulin-type fructans from chicory (oligofructose, inulin) reduces the postprandial blood glucose and insulin response to foods: Report of two double-blind, randomized, controlled trials. Eur. J. Nutr. 2018, 57, 1259–1268. [Google Scholar] [CrossRef] [PubMed]
- Verhoef, S.P.M.; Meyer, D.; Westerterp, K.R. Effects of oligofructose on appetite profile, glucagon-like peptide 1 and peptide YY3-36 concentrations and energy intake. Br. J. Nutr. 2011, 106, 1757–1762. [Google Scholar] [CrossRef] [PubMed]
- Rao, M.; Gao, C.; Xu, L.; Jiang, L.; Zhu, J.; Chen, G.; Law, B.Y.K.; Xu, Y. Effect of inulin-type carbohydrates on insulin resistance in patients with type 2 diabetes and obesity: A systematic review and meta-analysis. J. Diabetes Res. 2019, 2019, 5101423. [Google Scholar] [CrossRef]
- Liu, F.; Prabhakar, M.; Ju, J.; Long, H.; Zhou, H.-W. Effect of inulin-type fructans on blood lipid profile and glucose level: A systematic review and meta-analysis of randomized controlled trials. Eur. J. Clin. Nutr. 2017, 71, 9–20. [Google Scholar] [CrossRef]
- Brighenti, F. Dietary fructans and serum triacylglycerols: A meta-analysis of randomized controlled trials. J. Nutr. 2007, 137, 2552S–2556S. [Google Scholar] [CrossRef]
- Collado Yurrita, L.; San Mauro Martín, I.; Ciudad-Cabañas, M.J.; Calle-Purón, M.E.; Hernández Cabria, M. Effectiveness of inulin intake on indicators of chronic constipation; a meta-analysis of controlled randomized clinical trials. Nutr. Hosp. 2014, 30, 244–252. [Google Scholar] [CrossRef]
- Jovanovski, E.; Khayyat, R.; Zurbau, A.; Komishon, A.; Mazhar, N.; Sievenpiper, J.L.; Blanco Mejia, S.; Ho, H.V.T.; Li, D.; Jenkins, A.L.; et al. Should viscous fiber supplements be considered in diabetes control? results from a systematic review and meta-analysis of randomized controlled trials. Diabetes Care 2019, 42, 755–766. [Google Scholar] [CrossRef]
- He, L.; Zhao, J.; Huang, Y.; Li, Y. The difference between oats and beta-glucan extract intake in the management of HbA1c, fasting glucose and insulin sensitivity: A meta-analysis of randomized controlled trials. Food Funct. 2016, 7, 1413–1428. [Google Scholar] [CrossRef]
- Behrouz, V.; Aryaeian, N.; Zahedi, M.J.; Jazayeri, S. Effects of probiotic and prebiotic supplementation on metabolic parameters, liver aminotransferases, and systemic inflammation in nonalcoholic fatty liver disease: A randomized clinical trial. J. Food Sci. 2020. [Google Scholar] [CrossRef] [PubMed]
- Jeznach-Steinhagen, A.; Ostrowska, J.; Czerwonogrodzka-Senczyna, A.; Boniecka, I.; Shahnazaryan, U.; Kuryłowicz, A. Dietary and pharmacological treatment of nonalcoholic fatty liver disease. Medicina 2019, 55, 166. [Google Scholar] [CrossRef] [PubMed]


| No | Study Characteristics (First Author, Year, Country) | Study Design | Intervention | Patient Characteristics | Dietary Habits | |||||||||
|---|---|---|---|---|---|---|---|---|---|---|---|---|---|---|
| Blinding/ ROB | Focus of Study | NAFLD Diagnosis | Prebiotic | Comparator | Additional Intervention | R;A (n) | Age (Years) (Mean ± SD) | Male (%) | Energy (kcal/day) at Baseline ** (Mean ± SD) T;C | Energy (kcal/day) after Intervention ** (Mean ± SD) T;C | ||||
| Specification | Oral Dose/Duration | Type | Oral Dose | |||||||||||
| 1a | Akbarian et al., 2016, Iran [35] | SB/H | anthropometric measures in nonalcoholic fatty liver patients | ultrasonography | Ocimum basilicum (OB); seeds | 10 g/day/12 weeks | none | N/A | none | 55;36 | 52.2 ± 3.9 | 25 † | 1844.3 ± 116.9; 2010.8 ± 131.4 | nd |
| 1b | Akbarian et al., 2016, Iran [35] | Plantago psyllium (PP); seeds | 54;35 | 48.4 ± 2.9 | 22.9 † | 1794.2 ± 116; 2010.8 ± 131.4 | ||||||||
| 1c | Akbarian et al., 2016, Iran [35] | Plantago psyllium (PP) and Ocimum basilicum (OB); seeds | 53;37 | 51.3 ± 3.0 | 18.9 † | 2215.1 ± 85.6; 2010.8 ± 131.4 | ||||||||
| 2 | Akbarzadeh et al., 2016, Iran [37] | SB/H | anthropometric measurements, body composition and liver enzymes in overweight or obese adults with NAFLD | Physical examination and/or ALT > 40 IU/L and/or elastometry value > 4 kPa in FibroScan (FibroScan 402, Paris, France) | Psyllium; powder | 10 g (2 × 5 g)/day/10 weeks | placebo—crushed wheat (powder) | 10 g (2 × 5 g)/day | physical activity and weight loss diet recommendation * | 80;75 | 45 ± 14.7 | 46.7 † | 2044.8 ± 527.8; 2449.7 ± 778.4 | 1601.3 ± 624.8; 1732.9 ± 468.3 |
| 3 | Behrouz et al., 2017, Iran [38] | DB/H | adiokines and glycemic parameters in the patients with NAFLD | ultrasonography and ALT > 1.5 × upper limit of normal | ORAFTI P95-oligofructose powder, (BENEO, Belgium) $; capsules | 16 g (2 × 8 g)/day/12 weeks | placebo—maltodextrin (capsules) | 16 g (2 × 8g)/day | physical activity and weight loss diet recommendation # | 70;59 | 38.4 ± 9.7 | 69.5 † | 2527.9 ± 681.7; 2417.1 ± 706.5 | 1917.2 ± 384.6; 1909.9 ± 422.1 |
| 4 | Javadi et al., 2018, Iran [39] | DB/H | oxidative stress and inflammatory markers in patients with NAFLD | ultrasonography and ALT > 37 units/L and AST > 40 units/L | Inulin HP (Sensus, Borchwerf, 34704 RG Roosendaal, The Netherlands) $; powder (sachet) | 10 g (2 × 5 g)/day/12 weeks | placebo—maltodextrin (powder, sachet) | 10 g (2 × 5 g)/day | none | 42/38 | 40.4 ± 9.7 | 76.3 | 2296 ± 282; 2158 ± 464 | 2244 ± 174; 2080 ± 408 |
| 5 | Javadi et al., 2017, Iran [40] | DB/H | liver function tests in patients with NAFLD | ultrasonography and liver enzymes tests (cutoff values: AST 31 IU/L, ALT 30 IU/L) | nd | |||||||||
| 6 | Javadi et al., 2017, Iran [41] | DB/H | lipid profile and insulin resistance factors in NAFLD patients | ultrasonography and ALT > 37 units/L and AST > 40 units/L | ||||||||||
Publisher’s Note: MDPI stays neutral with regard to jurisdictional claims in published maps and institutional affiliations. |
© 2020 by the authors. Licensee MDPI, Basel, Switzerland. This article is an open access article distributed under the terms and conditions of the Creative Commons Attribution (CC BY) license (http://creativecommons.org/licenses/by/4.0/).
Share and Cite
Stachowska, E.; Portincasa, P.; Jamioł-Milc, D.; Maciejewska-Markiewicz, D.; Skonieczna-Żydecka, K. The Relationship between Prebiotic Supplementation and Anthropometric and Biochemical Parameters in Patients with NAFLD—A Systematic Review and Meta-Analysis of Randomized Controlled Trials. Nutrients 2020, 12, 3460. https://doi.org/10.3390/nu12113460
Stachowska E, Portincasa P, Jamioł-Milc D, Maciejewska-Markiewicz D, Skonieczna-Żydecka K. The Relationship between Prebiotic Supplementation and Anthropometric and Biochemical Parameters in Patients with NAFLD—A Systematic Review and Meta-Analysis of Randomized Controlled Trials. Nutrients. 2020; 12(11):3460. https://doi.org/10.3390/nu12113460
Chicago/Turabian StyleStachowska, Ewa, Piero Portincasa, Dominika Jamioł-Milc, Dominika Maciejewska-Markiewicz, and Karolina Skonieczna-Żydecka. 2020. "The Relationship between Prebiotic Supplementation and Anthropometric and Biochemical Parameters in Patients with NAFLD—A Systematic Review and Meta-Analysis of Randomized Controlled Trials" Nutrients 12, no. 11: 3460. https://doi.org/10.3390/nu12113460
APA StyleStachowska, E., Portincasa, P., Jamioł-Milc, D., Maciejewska-Markiewicz, D., & Skonieczna-Żydecka, K. (2020). The Relationship between Prebiotic Supplementation and Anthropometric and Biochemical Parameters in Patients with NAFLD—A Systematic Review and Meta-Analysis of Randomized Controlled Trials. Nutrients, 12(11), 3460. https://doi.org/10.3390/nu12113460