Appetite and Protein Intake Strata of Older Adults in the European Union: Socio-Demographic and Health Characteristics, Diet-Related and Physical Activity Behaviours


Abstract
1. Introduction
2. Materials and Methods
2.1. Study Design and Sampling
2.2. Questionnaire Content and Pre-Testing
2.3. Statistical Analysis
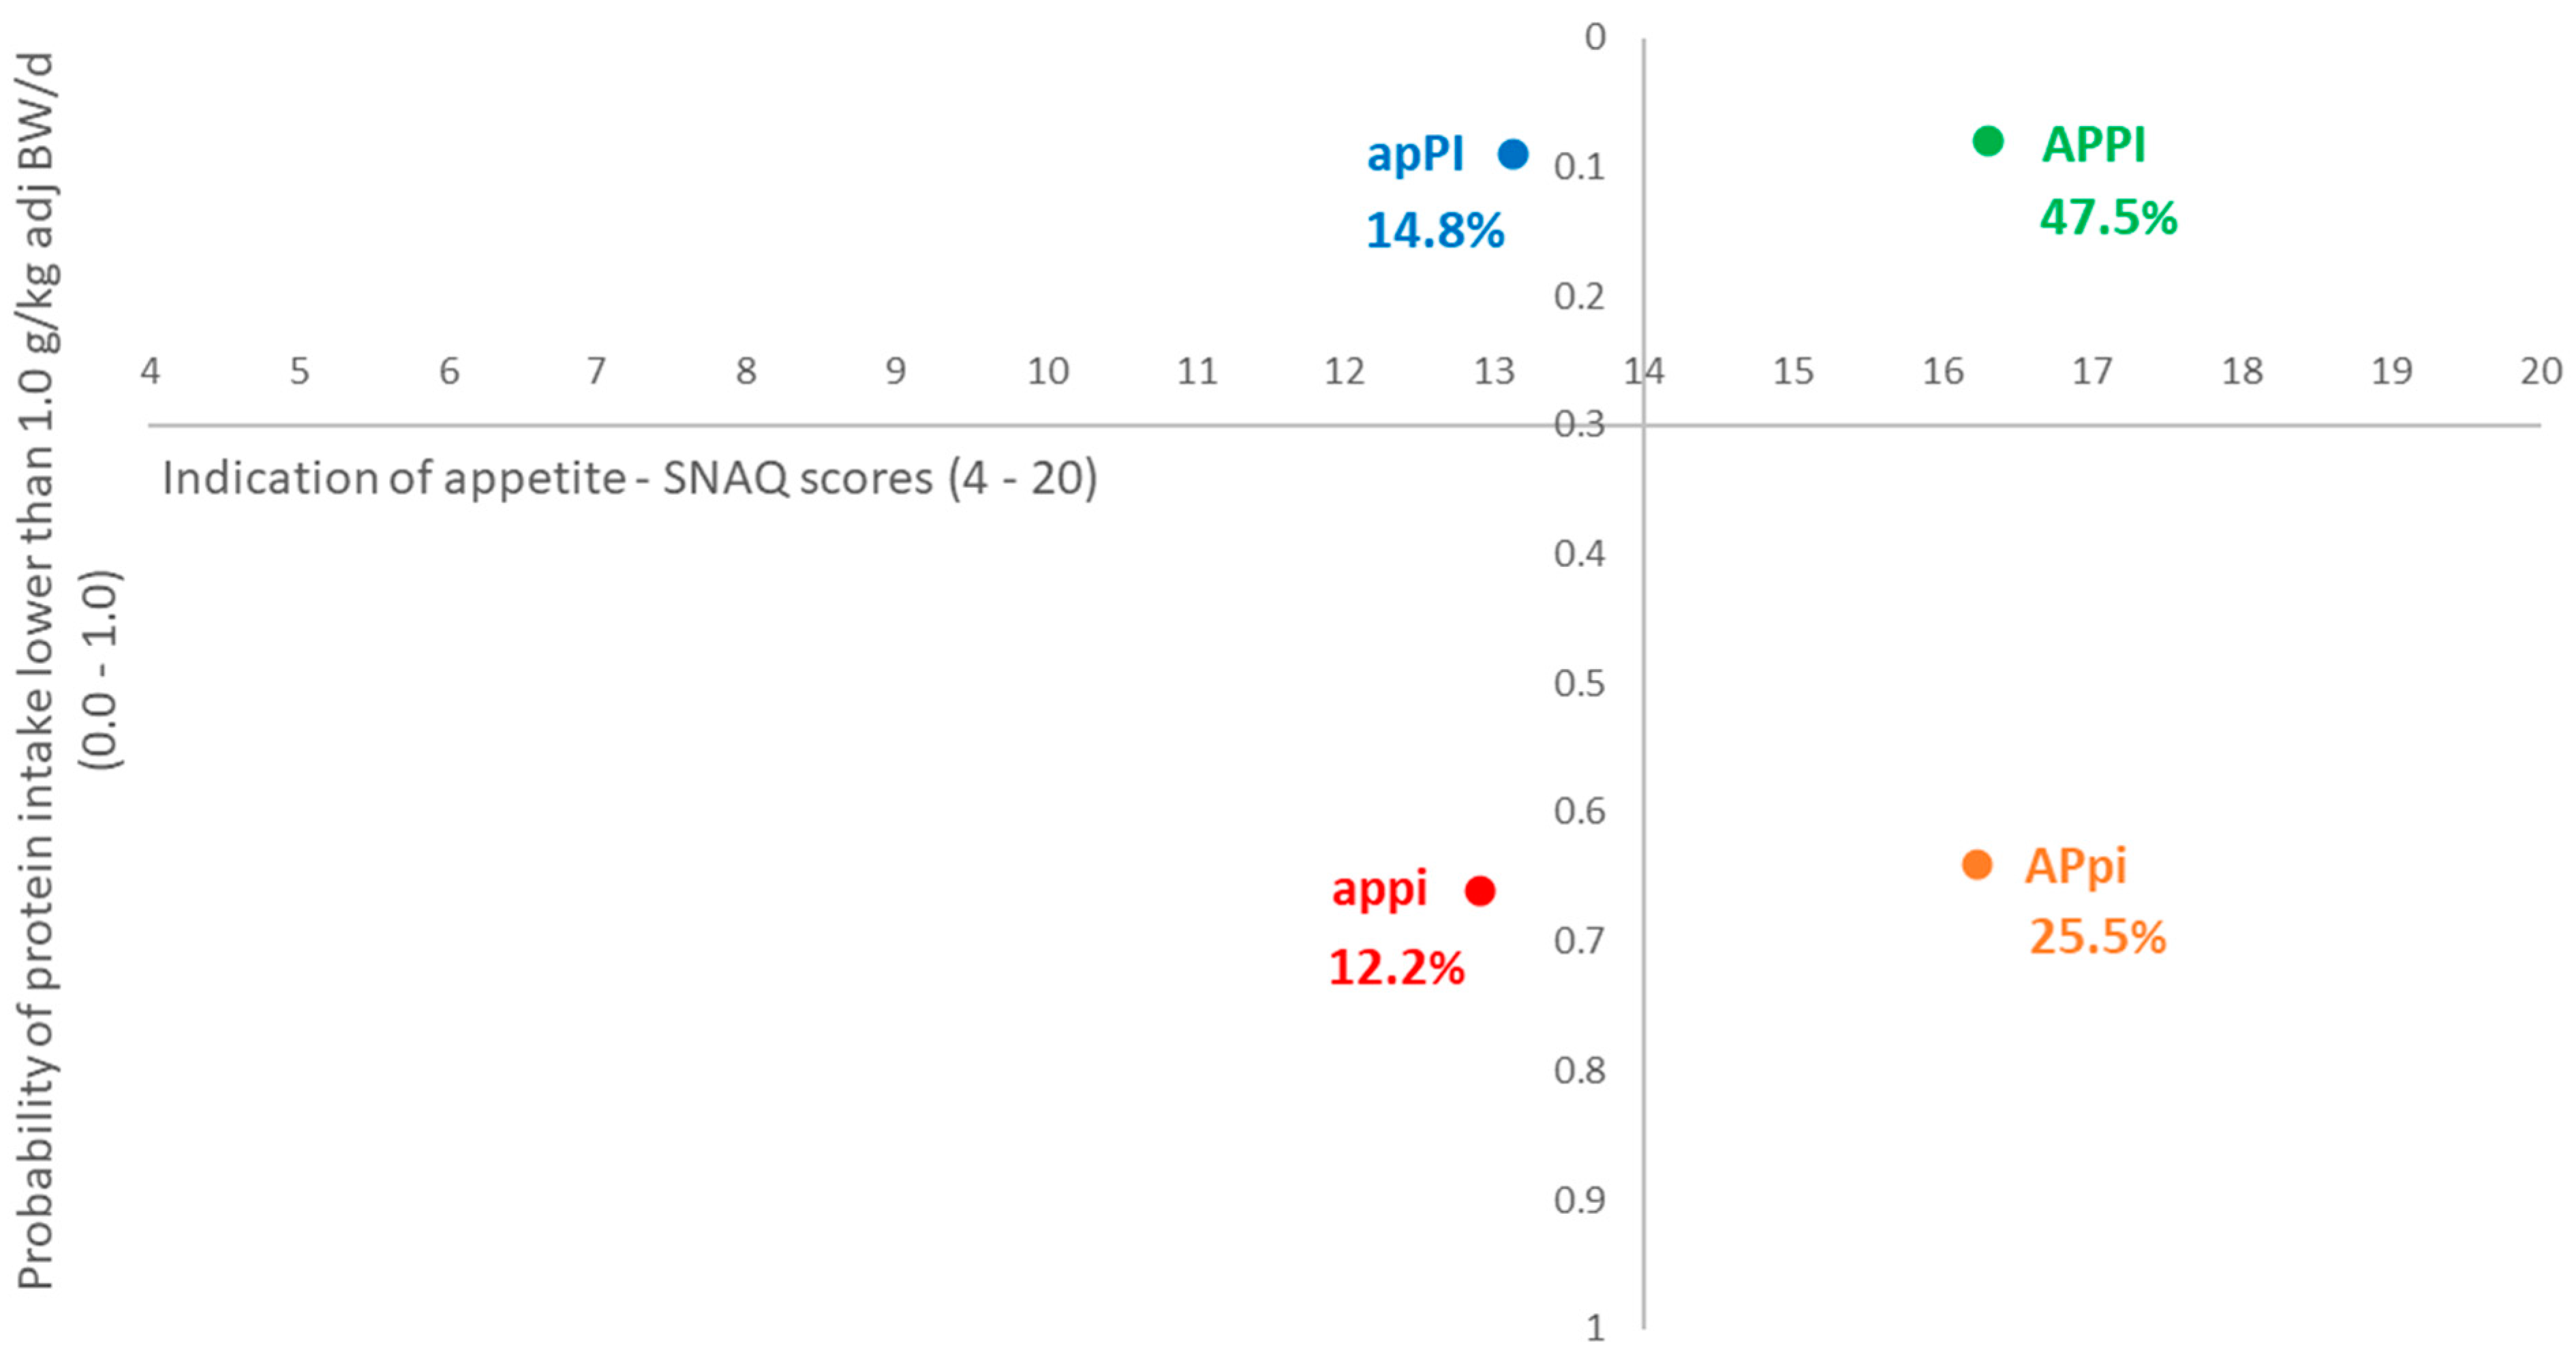
2.3.1. Appetite and Protein Intake Strata
2.3.2. Behavioural Determinants of Protein Intake
3. Results
3.1. Appetite and Protein Intake Strata
3.1.1. Demographic and Socioeconomic Profile
3.1.2. Health Characteristics and Problems
3.1.3. Knowledge and Attitude Related to Protein, Food and Diet
3.1.4. Attitude Towards Physical Activity
3.2. Behavioural Determinants of Protein Intake
3.2.1. Diet-Related Habits
3.2.2. Physical Activity
4. Discussion
4.1. Demographic, Socioeconomic and Health Characteristics
4.2. Diet-Related Characteristics and Behaviours
4.3. Physical Activity Characteristics and Behaviours
4.4. Limitations
5. Conclusions
Author Contributions
Funding
Acknowledgments
Conflicts of Interest
Appendix A

| Food Items (% yes) | Breakfast | Mid-Morning Snack | Lunch | Mid-Afternoon Snack | Dinner | Evening Snack | Nocturnal Eating | I Do Not Consume This Food |
|---|---|---|---|---|---|---|---|---|
| Cereals like cornflakes or muesli | 40.9 | 3.6 | 1.5 | 2.7 | 2.6 | 4.1 | 0.7 | 48.4 |
| Dairy or plant-based milk or yogurt | 40.4 | 9.3 | 18.6 | 13.9 | 21.6 | 14.7 | 2.6 | 13.9 |
| Soup | 0.9 | 0.5 | 56.5 | 7.4 | 33.0 | 1.6 | 1.3 | 8.9 |
| Warm meal | 5.1 | 0.5 | 48.5 | 3.9 | 64.5 | 1.3 | 1.5 | 0.5 |
| Cold meal | 19.2 | 10.1 | 38.0 | 11.7 | 29.1 | 17.7 | 2.4 | 5.6 |
| Dessert | 0.5 | 3.3 | 25.1 | 14.2 | 41.6 | 8.2 | 1.1 | 22.8 |
| Biscuits or cookies | 8.8 | 16.8 | 3.7 | 30.3 | 2.6 | 24.3 | 2.0 | 29.3 |
| Fruits | 15.7 | 25.9 | 25.4 | 43.4 | 20.5 | 31.7 | 2.7 | 3.3 |
| Nuts or seeds | 6.4 | 10.1 | 4.7 | 24.4 | 4.4 | 30.1 | 1.8 | 32.5 |
| Misconception about Dietary Protein—Proportion of Participants Who Indicated True or False to the Statements Incorrectly (or Did not Know the Answer) (n = 1180) (% of Sample) | Total Sample | Strata (%) | ||||
|---|---|---|---|---|---|---|
| appi (12.2) | APpi (25.5) | apPI (14.8) | APPI (47.5) | p-Value (ϕc) | ||
| “You need protein in the diet for energy” | 18.0 | 16.9 | 20.1 | 16.8 | 17.5 | 0.760 (0.031) |
| “You need protein in the diet for repairing bones and muscles” | 10.7 | 9.3 | 11.8 | 10.6 | 10.4 | 0.884 (0.024) |
| “You need protein in the diet for building body cells” | 12.9 | 13.6 | 12.9 | 14.5 | 12.3 | 0.875 (0.024) |
| “Health experts recommend people of my age to consume less protein” * | 48.7 | 50.0 | 53.8 | 42.5 | 48.0 | 0.119 (0.070) |
| “The human body is good at storing protein to use later, it is thus not necessary to consume a steady amount of protein every day” * | 47.4 | 54.2 | 49.5 | 41.9 | 46.7 | 0.173 (0.065) |
| “One meal per day with a good protein source is sufficient” * | 74.6 | 83.1 b | 78.9 a,b | 76.0 a,b | 70.5 a | 0.006 (0.103) |
| “Cooked lean beef has more protein than the same amount of cooked tomato” | 37.1 | 38.1 | 39.4 | 35.8 | 36.3 | 0.796 (0.029) |
| “Whole milk (100 mL) has more protein than cheese (100 g)” * | 44.7 | 46.6 a,b | 51.6 b | 43.6 a,b | 41.6 a | 0.045 (0.083) |
| “You will experience loss in muscle mass if you do not consume enough protein” | 27.5 | 28.8 | 33.0 | 25.1 | 25.3 | 0.101 (0.073) |
References
- Eurostat. Population Age Structure by Major Age Groups, 2007 and 2017. Available online: https://ec.europa.eu/eurostat/statistics-explained/index.php/Population_structure_and_ageing (accessed on 15 February 2019).
- Giacalone, D.; Wendin, K.; Kremer, S.; Frøst, M.B.; Bredie, W.L.; Olsson, V.; Otto, M.H.; Skjoldborg, S.; Linberg, U.; Risvik, E. Health and quality of life in an aging population–Food and beyond. Food Qual. Prefer. 2016, 47, 166–170. [Google Scholar] [CrossRef]
- Paddon-Jones, D.; Campbell, W.W.; Jacques, P.F.; Kritchevsky, S.B.; Moore, L.L.; Rodriguez, N.R.; van Loon, L.J. Protein and healthy aging. Am. J. Clin. Nutr. 2015, 101, 1339S–1345S. [Google Scholar] [CrossRef]
- Baumeister, S.E.; Fischer, B.; Döring, A.; Koenig, W.; Zierer, A.; John, J.; Heier, M.; Meisinger, C. The geriatric nutritional risk index predicts increased healthcare costs and hospitalization in a cohort of community-dwelling older adults: Results from the MONICA/KORA Augsburg cohort study, 1994–2005. Nutrition 2011, 27, 534–542. [Google Scholar] [CrossRef]
- Correia, M.I.T.D.; Waitzberg, D.L. The impact of malnutrition on morbidity, mortality, length of hospital stay and costs evaluated through a multivariate model analysis. Clin. Nutr. 2003, 22, 235–239. [Google Scholar] [CrossRef]
- Freijer, K.; Tan, S.S.; Koopmanschap, M.A.; Meijers, J.M.; Halfens, R.J.; Nuijten, M.J. The economic costs of disease related malnutrition. Clin. Nutr. 2013, 32, 136–141. [Google Scholar] [CrossRef]
- Wolfe, R.R. The role of dietary protein in optimizing muscle mass, function and health outcomes in older individuals. Br. J. Nutr. 2012, 108, S88–S93. [Google Scholar] [CrossRef]
- Deer, R.R.; Volpi, E. Protein intake and muscle function in older adults. Curr. Opin. Clin. Nutr. Metab. Care 2015, 18, 248. [Google Scholar] [CrossRef]
- Volkert, D. Malnutrition in older adults-urgent need for action: A plea for improving the nutritional situation of older adults. Gerontology 2013, 59, 328–333. [Google Scholar] [CrossRef]
- Tieland, M.; Franssen, R.; Dullemeijer, C.; Van Dronkelaar, C.; Kim, H.K.; Ispoglou, T.; Zhu, K.; Prince, R.L.; van Loon, L.J.C.; de Groot, L.C. The impact of dietary protein or amino acid supplementation on muscle mass and strength in elderly people: Individual participant data and meta-analysis of RCT’s. J. Nutr. Health Aging 2017, 21, 994–1001. [Google Scholar]
- Methven, L.; Rahelu, K.; Economou, N.; Kinneavy, L.; Ladbrooke-Davis, L.; Kennedy, O.B.; Mottram, D.S.; Gosney, M.A. The effect of consumption volume on profile and liking of oral nutritional supplements of varied sweetness: Sequential profiling and boredom tests. Food Qual. Prefer. 2010, 21, 948–955. [Google Scholar] [CrossRef]
- Banovic, M.; Arvola, A.; Pennanen, K.; Duta, D.E.; Brückner-Gühmann, M.; Lähteenmäki, L.; Grunert, K.G. Foods with increased protein content: A qualitative study on European consumer preferences and perceptions. Appetite 2018, 125, 233–243. [Google Scholar] [CrossRef] [PubMed]
- Volkert, D.; Beck, A.M.; Cederholm, T.; Cruz-Jentoft, A.; Goisser, S.; Hooper, L.; Kiesswettera, E.; Maggiog, M.; Raynaud-Simoni, A.; Sieber, C.C. ESPEN guideline on clinical nutrition and hydration in geriatrics. Clin. Nutr. 2019, 38, 10–47. [Google Scholar] [CrossRef] [PubMed]
- Shad, B.J.; Thompson, J.L.; Breen, L. Does the muscle protein synthetic response to exercise and amino acid-based nutrition diminish with advancing age? A systematic review. Am. J. Physiol.-Endocrinol. Metab. 2016, 311, E803–E817. [Google Scholar] [CrossRef]
- Bauer, J.; Biolo, G.; Cederholm, T.; Cesari, M.; Cruz-Jentoft, A.J.; Morley, J.E.; Phillips, S.; Sieber, C.; Stehle, P.; Teta, D.; et al. Evidence-based recommendations for optimal dietary protein intake in older people: A position paper from the PROT-AGE study group. J. Am. Med. Dir. Assoc. 2013, 14, 542–559. [Google Scholar] [CrossRef] [PubMed]
- Deutz, N.E.; Bauer, J.M.; Barazzoni, R.; Biolo, G.; Boirie, Y.; Bosy-Westphal, A.; Cederholm, T.; Cruz-Jentoft, A.; Krznariçi, Z.; Nair, K.S.; et al. Protein intake and exercise for optimal muscle function with aging: Recommendations from the ESPEN Expert Group. Clin. Nutr. 2014, 33, 929–936. [Google Scholar] [CrossRef] [PubMed]
- Mendonça, N.; Hill, T.R.; Granic, A.; Davies, K.; Collerton, J.; Mathers, J.C.; Siervo, M.; Wrieden, W.L.; Seal, C.J.; Kirkwood, T.B.L.; et al. Macronutrient intake and food sources in the very old: Analysis of the Newcastle 85+ Study. Br. J. Nutr. 2016, 115, 2170–2180. [Google Scholar]
- Cruz-Jentoft, A.J.; Landi, F.; Schneider, S.M.; Zúñiga, C.; Arai, H.; Boirie, Y.; Chen, L.-K.; Fielding, R.A.; Martin, F.C.; Micheal, J.-P.; et al. Prevalence of and interventions for sarcopenia in ageing adults: A systematic review. Report of the International Sarcopenia Initiative (EWGSOP and IWGS). Age Ageing 2014, 43, 748–759. [Google Scholar] [CrossRef] [PubMed]
- Fulgoni, V.L., III. Current protein intake in America: Analysis of the National Health and Nutrition Examination Survey, 2003–2004. Am. J. Clin. Nutr. 2008, 87, 1554S–1557S. [Google Scholar] [CrossRef]
- Conklin, A.I.; Forouhi, N.G.; Surtees, P.; Khaw, K.T.; Wareham, N.J.; Monsivais, P. Social relationships and healthful dietary behaviour: Evidence from over-50 s in the EPIC cohort, UK. Soc. Sci. Med. 2014, 100, 167–175. [Google Scholar] [CrossRef] [PubMed]
- Mann, T.; Heuberger, R.; Wong, H. The association between chewing and swallowing difficulties and nutritional status in older adults. Aust. Dent. J. 2013, 58, 200–206. [Google Scholar] [CrossRef]
- Bloom, I.; Lawrence, W.; Barker, M.; Baird, J.; Dennison, E.; Sayer, A.A.; Cooper, C.; Robinson, S. What influences diet quality in older people? A qualitative study among community-dwelling older adults from the Hertfordshire Cohort Study, UK. Public Health Nutr. 2017, 20, 2685–2693. [Google Scholar] [CrossRef] [PubMed]
- de Boer, A.; Ter Horst, G.J.; Lorist, M.M. Physiological and psychosocial age-related changes associated with reduced food intake in older persons. Ageing Res. Rev. 2013, 12, 316–328. [Google Scholar] [CrossRef] [PubMed]
- Drolet, A.; Bodapati, A.V.; Suppes, P.; Rossi, B.; Hochwarter, H. Habits and free associations: Free your mind but mind your habits. J. Assoc. Consum. Res. 2017, 2, 293–305. [Google Scholar] [CrossRef]
- Drolet, A.; Schwarz, N.; Yoon, C. The Aging Consumer: Perspectives from Psychology and Economics; Routledge: Abingdon, UK, 2011. [Google Scholar]
- Yoon, C.; Cole, C.A.; Lee, M.P. Consumer decision making and aging: Current knowledge and future directions. J. Consum. Psychol. 2009, 19, 2–16. [Google Scholar] [CrossRef]
- Tsubota-Utsugi, M.; Kikuya, M.; Satoh, M.; Inoue, R.; Hosaka, M.; Metoki, H.; Hirose, T.; Asayama, K.; Imai, Y.; Ohkubo, T. Living situations associated with poor dietary intake among healthy Japanese elderly: The Ohasama study. J. Nutr. Health Aging 2015, 19, 375–382. [Google Scholar] [CrossRef]
- Hanna, K.L.; Collins, P.F. Relationship between living alone and food and nutrient intake. Nutr. Rev. 2015, 73, 594–611. [Google Scholar] [CrossRef]
- Franco, M.R.; Tong, A.; Howard, K.; Sherrington, C.; Ferreira, P.H.; Pinto, R.Z.; Ferreira, M.L. Older people’s perspectives on participation in physical activity: A systematic review and thematic synthesis of qualitative literature. Br. J. Sports Med. 2015, 49, 1268–1276. [Google Scholar] [CrossRef]
- Lonnie, M.; Hooker, E.; Brunstrom, J.; Corfe, B.; Green, M.; Watson, A.; Williams, E.A.; Stevenson, E.J.; Penson, S.; Johnstone, A. Protein for life: Review of optimal protein intake, sustainable dietary sources and the effect on appetite in ageing adults. Nutrients 2018, 10, 360. [Google Scholar] [CrossRef] [PubMed]
- Doets, E.L.; Kremer, S. The silver sensory experience—A review of senior consumers’ food perception, liking and intake. Food Qual. Prefer. 2016, 48, 316–332. [Google Scholar] [CrossRef]
- Hengeveld, L.M.; Pelgröm, A.D.; Visser, M.; Boer, J.M.; Haveman-Nies, A.; Wijnhoven, H.A. Comparison of protein intake per eating occasion, food sources of protein and general characteristics between community-dwelling older adults with a low and high protein intake. Clin. Nutr. ESPEN 2019, 29, 165–174. [Google Scholar] [CrossRef]
- Stula, S. Living in Old Age in Europe-Current Developments and Challenges; German Association for Public and Private Welfare (DV): Berlin, Germany, 2012. [Google Scholar]
- Schilp, J.; Kruizenga, H.M.; Wijnhoven, H.A.; Leistra, E.; Evers, A.M.; van Binsbergen, J.J.; Deeg, D.J.H.; Visser, M. High prevalence of undernutrition in Dutch community-dwelling older individuals. Nutrition 2012, 28, 1151–1156. [Google Scholar] [CrossRef]
- van der Meij, B.S.; Wijnhoven, H.A.; Lee, J.S.; Houston, D.K.; Hue, T.; Harris, T.B.; Kritchevsky, S.B.; Newman, S.B.; Visser, M. Poor appetite and dietary intake in community-dwelling older adults. J. Am. Geriatr. Soc. 2017, 65, 2190–2197. [Google Scholar] [CrossRef]
- van der Pols-Vijlbrief, R.; Wijnhoven, H.A.; Schaap, L.A.; Terwee, C.B.; Visser, M. Determinants of protein-energy malnutrition in community-dwelling older adults: A systematic review of observational studies. Ageing Res. Rev. 2014, 18, 112–131. [Google Scholar] [CrossRef]
- Houston, D.K.; Nicklas, B.J.; Ding, J.; Harris, T.B.; Tylavsky, F.A.; Newman, A.B.; Lee, J.S.; Sahyoun, N.R.; Visser, M.; Kritchevsky, S.B.; et al. Dietary protein intake is associated with lean mass change in older, community-dwelling adults: The Health, Aging, and Body Composition (Health ABC) Study. Am. J. Clin. Nutr. 2008, 87, 150–155. [Google Scholar] [CrossRef]
- Eurostat. People in the EU—Statistics on an Ageing Society. Available online: https://ec.europa.eu/eurostat/statistics-explained/index.php?title=People_in_the_EU_-_statistics_on_an_ageing_society&oldid=417833 (accessed on 15 February 2019).
- Wilson, M.-M.G.; Thomas, D.R.; Rubenstein, L.Z.; Chibnall, J.T.; Anderson, S.; Baxi, A.; Diebold, M.R.; Morley, J.E. Appetite assessment: Simple appetite questionnaire predicts weight loss in community-dwelling adults and nursing home residents. Am. J. Clin. Nutr. 2005, 82, 1074–1081. [Google Scholar] [CrossRef]
- Young, A.M.; Kidston, S.; Banks, M.D.; Mudge, A.M.; Isenring, E.A. Malnutrition screening tools: Comparison against two validated nutrition assessment methods in older medical inpatients. Nutrition 2013, 29, 101–106. [Google Scholar] [CrossRef]
- Hanisah, R.; Shahar, S.; Lee, F. Validation of screening tools to assess appetite among geriatric patients. J. Nutr. Health Aging 2012, 16, 660–665. [Google Scholar] [CrossRef]
- Rolland, Y.; Perrin, A.; Gardette, V.; Filhol, N.; Vellas, B. Screening older people at risk of malnutrition or malnourished using the simplified nutritional appetite questionnaire (SNAQ): A comparison with the Mini-Nutritional Assessment (MNA) tool. J. Am. Med. Dir. Assoc. 2012, 13, 31–34. [Google Scholar] [CrossRef]
- Beukers, M.; Dekker, L.H.; De Boer, E.J.; Perenboom, C.W.M.; Meijboom, S.; Nicolaou, M.; de Vries, J.H.M.; Brants, H.A.M. Development of the HELIUS food frequency questionnaires: Ethnic-specific questionnaires to assess the diet of a multiethnic population in The Netherlands. Eur. J. Clin. Nutr. 2015, 69, 579–584. [Google Scholar] [CrossRef]
- Wijnhoven, H.A.; Elstgeest, L.E.; de Vet, H.C.; Nicolaou, M.; Snijder, M.B.; Visser, M. Development and validation of a short food questionnaire to screen for low protein intake in community-dwelling older adults: The Protein Screener 55+(Pro55+). PLoS ONE 2018, 13, e0196406. [Google Scholar] [CrossRef]
- Craig, C.L.; Marshall, A.L.; Sjöström, M.; Bauman, A.E.; Booth, M.L.; Ainsworth, B.E.; Pratt, M.; Ekelund, U.; Yngve, A.; Sallis, J.; et al. International physical activity questionnaire: 12-country reliability and validity. Med. Sci. Sports Exerc. 2003, 35, 1381–1395. [Google Scholar] [CrossRef]
- Hurtig-Wennlöf, A.; Hagströmer, M.; Olsson, L.A. The International Physical Activity Questionnaire modified for the elderly: Aspects of validity and feasibility. Public Health Nutr. 2010, 13, 1847–1854. [Google Scholar] [CrossRef]
- Committee, I.R. Guidelines for Data Processing and Analysis of the International Physical Activity Questionnaire (IPAQ)—short and long forms. Available online: https://sites.google.com/site/theipaq/scoring-protocol (accessed on 15 February 2019).
- Hall, M.H.; Smagula, S.F.; Boudreau, R.M.; Ayonayon, H.N.; Goldman, S.E.; Harris, T.B.; Naydeck, B.L.; Rubin, S.M.; Samuelsson, L.; Satterfield, S.; et al. Association between sleep duration and mortality is mediated by markers of inflammation and health in older adults: The health, aging and body composition study. Sleep 2015, 38, 189–195. [Google Scholar] [CrossRef]
- Trost, S.G.; Owen, N.; Bauman, A.E.; Sallis, J.F.; Brown, W. Correlates of adults’ participation in physical activity: Review and update. Med. Sci. Sports Exerc. 2002, 34, 1996–2001. [Google Scholar] [CrossRef]
- Bandura, A. Guide for constructing self-efficacy scales. Self-Effic. Beliefs Adolesc. 2006, 5, 307–337. [Google Scholar]
- Everett, B.; Salamonson, Y.; Davidson, P.M. Bandura’s exercise self-efficacy scale: Validation in an Australian cardiac rehabilitation setting. Int. J. Nurs. Studies 2009, 46, 824–829. [Google Scholar] [CrossRef] [PubMed]
- Wardle, J.; Guthrie, C.A.; Sanderson, S.; Rapoport, L. Development of the children’s eating behaviour questionnaire. J. Child Psychol. Psychiatry Allied Discip. 2001, 42, 963–970. [Google Scholar] [CrossRef]
- den Uijl, L.C.; Jager, G.; de Graaf, C.; Waddell, J.; Kremer, S. It is not just a meal, it is an emotional experience—A segmentation of older persons based on the emotions that they associate with mealtimes. Appetite 2014, 83, 287–296. [Google Scholar] [CrossRef] [PubMed]
- Elia, M. The ‘MUST’report. Nutritional screening for adults: A multidisciplinary responsibility. In Development and Use of the ‘Malnutrition Universal Screening Tool’(‘MUST’) for Adults. A Report by the Malnutrition Advisory Group of the British Association for Parenteral and Enteral Nutrition; BAPEN: Worcestershire, UK, 2003; p. 127. [Google Scholar]
- Poulia, K.-A.; Yannakoulia, M.; Karageorgou, D.; Gamaletsou, M.; Panagiotakos, D.B.; Sipsas, N.V.; Zampelas, A. Evaluation of the efficacy of six nutritional screening tools to predict malnutrition in the elderly. Clin. Nutr. 2012, 31, 378–385. [Google Scholar] [CrossRef]
- Leistra, E.; Langius, J.A.; Evers, A.M.; Visser, M.; de Vet, H.C.; Kruizenga, H.M. Validity of nutritional screening with MUST and SNAQ in hospital outpatients. Eur. J. Clin. Nutr. 2013, 67, 738–742. [Google Scholar] [CrossRef] [PubMed]
- Hengeveld, L.M.; Wijnhoven, H.A.; Olthof, M.R.; Brouwer, I.A.; Harris, T.B.; Kritchevsky, S.B.; Newman, A.B.; Visser, M.; Health ABC Study. Prospective associations of poor diet quality with long-term incidence of protein-energy malnutrition in community-dwelling older adults: The Health, Aging, and Body Composition (Health ABC) Study. Am. J. Clin. Nutr. 2018, 107, 155–164. [Google Scholar] [CrossRef]
- Levine, T.R.; Hullett, C.R. Eta squared, partial eta squared, and misreporting of effect size in communication research. Hum. Commun. Res. 2002, 28, 612–625. [Google Scholar] [CrossRef]
- Olivier, J.; Bell, M.L. Effect sizes for 2 × 2 contingency tables. PLoS ONE 2013, 8, e58777. [Google Scholar] [CrossRef] [PubMed]
- Harlow, L.L. The Essence of Multivariate Thinking: Basic Themes and Methods; Routledge: Abingdon, UK, 2014. [Google Scholar]
- Campbell, I. Chi-squared and Fisher–Irwin tests of two-by-two tables with small sample recommendations. Stat. Med. 2007, 26, 3661–3675. [Google Scholar] [CrossRef]
- Houston, D.K.; Tooze, J.A.; Garcia, K.; Visser, M.; Rubin, S.; Harris, T.B.; Newman, A.B.; Kritchevsky, S.B.; Health ABC Study. Protein intake and mobility limitation in community-dwelling older adults: The health ABC Study. J. Am. Geriatr. Soc. 2017, 65, 1705–1711. [Google Scholar] [CrossRef] [PubMed]
- Mendonça, N.; Granic, A.; Mathers, J.C.; Hill, T.R.; Siervo, M.; Adamson, A.J.; Jagger, C. Prevalence and determinants of low protein intake in very old adults: Insights from the Newcastle 85+ study. Eur. J. Nutr. 2018, 57, 2713–2722. [Google Scholar] [CrossRef]
- Raatz, S.K.; Jahns, L.; Johnson, L.K.; Scheett, A.; Carriquiry, A.; Lemieux, A.; Nakajimad, M.; al’Absid, M. Smokers report lower intake of key nutrients than nonsmokers, yet both fall short of meeting recommended intakes. Nutr. Res. 2017, 45, 30–37. [Google Scholar] [CrossRef] [PubMed]
- Ahn, J.A.; Park, J.; Kim, C.J. Effects of an individualised nutritional education and support programme on dietary habits, nutritional knowledge and nutritional status of older adults living alone. J. Clin. Nurs. 2018, 27, 2142–2151. [Google Scholar] [CrossRef] [PubMed]
- Irz, X.; Fratiglioni, L.; Kuosmanen, N.; Mazzocchi, M.; Modugno, L.; Nocella, G.; Shakersain, B.; Traill, W.B.; Xu, W.; Zanello, G. Sociodemographic determinants of diet quality of the EU elderly: A comparative analysis in four countries. Public Health Nutr. 2014, 17, 1177–1189. [Google Scholar] [CrossRef]
- Wijnhoven, H.A.; Schilp, J.; de Vet, H.C.; Kruizenga, H.M.; Deeg, D.J.; Ferrucci, L.; Visser, M. Development and validation of criteria for determining undernutrition in community-dwelling older men and women: The short nutritional assessment questionnaire 65+. Clin. Nutr. 2012, 31, 351–358. [Google Scholar] [CrossRef] [PubMed]
- Schilp, J.; Wijnhoven, H.A.; Deeg, D.J.; Visser, M. Early determinants for the development of undernutrition in an older general population: Longitudinal aging study amsterdam. Br. J. Nutr. 2011, 106, 708–717. [Google Scholar] [CrossRef] [PubMed]
- Nyberg, M.; Olsson, V.; Pajalic, Z.; Örtman, G.; Andersson, H.S.; Blücher, A.; Wendin, K.; Westergren, A. Eating difficulties, nutrition, meal preferences and experiences among elderly: A literature overview from a Scandinavian context. J. Food Res. 2015, 4, 22–37. [Google Scholar] [CrossRef]
- van der Zanden, L.D.; van Kleef, E.; de Wijk, R.A.; van Trijp, H.C. Knowledge, perceptions and preferences of elderly regarding protein-enriched functional food. Appetite 2014, 80, 16–22. [Google Scholar] [CrossRef] [PubMed]
- Capacci, S.; Mazzocchi, M.; Shankar, B.; Brambila Macias, J.; Verbeke, W.; Pérez-Cueto, F.J.; Kozioł-Kozakowska, A.; Piórecka, B.; Niedzwiedzka, B.; D’Addesa, D.; et al. Policies to promote healthy eating in Europe: A structured review of policies and their effectiveness. Nutr. Rev. 2012, 70, 188–200. [Google Scholar] [CrossRef] [PubMed]
- Chung, L.M.Y.; Chung, J.W.Y. Effectiveness of a food education program in improving appetite and nutritional status of elderly adults living at home. Asia Pac. J. Clin. Nutr. 2014, 23, 315–320. [Google Scholar] [PubMed]
- Almoosawi, S.; Vingeliene, S.; Gachon, F.; Voortman, T.; Palla, L.; Johnston, J.D.; Dam, R.M.V.; Darimont, C.; Karagounis, L.G. Chronotype: Implications for epidemiologic studies on chrono-nutrition and cardiometabolic health. Adv. Nutr. 2018. [Google Scholar] [CrossRef] [PubMed]
- Paddon-Jones, D.; Leidy, H. Dietary protein and muscle in older persons. Curr. Opin. Clin. Nutr. Metab. Care 2014, 17, 5. [Google Scholar] [CrossRef]
- Bouillanne, O.; Curis, E.; Hamon-Vilcot, B.; Nicolis, I.; Chrétien, P.; Schauer, N.; Vicent, J.-P.; Cynpober, L.; Aussel, C. Impact of protein pulse feeding on lean mass in malnourished and at-risk hospitalized elderly patients: A randomized controlled trial. Clin. Nutr. 2013, 32, 186–192. [Google Scholar] [CrossRef] [PubMed]
- Kim, I.-Y.; Schutzler, S.; Schrader, A.M.; Spencer, H.J.; Azhar, G.; Wolfe, R.R.; Ferrando, A.A. Protein intake distribution pattern does not affect anabolic response, lean body mass, muscle strength or function over 8 weeks in older adults: A randomized-controlled trial. Clin. Nutr. 2018, 37, 488–493. [Google Scholar] [CrossRef]
- De Castro, J.M. When, how much and what foods are eaten are related to total daily food intake. Br. J. Nutr. 2009, 102, 1228–1237. [Google Scholar] [CrossRef]
- Flood-Obbagy, J.E.; Rolls, B.J. The effect of fruit in different forms on energy intake and satiety at a meal. Appetite 2009, 52, 416–422. [Google Scholar] [CrossRef]
- Slavin, J.L.; Lloyd, B. Health benefits of fruits and vegetables. Adv. Nutr. 2012, 3, 506–516. [Google Scholar] [CrossRef] [PubMed]
- Spence, C. Mouth-watering: The influence of environmental and cognitive factors on salivation and gustatory/flavor perception. J. Texture Stud. 2011, 42, 157–171. [Google Scholar] [CrossRef]
- Dormenval, V.; Mojon, P.; Budtz-Jørgensen, E. Associations between self-assessed masticatory ability, nutritional status, prosthetic status and salivary flow rate in hospitalized elders. Oral Dis. 1999, 5, 32–38. [Google Scholar] [CrossRef]
- Rhodus, N.L. Nutritional intake in both free-living and institutionalized older adults with xerostomia. J. Nutr. Elder. 1991, 10, 1–32. [Google Scholar] [CrossRef]
- Luo, S.; Monterosso, J.R.; Sarpelleh, K.; Page, K.A. Differential effects of fructose versus glucose on brain and appetitive responses to food cues and decisions for food rewards. Proc. Natl. Acad. Sci. USA 2015, 112, 6509–6514. [Google Scholar] [CrossRef] [PubMed]
- Cha, S.H.; Wolfgang, M.; Tokutake, Y.; Chohnan, S.; Lane, M.D. Differential effects of central fructose and glucose on hypothalamic malonyl–CoA and food intake. Proc. Natl. Acad. Sci. USA 2008, 105, 16871–16875. [Google Scholar] [CrossRef]
- Page, K.A.; Melrose, A.J. Brain, hormone and appetite responses to glucose versus fructose. Curr. Opin. Behav. Sci. 2016, 9, 111–117. [Google Scholar] [CrossRef]
- Tappy, L.; Tappy, L.; Lê, K.A.; Tran, C.; Paquot, N. Fructose and metabolic diseases: new findings, new questions. Nutrition, 26(11-12), 1044-1049. Fructose and metabolic diseases: New findings, new questions. Nutrition 2010, 26, 1044–1049. [Google Scholar] [CrossRef]
- Fulton, S.L.; McKinley, M.C.; Neville, C.E.; Baldrick, F.R.; Mulligan, C.; McCall, D.O.; Edgar, J.D.; Elborn, J.S.; Young, I.S.; Patterson, C.C.; et al. The effect of increased fruit and vegetable consumption on selected macronutrient and micronutrient intakes in four randomised-controlled trials. Br. J. Nutr. 2017, 117, 1270–1278. [Google Scholar] [CrossRef]
- Taaffe, D.R. Sarcopenia: Exercise as a treatment strategy. Aust. Fam. Phys. 2006, 35, 130. [Google Scholar]
- Paddon-Jones, D.; Short, K.R.; Campbell, W.W.; Volpi, E.; Wolfe, R.R. Role of dietary protein in the sarcopenia of aging. Am. J. Clin. Nutr. 2008, 87, 1562S–1566S. [Google Scholar] [CrossRef]
- Sparling, P.B.; Howard, B.J.; Dunstan, D.W.; Owen, N. Recommendations for physical activity in older adults. Br. Med. J. 2015, 350, h100. [Google Scholar] [CrossRef]
- Bauman, A.E.; Reis, R.S.; Sallis, J.F.; Wells, J.C.; Loos, R.J.; Martin, B.W.; Lancet physical activity series working group. Correlates of physical activity: Why are some people physically active and others not? Lancet 2012, 380, 258–271. [Google Scholar] [CrossRef]
- Carlson, J.A.; Sallis, J.F.; Conway, T.L.; Saelens, B.E.; Frank, L.D.; Kerr, J.; Cain, K.L.; King, A.C. Interactions between psychosocial and built environment factors in explaining older adults’ physical activity. Prev. Med. 2012, 54, 68–73. [Google Scholar] [CrossRef] [PubMed]
- Ashford, S.; Edmunds, J.; French, D.P. What is the best way to change self-efficacy to promote lifestyle and recreational physical activity? A systematic review with meta-analysis. Br. J. Health Psychol. 2010, 15, 265–288. [Google Scholar] [CrossRef] [PubMed]
- Werle, C.O.C.; Wansink, B.; Payne, C.R. Is it fun or exercise? The framing of physical activity biases subsequent snacking. Mark. Lett. 2015, 26, 691–702. [Google Scholar] [CrossRef]
- van Uffelen, J.G.Z.; Heesch, K.C.; Hill, R.L.; Brown, W.J. A qualitative study of older adults’ responses to sitting-time questions: Do we get the information we want? BMC Public Health 2011, 11, 458. [Google Scholar] [CrossRef]
- Dashti, H.S.; Scheer, F.A.; Jacques, P.F.; Lamon-Fava, S.; Ordovás, J.M. Short sleep duration and dietary intake: Epidemiologic evidence, mechanisms, and health implications. Adv. Nutr. 2015, 6, 648–659. [Google Scholar] [CrossRef]
- Garfield, V.; Llewellyn, C.H.; Kumari, M. The relationship between physical activity, sleep duration and depressive symptoms in older adults: The English Longitudinal Study of Ageing (ELSA). Prev. Med. Rep. 2016, 4, 512–516. [Google Scholar] [CrossRef]
- Buman, M.P.; Hekler, E.B.; Bliwise, D.L.; King, A.C. Moderators and mediators of exercise-induced objective sleep improvements in mid life and older adults with sleep complaints. Health Psychol. 2011, 30, 579–587. [Google Scholar] [CrossRef] [PubMed]
- Dunn, A.L.; Trivedi, M.H.; O’Neal, H.A. Physical activity dose-response effects on outcomes of depression and anxiety. Med. Sci. Sports Exerc. 2001, 33, S587–S597. [Google Scholar] [CrossRef] [PubMed]
- Becker, N.B.; de Jesus, S.N.; Viseu, J.N.; Stobäus, C.D.; Guerreiro, M.; Domingues, R.B. Depression and quality of life in older adults: Mediation effect of steep quality. Int. J. Clin. Health Psychol. 2018, 18, 8–17. [Google Scholar] [CrossRef]
- Doty, R.L.; Kamath, V. The influences of age on olfaction: A review. Front. Psychol. 2014, 5, 20. [Google Scholar] [CrossRef]
- Remillard, M.L.; Mazor, K.M.; Cutrona, S.L.; Gurwitz, J.H.; Tjia, J. Systematic review of the use of online questionnaires of older adults. J. Am. Geriatr. Soc. 2014, 62, 696–705. [Google Scholar] [CrossRef] [PubMed]
- Fisher, R.J. Social Desirability Bias and the Validity of Indirect Questioning. J. Consum. Res. 1993, 20, 303–315. [Google Scholar] [CrossRef]

| Strata | n = 1825 (%) | Mean ± SD | |
|---|---|---|---|
| Appetite Score ‡ | Probability Protein Intake * | ||
| Total sample | 15.40 ± 1.91 | 0.29 ± 0.31 | |
| 1. appi—Poor appetite and lower level of protein intake | 222 (12.2) | 12.90 ± 1.51 | 0.66 ± 0.21 |
| 2. APpi—Good appetite but lower level of protein intake | 466 (25.5) | 16.23 ± 1.13 | 0.64 ± 0.21 |
| 3. apPI—Poor appetite but higher level of protein intake | 271 (14.8) | 13.13 ± 1.32 | 0.09 ± 0.08 |
| 4. APPI—Good appetite and higher level of protein intake | 866 (47.5) | 16.30 ± 1.19 | 0.08 ± 0.08 |
| Socio-Demographics (% of Sample) | Total Sample | Strata (%) | p-Value (ϕc) | ||||
|---|---|---|---|---|---|---|---|
| appi (12.2) | APpi (25.5) | apPI (14.8) | APPI (47.5) | ||||
| Gender | Male | 50.4 | 55.4 b,c | 60.3 c | 45.4 a,b | 45.4 a | <0.001 (0.132) |
| Female | 49.6 | 44.6 a,b | 39.7 a | 54.6 b,c | 54.6 c | ||
| Age group | Below 70 years | 55.9 | 46.8 a | 55.2 a,b | 58.7 a,b | 57.9 b | 0.022 (0.073) |
| 70 years or above | 44.1 | 53.2 b | 44.8 a,b | 41.3 a,b | 42.1 a | ||
| Country | United Kingdom | 20.0 | 35.6 b | 34.4 b | 7.4 a | 12.2 a | <0.001 (0.224) |
| The Netherlands | 20.1 | 13.5 a | 26.6 b | 15.5 a | 19.6 a | ||
| Spain | 19.9 | 15.3 b | 7.7 a | 27.3 c | 25.5 c | ||
| Poland | 20.0 | 8.6 a | 19.3 b,c | 15.5 a,b | 24.7 c | ||
| Finland | 20.0 | 27.0 b,c | 12.0a | 34.3 c | 18.0 b | ||
| Education | Below tertiary level | 59.6 | 67.6 b | 61.6 a,b | 63.8 a,b | 55.2 a | 0.001 (0.093) |
| Tertiary level or above | 40.4 | 32.4 a | 38.4 a,b | 36.2 a,b | 44.8 b | ||
| Main household grocery shopper | Yes | 70.3 | 70.3 | 66.7 | 71.6 | 71.8 | 0.515 (0.038) |
| No | 10.1 | 9.5 | 12.3 | 8.5 | 9.6 | ||
| Shared responsibility | 20.3 | 20.2 | 21.0 | 19.9 | 18.6 | ||
| Living alone | Yes | 30.6 | 36.5 | 30.9 | 32.5 | 28.4 | 0.109 (0.058) |
| No ‡ | 69.4 | 63.5 | 69.1 | 67.5 | 71.6 | ||
| Own food decision maker | Yes, always | 69.3 | 69.8 a,b | 63.3 a | 71.2 a,b | 71.8 b | 0.029 (0.062) |
| Yes, sometimes | 25.1 | 22.5 | 29.8 | 23.6 | 23.7 | ||
| No, someone else decides | 5.6 | 7.7 | 6.9 | 5.2 | 4.5 | ||
| Perceived financial situation (n = 1791) | Manage quite or very well | 45.3 | 40.6 a | 53.1 b | 39.1 a | 44.2 a | 0.001 (0.079) |
| Get by alright | 38.3 | 37.0 a,b | 33.1 a | 43.6 b | 39.7 a,b | ||
| Have some or severe difficulties | 15.4 | 22.4 b | 13.8 a | 17.3 a,b | 16.1 a,b | ||
| Monthly net household income (n = 1589) | Below 1000 EUR | 20.5 | 19.6 a,b,c | 20.4 c | 11.8 a | 23.6 b,c | 0.001 (0.082) |
| Between 1000 EUR and 2000 EUR | 37.2 | 41.8 a,b,c | 34.2 a | 45.6 c | 35.0 a,b | ||
| 2000 EUR or above | 42.3 | 38.6 | 45.4 | 42.6 | 41.4 | ||
| Health Characteristics (% of Sample) | Total Sample | Strata (%) | p-Value (ϕc) | ||||
|---|---|---|---|---|---|---|---|
| appi (12.2) | APpi (25.5) | apPI (14.8) | APPI (47.5) | ||||
| MUST—risk levels of malnutrition (n = 1659) | Low | 74.8 | 69.4 a,b | 80.7 c | 60.8 a | 77.4 b,c | <0.001 (0.131) |
| Medium | 18.7 | 19.4 a,b | 15.3 a | 25.2 b | 18.3 a,b | ||
| High | 6.5 | 11.2 b | 4.0 a | 14.0 b | 4.3 a | ||
| Ability to walk or move own wheelchair for more than 5 minutes (n = 1822) # | Yes without difficulties | 87.0 | 74.2 a | 89.0 b,c | 82.3 a,b | 90.8 c | <0.001 (0.125) |
| Yes with difficulties | 9.3 | 19.5 b | 6.5 a | 11.8 a,b | 7.4 a | ||
| No or only able with help | 3.7 | 6.3 b | 4.5 b | 5.9 b | 1.8 a | ||
| Ability to prepare own warm meal (n = 1781) ‡ | Yes without difficulties | 89.5 | 85.5 a | 92.5 b | 89.0 a,b | 93.8 b | <0.001 (0.084) |
| Yes with difficulties | 4.9 | 7.0 | 4.0 | 7.2 | 4.4 | ||
| No or only able with help | 5.6 | 7.5 b | 3.5 a,b | 3.8 a,b | 1.8 a | ||
| Presence of Health Problem(s) (% of Sample) | Total Sample | Strata (%) | p-Value (ϕc) | |||
|---|---|---|---|---|---|---|
| appi (12.2) | APpi (25.5) | apPI (14.8) | APPI (47.5) | |||
| Pain in mouth, teeth or gums (n = 1808) | 8.5 | 8.7 a,b,c | 6.9 a | 13.3 c | 7.7 a,b | 0.016 (0.076) |
| Dry mouth (n = 1817) | 16.3 | 21.4 b | 11.2 a | 21.8 b | 16.0 a,b | <0.001 (0.102) |
| Difficulty swallowing (n = 1821) | 3.2 | 6.8 b | 1.9 a | 5.2 a,b | 2.3 a | 0.001 (0.097) |
| Difficulty chewing (n = 1821) | 5.3 | 8.6 b,c | 4.3 a,b | 9.2 c | 3.8 a | 0.001 (0.099) |
| Cardiovascular disease (n = 1812) | 24.1 | 23.6 | 23.1 | 28.1 | 23.5 | 0.434 (0.039) |
| Hypertension (n = 1815) | 42.4 | 42.7 | 39.0 | 43.7 | 43.8 | 0.372 (0.042) |
| Irritable bowel syndrome (n = 1816) | 12.3 | 16.7 b | 8.4 a | 14.8 a,b | 12.5 a,b | 0.007 (0.082) |
| Other digestive problems (n = 1815) | 10.2 | 14.9 b | 8.2 a | 12.7 a,b | 9.4 a,b | 0.020 (0.074) |
| Diabetes/High blood sugar levels (n = 1820) | 19.2 | 23.6 a,b,c | 17.0 a | 26.6 c | 17.0 a,b | 0.001 (0.095) |
| High blood cholesterol (n = 1813) | 29.5 | 33.5 | 27.9 | 29.6 | 29.2 | 0.514 (0.036) |
| Cancer (n = 1812) | 5.5 | 6.8 a,b | 3.7 a | 8.5 b | 5.1 a,b | 0.033 (0.069) |
| Food allergy (n = 1820) | 6.7 | 7.7 | 6.9 | 8.9 | 5.7 | 0.278 (0.046) |
| Food intolerance (n = 1819) | 7.2 | 9.5 | 6.0 | 10.0 | 6.4 | 0.083 (0.061) |
| Chronic kidney disease (n = 1820) | 2.3 | 4.1 | 1.9 | 3.7 | 1.5 | 0.041 (0.067) |
| Other chronic diseases or pain in general (n = 1811) | 20.5 | 23.3 a,b,c | 19.2 b | 28.1 c | 18.2 a,b | 0.003 (0.088) |
| Knowledge and Attitude (% of Sample) | Total Sample | Strata (%) | p-Value (ϕc) | ||||
|---|---|---|---|---|---|---|---|
| appi (12.2) | APpi (25.5) | apPI (14.8) | APPI (47.5) | ||||
| Claiming to know what dietary protein is | Yes | 64.7 | 53.2 a | 59.9 a,b | 66.1 b,c | 69.7 c | <0.001 (0.123) |
| No | 35.3 | 46.8 c | 40.1 b,c | 33.9 a,b | 30.3 a | ||
| Objective knowledge score about dietary protein (medians) (effect size: ηp2) (n = 1180) | 5.00 | 3.00 a | 4.00 a | 5.00 b | 5.00 b | <0.001 (0.021) | |
| Food fussiness (medians) (effect size: ηp2) | 2.29 | 2.57 b | 2.29 a | 2.43 b | 2.29 a | <0.001 (0.026) | |
| Perceived amount of protein in current diet | Too much | 7.0 | 3.2 | 6.7 | 6.6 | 8.2 | <0.001 (0.111) |
| Just about right | 74.4 | 58.1 a | 64.6 a | 61.3 a | 73.3 b | ||
| Too little | 15.1 | 24.7 b | 13.9 a | 22.1 b | 11.0 a | ||
| Do not know | 10.5 | 14.0 b | 14.8 b | 10.0 a,b | 7.5 a | ||
| Intention to change the amount of protein in diet | Yes, increase | 10.0 | 10.8 a,b | 7.7 a | 14.0 b | 9.7 a,b | <0.001 (0.081) |
| Yes, decrease | 4.9 | 2.7 | 4.7 | 4.4 | 5.8 | ||
| No, remain the same | 66.4 | 59.5 a | 67.0 a,b | 59.0 a | 70.1 b | ||
| Do not know | 18.7 | 27.0 b | 20.6 b | 22.5 b | 14.4 a | ||
| Would increase amount of protein in diet if told by (% yes) | Health professional | 76.2 | 67.6 a | 77.9 b | 73.1 a,b | 78.4 b | 0.002 (0.075) |
| Food industry | 4.8 | 3.6 | 2.8 | 6.6 | 5.7 | 0.086 (0.055) | |
| Family | 21.7 | 23.0 a,b | 17.4 a | 27.3 b | 21.9 a,b | 0.041 (0.060) | |
| Friends | 15.7 | 15.8 a,b | 11.8 a | 19.2 b | 16.6 a,b | 0.051 (0.059) | |
| Physical Activities (% of Sample) | Total Sample | Strata (%) | p-Value (ϕc) | ||||
|---|---|---|---|---|---|---|---|
| appi (12.2) | APpi (25.5) | apPI (14.8) | APPI (47.5) | ||||
| Willingness to change daily physical activity pattern | Yes | 32.1 | 33.3 | 31.1 | 32.1 | 32.3 | <0.001 (0.112) |
| No | 34.0 | 23.0 a | 27.3 a | 38.7 b | 39.0 b | ||
| Not applicable | 33.9 | 43.7 b | 41.6 b | 29.2 a | 28.6 a | ||
| Self-efficacy towards physical activity (medians) (effect size: ηp2) | 2.87 | 2.47 a | 3.00 b | 2.73 a | 2.93 b | <0.001 (0.035) | |
| Poor Appetite (Model 1, n = 485) | Good Appetite (Model 2, n = 1263) | |||||||||
|---|---|---|---|---|---|---|---|---|---|---|
| b | SE | β | BCa 95% CI | b | SE | β | BCa 95% CI | |||
| Lower | Upper | Lower | Upper | |||||||
| (Constant) | 0.155 ** | 0.027 | 0.103 | 0.208 | 0.252 ** | 0.017 | 0.218 | 0.291 | ||
| Food expenses less than 60 EUR per week# | 0.104 * | 0.029 | 0.157 | 0.050 | 0.162 | 0.041 * | 0.017 | 0.070 | 0.009 | 0.076 |
| Smoking | −0.061 * | 0.019 | −0.081 | −0.100 | −0.024 | |||||
| Diet-related habits | ||||||||||
| No consumption of milk or yogurt | 0.193 ** | 0.039 | 0.231 | 0.112 | 0.272 | 0.163 ** | 0.025 | 0.191 | 0.117 | 0.213 |
| No consumption of nuts or seeds | 0.124 ** | 0.028 | 0.186 | 0.070 | 0.180 | 0.171 ** | 0.017 | 0.280 | 0.138 | 0.205 |
| Consumption of warm meal during lunch | −0.126 ** | 0.015 | −0.222 | −0.155 | −0.097 | |||||
| Consumption of soup during mid-afternoon snack | −0.078 * | 0.030 | −0.068 | −0.134 | −0.015 | |||||
| Consumption of milk or yogurt during mid-afternoon snack | −0.060 * | 0.019 | −0.072 | −0.098 | −0.023 | |||||
| Consumption of fruits during dinner | −0.117 ** | 0.034 | −0.144 | −0.183 | −0.055 | |||||
| Consumption of dessert during dinner | 0.084 ** | 0.027 | 0.127 | 0.033 | 0.135 | |||||
| Consumption of cold meal during evening snack | −0.094 * | 0.031 | −0.121 | −0.152 | −0.034 | −0.073 ** | 0.018 | −0.092 | −0.109 | −0.040 |
| Consumption of fruits during evening snack | 0.045 * | 0.017 | 0.074 | 0.012 | 0.078 | |||||
| Physical activity | ||||||||||
| Low physical activity level | 0.180 ** | 0.037 | 0.229 | 0.104 | 0.252 | |||||
| Moderate physical activity level | 0.073 * | 0.029 | 0.108 | 0.022 | 0.133 | |||||
| Performing vigorous physical activities between lunch and dinner | −0.054 * | 0.018 | −0.072 | −0.088 | −0.017 | |||||
© 2019 by the authors. Licensee MDPI, Basel, Switzerland. This article is an open access article distributed under the terms and conditions of the Creative Commons Attribution (CC BY) license (http://creativecommons.org/licenses/by/4.0/).
Share and Cite
Hung, Y.; Wijnhoven, H.A.H.; Visser, M.; Verbeke, W. Appetite and Protein Intake Strata of Older Adults in the European Union: Socio-Demographic and Health Characteristics, Diet-Related and Physical Activity Behaviours. Nutrients 2019, 11, 777. https://doi.org/10.3390/nu11040777
Hung Y, Wijnhoven HAH, Visser M, Verbeke W. Appetite and Protein Intake Strata of Older Adults in the European Union: Socio-Demographic and Health Characteristics, Diet-Related and Physical Activity Behaviours. Nutrients. 2019; 11(4):777. https://doi.org/10.3390/nu11040777
Chicago/Turabian StyleHung, Yung, Hanneke A. H. Wijnhoven, Marjolein Visser, and Wim Verbeke. 2019. "Appetite and Protein Intake Strata of Older Adults in the European Union: Socio-Demographic and Health Characteristics, Diet-Related and Physical Activity Behaviours" Nutrients 11, no. 4: 777. https://doi.org/10.3390/nu11040777
APA StyleHung, Y., Wijnhoven, H. A. H., Visser, M., & Verbeke, W. (2019). Appetite and Protein Intake Strata of Older Adults in the European Union: Socio-Demographic and Health Characteristics, Diet-Related and Physical Activity Behaviours. Nutrients, 11(4), 777. https://doi.org/10.3390/nu11040777