Profound Changes in Net Energy and Nitrogen Metabolites Fluxes within the Splanchnic Area during Overfeeding of Yucatan Mini Pigs That Remain Euglycemic

 , , and
Abstract
:1. Introduction
2. Materials and Methods
2.1. Animals and Experimental Procedure
2.2. Analytical Procedures
2.3. Calculations
2.4. Statistics
3. Results
3.1. Overfeeding, Impact on Pigs’ Weight, Insulin Levels, Alteration of Energy Nutrients Concentrations and Net Splanchnic Uptake in the Fasted and Fed States: Data Presented in Table 1, Table 2, Table 3, Table 4 and Table 5 and Figure 6 (for Insulin)
3.1.1. Energy Nutrients
3.1.2. Nitrogenous Nutrients
3.2. Overfeeding, Impact on Pigs’ Weight, Insulin Levels, Alteration of Energy Nutrient Concentrations, and Net Splanchnic Uptake in the Fed State. Data Presented in Figure 1, Figure 2, Figure 3, Figure 4, Figure 5 and Figure 6
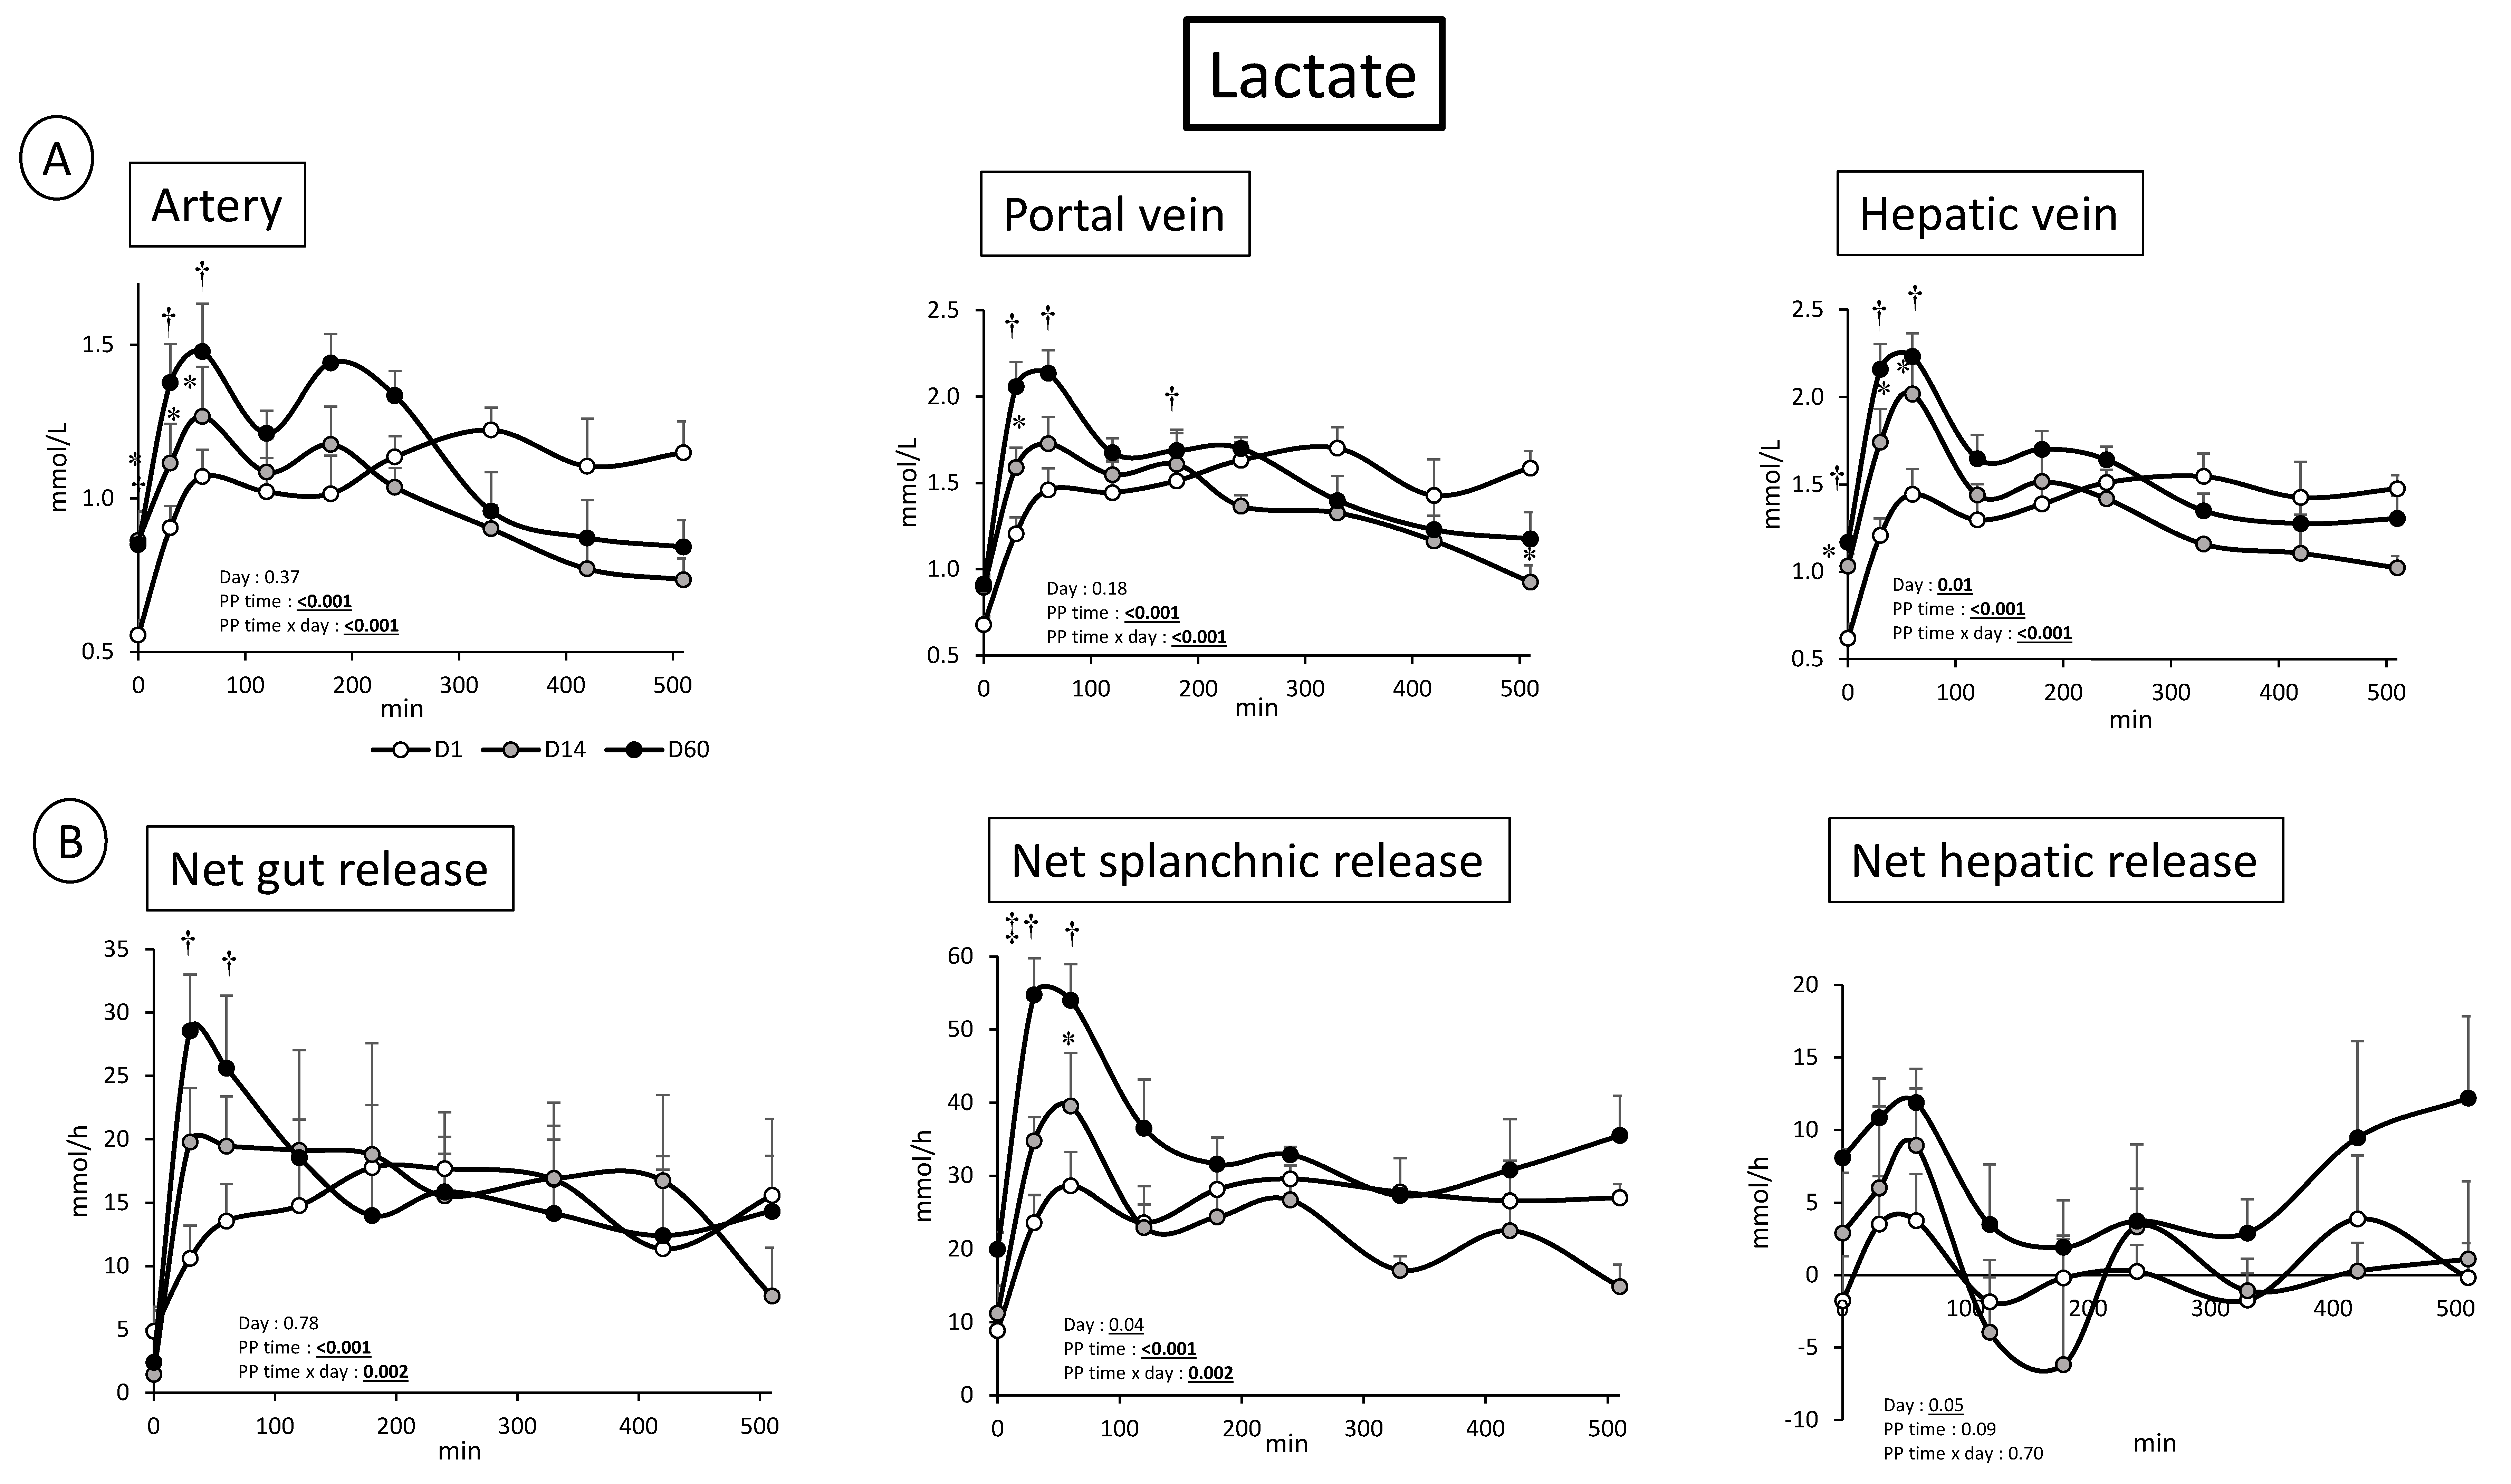
3.2.1. Energy Nutrients
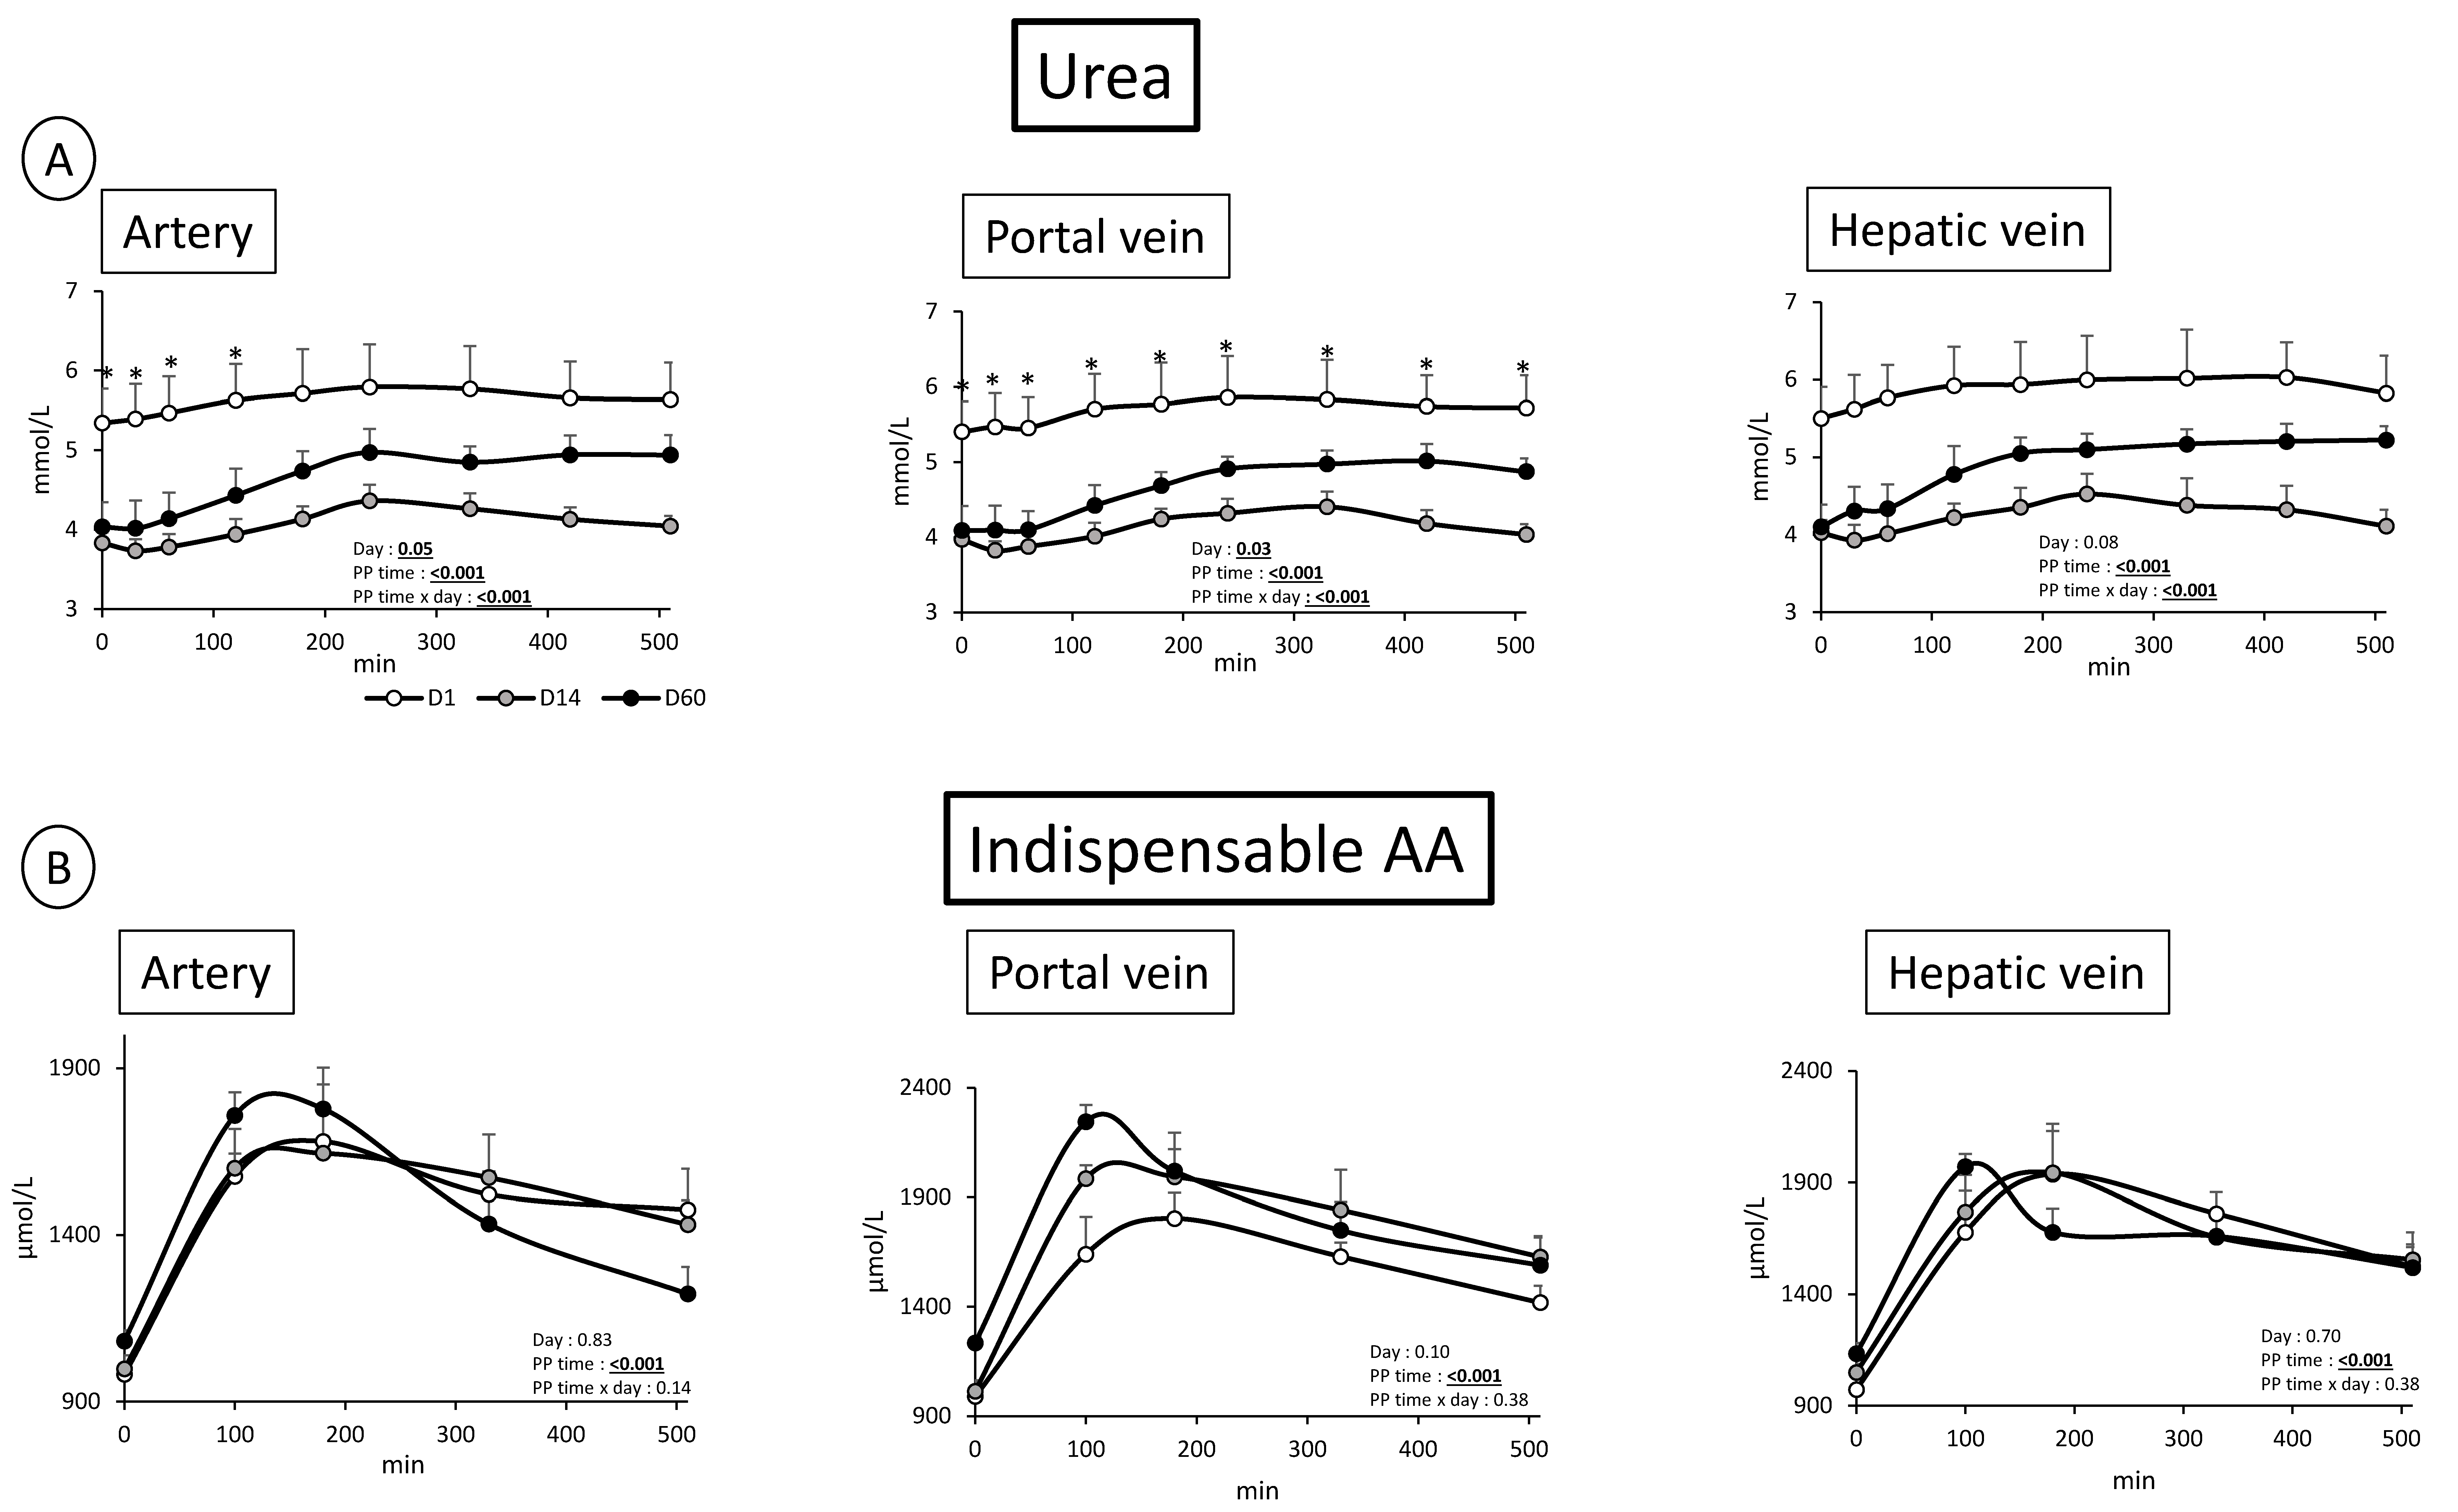
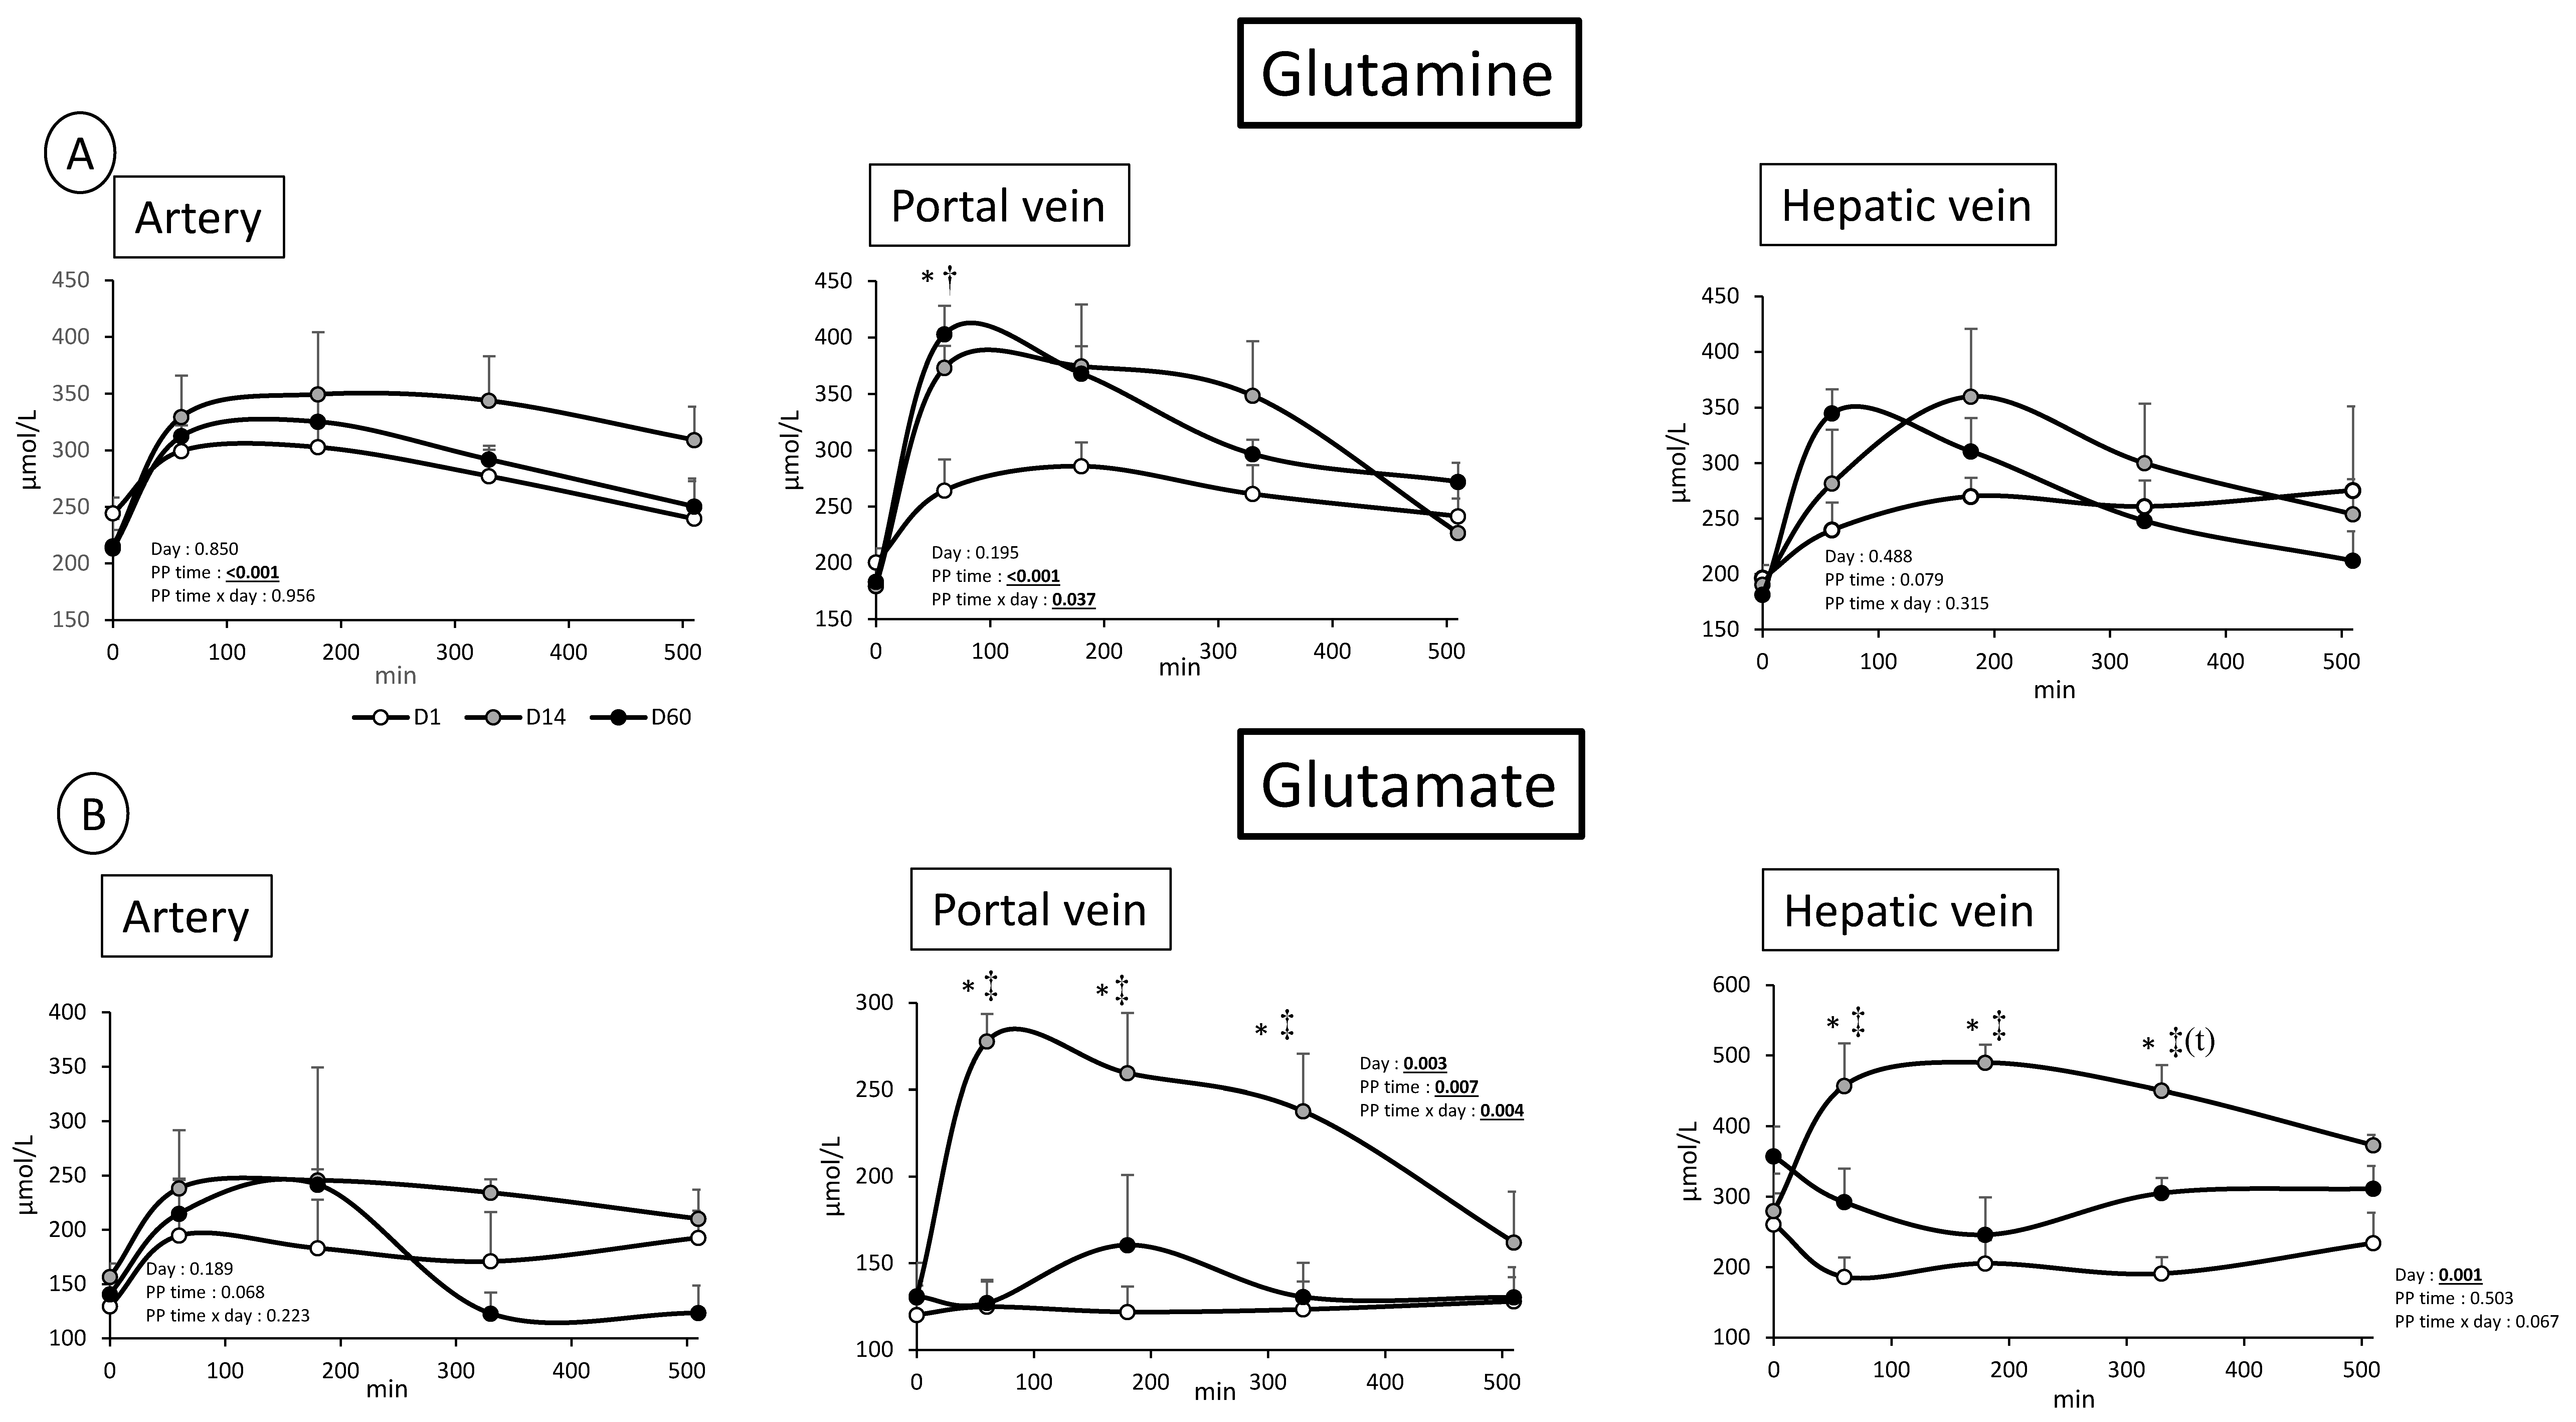
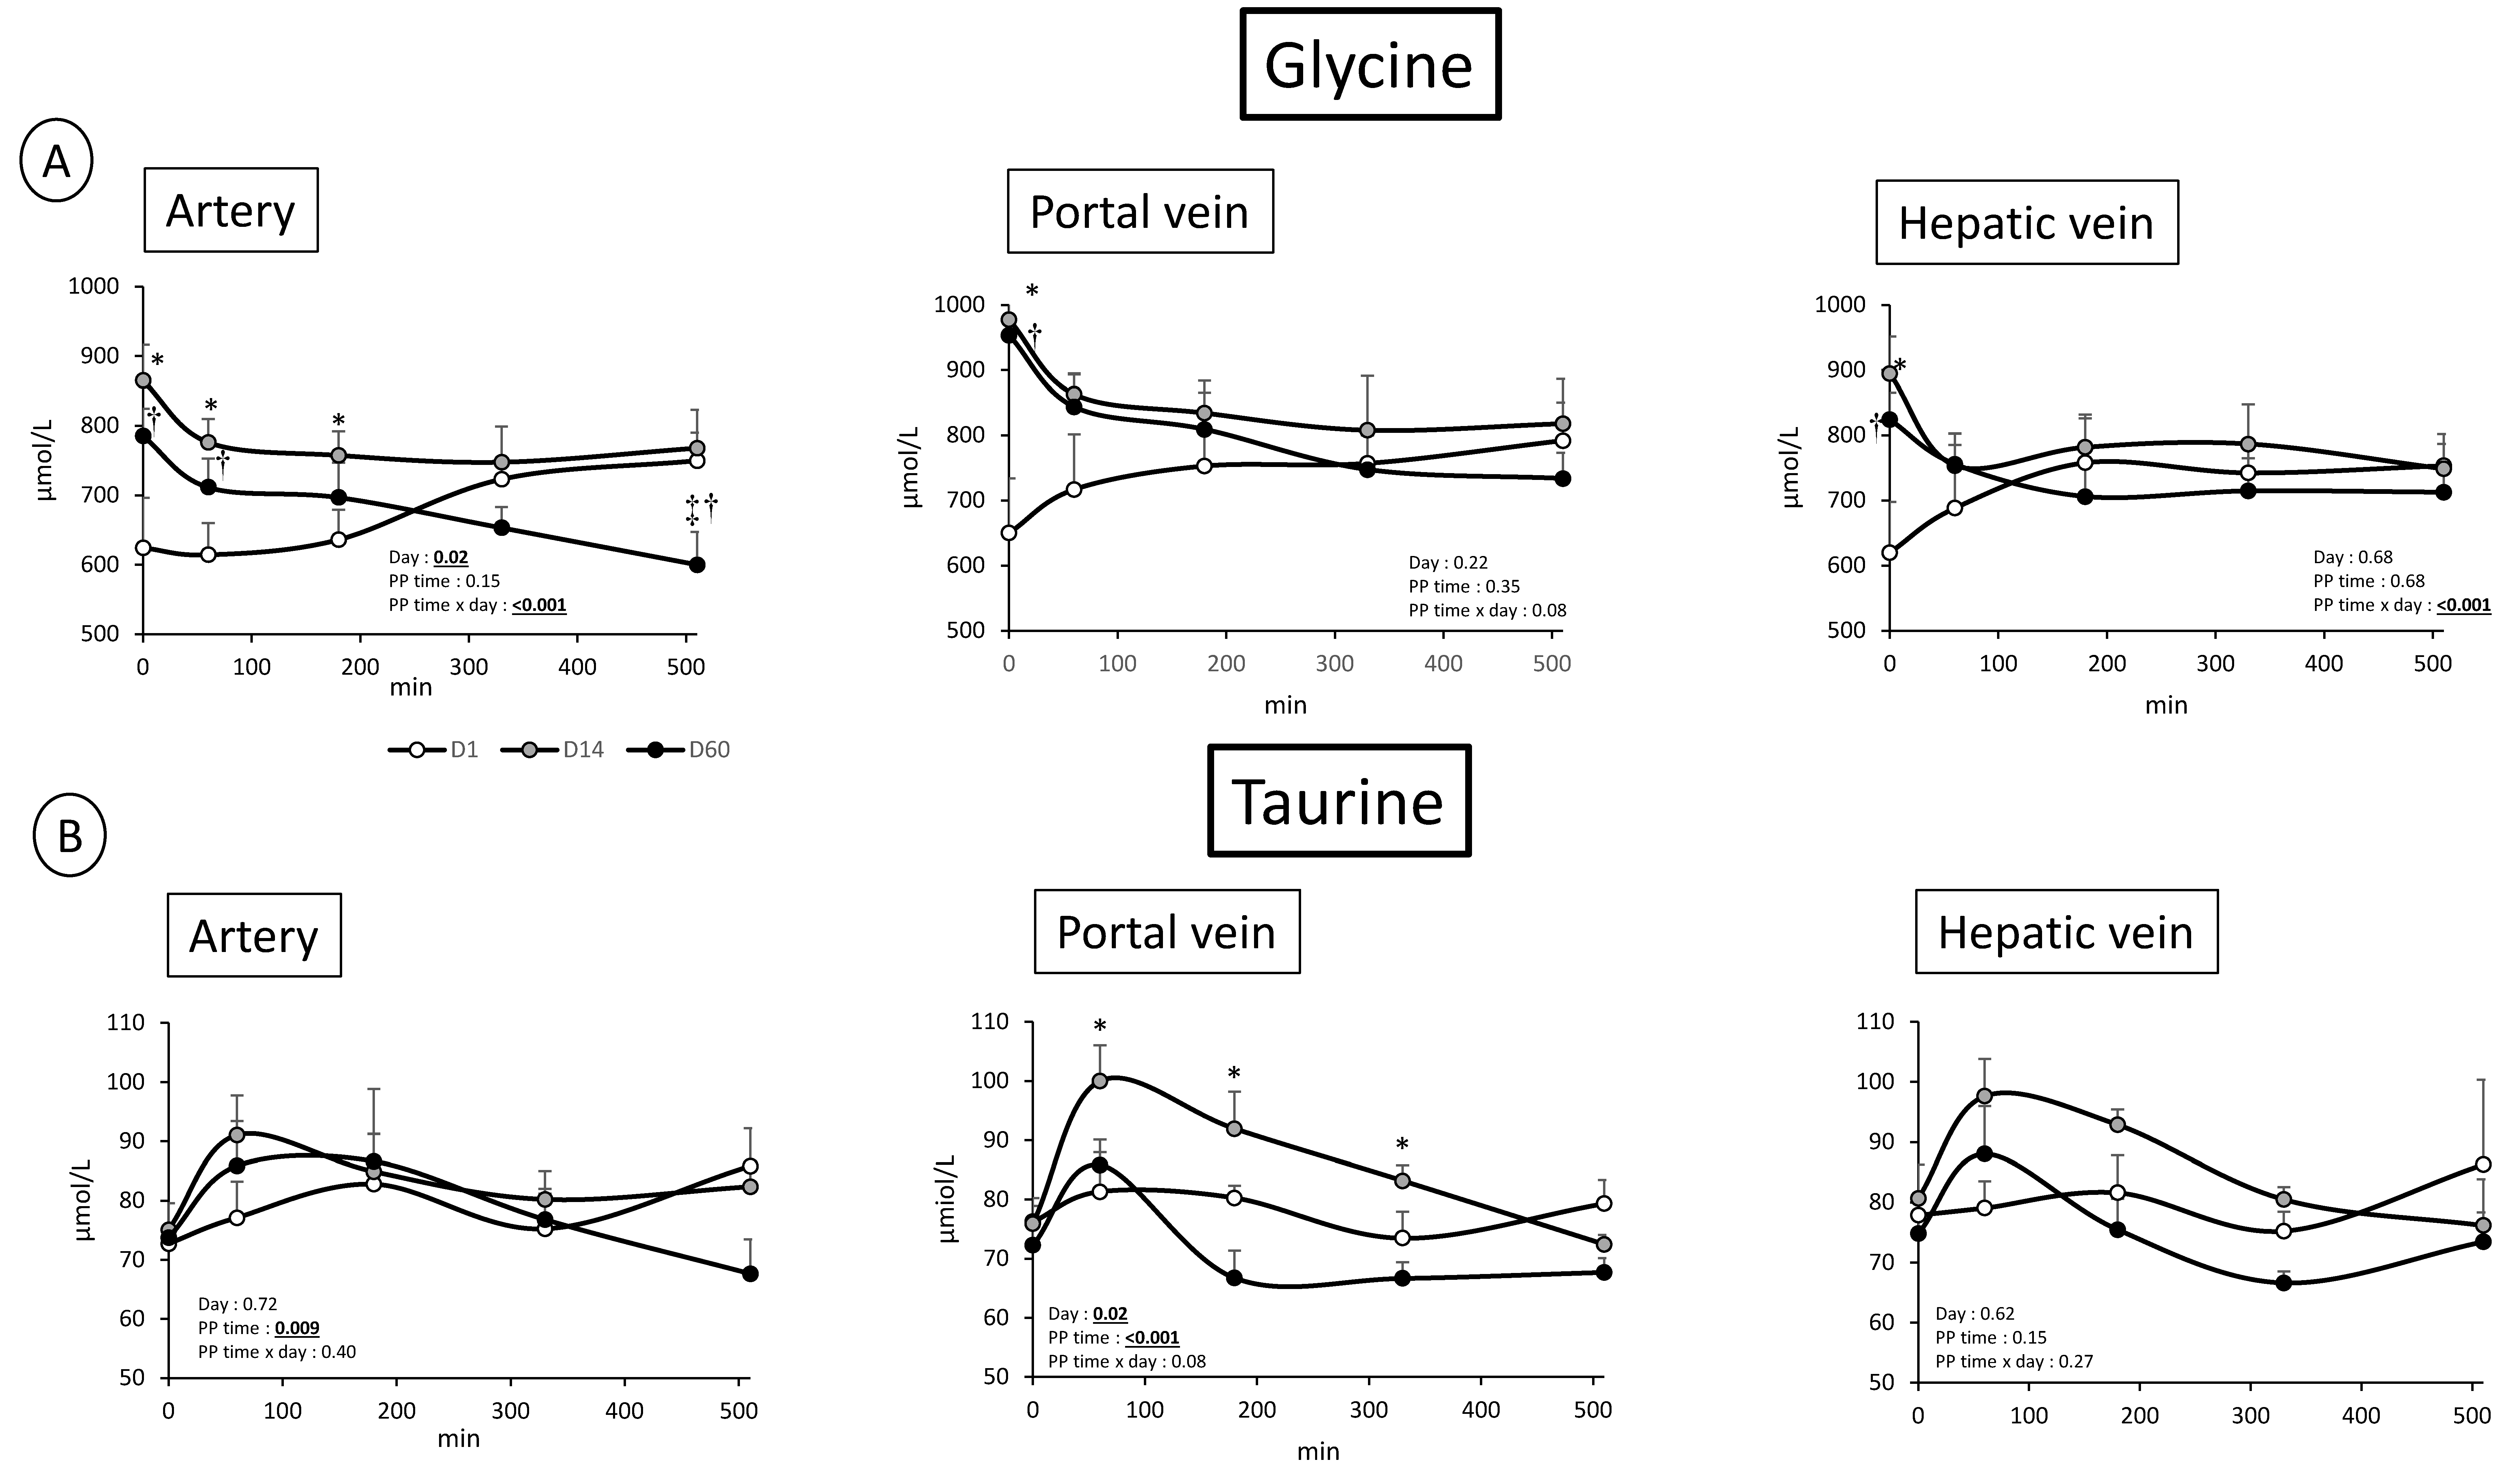
3.2.2. Nitrogenous Nutrients
4. Discussion
4.1. Metabolic Adaptations to Overfeeding in Pigs: Impact on Nitrogenous and Energy Nutrients at the Gut, Hepatic, and Whole Body Levels
4.2. Analysis of the Kinetics of Evolution of the Arterial Metabolites in Our Model of Overfed Mini Pigs
Author Contributions
Funding
Acknowledgments
Conflicts of Interest
References
- The GBD 2015 Obesity Collaborators. Health Effects of Overweight and Obesity in 195 Countries over 25 Years. N. Engl. J. Med. 2017, 377, 13–27. [Google Scholar] [CrossRef] [PubMed]
- Kim, M.S.; Lee, M.S.; Kown, D.Y. Inflammation-mediated obesity and insulin resistance as targets for nutraceuticals. Ann. N. Y. Acad. Sci. 2011, 1229, 140–146. [Google Scholar] [CrossRef] [PubMed]
- Newsholme, P.; Cruzat, V.; Arfuso, F.; Keane, K. Nutrient regulation of insulin secretion and action. J. Endocrinol. 2014, 221, R105–R120. [Google Scholar] [CrossRef] [PubMed]
- Morgan, K.; Uyuni, A.; Nandgiri, G.; Mao, L.; Castaneda, L.; Kathirvel, E.; French, S.W.; Morgan, T.R. Altered expression of transcription factors and genes regulating lipogenesis in liver and adipose tissue of mice with high fat diet-induced obesity and nonalcoholic fatty liver disease. Eur. J. Gastroenterol. Hepatol. 2008, 20, 843–854. [Google Scholar] [CrossRef] [PubMed]
- Trayhurn, P. Adipocyte biology. Obes. Rev. Off. J. Int. Assoc. Study Obes. 2007, 8 (Suppl. 1), 41–44. [Google Scholar] [CrossRef] [PubMed]
- Turner, N.; Cooney, G.J.; Kraegen, E.W.; Bruce, C.R. Fatty acid metabolism, energy expenditure and insulin resistance in muscle. J. Endocrinol. 2014, 220, T61–T79. [Google Scholar] [CrossRef] [PubMed]
- McNelis, J.C.; Olefsky, J.M. Macrophages, immunity, and metabolic disease. Immunity 2014, 41, 36–48. [Google Scholar] [CrossRef] [PubMed]
- Ley, R.E.; Turnbaugh, P.J.; Klein, S.; Gordon, J.I. Microbial ecology: human gut microbes associated with obesity. Nature 2006, 444, 1022–1023. [Google Scholar] [CrossRef] [PubMed]
- Le Chatelier, E.; Nielsen, T.; Qin, J.; Prifti, E.; Hildebrand, F.; Falony, G.; Almeida, M.; Arumugam, M.; Batto, J.M.; Kennedy, S.; et al. Richness of human gut microbiome correlates with metabolic markers. Nature 2013, 500, 541–546. [Google Scholar] [CrossRef] [PubMed]
- Konrad, D.; Wueest, S. The gut-adipose-liver axis in the metabolic syndrome. Physiology (Bethesda) 2014, 29, 304–313. [Google Scholar] [CrossRef] [PubMed]
- Youn, J.H.; Kim, J.K.; Buchanan, T.A. Time courses of changes in hepatic and skeletal muscle insulin action and GLUT4 protein in skeletal muscle after STZ injection. Diabetes 1994, 43, 564–571. [Google Scholar] [CrossRef] [PubMed]
- Picarel-Blanchot, F.; Berthelier, C.; Bailbe, D.; Portha, B. Impaired insulin secretion and excessive hepatic glucose production are both early events in the diabetic GK rat. Am. J. Physiol. 1996, 271, E755–E762. [Google Scholar] [CrossRef] [PubMed]
- Mithieux, G. Metabolic effects of portal vein sensing. Diabetes Obes. Metab. 2014, 16 (Suppl. 1), 56–60. [Google Scholar] [CrossRef] [PubMed]
- Item, F.; Konrad, D. Visceral fat and metabolic inflammation: The portal theory revisited. Obes. Rev. 2012, 13 (Suppl. 2), 30–39. [Google Scholar] [CrossRef] [PubMed]
- Coate, K.C.; Kraft, G.; Shiota, M.; Smith, M.S.; Farmer, B.; Neal, D.W.; Williams, P.; Cherrington, A.D.; Moore, M.C. Chronic overeating impairs hepatic glucose uptake and disposition. Am. J. Physiol. Endocrinol. Metab. 2015, 308, E860–E867. [Google Scholar] [CrossRef] [PubMed]
- De Vadder, F.; Kovatcheva-Datchary, P.; Zitoun, C.; Duchampt, A.; Backhed, F.; Mithieux, G. Microbiota-Produced Succinate Improves Glucose Homeostasis via Intestinal Gluconeogenesis. Cell Metab. 2016, 24, 151–157. [Google Scholar] [CrossRef] [PubMed]
- Shen, J.; Obin, M.S.; Zhao, L. The gut microbiota, obesity and insulin resistance. Mol. Asp. Med. 2013, 34, 39–58. [Google Scholar] [CrossRef] [PubMed]
- Polakof, S.; Remond, D.; Bernalier-Donadille, A.; Rambeau, M.; Pujos-Guillot, E.; Comte, B.; Dardevet, D.; Savary-Auzeloux, I. Metabolic adaptations to HFHS overfeeding: How whole body and tissues postprandial metabolic flexibility adapt in Yucatan mini-pigs. Eur. J. Nutr. 2018, 57, 119–135. [Google Scholar] [CrossRef] [PubMed]
- Polakof, S.; Remond, D.; David, J.; Dardevet, D.; Savary-Auzeloux, I. Time-course changes in circulating branched-chain amino acid levels and metabolism in obese Yucatan minipig. Nutrition 2017, 50, 66–73. [Google Scholar] [CrossRef] [PubMed]
- Mohamed, A.B.; Rémond, D.; Chambon, C.; Sayd, T.; Hebraud, M.; Capel, F.; Cohade, B.; Hafnaoui, N.; Béchet, D.; Coudy-Gandilhon, C.; et al. A mix of dietary fermentable fibers improves lipids handling by the liver of overfed minipigs. J. Nutr. Biochem. 2018, 65, 72–82. [Google Scholar] [CrossRef] [PubMed]
- Katz, M.L.; Bergman, E.N. Simultaneous measurements of hepatic and portal venous blood flow in the sheep and dog. Am. J. Physiol. 1969, 216, 946–952. [Google Scholar] [CrossRef] [PubMed]
- Barbe, F.; Menard, O.; Le Gouar, Y.; Buffiere, C.; Famelart, M.H.; Laroche, B.; Le Feunteun, S.; Dupont, D.; Remond, D. The heat treatment and the gelation are strong determinants of the kinetics of milk proteins digestion and of the peripheral availability of amino acids. Food Chem. 2013, 136, 1203–1212. [Google Scholar] [CrossRef] [PubMed]
- Huntington, G.B. Portal blood flow and net absorption of ammonia-nitrogen, urea-nitrogen, and glucose in nonlactating Holstein cows. J. Dairy Sci. 1982, 65, 1155–1162. [Google Scholar] [CrossRef]
- Rodriguez-Lopez, J.M.; Cantalapiedra-Hijar, G.; Durand, D.; Isserty-Thomas, A.; Ortigues-Marty, I. Influence of the para-aminohippuric acid analysis method on the net hepatic flux of nutrients in lactating cows. J. Anim. Sci. 2014, 92, 1074–1082. [Google Scholar] [CrossRef] [PubMed]
- Pouteau, E.; Meirim, I.; Metairon, S.; Fay, L.B. Acetate, propionate and butyrate in plasma: Determination of the concentration and isotopic enrichment by gas chromatography/mass spectrometry with positive chemical ionization. J. Mass Spectrom. 2001, 36, 798–805. [Google Scholar] [CrossRef] [PubMed]
- Gallagher, E.J.; Leroith, D.; Karnieli, E. Insulin resistance in obesity as the underlying cause for the metabolic syndrome. Mount Sinai J. Med. 2010, 77, 511–523. [Google Scholar] [CrossRef] [PubMed]
- Wahren, J.; Ekberg, K. Splanchnic regulation of glucose production. Annu. Rev. Nutr. 2007, 27, 329–345. [Google Scholar] [CrossRef] [PubMed]
- Gastaldelli, A.; Baldi, S.; Pettiti, M.; Toschi, E.; Camastra, S.; Natali, A.; Landau, B.R.; Ferrannini, E. Influence of obesity and type 2 diabetes on gluconeogenesis and glucose output in humans: A quantitative study. Diabetes 2000, 49, 1367–1373. [Google Scholar] [CrossRef] [PubMed]
- Basu, R.; Chandramouli, V.; Dicke, B.; Landau, B.; Rizza, R. Obesity and type 2 diabetes impair insulin-induced suppression of glycogenolysis as well as gluconeogenesis. Diabetes 2005, 54, 1942–1948. [Google Scholar] [CrossRef] [PubMed]
- Canfora, E.E.; Meex, R.C.R.; Venema, K.; Blaak, E.E. Gut microbial metabolites in obesity, NAFLD and T2DM. Nat. Rev. Endocrinol. 2019. [Google Scholar] [CrossRef] [PubMed]
- Chu, H.; Duan, Y.; Yang, L.; Schnabl, B. Small metabolites, possible big changes: A microbiota-centered view of non-alcoholic fatty liver disease. Gut 2019, 68, 359–370. [Google Scholar] [CrossRef] [PubMed]
- Crawford, S.O.; Ambrose, M.S.; Hoogeveen, R.C.; Brancati, F.L.; Ballantyne, C.M.; Young, J.H. Association of lactate with blood pressure before and after rapid weight loss. Am. J. Hypertens. 2008, 21, 1337–1342. [Google Scholar] [CrossRef] [PubMed]
- Lovejoy, J.; Newby, F.D.; Gebhart, S.S.; DiGirolamo, M. Insulin resistance in obesity is associated with elevated basal lactate levels and diminished lactate appearance following intravenous glucose and insulin. Metabolism 1992, 41, 22–27. [Google Scholar] [CrossRef]
- Clara, R.; Schumacher, M.; Ramachandran, D.; Fedele, S.; Krieger, J.P.; Langhans, W.; Mansouri, A. Metabolic Adaptation of the Small Intestine to Short- and Medium-Term High-Fat Diet Exposure. J. Cell. Physiol. 2017, 232, 167–175. [Google Scholar] [CrossRef] [PubMed]
- Adeva-Andany, M.; Lopez-Ojen, M.; Funcasta-Calderon, R.; Ameneiros-Rodriguez, E.; Donapetry-Garcia, C.; Vila-Altesor, M.; Rodriguez-Seijas, J. Comprehensive review on lactate metabolism in human health. Mitochondrion 2014, 17, 76–100. [Google Scholar] [CrossRef] [PubMed]
- Sabater, D.; Agnelli, S.; Arriaran, S.; Fernandez-Lopez, J.A.; Romero Mdel, M.; Alemany, M.; Remesar, X. Altered nitrogen balance and decreased urea excretion in male rats fed cafeteria diet are related to arginine availability. BioMed Res. Int. 2014, 2014, 959420. [Google Scholar] [CrossRef] [PubMed]
- Herrero, M.C.; Angles, N.; Remesar, X.; Arola, L.; Blade, C. Splanchnic ammonia management in genetic and dietary obesity in the rat. Int. J. Obes. Relat. Metab. Disord. 1994, 18, 255–261. [Google Scholar] [PubMed]
- Alemany, M. The problem of nitrogen disposal in the obese. Nutr. Res. Rev. 2012, 25, 18–28. [Google Scholar] [CrossRef] [PubMed]
- Bertolo, R.F.; Burrin, D.G. Comparative aspects of tissue glutamine and proline metabolism. J. Nutr. 2008, 138, 2032S–2039S. [Google Scholar] [CrossRef] [PubMed]
- Van Der Schoor, S.R.; Reeds, P.J.; Stoll, B.; Henry, J.F.; Rosenberger, J.R.; Burrin, D.G.; Van Goudoever, J.B. The high metabolic cost of a functional gut. Gastroenterology 2002, 123, 1931–1940. [Google Scholar] [CrossRef] [PubMed]
- Ussar, S.; Haering, M.F.; Fujisaka, S.; Lutter, D.; Lee, K.Y.; Li, N.; Gerber, G.K.; Bry, L.; Kahn, C.R. Regulation of Glucose Uptake and Enteroendocrine Function by the Intestinal Epithelial Insulin Receptor. Diabetes 2017, 66, 886–896. [Google Scholar] [CrossRef] [PubMed]
- Burrin, D.G.; Stoll, B. Metabolic fate and function of dietary glutamate in the gut. Am. J. Clin. Nutr. 2009, 90, 850S–856S. [Google Scholar] [CrossRef] [PubMed]
- Solaas, K.; Ulvestad, A.; Soreide, O.; Kase, B.F. Subcellular organization of bile acid amidation in human liver: A key issue in regulating the biosynthesis of bile salts. J. Lipid Res. 2000, 41, 1154–1162. [Google Scholar] [PubMed]
- El Hafidi, M.; Perez, I.; Zamora, J.; Soto, V.; Carvajal-Sandoval, G.; Banos, G. Glycine intake decreases plasma free fatty acids, adipose cell size, and blood pressure in sucrose-fed rats. Am. J. Physiol. 2004, 287, R1387–R1393. [Google Scholar] [CrossRef] [PubMed]
- McCormack, S.E.; Shaham, O.; McCarthy, M.A.; Deik, A.A.; Wang, T.J.; Gerszten, R.E.; Clish, C.B.; Mootha, V.K.; Grinspoon, S.K.; Fleischman, A. Circulating branched-chain amino acid concentrations are associated with obesity and future insulin resistance in children and adolescents. Pediatr. Obes. 2013, 8, 52–61. [Google Scholar] [CrossRef] [PubMed]
- Perry, R.J.; Peng, L.; Barry, N.A.; Cline, G.W.; Zhang, D.; Cardone, R.L.; Petersen, K.F.; Kibbey, R.G.; Goodman, A.L.; Shulman, G.I. Acetate mediates a microbiome-brain-beta-cell axis to promote metabolic syndrome. Nature 2016, 534, 213–217. [Google Scholar] [CrossRef] [PubMed]
- Fernandes, J.; Vogt, J.; Wolever, T.M. Kinetic model of acetate metabolism in healthy and hyperinsulinaemic humans. Eur. J. Clin. Nutr. 2014, 68, 1067–1071. [Google Scholar] [CrossRef] [PubMed]
- Piloquet, H.; Ferchaud-Roucher, V.; Duengler, F.; Zair, Y.; Maugere, P.; Krempf, M. Insulin effects on acetate metabolism. Am. J. Physiol. Endocrinol. Metab. 2003, 285, E561–E565. [Google Scholar] [CrossRef] [PubMed]
- Mittendorfer, B.; Sidossis, L.S.; Walser, E.; Chinkes, D.L.; Wolfe, R.R. Regional acetate kinetics and oxidation in human volunteers. Am. J. Physiol. 1998, 274, E978–E983. [Google Scholar] [CrossRef] [PubMed]
- Karlsson, N.; Fellenius, E.; Kiessling, K.H. Influence of acetate on glucose metabolism in the perfused hind-quarter of the rat. Acta Physiol. Scand. 1976, 98, 347–355. [Google Scholar] [CrossRef] [PubMed]
- Nakamura, H.; Jinzu, H.; Nagao, K.; Noguchi, Y.; Shimba, N.; Miyano, H.; Watanabe, T.; Iseki, K. Plasma amino acid profiles are associated with insulin, C-peptide and adiponectin levels in type 2 diabetic patients. Nutr. Diabetes 2014, 4, e133. [Google Scholar] [CrossRef] [PubMed]
- Haufe, S.; Witt, H.; Engeli, S.; Kaminski, J.; Utz, W.; Fuhrmann, J.C.; Rein, D.; Schulz-Menger, J.; Luft, F.C.; Boschmann, M.; et al. Branched-chain and aromatic amino acids, insulin resistance and liver specific ectopic fat storage in overweight to obese subjects. Nutr. Metab. Cardiovasc. Dis. 2016, 26, 637–642. [Google Scholar] [CrossRef] [PubMed]
- Wijekoon, E.P.; Skinner, C.; Brosnan, M.E.; Brosnan, J.T. Amino acid metabolism in the Zucker diabetic fatty rat: Effects of insulin resistance and of type 2 diabetes. Can. J. Physiol. Pharmacol. 2004, 82, 506–514. [Google Scholar] [CrossRef] [PubMed]


| Parameter | Vessel | D1 | D14 | D60 | ANOVA |
|---|---|---|---|---|---|
| Pig’s weight | 31.52 ± 1.49 a | 35.70 ± 1.51 b | 45.16 ± 1.56 c | <0.001 | |
| Kg | |||||
| Glucose | A | 5.20 ± 0.35 | 5.46 ± 0.29 | 5.26 ± 0.11 | 0.85 |
| mmol/L | |||||
| Lactate | A | 0.55 ± 0.05 a | 0.86 ± 0.94 b | 0.85 ± 0.05 b(t) | 0.03 |
| mmol/L | |||||
| Urea | A | 5.34 ± 0.43 a | 3.83 ± 0.31 b | 4.04 ± 0.31 b(t) | 0.03 |
| mmol/L | |||||
| Triglycerides | A | 0.19 ± 0.01 | 0.25 ± 0.04 | 0.24 ± 0.05 | 0.15 |
| mmol/L | |||||
| Total | A | 1.76 ± 0.10 a | 2.79 ± 0.09 b | 2.53 ± 0.16 b | <0.001 |
| Cholesterol | |||||
| mmol/L | |||||
| LDL | A | 0.97 ± 0.03 a | 1.30 ± 0.02 b | 1.00 ± 0.08 a | <0.001 |
| Cholesterol | |||||
| mmol/L | |||||
| HDL | A | 0.67 ± 0.03 a | 1.28 ± 0.09 b | 1.06 ± 0.08 c | <0.001 |
| Cholesterol | |||||
| mmol/L | |||||
| Albumin | A | 536 ± 20 | 544 ± 14 | 537 ± 17 | 0.70 |
| µmol/L | |||||
| ALT | A | 29.7 ± 0.8 | 27.1 ± 1.8 | 25.4 ± 1.7 | 0.15 |
| U/L | |||||
| AST | A | 36.2 ± 4.2 | 37.9 ± 5.2 | 28.8 ± 2.3 | 0.36 |
| U/L | |||||
| Plasma flow | PV | 0.60 ± 0.05 | 0.69 ± 0.05 | 0.66 ± 0.03 | 0.37 |
| L/min | |||||
| Plasma flow | HV | 0.78 ± 0.03 | 0.82 ± 0.08 | 0.84 ± 0.01 | 0.80 |
| L/min | |||||
| Plasma flow | HA | 0.17 ± 0.02 | 0.13 ± 0.03 | 0.18 ± 0.03 | 0.34 |
| L/min |
| Metabolite | Vessel | D1 | D14 | D60 | ANOVA |
|---|---|---|---|---|---|
| Acetate (C2) | A | 552.3 ± 14.5 a | 572.1 ± 34.6 a | 761.8 ± 50.0 b | 0.02 |
| µmol/L | PV | 844.8 ± 53.8 | 897.0 ± 54.7 | 1000.2 ± 25.5 | 0.07 |
| HV | 744.5 ± 53.1 | 861.3 ± 81.2 | 896.2 ± 41.0 | 0.33 | |
| Propionate (C3) | A | 22.7 ± 0.5 | 26.8 ± 4.4 | 27.1 ± 4.4 | 0.50 |
| µmol/L | PV | 199.8 ± 22.6 | 232.0 ± 30.2 | 229.5 ± 16.7 | 0.50 |
| HV | 26.1 ± 1.2 a | 28.0 ± 2.7 ab | 32.0 ± 4.4 b(t) | 0.05 | |
| Butyrate (C4) | A | 2.0 ± 0.6 | 5.0 ± 1.4 | 2.8 ± 1.1 | 0.30 |
| µmol/L | PV | 63.0 ± 6.7 | 80.7 ± 11.1 | 81.0 ± 4.3 | 0.09 |
| HV | 14.4 ± 1.7 | 19.9 ± 6.5 | 15.4 ± 2.1 | 0.62 | |
| Isobutyrate | A | 2.3 ± 0.1 ab | 1.9 ± 0.19 b | 2.5 ± 0.2 a | 0.03 |
| µmol/L | PV | 15.3 ± 2.1 a | 11.1 ± 1.2 b(t) | 12.8 ± 0.2 ab | 0.08 |
| HV | 3.0 ± 0.2 | 1.8 ± 0.6 | 2.8 ± 0.3 | 0.20 | |
| Isovalerate | A | 1.8 ± 0.1 a | 1.6 ± 0.1 b | 2.0 ± 0.1 c | 0.002 |
| µmol/L | PV | 8.7 ± 1.4 | 7.0 ± 0.6 | 8.3 ± 0.2 | 0.12 |
| HV | 2.3 ± 0.3 | 2.5 ± 0.5 | 2.6 ± 0.2 | 0.37 | |
| C2+C3+C4 | A | 577 ± 17 a | 603 ± 40 a | 792 ± 55 b | 0.02 |
| µmol/L | PV | 1108 ± 81 | 1210 ± 91 | 1311 ± 32 | 0.09 |
| HV | 851 ± 50 | 909 ± 88 | 944 ± 37 | 0.46 |
| Metabolite | Vessel | D1 | D14 | D60 | ANOVA |
|---|---|---|---|---|---|
| Leucine | A | 145.2 ± 8.3 a | 146.9 ± 5.8 a | 172.0 ± 9.6 b | 0.03 |
| µmol/L | PV | 149.0 ± 10.5 a | 151.1 ± 7.3 a | 204.0 ± 7.2 b | 0.01 |
| HV | 150.2 ± 8.9 a | 161.0 ± 9.8 a | 190.8 ± 12.5 b(t) | 0.06 | |
| Isoleucine | A | 102.9 ± 8.0 a | 126.3 ± 2.6 b | 120.8 ± 2.2 b(t) | 0.03 |
| µmol/L | PV | 103.8 ± 10.7 a | 127.4 ± 2.5 ab | 139.3 ± 5.6 b(t) | 0.06 |
| HV | 104.2 ± 9.5 a | 137.8 ± 7.5 b(t) | 134.0 ± 7.0 b(t) | 0.05 | |
| Valine | A | 275.2 ± 14.5 a | 276.7 ± 12.0 a | 302.8 ± 16.9 b(t) | 0.06 |
| µmol/L | PV | 276.0 ± 15.0 a | 275.8 ± 11.8 a | 336.5 ± 5.2 b | 0.02 |
| HV | 279.8 ± 14.4 a | 285.3 ± 10.0 a | 323.4 ± 16.5 b(t) | 0.06 | |
| Lysine | A | 139.5 ± 14.4 | 157.7 ± 18.5 | 166.4 ± 5.0 | 0.37 |
| µmol/L | PV | 143.4 ± 18.5 | 164.2 ± 12.3 | 193.5 ± 10.0 | 0.24 |
| HV | 134.0 ± 15.7 | 167.8 ± 9.8 | 171.8 ± 9.9 | 0.08 | |
| Phenylalanine | A | 56.8 ± 2.1 a | 47.2 ± 2.0 b(t) | 53.0 ± 2.0 ab | 0.06 |
| µmol/L | PV | 58.8 ± 3.3 | 52.4 ± 3.7 | 66.0 ± 2.8 | 0.12 |
| HV | 54.4 ± 2.8 | 51.0 ± 3.0 | 53.2 ± 1.8 | 0.68 | |
| Methionine | A | 26.4 ± 2.3 a | 19.0 ± 0.8 b | 19.0 ± 0.4 b | 0.02 |
| µmol/L | PV | 26.0 ± 3.1 | 19.8 ± 0.9 | 22.8 ± 1.0 | 0.25 |
| HV | 22.2 ± 2.2 | 21.0 ± 1.5 | 19.8 ± 0.9 | 0.65 | |
| Threonine | A | 132.8 ± 13.2 | 123.2 ± 7.8 | 135.3 ± 4.9 | 0.43 |
| µmol/L | PV | 129.8 ± 12.2 | 123.6 ± 5.3 | 151.3 ± 6.9 | 0.25 |
| HV | 129.4 ± 9.4 | 123.0 ± 5.4 | 130.8 ± 6.6 | 0.97 | |
| Tryptophane | A | 28.0 ± 2.0 a | 30.8 ± 1.4 a | 35.8 ± 1.9 b(t) | 0.09 |
| µmol/L | PV | 27.8 ± 2.2 a | 27.6 ± 1.4 a | 36.0 ± 2.8 b(t) | 0.07 |
| HV | 27.0 ± 2.0 a | 35.5 ± 1.0 b(t) | 32.2 ± 2.7 ab | 0.05 | |
| Histidine | A | 74.0 ± 4.2 | 69.4 ± 2.5 | 76.3 ± 1.4 | 0.34 |
| µmol/L | PV | 75.0 ± 5.9 | 72.0 ± 2.2 | 84.8 ± 1.4 | 0.28 |
| HV | 71.0 ± 5.2 | 70.5 ± 1.0 | 78.0 ± 2.0 | 0.39 | |
| Alanine | A | 202.8 ± 31.5 | 216.4 ± 24.4 | 222.3 ± 19.6 | 0.93 |
| µmol/L | PV | 233.0 ± 42.7 | 268.8 ± 26.4 | 286.0 ± 19.1 | 0.68 |
| HV | 158.0 ± 32.2 | 224.3 ± 21.5 | 215.4 ± 12.2 | 0.20 | |
| Glutamate | A | 129.6 ± 15.4 | 156.8 ± 12.3 | 140.8 ± 15.7 | 0.48 |
| µmol/L | PV | 120.2 ± 16.9 | 130.4 ± 9.5 | 131.0 ± 19.3 | 0.90 |
| HV | 280.8 ± 44.0 | 279.8 ± 53.2 | 357.4 ± 42.2 | 0.41 | |
| Glutamine | A | 244.5 ± 13.8 | 215.3 ± 24.2 | 213.5 ± 16.2 | 0.46 |
| µmol/L | PV | 200.4 ± 12.6 | 179.4 ± 12.4 | 183.3 ± 15.6 | 0.50 |
| HV | 196.4 ± 11.7 | 190.3 ± 9.9 | 181.3 ± 15.3 | 0.75 | |
| Glycine | A | 624.4 ± 72.2 a | 864.6 ± 51.9 b | 785.3 ± 39.2 b | 0.01 |
| µmol/L | PV | 650.2 ± 84.0 a | 977.2 ± 59.5 | 953.3 ± 19.5 | 0.007 |
| HV | 620.0 ± 78.2 a | 894.3 ± 57.3 b | 824.0 ± 41.5 | 0.001 | |
| Serine | A | 133.8 ± 7.2 a | 149.8 ± 4.3 ab | 165.8 ± 15.4 b(t) | 0.09 |
| µmol/L | PV | 130.4 ± 10.8 a | 152.6 ± 5.7 b(t) | 182.8 ± 13.0 c | 0.009 |
| HV | 132.4 ± 11.1 | 156.5 ± 10.6 | 158.4 ± 11.5 | 0.11 | |
| Tyrosine | A | 66.4 ± 7.7 | 62.0 ± 7.5 | 76.5 ± 12.2 | 0.28 |
| µmol/L | PV | 66.4 ± 7.0 a | 66.2 ± 9.3 ab | 79.0 ± 14.2 b(t) | 0.09 |
| HV | 60.0 ± 7.2 | 69.3 ± 12.0 | 68.2 ± 9.0 | 0.17 | |
| Cystine | A | 24.4 ± 2.6 | 22.2 ± 2.1 | 26.0 ± 0.9 | 0.66 |
| µmol/L | PV | 26.0 ± 3.8 | 25.2 ± 1.2 | 29.5 ± 0.5 | 0.74 |
| HV | 27.0 ± 3.3 | 23.0 ± 0.9 | 24.4 ± 2.3 | 0.75 | |
| Citrulline | A | 69.6 ± 5.9 | 77.4 ± 4.9 | 70.0 ± 4.3 | 0.38 |
| µmol/L | PV | 86.2 ± 8.3 | 92.8 ± 4.7 | 97.5 ± 5.3 | 0.52 |
| HV | 78.6 ± 6.6 | 92.3 ± 6.4 | 89.8 ± 5.1 | 0.13 | |
| Ornithine | A | 54.6 ± 4.7 a | 76.2 ± 7.6 b(t) | 68.0 ± 4.3 ab | 0.06 |
| µmol/L | PV | 61.8 ± 6.3 | 83.2 ± 8.9 | 77.8 ± 5.1 | 0.17 |
| HV | 59.6 ± 6.1 a | 86.5 ± 6.1 b | 75.6 ± 4.2 ab | 0.04 | |
| Arginine | A | 87.8 ± 6.0 | 87.4 ± 9.2 | 100.8 ± 4.6 | 0.60 |
| µmol/L | PV | 86.0 ± 12.0 | 93.4 ± 8.7 | 114.5 ± 4.5 | 0.32 |
| HV | 80.6 ± 9.4 | 98.8 ± 7.0 | 102.0 ± 4.2 | 0.20 | |
| Taurine | A | 72.7 ± 2.3 | 75.1 ± 4.5 | 73.8 ± 2.4 | 0.85 |
| µmol/L | PV | 76.3 ± 2.7 | 76.0 ± 4.3 | 74.0 ± 4.8 | 0.81 |
| HV | 77.1 ± 3.0 | 80.7 ± 5.6 | 74.8 ± 3.8 | 0.78 | |
| Proline | A | 215.8 ± 33.3 a | 379.2 ± 10.7 b | 379.0 ± 9.8 b | 0.003 |
| µmol/L | PV | 208.4 ± 26.5 a | 381.4 ± 6.6 b | 379.3 ± 40.6 b | 0.006 |
| HV | 229.8 ± 35.7 a | 394.8 ± 15.5 b | 402.6 ± 7.7 b | 0.002 | |
| 3-methyl histidine | A | 24.2 ± 0.6 ab | 21.2 ± 2.5 a | 28.5 ± 2.2 b(t) | 0.09 |
| µmol/L | PV | 24.2 ± 0.8 | 24.2 ± 1.2 | 25.3 ± 5.0 | 0.99 |
| HV | 26.0 ± 2.2 | 22.0 ± 2.4 | 29.6 ± 2.1 | 0.13 | |
| Carnosine | A | 16.8 ± 1.9 | 20.2 ± 2.3 | 18.5 ± 2.2 | 0.17 |
| µmol/L | PV | 17.8 ± 2.2 | 19.4 ± 1.5 | 18.0 ± 1.2 | 0.72 |
| HV | 20.6 ± 2.1 | 22.0 ± 2.9 | 20.4 ± 2.2 | 0.98 | |
| BCAA | A | 523.3 ± 29.2 a | 549.8 ± 19.4 ab | 595.6 ± 28.5 b(t) | 0.07 |
| µmol/L | PV | 528.8 ± 35.3 a | 554.3 ± 20.0 a | 679.8 ± 16.2 b | 0.03 |
| HV | 534.2 ± 31.6 a | 581.0 ± 24.3 ab | 648.2 ± 35.0 b(t) | 0.06 | |
| IAA | A | 985.9 ± 57.8 | 997.1 ± 41.8 | 1081.2 ± 32.9 | 0.22 |
| µmol/L | PV | 989.6 ± 73.7 | 1009.9 ± 43.85 | 1234.0 ± 33.4 | 0.09 |
| HV | 972 ± 58.8 | 1044.5 ± 38.6 | 1107.8 ± 48.9 | 0.19 | |
| NIAA | A | 1877.9 ± 102.3 a | 2330.3 ± 120.7 b | 2276.2 ± 14.3 b(t) | 0.03 |
| µmol/L | PV | 1873.2 ± 145.9 a | 2474.8 ± 123.8 b | 2539.1 ± 85.7 b | 0.01 |
| HV | 1929.2 ± 165.4 a | 2530.5 ± 132.7 b | 2528.7 ± 95.3 b | 0.01 | |
| TAA | A | 2742.4 ± 147.0 a | 3198.4 ± 157.4 a | 3210.9 ± 44.8 b(t) | 0.07 |
| µmol/L | PV | 2771.0 ± 205.9 a | 3352.3 ± 161.7 b(t) | 3609.0 ± 88.2 b (t) | 0.04 |
| HV | 2789.8 ± 207.2 a | 3440.7 ± 160.5 b | 3498.7 ± 139.7 b | 0.03 |
| Metabolite | D1 | D14 | D60 | ANOVA | |
|---|---|---|---|---|---|
| Glucose | Gut | 6.84 ± 6.67 a | 22.45 ± 6.31 a | 33.41 ± 5.78 b(t) | 0.05 |
| mmol/h | Liver | 29.78 ± 7.32 | 31.60 ± 2.65 | 36.31 ± 11.17 | 0.51 |
| Splanchnic | 34.72 ± 12.18 | 50.81 ± 10.23 | 59.54 ± 15.16 | 0.56 | |
| Lactate | Gut | 4.85 ± 1.49 | 1.45 ± 1.14 | 2.04 ± 0.73 | 0.17 |
| mmol/h | Liver | −1.78 ± 3.08 a | 2.90 ± 4.15 a | 8.53 ± 0.63 b | 0.03 |
| Splanchnic | 2.85 ± 2.36 | 3.63 ± 4.36 | 10.57 ± 0.77 | 0.09 | |
| Urea | Gut | 1.78 ± 0.89 | 5.74 ± 1.92 | 2.24 ± 3.49 | 0.47 |
| mmol/h | Liver | 7.11 ± 2.45 | 3.36 ± 1.47 | 6.60 ± 2.57 | 0.49 |
| Splanchnic | 7.10 ± 1.55 | 9.69 ± 0.94 | 9.31 ± 2.29 | 0.32 | |
| Acetate | Gut | 10,645 ± 1736 | 12,921 ± 1738 | 8717 ± 1563 | 0.47 |
| µmol/h | Liver | −722 ± 2416 | 689 ± 1607 | −418 ± 1205 | 0.42 |
| Splanchnic | 9984 ± 1916 | 14,635 ± 3153 | 8299 ± 2739 | 0.26 | |
| Propionate | Gut | 6193 ± 688 | 8210 ± 1038 | 8227 ± 664 | 0.09 |
| µmol/h | Liver | −6447 ± 817 | −8822 ± 622 | −8191 ± 1205 | 0.11 |
| Splanchnic | 164 ± 55 | 252 ± 119 | 35 ± 130 | 0.57 | |
| Butyrate | Gut | 2176 ± 296 a | 3048 ± 295 b(t) | 3121 ± 189 b(t) | 0.05 |
| µmol/h | Liver | −1583 ± 357 | −2362 ± 280 | −2515 ± 187 | 0.23 |
| Splanchnic | 581 ± 84 | 747 ± 216 | 607 ± 122 | 0.79 | |
| Isobutyrate | Gut | 465 ± 86 | 375 ± 46 | 414 ± 29 | 0.37 |
| µmol/h | Liver | −428 ± 99 | −386 ± 32 | −409 ± 27 | 0.64 |
| Splanchnic | 31 ± 16 | 4 ± 29 | 5 ± 16 | 0.71 | |
| Isovalerate | Gut | 252 ± 51 | 218 ± 18 | 253 ± 13 | 0.56 |
| µmol/h | Liver | −227 ± 53 | −177 ± 15 | −229 ± 20 | 0.54 |
| Splanchnic | 27 ± 15 | 44 ± 17 | 24 ± 9 | 0.85 | |
| C2+C3+C4 | Gut | 19,014 ± 2608 | 24,179 ± 2961 | 20,065 ± 816 | 0.50 |
| µmol/h | Liver | −8476 ± 4498 | −10,494 ± 961 | −11,124 ± 1948 | 0.87 |
| Splanchnic | 12,173 ± 1550 | 15,634 ± 3346 | 8942 ± 2720 | 0.40 |
| Metabolite | Area | D1 | D14 | D60 | ANOVA |
|---|---|---|---|---|---|
| Leucine | Gut | 147 ± 227 | 188 ± 133 | 793 ± 37 | 0.28 |
| µmol/h | Liver | 152 ± 84 | 343 ± 566 | −71 ± 167 | 0.93 |
| Splanchnic | 246 ± 182 | 620 ± 531 | 586 ± 194 | 0.86 | |
| Isoleucine | Gut | 37 ± 143 | 46 ± 83 | 423 ± 21 | 0.27 |
| µmol/h | Liver | 71 ± 61 | 290 ± 367 | −13 ± 141 | 0.84 |
| Splanchnic | 70 ± 116 | 388 ± 357 | 343 ± 120 | 0.76 | |
| Valine | Gut | 46 ± 265 | −38 ± 71 | 619 ± 159 | 0.20 |
| µmol/h | Liver | 291 ± 75 | 446 ± 625 | 54 ± 237 | 0.97 |
| Splanchnic | 238 ± 254 | 427 ± 592 | 623 ± 156 | 0.90 | |
| Lysine | Gut | 154 ± 218 | 248 ± 110 | 816 ± 47 | 0.22 |
| µmol/h | Liver | −341 ± 90 | −31 ± 407 | −948 ± 111 | 0.24 |
| Splanchnic | −238 ± 186 | 280 ± 391 | −160 ± 101 | 0.55 | |
| Phenylalanine | Gut | 81 ± 142 | 230 ± 131 | 563 ± 104 | 0.37 |
| µmol/h | Liver | −161 ± 89 | −145 ± 207 | −512 ± 27 | 0.36 |
| Splanchnic | −101 ± 110 | −157 ± 125 | −1 ± 75 | 0.51 | |
| Methionine | Gut | −9 ± 61 | 2 ± 24 | 121 ± 26 | 0.61 |
| µmol/h | Liver | −157 ± 92 | 84 ± 71 | −105 ± 62 | 0.53 |
| Splanchnic | −176 ± 108 | 110 ± 44 | −1 ± 35 | 0.1 | |
| Threonine | Gut | −64 ± 198 | −8 ± 119 | 359 ± 37 | 0.55 |
| µmol/h | Liver | 20 ± 268 | −6 ± 274 | −639 ± 240 | 0.3 |
| Splanchnic | −97 ± 423 | 43 ± 328 | −307 ± 106 | 0.76 | |
| Tryptophane | Gut | −3 ± 32 ab | −123 ± 30 b | 111 ± 68 a | 0.03 |
| µmol/h | Liver | −29 ± 10 ab | 305 ± 136 b | −328 ± 218 a(t) | 0.05 |
| Splanchnic | −43 ± 31 | 166 ± 139 | −189 ± 163 | 0.1 | |
| Histidine | Gut | 42 ± 114 | 105 ± 42 | 319 ± 37 | 0.34 |
| µmol/h | Liver | −145 ± 30 | −35 ± 129 | −288 ± 90 | 0.38 |
| Splanchnic | −132 ± 110 | 97 ± 110 103 | 36 ± 110 58 | 0.47 | |
| Alanine | Gut | 1128 ± 583 | 2141 ± 447 | 2917 ± 719 | 0.23 |
| µmol/h | Liver | −3106 ± 680 | −2776 ± 1204 | −2989 ± 1263 | 0.93 |
| Splanchnic | −2065 ± 837 | −318 ± 965 | −810.4 ± 863 | 0.33 | |
| Glutamate | Gut | −357 ± 268 a | −1023 ± 228 b(t) | −567 ± 72 a | 0.04 |
| µmol/h | Liver | 6387 ± 1315 | 7692 ± 2556 | 9063 ± 273 | 0.68 |
| Splanchnic | 5976 ± 1502 | 6531 ± 2759 | 8926 ± 434 | 0.61 | |
| Glutamine | Gut | −1545 ± 265 | −1612 ± 547 | −1628 ± 248 | 0.90 |
| µmol/h | Liver | −468 ± 673 | 157 ± 413 | −440 ± 395 | 0.53 |
| Splanchnic | −2106 ± 757 | −1460 ± 1079 | −1888 ± 208 | 0.89 | |
| Glycine | Gut | 1049 ± 884 a | 4605 ± 978 b(t) | 5072 ± 1916 ab | 0.08 |
| µmol/h | Liver | −1003 ± 373 | −4675 ± 1412 | −4549 ± 2028 | 0.31 |
| Splanchnic | −170 ± 669 | 744 ± 977 | 562 ± 232 | 0.74 | |
| Serine | Gut | −110 ± 211 | 70 ± 246 | 428 ± 64 | 0.52 |
| µmol/h | Liver | 107 ± 84 | −99 ± 421 | −810 ± 193 | 0.32 |
| Splanchnic | −52 ± 288 | 103 ± 509 | −430 ± 104 | 0.58 | |
| Tyrosine | Gut | 7 ± 150 | 151 ± 89 | 371 ± 62 | 0.29 |
| µmol/h | Liver | −259 ± 96 | −167 ± 238 | −605 ± 160 | 0.51 |
| Splanchnic | −279 ± 141 | 21 ± 250 | −251 ± 79 | 0.64 | |
| Cystine | Gut | 49 ± 123 | 120 ± 35 | 168 ± 47 | 0.79 |
| µmol/h | Liver | 57 ± 137 | −141 ± 101 | −350 ± 135 | 0.39 |
| Splanchnic | 98 ± 208 | −46 ± 114 | −124 ± 93 | 0.94 | |
| Citrulline | Gut | 580 ± 107 | 662 ± 146 | 1029 ± 44 | 0.19 |
| µmol/h | Liver | −161 ± 202 | −88 ± 221 | −167 ± 130 | 0.82 |
| Splanchnic | 396 ± 184 | 581 ± 405 | 920 ± 108 | 0.38 | |
| Ornithine | Gut | 230 ± 84 | 293 ± 77 | 366 ± 48 | 0.79 |
| µmol/h | Liver | 5 ± 61 | −99 ± 115 | −68 ± 62 | 0.54 |
| Splanchnic | 261 ± 112 | 225 ± 61 | 315 ± 38 | 0.36 | |
| Arginine | Gut | −75 ± 231 | 234 ± 41 | 638 ± 74 | 0.14 |
| µmol/h | Liver | −218 ± 120 | −3 ± 181 | −623 ± 96 | 0.18 |
| Splanchnic | −324 ± 192 | 226 ± 184 | 38 ± 119 | 0.34 | |
| Taurine | Gut | 149 ± 80 | 24 ± 44 | 132 ± 162 | 0.65 |
| µmol/h | Liver | 144 ± 67 | 185 ± 170 | 22 ± 181 | 0.75 |
| Splanchnic | 223 ± 75 | 117 ± 121 | 225 ± 105 | 0.25 | |
| Proline | Gut | −237 ± 360 | −14 ± 370 | 108 ± 2154 | 0.97 |
| µmol/h | Liver | 955 ± 1483 | 555 ± 1110 | 695 ± 2464 | 0.21 |
| Splanchnic | 653 ± 1598 | 472 ± 1434 | 811 ± 376 | 0.95 | |
| 3-methyl | Gut | 1 ± 20 | 47 ± 31 | 28 ± 14 | 0.27 |
| histidine | Liver | 75 ± 97 | −102 ± 108 | 22 ± 18 | 0.21 |
| µmol/h | Splanchnic | 67 ± 94 | −73 ± 73 | 38 ± 24 | 0.31 |
| Carnosine | Gut | 39 ± 17 | −17 ± 67 | 40 ± 79 | 0.63 |
| µmol/h | Liver | 162 ± 144 | 101 ± 96 | 25 ± 73 | 0.77 |
| Splanchnic | 194 ± 147 | 44 ± 49 | 144 ± 57 | 0.47 | |
| BCAA | Gut | 230 ± 629 | 196 ± 279 | 1834 ± 147 | 0.23 |
| µmol/h | Liver | 553 ± 203 | 1079 ± 1556 | −29 ± 544 | 0.93 |
| Splanchnic | 533 ± 543 | 1435 ± 1474 | 1552 ± 448 | 0.88 | |
| IAA | Gut | 432 ± 1166 | 549 ± 586 | 4123 ± 299 | 0.17 |
| µmol/h | Liver | −300 ± 618 | 1120 ± 2610 | −5185 ± 1781 | 0.28 |
| Splanchnic | −235 ± 1239 | 2026 ± 2115 | −816 ± 1210 | 0.61 | |
| NIAA | Gut | 720 ± 2330 | 5674 ± 1476 | 8962 ± 5024 | 0.14 |
| µmol/h | Liver | 2371 ± 2231 | 257 ± 4121 | −821 ± 6378 | 0.93 |
| Splanchnic | 2409 ± 3985 | 7005 ± 3836 | 8118 ± 1275 | 0.64 | |
| TAA | Gut | 1307 ± 3243 | 6141 ± 1766 | 12,704 ± 5186 | 0.15 |
| µmol/h | Liver | 2099 ± 1873 | 1542 ± 6094 | −5203 ± 6534 | 0.80 |
| Splanchnic | 2400 ± 4524 | 8945 ± 5525 | 7822 ± 1020 | 0.77 |
© 2019 by the authors. Licensee MDPI, Basel, Switzerland. This article is an open access article distributed under the terms and conditions of the Creative Commons Attribution (CC BY) license (http://creativecommons.org/licenses/by/4.0/).
Share and Cite
Savary-Auzeloux, I.; Mohamed, A.-B.; Cohade, B.; Dardevet, D.; David, J.; Hafnaoui, N.; Migné, C.; Pujos-Guillot, E.; Rémond, D.; Polakof, S. Profound Changes in Net Energy and Nitrogen Metabolites Fluxes within the Splanchnic Area during Overfeeding of Yucatan Mini Pigs That Remain Euglycemic. Nutrients 2019, 11, 434. https://doi.org/10.3390/nu11020434
Savary-Auzeloux I, Mohamed A-B, Cohade B, Dardevet D, David J, Hafnaoui N, Migné C, Pujos-Guillot E, Rémond D, Polakof S. Profound Changes in Net Energy and Nitrogen Metabolites Fluxes within the Splanchnic Area during Overfeeding of Yucatan Mini Pigs That Remain Euglycemic. Nutrients. 2019; 11(2):434. https://doi.org/10.3390/nu11020434
Chicago/Turabian StyleSavary-Auzeloux, Isabelle, Ahmed-Ben Mohamed, Benoit Cohade, Dominique Dardevet, Jérémie David, Noureddine Hafnaoui, Carole Migné, Estelle Pujos-Guillot, Didier Rémond, and Sergio Polakof. 2019. "Profound Changes in Net Energy and Nitrogen Metabolites Fluxes within the Splanchnic Area during Overfeeding of Yucatan Mini Pigs That Remain Euglycemic" Nutrients 11, no. 2: 434. https://doi.org/10.3390/nu11020434
APA StyleSavary-Auzeloux, I., Mohamed, A.-B., Cohade, B., Dardevet, D., David, J., Hafnaoui, N., Migné, C., Pujos-Guillot, E., Rémond, D., & Polakof, S. (2019). Profound Changes in Net Energy and Nitrogen Metabolites Fluxes within the Splanchnic Area during Overfeeding of Yucatan Mini Pigs That Remain Euglycemic. Nutrients, 11(2), 434. https://doi.org/10.3390/nu11020434