Plasma versus Erythrocyte Vitamin E in Renal Transplant Recipients, and Duality of Tocopherol Species

 ,
,  , ,
, , 
Abstract
:1. Introduction
2. Materials and Methods
2.1. Study Design and Population
2.2. Data Collection, and Clinical and Laboratory Measurements
2.2.1. Vitamin E in Plasma
2.2.2. Vitamin E in Erythrocytes
2.3. Statistical Analyses
3. Results
3.1. Baseline Characteristics
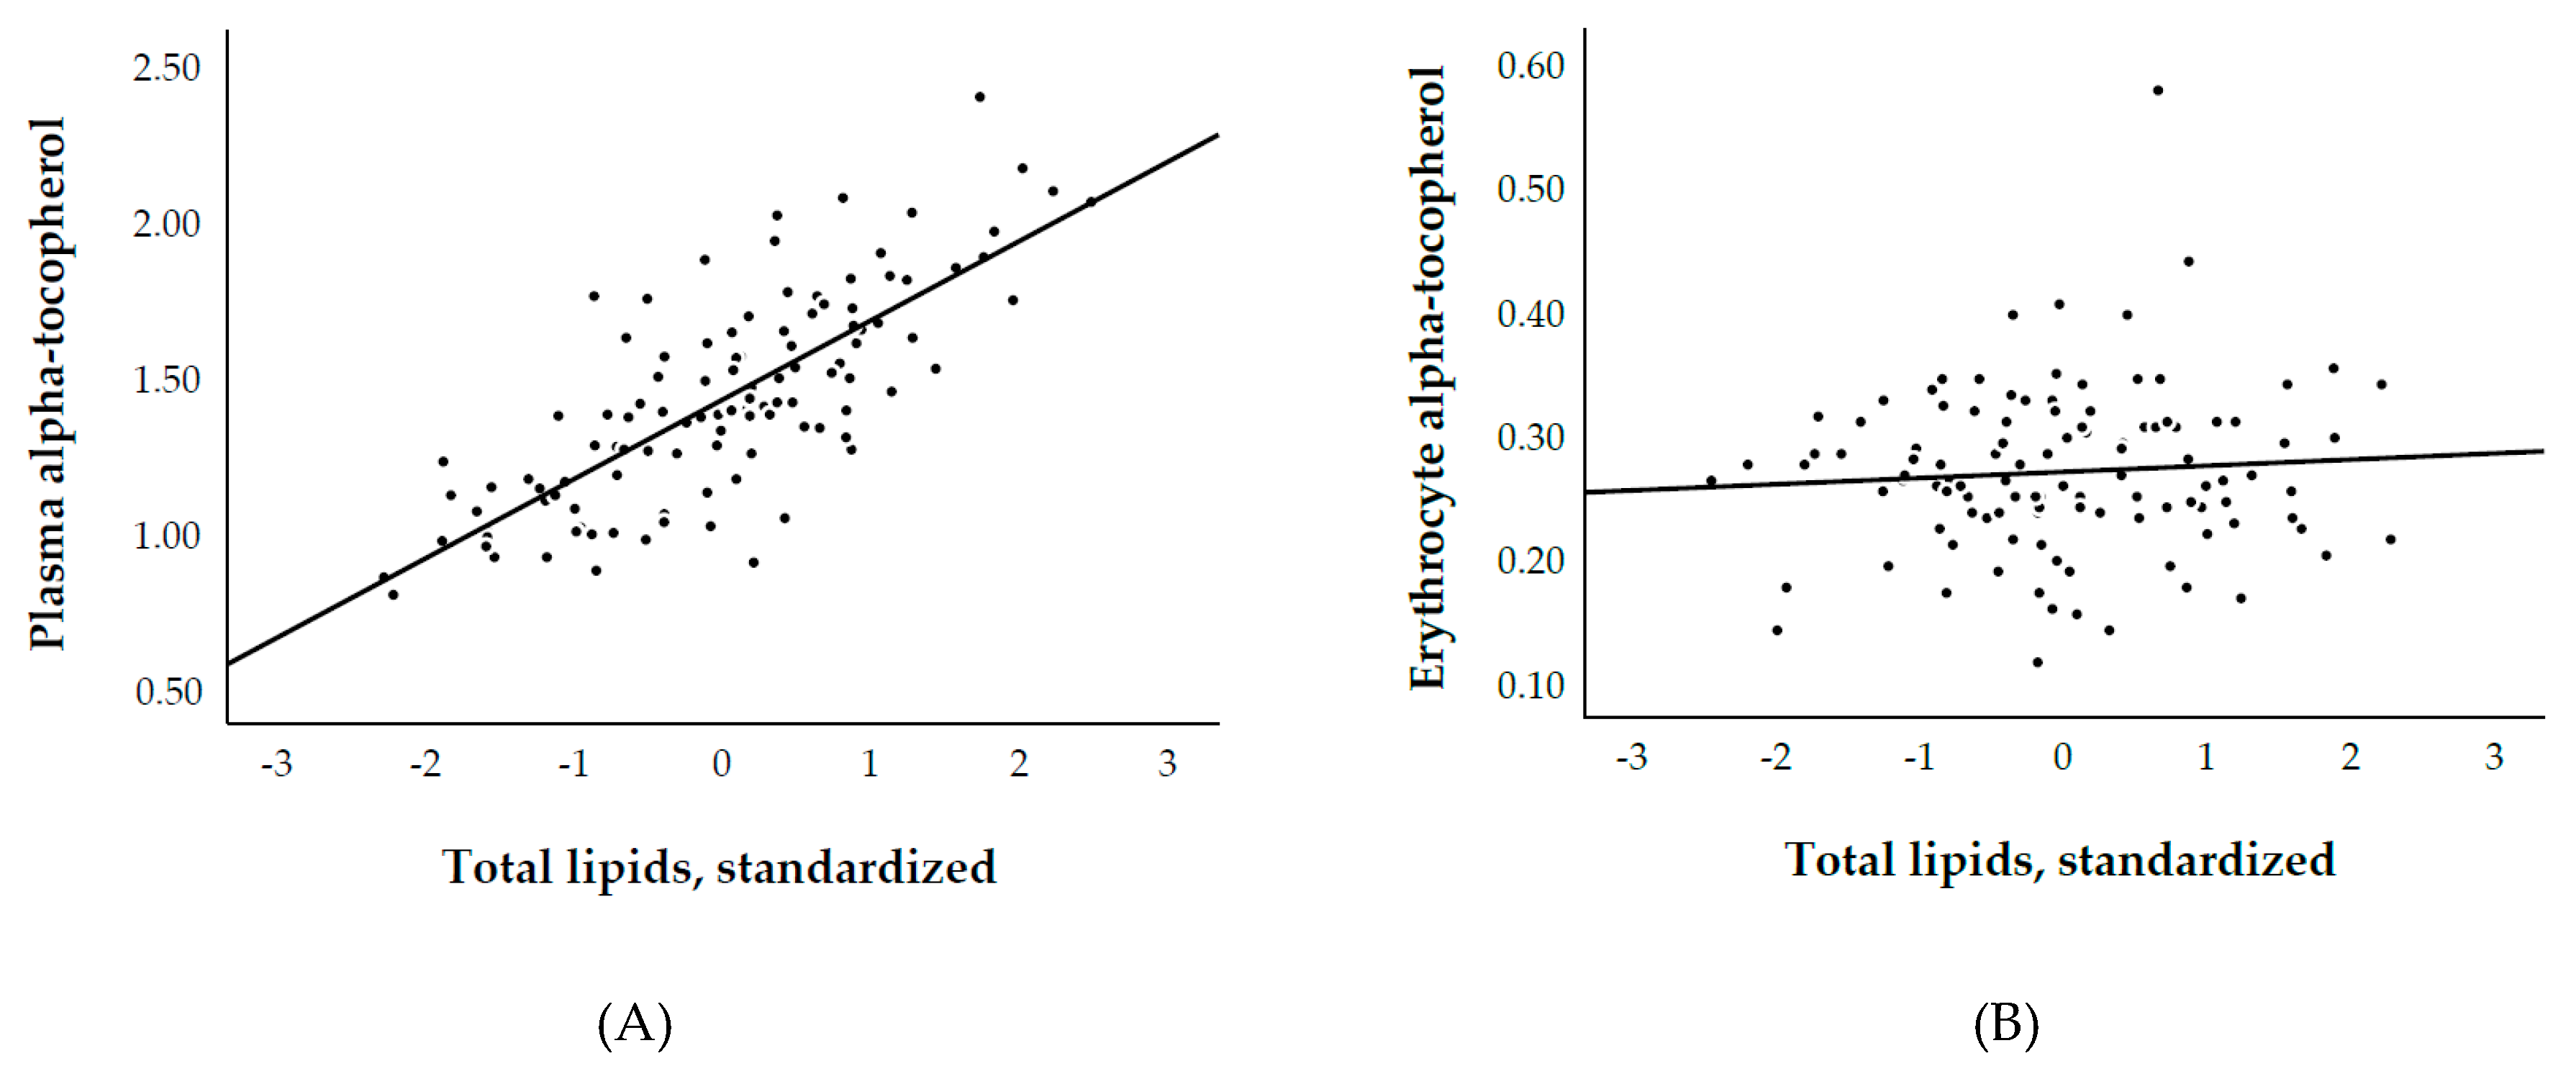
3.2. Plasma and Erythrocyte α-Tocopherol, and Biological Parameters
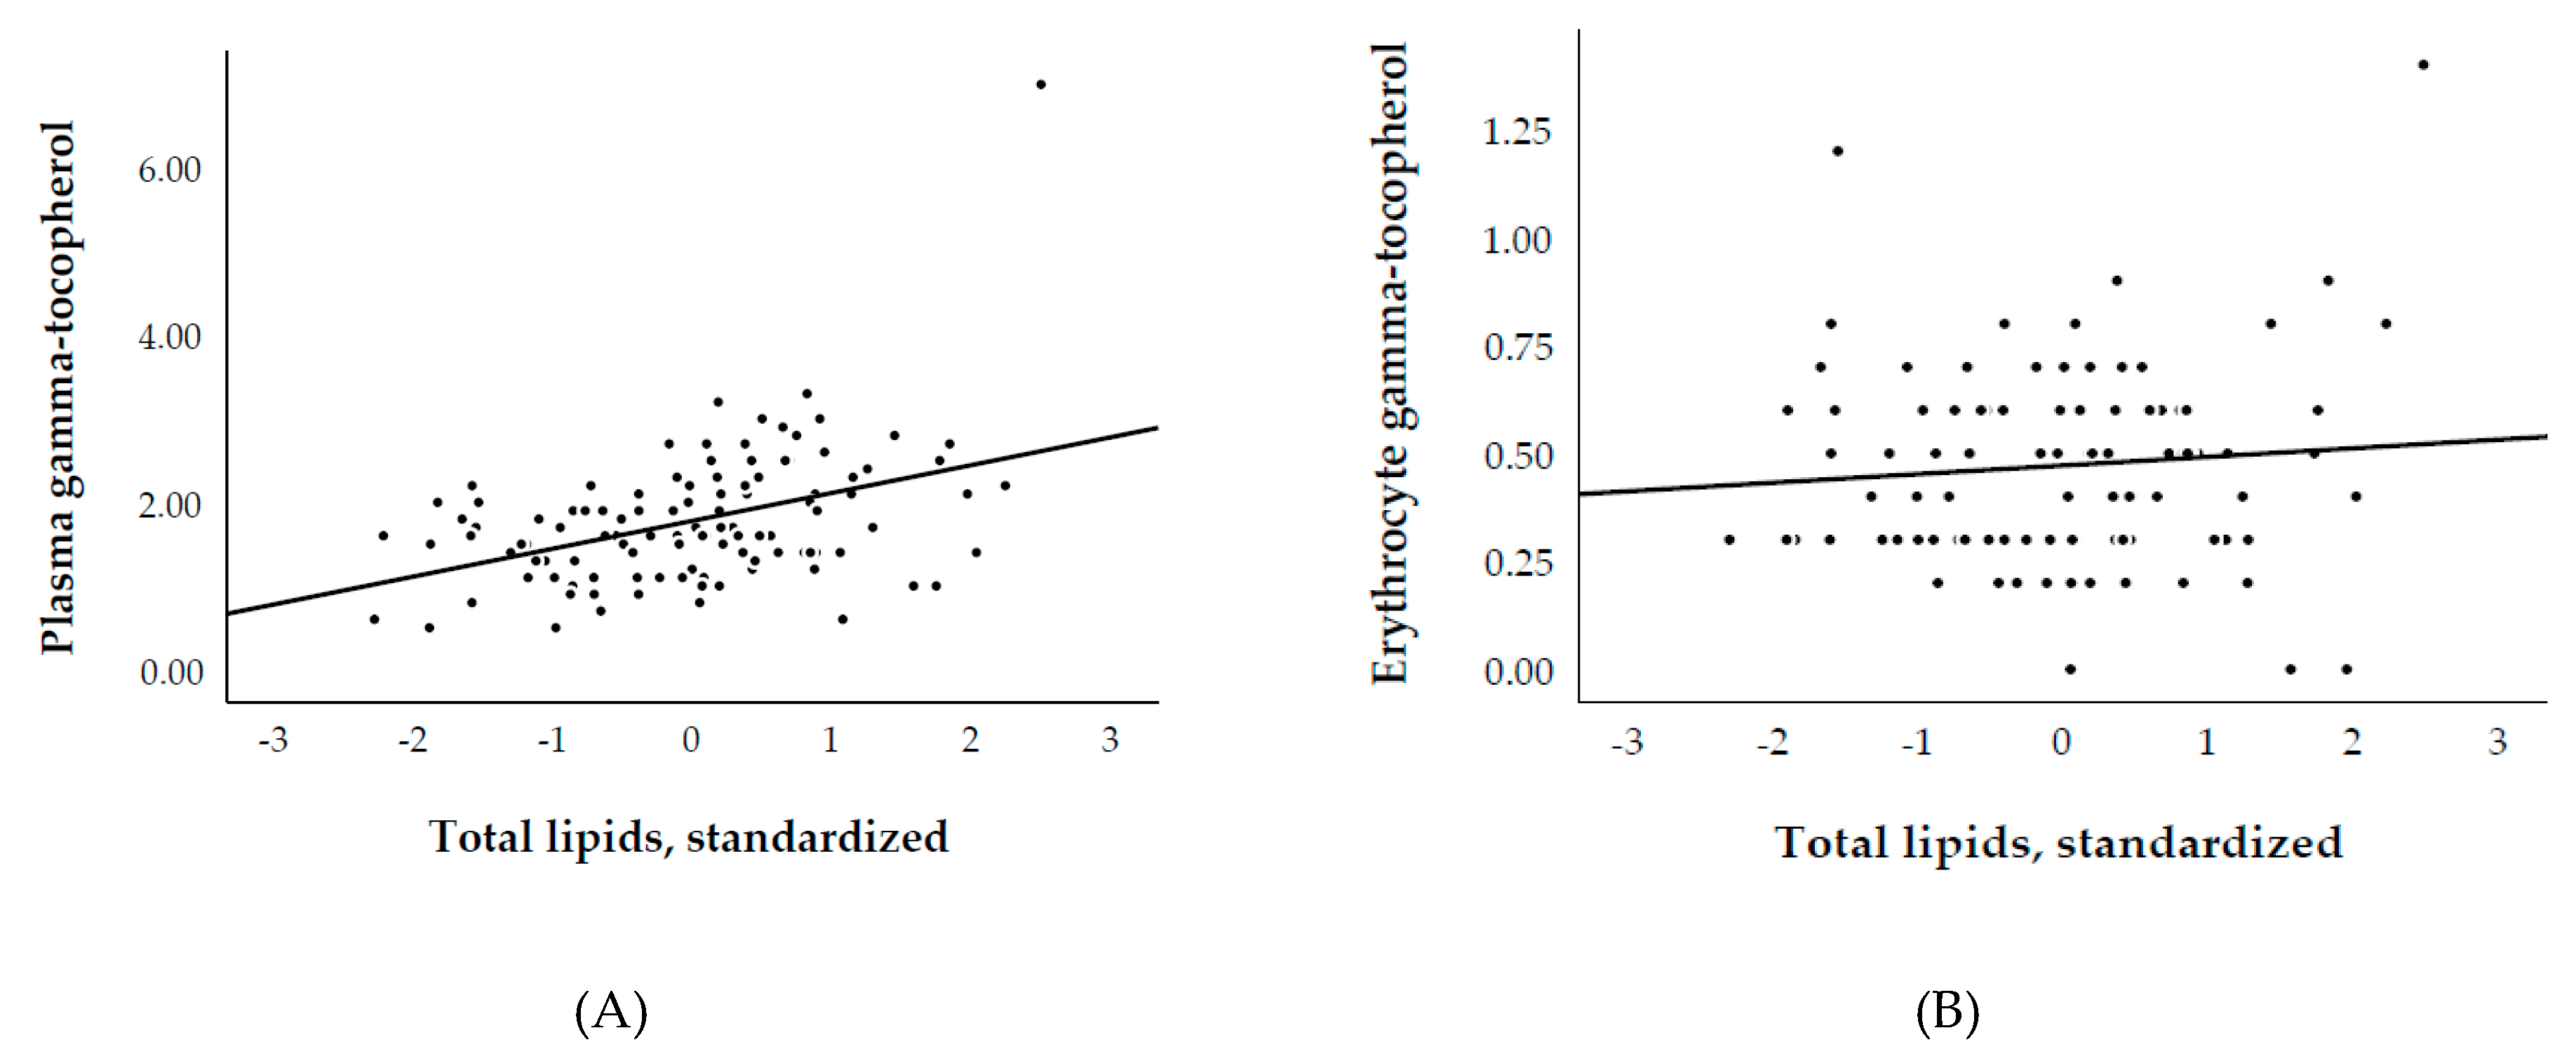
3.3. Plasma and Erythrocyte γ-Tocopherol, and Biological Parameters
4. Discussion
5. Conclusions
Author Contributions
Funding
Acknowledgments
Conflicts of Interest
References
- Cristol, J.P.; Vela, C.; Maggi, M.F.; Descomps, B.; Mourad, G. Oxidative stress and lipid abnormalities in renal transplant recipients with or without chronic rejection. Transplantation 1998, 65, 1322–1328. [Google Scholar] [CrossRef]
- Briggs, J.D. Causes of death after renal transplantation. Nephrol. Dial. Transpl. 2001, 16, 1545–1549. [Google Scholar] [CrossRef]
- Pippias, M.; Jager, K.J.; Kramer, A.; Leivestad, T.; Benítez Sánchez, M.; Caskey, F.J.; Collart, F.; Couchoud, C.; Dekker, F.W.; Finne, P.; et al. The changing trends and outcomes in renal replacement therapy: Data from the ERA-EDTA Registry. Nephrol. Dial. Transpl. 2016, 31, 831–841. [Google Scholar] [CrossRef] [PubMed]
- Au, E.H.; Chapman, J.R.; Craig, J.C.; Lim, W.H.; Teixeira-Pinto, A.; Ullah, S.; McDonald, S.; Wong, G. Overall and Site-Specific Cancer Mortality in Patients on Dialysis and after Kidney Transplant. J. Am. Soc. Nephrol. 2019, 30, 471–480. [Google Scholar] [CrossRef] [PubMed]
- Lamb, K.E.; Lodhi, S.; Meier-Kriesche, H.U. Long-term renal allograft survival in the United States: A critical reappraisal. Am. J. Transpl. 2011, 11, 450–462. [Google Scholar] [CrossRef] [PubMed]
- Wang, X.; Quinn, P.J. Vitamin E and its function in membranes. Prog. Lipid Res. 1999, 38, 309–336. [Google Scholar] [CrossRef]
- Shi, H.; Noguchi, N.; Niki, E. Comparative study on dynamics of antioxidative action of alpha-tocopheryl hydroquinone, ubiquinol, and alpha-tocopherol against lipid peroxidation. Free Radic. Biol. Med. 1999, 27, 334–346. [Google Scholar] [CrossRef]
- Niki, E. Interaction of ascorbate and alpha-tocopherol. Ann. N. Y. Acad. Sci. 1987, 498, 186–199. [Google Scholar] [CrossRef]
- Golumbic, C.; Mattil, H.A. The antioxygenic action of ascorbic acid in association with tocopherols, hydroquinones and related compounds. J. Am. Chem. Soc. 1941, 63, 1279–1280. [Google Scholar] [CrossRef]
- Leung, H.W.; Vang, M.J.; Mavis, R.D. The cooperative interaction between vitamin E and vitamin C in suppression of peroxidation of membrane phospholipids. Biochim. Biophys. Acta 1981, 664, 266–272. [Google Scholar]
- Compounds, I. Dietary Reference Intakes for Vitamin C, Vitamin E, Selenium, and Carotenoids; National Academies Press (US): Washington, DC, USA, 2000; ISBN 0309069491. [Google Scholar]
- Rubinstein, H.M.; Dietz, A.A.; Srinavasan, R. Relation of vitamin E and serum lipids. Clin. Chim. Acta 1969, 23, 1–6. [Google Scholar] [CrossRef]
- Thurnham, D.I.; Davies, J.A.; Crump, B.J.; Situnayake, R.D.; Davis, M. The Use of Different Lipids to Express Serum Tocopherol: Lipid Ratios for the Measurement of Vitamin E Status. Ann. Clin. Biochem. 1986, 23, 514–520. [Google Scholar] [CrossRef] [PubMed]
- Eisenga, M.F.; Gomes-Neto, A.W.; Van Londen, M.; Ziengs, A.L.; Douwes, R.M.; Stam, S.P.; Osté, M.C.J.; Knobbe, T.J.; Hessels, N.R.; Buunk, A.M.; et al. Rationale and design of TransplantLines: A prospective cohort study and biobank of solid organ transplant recipients. BMJ Open 2018, 8, 24502. [Google Scholar] [CrossRef] [PubMed]
- Levey, A.S.; Stevens, L.A.; Schmid, C.H.; Zhang, Y.L.; Castro, A.F.; Feldman, H.I.; Kusek, J.W.; Eggers, P.; Van Lente, F.; Greene, T.; et al. A New Equation to Estimate Glomerular Filtration Rate. Ann. Intern. Med. 2009, 150, 604–612. [Google Scholar] [CrossRef]
- Horwitt, M.K.; Harvey, C.C.; Dahm, C.H.; Searcy, M.T. Relationship Between Tocopherol and Serum Lipid Levels for Determination of Nutritional Adequacy. Ann. N. Y. Acad. Sci. 1972, 203, 223–236. [Google Scholar] [CrossRef]
- Borggreve, S.E.; Hillege, H.L.; Wolffenbuttel, B.H.R.; de Jong, P.E.; Bakker, S.J.L.; van der Steege, G.; van Tol, A.; Dullaart, R.P.F. The Effect of Cholesteryl Ester Transfer Protein −629C→A Promoter Polymorphism on High-Density Lipoprotein Cholesterol Is Dependent on Serum Triglycerides. J. Clin. Endocrinol. Metab. 2005, 90, 4198–4204. [Google Scholar] [CrossRef]
- Leberkühne, L.J.; Ebtehaj, S.; Dimova, L.G.; Dikkers, A.; Dullaart, R.P.F.; Bakker, S.J.L.; Tietge, U.J.F. The predictive value of the antioxidative function of HDL for cardiovascular disease and graft failure in renal transplant recipients. Atherosclerosis 2016, 249, 181–185. [Google Scholar] [CrossRef]
- Kunutsor, S.K.; Kieneker, L.M.; Bakker, S.J.L.; James, R.W.; Dullaart, R.P.F. The inverse association of HDL-cholesterol with future risk of hypertension is not modified by its antioxidant constituent, paraoxonase-1: The PREVEND prospective cohort study. Atherosclerosis 2017, 263, 219–226. [Google Scholar] [CrossRef]
- Kunutsor, S.K.; Kieneker, L.M.; Bakker, S.J.L.; James, R.W.; Dullaart, R.P.F. Incident type 2 diabetes is associated with HDL, but not with its anti-oxidant constituent—Paraoxonase-1: The prospective cohort PREVEND study. Metabolism 2017, 73, 43–51. [Google Scholar] [CrossRef]
- Annema, W.; Dikkers, A.; de Boer, J.F.; Dullaart, R.P.; Sanders, J.S.; Bakker, S.J.; Tietge, U.J. HDL Cholesterol Efflux Predicts Graft Failure in Renal Transplant Recipients. J. Am. Soc. Nephrol. 2016, 27, 595–603. [Google Scholar] [CrossRef]
- Sotomayor, C.G.; Eisenga, M.F.; Gomes-Neto, A.W.; Ozyilmaz, A.; Gans, R.O.B.; Jong, W.H.A.; Zelle, D.M.; Berger, S.P.; Gaillard, C.A.J.M.; Navis, G.J.; et al. Vitamin C Depletion and All-Cause Mortality in Renal Transplant Recipients. Nutrients 2017, 9, 568. [Google Scholar] [CrossRef] [PubMed]
- Jordan, J.M.; De Roos, A.J.; Renner, J.B.; Luta, G.; Cohen, A.; Craft, N.; Helmick, C.G.; Hochberg, M.C.; Arab, L. A case-control study of serum tocopherol levels and the alpha- to gamma-tocopherol ratio in radiographic knee osteoarthritis: The Johnston County Osteoarthritis Project. Am. J. Epidemiol. 2004, 159, 968–977. [Google Scholar] [CrossRef] [PubMed]
- Berdnikovs, S.; Abdala-Valencia, H.; Mccary, C.; Somand, M.; Cole, R.; Garcia, A.; Bryce, P.; Cook-Mills, J.M. Isoforms of Vitamin E Have Opposing Immunoregulatory Functions during Inflammation by Regulating Leukocyte Recruitment 1. J. Immunol. 2009, 182, 4395–4405. [Google Scholar] [CrossRef] [PubMed]
- Cooney, R.V.; Franke, A.A.; Wilkens, L.R.; Gill, J.; Kolonel, L.N. Elevated plasma gamma-tocopherol and decreased alpha-tocopherol in men are associated with inflammatory markers and decreased plasma 25-OH vitamin D. Nutr. Cancer 2008, 60 (Suppl. 1), 21–29. [Google Scholar] [CrossRef] [PubMed]
- McCary, C.A.; Abdala-Valencia, H.; Berdnikovs, S.; Cook-Mills, J.M. Supplemental and highly elevated tocopherol doses differentially regulate allergic inflammation: Reversibility of α-tocopherol and γ-tocopherol’s effects. J. Immunol. 2011, 186, 3674–3685. [Google Scholar] [CrossRef]
- Marchese, M.E.; Kumar, R.; Colangelo, L.A.; Avila, P.C.; Jacobs, D.R.; Gross, M.; Sood, A.; Liu, K.; Cook-Mills, J.M. The vitamin E isoforms α-tocopherol and γ-tocopherol have opposite associations with spirometric parameters: The CARDIA study. Respir. Res. 2014, 15, 31. [Google Scholar] [CrossRef]
- Tucker, L.A. Alpha- and Gamma-Tocopherol and Telomere Length in 5768 US Men and Women: A NHANES Study. Nutrients 2017, 9, 601. [Google Scholar] [CrossRef]
- Shamim, A.A.; Kabir, A.; Merrill, R.D.; Ali, H.; Rashid, M.; Schulze, K.; Labrique, A.; West, K.P.; Christian, P. Plasma zinc, vitamin B(12) and α-tocopherol are positively and plasma γ-tocopherol is negatively associated with Hb concentration in early pregnancy in north-west Bangladesh. Public Health Nutr. 2013, 16, 1354–1361. [Google Scholar] [CrossRef]
- Cook-Mills, J.M.; Marchese, M.E.; Abdala-Valencia, H. Vascular cell adhesion molecule-1 expression and signaling during disease: Regulation by reactive oxygen species and antioxidants. Antioxid. Redox Signal. 2011, 15, 1607–1638. [Google Scholar] [CrossRef]
- McCary, C.A.; Yoon, Y.; Panagabko, C.; Cho, W.; Atkinson, J.; Cook-Mills, J.M. Vitamin E isoforms directly bind PKCα and differentially regulate activation of PKCα. Biochem. J. 2012, 441, 189–198. [Google Scholar] [CrossRef]
- Abdala-Valencia, H.; Berdnikovs, S.; Cook-Mills, J.M. Vitamin E isoforms differentially regulate intercellular adhesion molecule-1 activation of PKCα in human microvascular endothelial cells. PLoS ONE 2012, 7, e41054. [Google Scholar] [CrossRef] [PubMed]
- So, A.; Thorens, B. Uric acid transport and disease. J. Clin. Investig. 2010, 120, 1791–1799. [Google Scholar] [CrossRef] [PubMed] [Green Version]
- Zavaroni, I.; Mazza, S.; Fantuzzi, M.; Dall’Aglio, E.; Bonora, E.; Delsignore, R.; Passeri, M.; Reaven, G.M. Changes in insulin and lipid metabolism in males with asymptomatic hyperuricaemia. J. Intern. Med. 1993, 234, 25–30. [Google Scholar] [CrossRef] [PubMed]
- Matsubara, M.; Chiba, H.; Maruoka, S.; Katayose, S. Elevated serum leptin concentrations in women with hyperuricemia. J. Atheroscler. Thromb. 2002, 9, 28–34. [Google Scholar] [CrossRef] [Green Version]
- Masuo, K.; Kawaguchi, H.; Mikami, H.; Ogihara, T.; Tuck, M.L. Serum Uric Acid and Plasma Norepinephrine Concentrations Predict Subsequent Weight Gain and Blood Pressure Elevation. Hypertension 2003, 42, 474–480. [Google Scholar] [CrossRef]
- Johnson, R.J.; Kang, D.-H.; Feig, D.; Kivlighn, S.; Kanellis, J.; Watanabe, S.; Tuttle, K.R.; Rodriguez-Iturbe, B.; Herrera-Acosta, J.; Mazzali, M. Is There a Pathogenetic Role for Uric Acid in Hypertension and Cardiovascular and Renal Disease? Hypertension 2003, 41, 1183–1190. [Google Scholar] [CrossRef] [Green Version]
- Nakanishi, N.; Okamoto, M.; Yoshida, H.; Matsuo, Y.; Suzuki, K.; Tatara, K. Serum uric acid and risk for development of hypertension and impaired fasting glucose or Type II diabetes in Japanese male office workers. Eur. J. Epidemiol. 2003, 18, 523–530. [Google Scholar] [CrossRef]
- Ogura, T.; Matsuura, K.; Matsumoto, Y.; Mimura, Y.; Kishida, M.; Otsuka, F.; Tobe, K. Recent trends of hyperuricemia and obesity in Japanese male adolescents, 1991 through 2002. Metabolism 2004, 53, 448–453. [Google Scholar] [CrossRef]
- Alper, A.B.; Chen, W.; Yau, L.; Srinivasan, S.R.; Hamm, L.L.; Berenson, G.S.; Hamm, L.L. Childhood Uric Acid Predicts Adult Blood Pressure. Hypertension 2005, 45, 34–38. [Google Scholar] [CrossRef] [Green Version]
- Johnson, R.J.; Segal, M.S.; Srinivas, T.; Ejaz, A.; Mu, W.; Roncal, C.; Sánchez-Lozada, L.G.; Gersch, M.; Rodriguez-Iturbe, B.; Kang, D.H.; et al. Essential Hypertension, Progressive Renal Disease, and Uric Acid: A Pathogenetic Link? J. Am. Soc. Nephrol. 2005, 16, 1909–1919. [Google Scholar] [CrossRef] [Green Version]
- Schultz, M.; Leist, M.; Petrzika, M.; Gassmann, B.; Brigelius-Flohé, R. Novel urinary metabolite of alpha-tocopherol, 2,5,7,8-tetramethyl-2(2′-carboxyethyl)-6-hydroxychroman, as an indicator of an adequate vitamin E supply? Am. J. Clin. Nutr. 1995, 62, 1527S–1534S. [Google Scholar] [CrossRef] [PubMed]


| Plasma α-tocopherol | Model 1 | Model 2 | Model 3 | Model 4 | Model 5 | Model 6 | Model 7 |
| Total cholesterol | 0.68 *** | — | 0.53 *** | — | 0.49 *** | — | — |
| HDL cholesterol | — | — | — | — | 0.10 | 0.29 *** | 0.32 *** |
| Non-HDL cholesterol | — | — | — | — | — | — | 0.49 *** |
| LDL cholesterol | — | — | — | — | — | 0.41 *** | — |
| Triglycerides | — | 0.61 *** | 0.43 *** | — | 0.48 *** | 0.59 *** | 0.48 *** |
| Total lipids | — | — | — | 0.77 *** | — | — | — |
| R2 | 0.46 | 0.37 | 0.62 | 0.60 | 0.63 | 0.60 | 0.63 |
| Erythrocytes α-tocopherol | Model 1 | Model 2 | Model 3 | Model 4 | Model 5 | Model 6 | Model 7 |
| Total cholesterol | 0.08 | — | 0.15 | — | 0.06 | — | — |
| HDL cholesterol | — | — | — | — | 0.21 | 0.24 * | 0.24 * |
| Non-HDL cholesterol | — | — | — | — | — | — | 0.06 |
| LDL cholesterol | — | — | — | — | — | 0.05 | — |
| Triglycerides | — | −0.17 | −0.22 * | — | −0.13 | −0.11 | −0.13 |
| Total lipids | — | — | — | −0.08 | — | — | — |
| R2 | 0.01 | 0.03 | 0.05 | 0.01 | 0.08 | 0.08 | 0.08 |
| Plasma γ-tocopherol | Model 1 | Model 2 | Model 3 | Model 4 | Model 5 | Model 6 | Model 7 |
| Total cholesterol | 0.20 * | — | 0.08 | — | 0.10 | — | — |
| HDL cholesterol | — | — | — | — | –0.05 | –0.01 | <0.001 |
| Non-HDL cholesterol | — | — | — | — | — | — | 0.10 |
| LDL cholesterol | — | — | — | — | — | 0.05 | — |
| Triglycerides | — | 0.39 | 0.37 *** | — | 0.35 ** | 0.38 *** | 0.35 ** |
| Total lipids | — | — | — | 0.42 *** | — | — | — |
| R2 | 0.04 | 0.16 | 0.16 | 0.18 | 0.16 | 0.16 | 0.16 |
| Erythrocytes γ-tocopherol | Model 1 | Model 2 | Model 3 | Model 4 | Model 5 | Model 6 | Model 7 |
| Total cholesterol | 0.06 | — | 0.05 | — | 0.09 | — | — |
| HDL cholesterol | — | — | — | — | –0.10 | –0.07 | –0.06 |
| Non-HDL cholesterol | — | — | — | — | — | — | 0.09 |
| LDL cholesterol | — | — | — | — | — | 0.08 | — |
| Triglycerides | — | 0.05 | 0.04 | — | −0.01 | 0.01 | –0.01 |
| Total lipids | — | — | — | 0.09 | — | — | — |
| R2 | 0.004 | 0.003 | 0.01 | 0.01 | 0.01 | 0.01 | 0.01 |
| Baseline Characteristics | Overall RTR (n = 113) | α-tocopherol | |||
|---|---|---|---|---|---|
| Plasma | Erythrocyte | ||||
| Standardization | Standardization | ||||
| None | Lipids | None | Lipids | ||
| Plasma α-tocopherol, mg/dL, mean (SD) | 1.4(0.3) | — | — | — | — |
| Quotient plasma α-tocopherol (mg/dL)/total lipids (g/dL), mean (SD) | 4.2(0.7) | — | — | — | — |
| Erythrocyte α-tocopherol, mg/1013 erythrocytes, mean (SD) a | 0.27(0.07) | — | — | — | — |
| Quotient erythrocyte α-tocopherol (mg/1013 erythrocytes)/total lipids (g/dL), median (IQR) a | 0.79(0.61–1.04) | — | — | — | — |
| Demographics and anthropometrics | |||||
| Age, years, mean (SD) † | 55(14) | 0.20 * | 0.20 * | 0.12 | 0.05 |
| Gender, male, n (%) † | 68(60) | 0.15 | 0.19 * | 0.13 | 0.08 |
| Ethnicity, Caucasian, n (%) b | 86(76) | −0.13 | 0.13 | 0.10 | 0.19 |
| Body mass index, kg/m2, median (IQR) c | 25.9(24.2–29.3) | 0.04 | −0.17 | −0.10 | −0.17 |
| Systolic blood pressure, mmHg, mean (SD) c | 140(19) | 0.06 | 0.04 | 0.003 | −0.01 |
| Diastolic blood pressure, mmHg, mean (SD) c | 81(15) | 0.002 | −0.06 | −0.17 | −0.13 |
| Diabetes mellitus, n (%) d | 31(27) | 0.01 | −0.04 | 0.08 | −0.01 |
| Current smoker, n (%) e | 5(4) | −0.04 | 0.01 | −0.01 | 0.02 |
| Allograft function and transplantation | |||||
| Creatinine, mg/dL, mean (SD) | 1.5(0.4) | 0.09 | −0.04 | 0.01 | −0.05 |
| eGFR, mL/min/1.73 m2, mean (SD) | 51(16) | −0.11 | 0.001 | −0.08 | 0.01 |
| Dialysis vintage d | |||||
| <1 year, n (%) | 62(56) | — | — | — | — |
| 1–5 years, n (%) | 37(33) | −0.13 | −0.13 | −0.16 | −0.06 |
| >5 years, n (%) | 11(10) | 0.17 | 0.06 | 0.01 | −0.06 |
| Time since transplantation, years, median (IQR) f | 1(1–10) | 0.20* | 0.07 | 0.02 | −0.08 |
| Lipids | |||||
| Total cholesterol, mg/dL, mean (SD) | 181(38) | 0.66 *** | −0.14 | 0.06 | −0.46 *** |
| Non-HDL cholesterol, mg/dL, mean (SD) | 127(37) | 0.67 *** | −0.24 ** | −0.03 | −0.54 *** |
| LDL cholesterol, mg/dL, mean (SD) | 110(35) | 0.57 *** | −0.13 | 0.01 | −0.41 *** |
| Triglycerides, mg/dL, median (IQR) | 151(101–197) | 0.61 *** | −0.59 *** | −0.17 | −0.74 *** |
| Total lipid, mg/dL, median (IQR) | 334(272–397) | 0.76 *** | −0.51 *** | −0.08 | −0.76 *** |
| Antioxidants, pro-oxidants, and inflammation | |||||
| HDL cholesterol, mg/dL, median (IQR) | 50(41–64) | −0.01 | 0.25 * | 0.24* | 0.21 |
| γ-Glutamyltransferase, U/L, median (IQR) | 30(19–42) | 0.05 | −0.05 | −0.06 | −0.10 |
| Uric acid, mg/dL, mean (SD) | 6.4(1.6) | 0.20 | −0.26 ** | −0.18 | −0.35 *** |
| Vitamin C, mg/dL, median (IQR) g | 0.7(0.4–0.9) | 0.10 | 0.22 * | 0.23* | 0.23 * |
| hs-CRP, mg/L, median (IQR) h | 3.0(1.3–7.0) | −0.11 | 0.09 | −0.08 | 0.06 |
| Glucose homeostasis | |||||
| Glucose, mg/dL, median (IQR) | 99(90–114) | 0.13 | −0.21 * | −0.04 | −0.31 * |
| HbA1C, %, median (IQR) | 5.8(5.4–6.5) | 0.09 | 0.09 | 0.02 | −0.03 |
| Baseline Characteristics | Overall RTR (n = 113) | γ-tocopherol | |||
|---|---|---|---|---|---|
| Plasma | Erythrocyte | ||||
| Standardization | Standardization | ||||
| None | Lipids | None | Lipids | ||
| Plasma γ-tocopherol, mg/dL, mean (SD) a | 0.07(0.03) | — | — | — | — |
| Quotient plasma γ-tocopherol (mg/dL)/total lipids (g/dL), mean (SD) a | 0.22(0.08) | — | — | — | — |
| Erythrocyte α-tocopherol, mg/1013 erythrocyte, median (IQR) b | 0.02(0.01) | — | — | — | — |
| Quotient erythrocyte α-tocopherol (mg/1013 erythrocyte)/total lipids (g/dL), median (IQR) b | 0.06(0.03) | — | — | — | — |
| Demographics and anthropometrics | |||||
| Age, years, mean (SD) † | 55(14) | −0.10 | −0.09 | −0.14 | −0.16 |
| Gender, male, n (%) † | 68(60) | 0.13 | 0.10 | 0.08 | 0.06 |
| Ethnicity, Caucasian, n (%) c | 86(76) | −0.03 | 0.16 | 0.16 | 0.27 |
| Body mass index, kg/m2, median (IQR) a | 25.9(24.2–29.3) | 0.29 ** | 0.16 | 0.07 | −0.07 |
| Systolic blood pressure, mmHg, mean (SD) a | 140(19) | −0.09 | −0.11 | −0.12 | −0.12 |
| Diastolic blood pressure, mmHg, mean (SD) a | 81(15) | 0.11 | 0.03 | −0.09 | −0.14 |
| Diabetes mellitus, n (%) d | 31(27) | 0.17 | 0.09 | 0.11 | 0.04 |
| Current smoker, n (%) e | 5(4) | 0.05 | 0.13 | 0.10 | 0.09 |
| Allograft function and transplantation | |||||
| Creatinine, mg/dL, mean (SD) | 1.5(0.4) | –0.05 | –0.17 | –0.05 | –0.40 |
| eGFR, mL/min/1.73 m2, mean (SD) | 51(16) | 0.07 | 0.18 | 0.03 | 0.08 |
| Dialysis vintage d | |||||
| <1 year, n (%) | 62(56) | — | — | — | — |
| 1–5 years, n (%) | 37(33) | 0.10 | 0.12 | 0.002 | 0.03 |
| >5 years, n (%) | 11(10) | −0.10 | −0.15 | −0.02 | −0.07 |
| Time since transplantation, years, median (IQR) b | 1(1–10) | 0.08 | −0.02 | 0.02 | −0.04 |
| Lipids | |||||
| Total cholesterol, mg/dL, mean (SD) | 181(38) | 0.19 * | −0.23 * | 0.07 | −0.29 ** |
| Non-HDL cholesterol, mg/dL, mean (SD) | 127(37) | 0.28 ** | −0.21 * | 0.12 | −0.29 ** |
| LDL cholesterol, mg/dL, mean (SD) | 110(35) | 0.16 | −0.21 * | 0.10 | −0.21 * |
| Triglycerides, mg/dL, median (IQR) | 151(101–197) | 0.40 *** | −0.22 * | 0.06 | −0.44 *** |
| Total lipid, mg/dL, median (IQR) | 334(272–397) | 0.42 *** | −0.2 5** | 0.10 | −0.45 *** |
| Antioxidants, pro-oxidants, and inflammation | |||||
| HDL cholesterol, mg/dL, median (IQR) | 50(41–64) | −0.20 * | −0.07 | −0.12 | −0.02 |
| γ-Glutamyltransferase, U/L, median (IQR) | 30(19–42) | 0.05 | −0.003 | −0.03 | −0.03 |
| Uric acid, mg/dL, mean (SD) | 6.4(1.6) | 0.10 | −0.16 | −0.04 | −0.18 |
| Vitamin C, mg/dL, median (IQR) f | 0.7(0.4–0.9) | −0.17 | −0.05 | 0.03 | 0.12 |
| hs-CRP, mg/L, median (IQR) g | 3.0(1.3–7.0) | 0.14 | 0.23 * | 0.24 * | 0.20 * |
| Glucose homeostasis | |||||
| Glucose, mg/dL, median (IQR) | 99(90–114) | 0.21 * | 0.01 | 0.13 | −0.05 |
| HbA1C, %, median (IQR) | 5.8(5.4–6.5) | 0.11 | 0.07 | −0.001 | −0.04 |
© 2019 by the authors. Licensee MDPI, Basel, Switzerland. This article is an open access article distributed under the terms and conditions of the Creative Commons Attribution (CC BY) license (http://creativecommons.org/licenses/by/4.0/).
Share and Cite
Sotomayor, C.G.; Rodrigo, R.; Gomes-Neto, A.W.; Gormaz, J.G.; Pol, R.A.; Minović, I.; Eggersdorfer, M.L.; Vos, M.; Riphagen, I.J.; de Borst, M.H.; et al. Plasma versus Erythrocyte Vitamin E in Renal Transplant Recipients, and Duality of Tocopherol Species. Nutrients 2019, 11, 2821. https://doi.org/10.3390/nu11112821
Sotomayor CG, Rodrigo R, Gomes-Neto AW, Gormaz JG, Pol RA, Minović I, Eggersdorfer ML, Vos M, Riphagen IJ, de Borst MH, et al. Plasma versus Erythrocyte Vitamin E in Renal Transplant Recipients, and Duality of Tocopherol Species. Nutrients. 2019; 11(11):2821. https://doi.org/10.3390/nu11112821
Chicago/Turabian StyleSotomayor, Camilo G., Ramón Rodrigo, António W. Gomes-Neto, Juan Guillermo Gormaz, Robert A. Pol, Isidor Minović, Manfred L. Eggersdorfer, Michel Vos, Ineke J. Riphagen, Martin H. de Borst, and et al. 2019. "Plasma versus Erythrocyte Vitamin E in Renal Transplant Recipients, and Duality of Tocopherol Species" Nutrients 11, no. 11: 2821. https://doi.org/10.3390/nu11112821