White Kidney Bean (Phaseolus Vulgaris L.) Consumption Reduces Fat Accumulation in a Polygenic Mouse Model of Obesity


 , , and
Abstract
1. Introduction
2. Materials and Methods
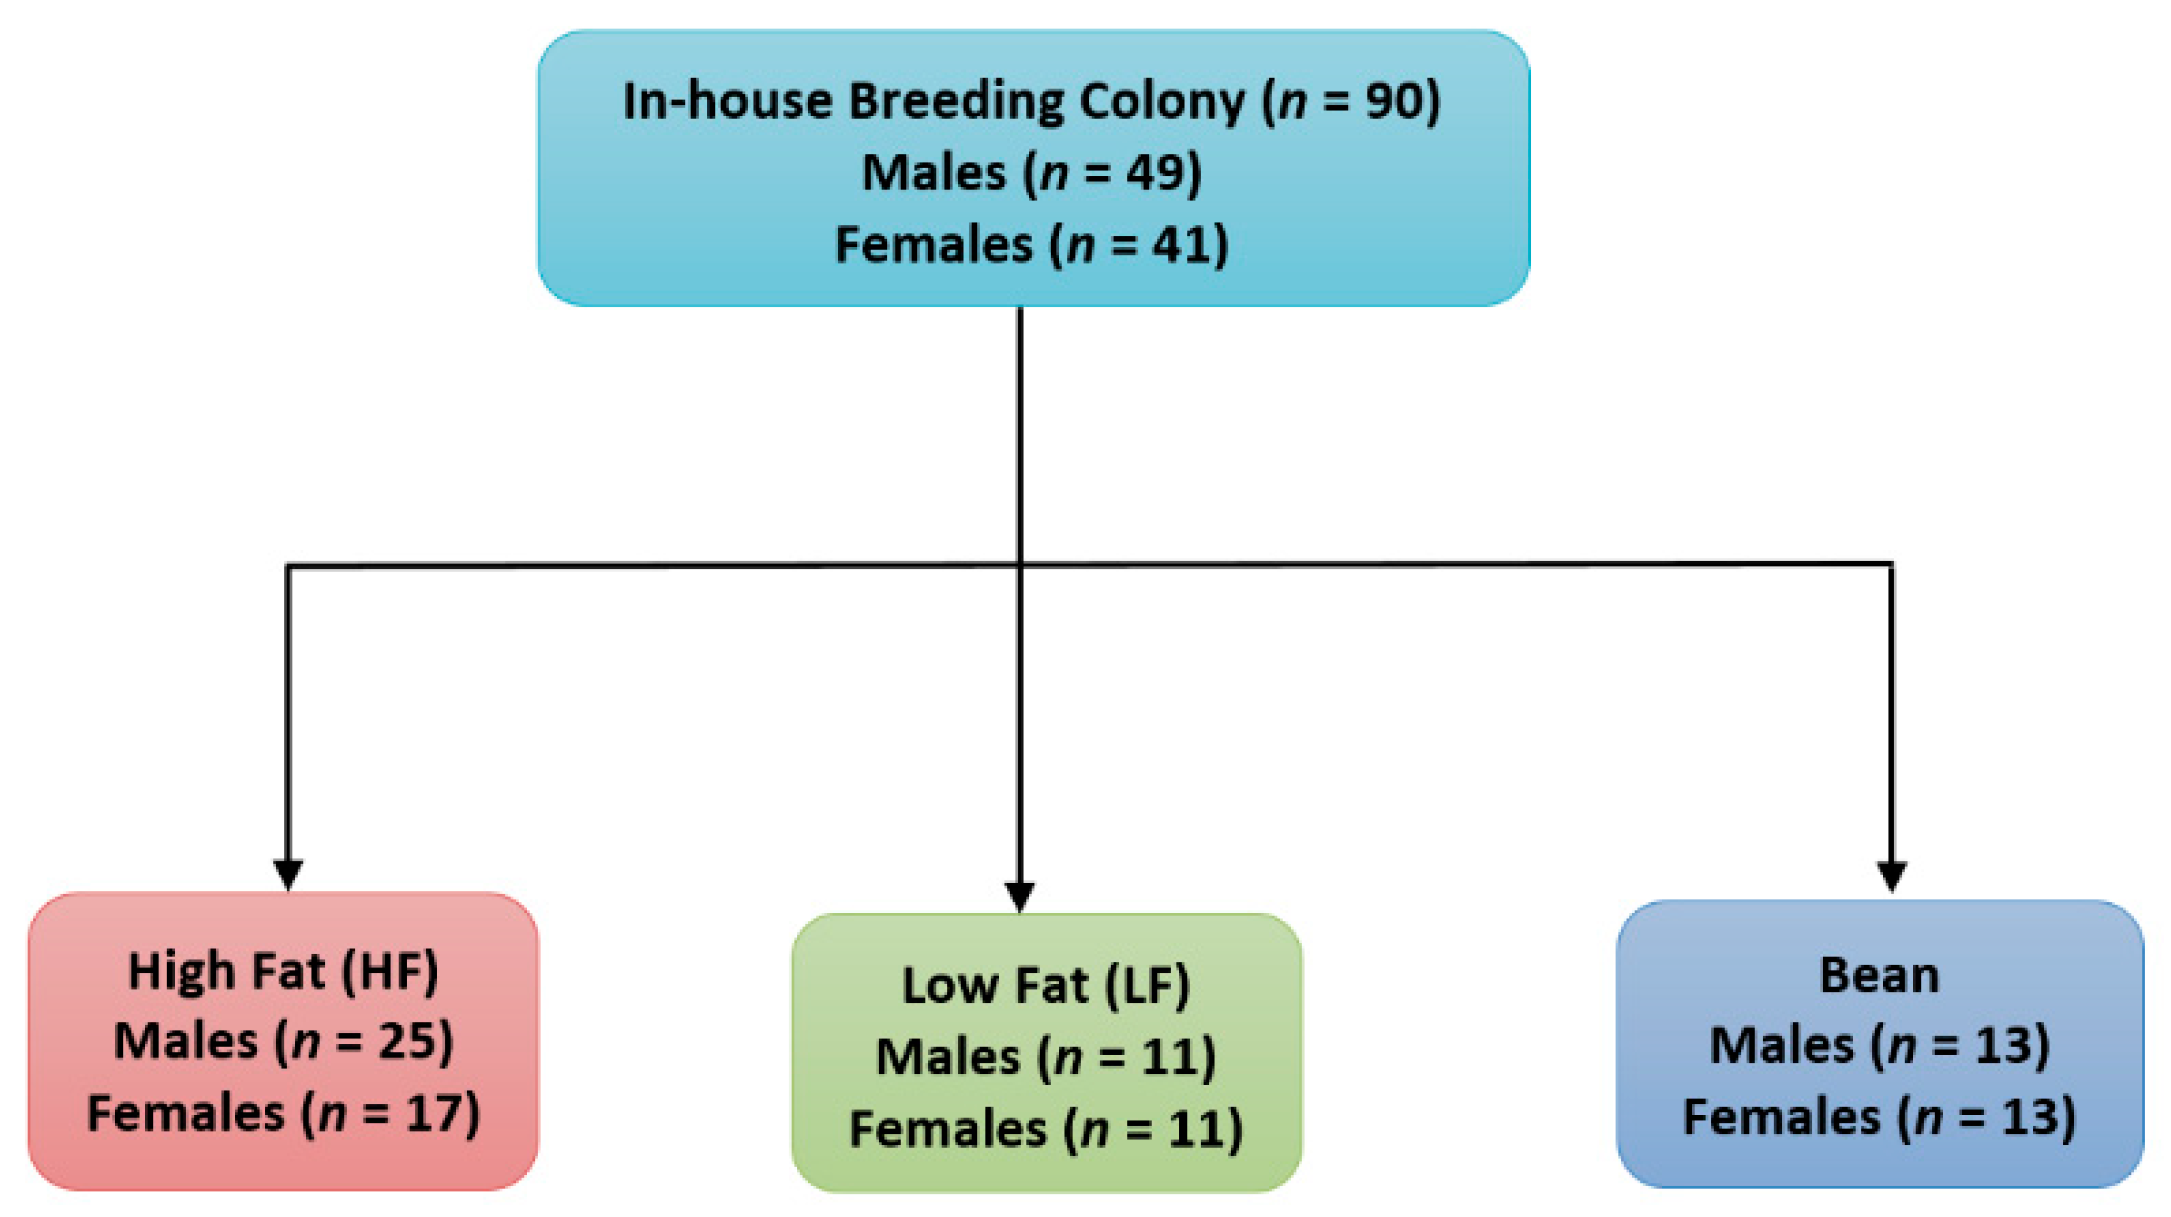
2.1. Experimental Animals
2.2. Experimental Diets
2.3. Experimental Design
2.3.1. Experiment 1
2.3.2. Experiment 2
2.4. Necropsy
2.5. RNA Transcript Expression
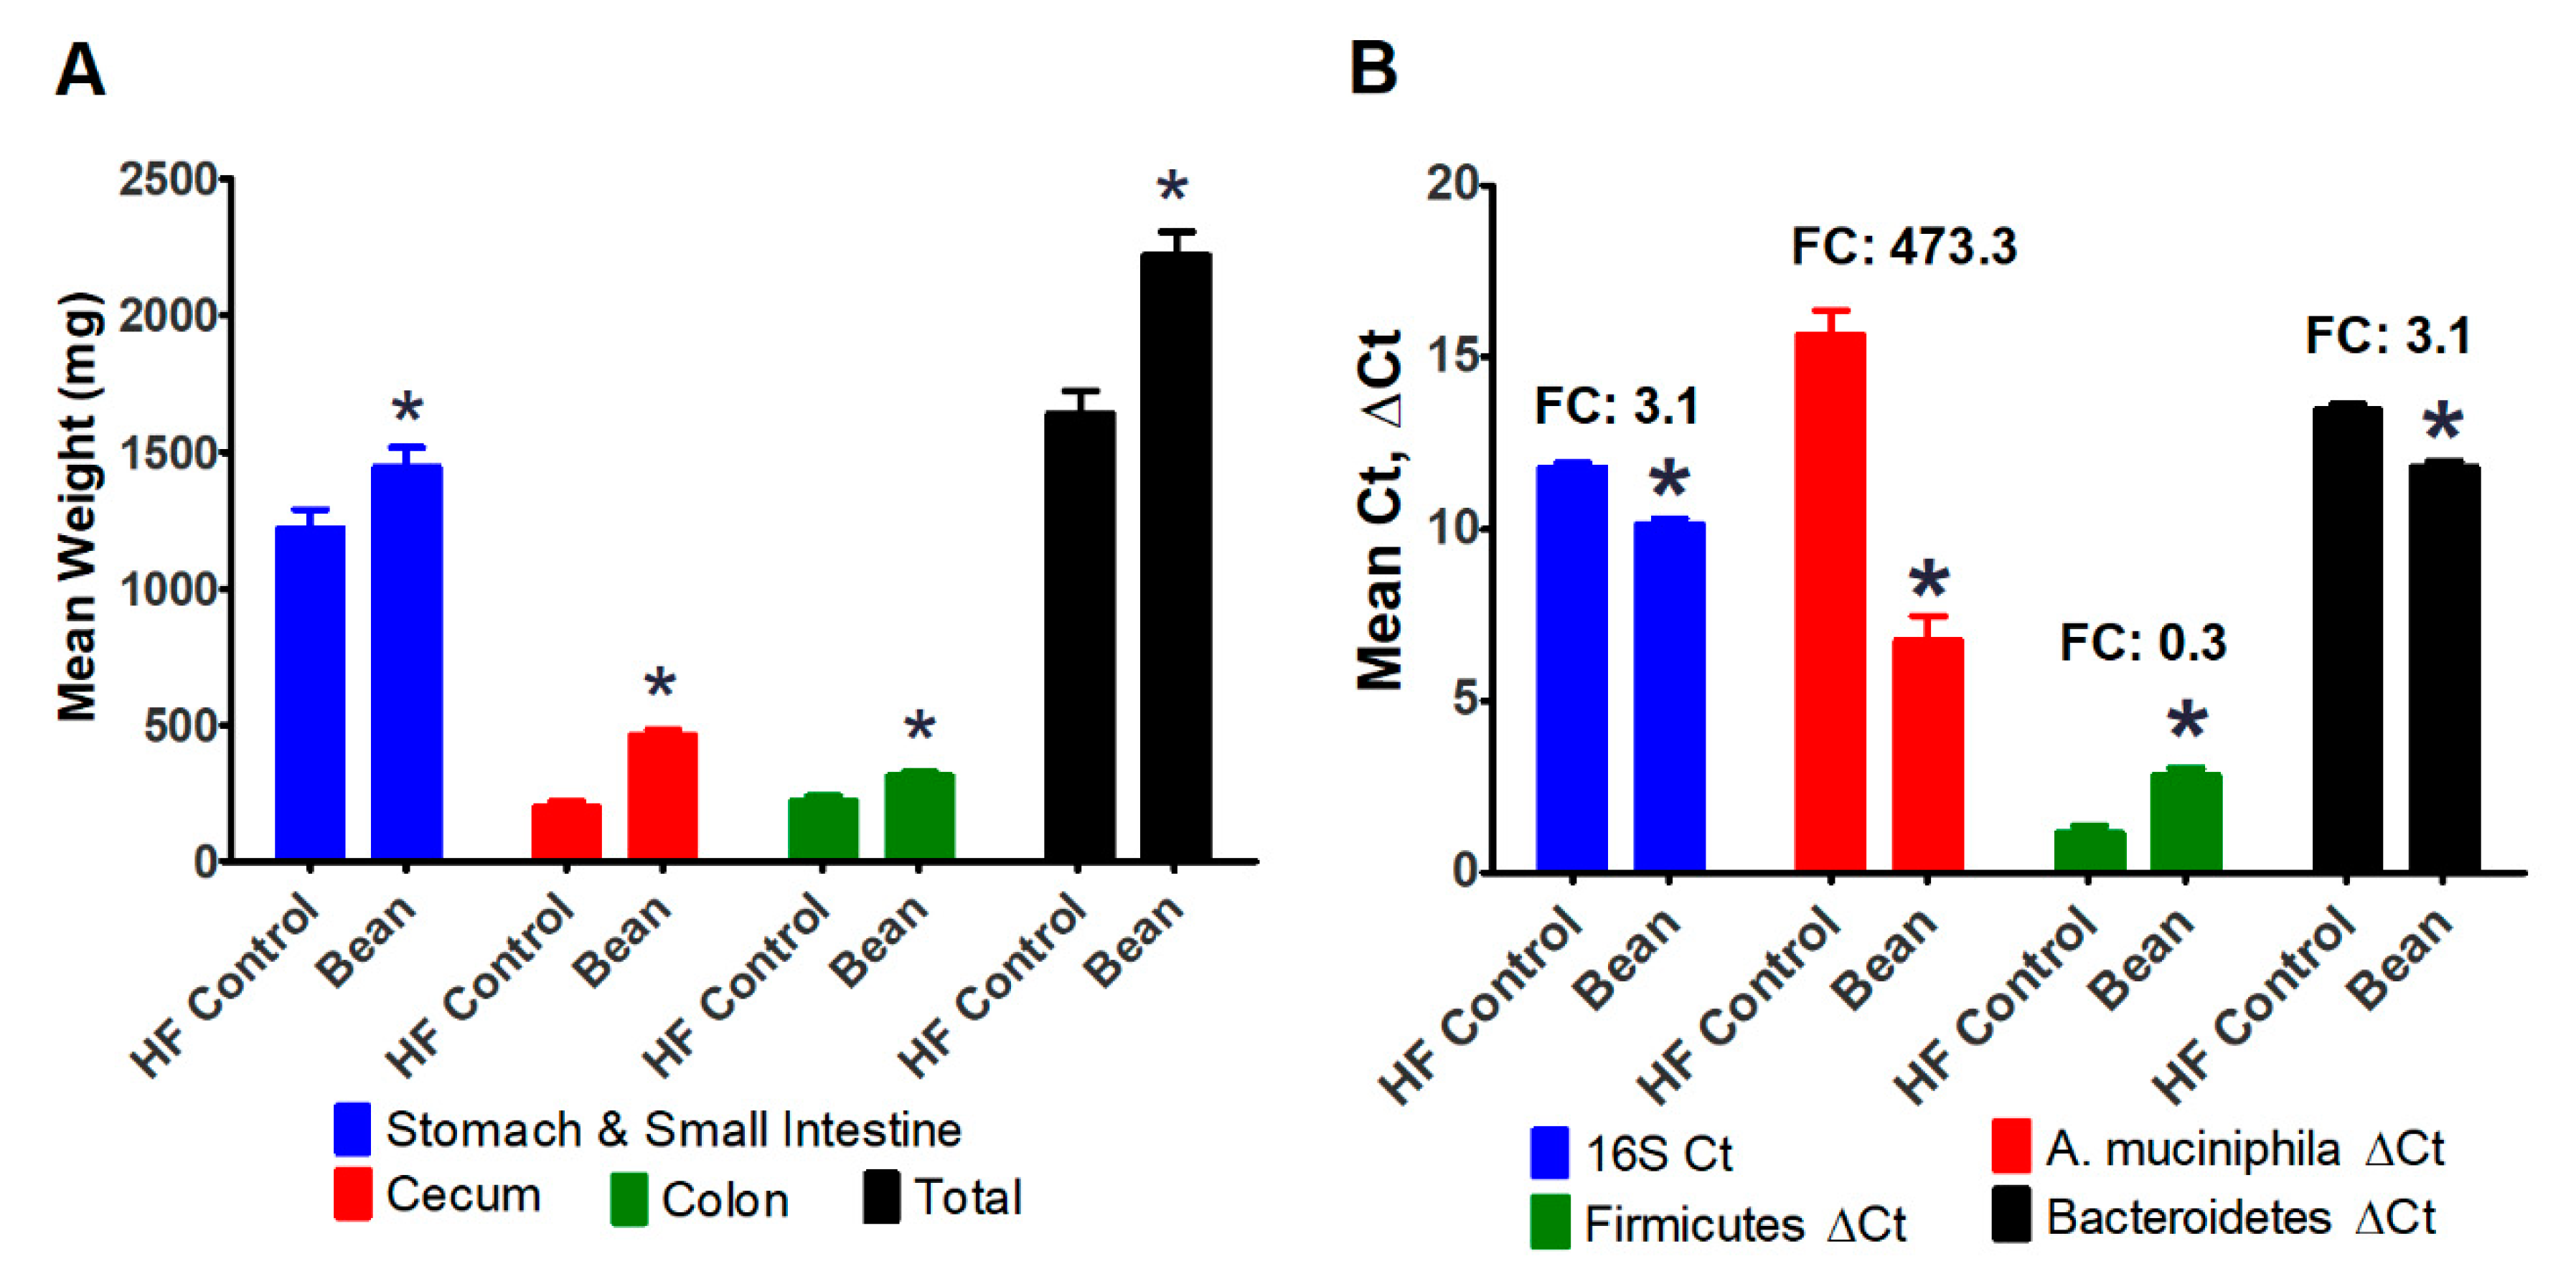
2.6. Bacterial Quantification by qPCR
2.7. Histology
2.7.1. Histology and Image Acquisition
2.7.2. Morphometric Analysis
2.8. Bile Acid Analyses
2.8.1. Sample Preparation
2.8.2. LC–MS
2.8.3. Metabolite Data Processing
2.9. Statistical Analyses
3. Results
3.1. Effect of ad Libitum Feeding of White Kidney Bean in Male and Female B6 Mice
3.1.1. Effect of Bean Consumption in an Unselected Population of B6 Mice
3.2. Effect of Bean Energy Balance Using a Paired Feeding Experimental Design
3.2.1. Energy Balance
3.2.2. Body Composition
3.2.3. Evaluation of the Intestinal Tract
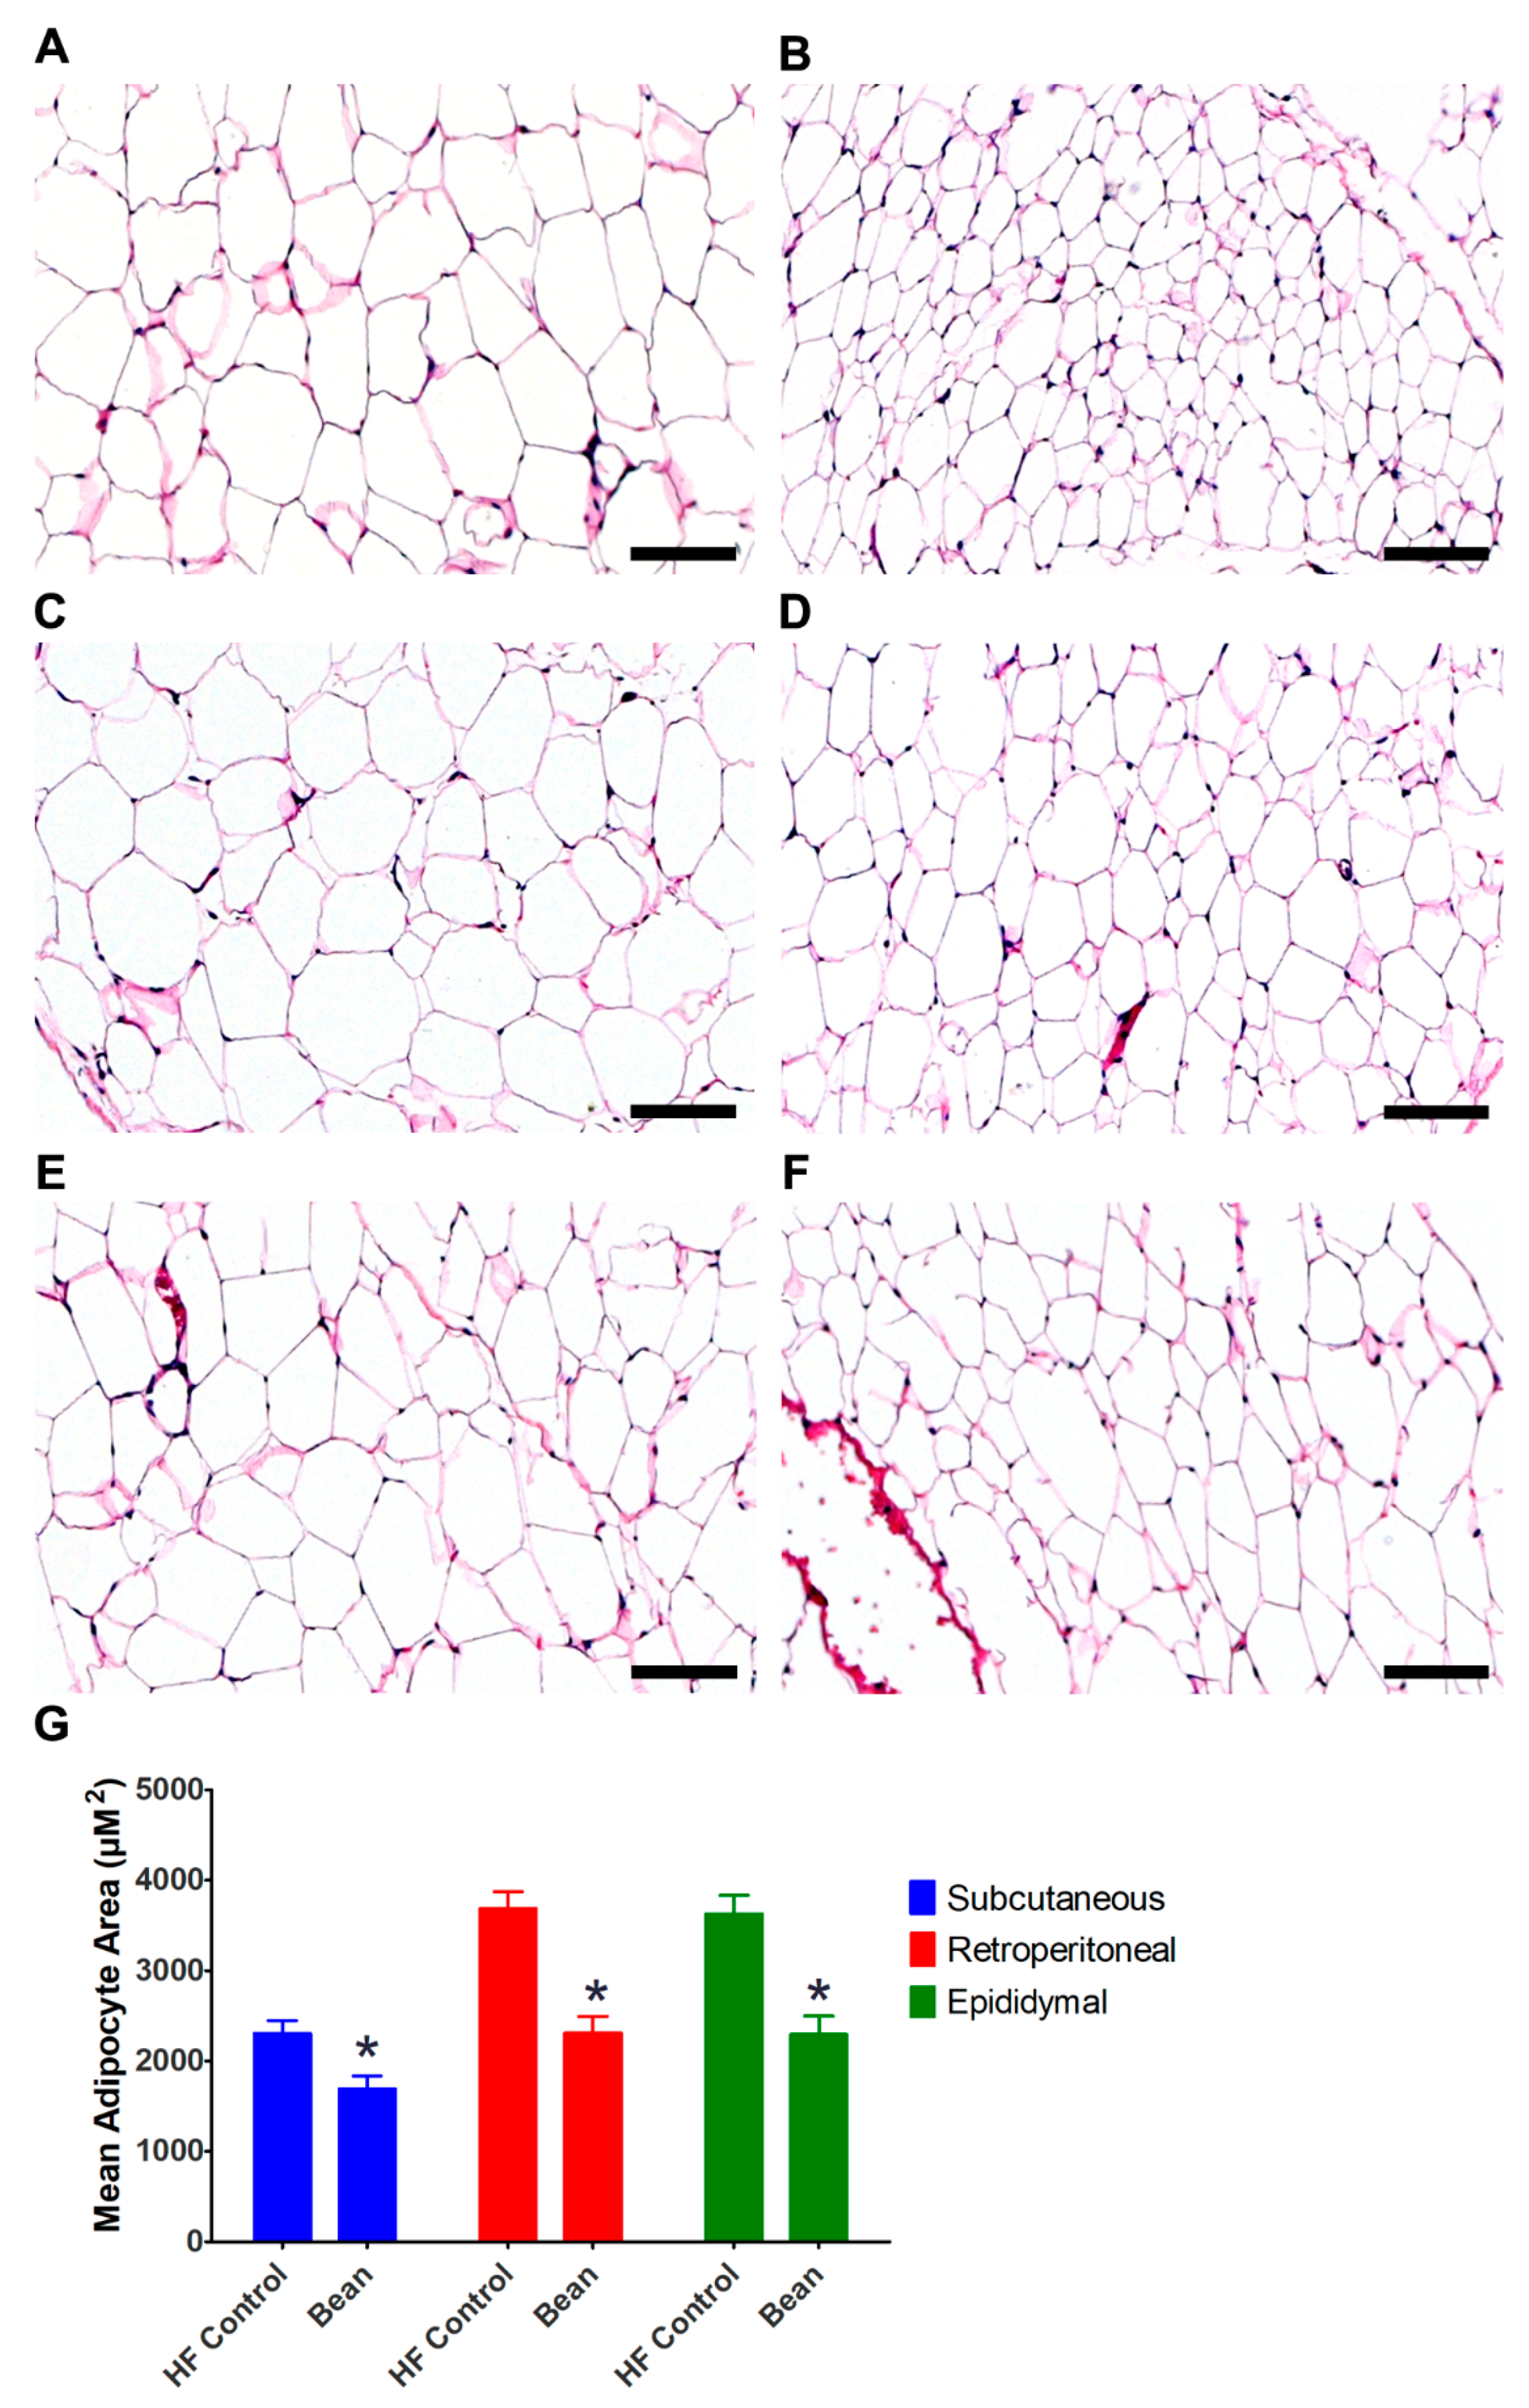
3.3. Structural and Functional Assessments
3.3.1. Morphometric Analyses
3.3.2. Bile Acid and FXR Signaling
4. Discussion
5. Conclusions
Supplementary Materials
Author Contributions
Funding
Acknowledgments
Conflicts of Interest
References
- Hruby, A.; Hu, F.B. The Epidemiology of Obesity: A Big Picture. Pharmacoeconomics 2015, 33, 673–689. [Google Scholar] [CrossRef] [PubMed]
- Lauby-Secretan, B.; Scoccianti, C.; Loomis, D.; Grosse, Y.; Bianchini, F.; Straif, K. Body Fatness and Cancer—Viewpoint of the IARC Working Group. N. Engl. J. Med. 2016, 375, 794–798. [Google Scholar] [CrossRef] [PubMed]
- Cefalu, W.T.; Bray, G.A.; Home, P.D.; Garvey, W.T.; Klein, S.; Pi-Sunyer, F.X.; Hu, F.B.; Raz, I.; Van Gaal, L.; Wolfe, B.M.; et al. Advances in the science, treatment, and prevention of the disease of obesity: Reflections from a diabetes care editors’ expert forum. Diabetes Care 2015, 38, 1567–1582. [Google Scholar] [CrossRef]
- Lakerveld, J.; Mackenbach, J. The Upstream Determinants of Adult Obesity. Obes. Facts 2017, 10, 216–222. [Google Scholar] [CrossRef]
- Food and Agriculture Organization of the United Nations. Definition and Classification of Commodities: Pulses and Derived Products. Available online: http://www.fao.org/es/faodef/fdef04e.htm (accessed on 20 January 2017).
- Viguiliouk, E.; Stewart, S.E.; Jayalath, V.H.; Ng, A.P.; Mirrahimi, A.; de Souza, R.J.; Hanley, A.J.; Bazinet, R.P.; Blanco, M.S.; Leiter, L.A.; et al. Effect of Replacing Animal Protein with Plant Protein on Glycemic Control in Diabetes: A Systematic Review and Meta-Analysis of Randomized Controlled Trials. Nutrients 2015, 7, 9804–9824. [Google Scholar] [CrossRef]
- Viguiliouk, E.; Blanco, M.S.; Kendall, C.W.; Sievenpiper, J.L. Can pulses play a role in improving cardiometabolic health? Evidence from systematic reviews and meta-analyses. Ann. N. Y. Acad. Sci 2017, 1392, 43–57. [Google Scholar] [CrossRef]
- Thompson, H.J.; McGinley, J.N.; Neil, E.S.; Brick, M.A. Beneficial Effects of Common Bean on Adiposity and Lipid Metabolism. Nutrients 2017, 9, 998. [Google Scholar] [CrossRef]
- De Boer, J.F.; Schonewille, M.; Boesjes, M.; Wolters, H.; Bloks, V.W.; Bos, T.; van Dijk, T.H.; Jurdzinski, A.; Boverhof, R.; Wolters, J.C.; et al. Intestinal Farnesoid X Receptor Controls Transintestinal Cholesterol Excretion in Mice. Gastroenterology 2017, 152, 1126–1138. [Google Scholar] [CrossRef]
- Gonzalez, F.J.; Jiang, C.; Patterson, A.D. An Intestinal Microbiota-Farnesoid X Receptor Axis Modulates Metabolic Disease. Gastroenterology 2016, 151, 845–859. [Google Scholar] [CrossRef]
- Gonzalez, F.J.; Jiang, C.; Xie, C.; Patterson, A.D. Intestinal Farnesoid X Receptor Signaling Modulates Metabolic Disease. Dig. Dis. 2017, 35, 178–184. [Google Scholar] [CrossRef]
- D12492 Rodent Diet With 60 kcal% Fat—Research Diets, Inc. Available online: https://researchdiets.com/formulas/d12492 (accessed on 11 January 2017).
- D12450B Rodent Diet With 10 kcal% Fat—Research Diets, Inc. Available online: https://www.researchdiets.com/formulas/d12450b (accessed on 11 January 2017).
- Zhu, Z.; Jiang, W.; Thompson, H.J. Edible dry bean consumption (Phaseolus vulgaris L.) modulates cardiovascular risk factors and diet-induced obesity in rats and mice. Br. J. Nutr. 2012, 108 (Suppl. 1), S66–S73. [Google Scholar] [CrossRef] [PubMed]
- Thompson, M.D.; Thompson, H.J.; Brick, M.A.; McGinley, J.N.; Jiang, W.; Zhu, Z.; Wolfe, P. Mechanisms associated with dose-dependent inhibition of rat mammary carcinogenesis by dry bean (Phaseolus vulgaris, L.). J. Nutr. 2008, 138, 2091–2097. [Google Scholar] [CrossRef] [PubMed]
- Reeves, P.G.; Nielsen, F.H.; Fahey, G.C., Jr. AIN-93 purified diets for laboratory rodents: Final report of the American Institute of Nutrition ad hoc writing committee on the reformulation of the AIN-76A rodent diet. J. Nutr. 1993, 123, 1939–1951. [Google Scholar] [CrossRef] [PubMed]
- Chu, D.T.; Malinowska, E.; Jura, M.; Kozak, L.P. C57BL/6J mice as a polygenic developmental model of diet-induced obesity. Physiol. Rep. 2017, 5. [Google Scholar] [CrossRef]
- Yin, F.C.; Spurgeon, H.A.; Rakusan, K.; Weisfeldt, M.L.; Lakatta, E.G. Use of tibial length to quantify cardiac hypertrophy: Application in the aging rat. Am. J. Physiol. 1982, 243, H941–H947. [Google Scholar] [CrossRef]
- Jiang, C.; Xie, C.; Lv, Y.; Li, J.; Krausz, K.W.; Shi, J.; Brocker, C.N.; Desai, D.; Amin, S.G.; Bisson, W.H.; et al. Intestine-selective farnesoid X receptor inhibition improves obesity-related metabolic dysfunction. Nat. Commun. 2015, 6, 10166. [Google Scholar] [CrossRef]
- Livak, K.J.; Schmittgen, T.D. Analysis of relative gene expression data using real-time quantitative PCR and the 2(-Delta Delta C(T)) Method. Methods 2001, 25, 402–408. [Google Scholar] [CrossRef]
- De Gregoris, T.B.; Aldred, N.; Clare, A.S.; Burgess, J.G. Improvement of phylum- and class-specific primers for real-time PCR quantification of bacterial taxa. J. Microbiol. Methods 2011, 86, 351–356. [Google Scholar] [CrossRef]
- Yang, Y.W.; Chen, M.K.; Yang, B.Y.; Huang, X.J.; Zhang, X.R.; He, L.Q.; Zhang, J.; Hua, Z.C. Use of 16S rRNA Gene-Targeted Group-Specific Primers for Real-Time PCR Analysis of Predominant Bacteria in Mouse Feces. Appl. Environ. Microbiol. 2015, 81, 6749–6756. [Google Scholar] [CrossRef]
- Collado, M.C.; Derrien, M.; Isolauri, E. Intestinal integrity and Akkermansia muciniphila, a mucin-degrading member of the intestinal microbiota present in infants, adults, and the elderly. Appl. Environ. Microbiol. 2007, 73, 7767–7770. [Google Scholar] [CrossRef]
- Koliada, A.; Syzenko, G.; Moseiko, V.; Budovska, L.; Puchkov, K.; Perederiy, V.; Gavalko, Y.; Dorofeyev, A.; Romanenko, M.; Tkach, S.; et al. Association between body mass index and Firmicutes/Bacteroidetes ratio in an adult Ukrainian population. BMC Microbiol. 2017, 17, 120. [Google Scholar] [CrossRef] [PubMed]
- Luna, L.G. Manual of Histologic Staining Methods of the Armed Forces Institute of Pathology, 3rd ed.; McGraw-Hill: New York, NY, USA, 1968; p. 258. [Google Scholar]
- Matthews, S.B.; McGinley, J.N.; Neil, E.S.; Thompson, H.J. Premenopausal Obesity and Breast Cancer Growth Rates in a Rodent Model. Nutrients 2016, 8, 214. [Google Scholar] [CrossRef] [PubMed]
- Tuominen, V.J.; Ruotoistenmaki, S.; Viitanen, A.; Jumppanen, M.; Isola, J. ImmunoRatio: A publicly available web application for quantitative image analysis of estrogen receptor (ER), progesterone receptor (PR), and Ki-67. Breast Cancer Res. 2010, 12, R56. [Google Scholar] [CrossRef]
- Fall, T.; Salihovic, S.; Brandmaier, S.; Nowak, C.; Ganna, A.; Gustafsson, S.; Broeckling, C.D.; Prenni, J.E.; Kastenmuller, G.; Peters, A.; et al. Non-targeted metabolomics combined with genetic analyses identifies bile acid synthesis and phospholipid metabolism as being associated with incident type 2 diabetes. Diabetologia 2016, 59, 2114–2124. [Google Scholar] [CrossRef] [PubMed]
- Broeckling, C.D.; Heuberger, A.L.; Prenni, J.E. Large scale non-targeted metabolomic profiling of serum by ultra performance liquid chromatography-mass spectrometry (UPLC-MS). J. Vis. Exp. 2013, 73, e50242. [Google Scholar] [CrossRef] [PubMed]
- Broeckling, C.D.; Afsar, F.A.; Neumann, S.; Ben-Hur, A.; Prenni, J.E. RAMClust: A novel feature clustering method enables spectral-matching-based annotation for metabolomics data. Anal. Chem. 2014, 86, 6812–6817. [Google Scholar] [CrossRef]
- Pathak, P.; Cen, X.; Nichols, R.G.; Ferrell, J.M.; Boehme, S.; Krausz, K.W.; Patterson, A.D.; Gonzalez, F.J.; Chiang, J.Y.L. Intestine farnesoid X receptor agonist and the gut microbiota activate G-protein bile acid receptor-1 signaling to improve metabolism. Hepatology 2018, 68, 1574–1588. [Google Scholar] [CrossRef]
- Barrett, P.; Mercer, J.G.; Morgan, P.J. Preclinical models for obesity research. Dis. Models Mech. 2016, 9, 1245–1255. [Google Scholar] [CrossRef]
- Mitchell, D.C.; Lawrence, F.R.; Hartman, T.J.; Curran, J.M. Consumption of dry beans, peas, and lentils could improve diet quality in the US population. J. Am. Diet. Assoc. 2009, 109, 909–913. [Google Scholar] [CrossRef]
- Katiraei, S.; Hoving, L.R.; van Beek, L.; Mohamedhoesein, S.; Carlotti, F.; van Diepen, J.A.; Rensen, P.C.N.; Netea, M.G.; Willems van Dijk, K.; Berbee, J.F.P.; et al. BMT decreases HFD-induced weight gain associated with decreased preadipocyte number and insulin secretion. PLoS ONE 2017, 12, e0175524. [Google Scholar] [CrossRef]
- Monk, J.M.; Lepp, D.; Wu, W.; Pauls, K.P.; Robinson, L.E.; Power, K.A. Navy and black bean supplementation primes the colonic mucosal microenvironment to improve gut health. J. Nutr. Biochem. 2017, 49, 89–100. [Google Scholar] [CrossRef] [PubMed]
- Caesar, R.; Tremaroli, V.; Kovatcheva-Datchary, P.; Cani, P.D.; Backhed, F. Crosstalk between Gut Microbiota and Dietary Lipids Aggravates WAT Inflammation through TLR Signaling. Cell Metab. 2015, 22, 658–668. [Google Scholar] [CrossRef] [PubMed]
- Wageningen University and Research Centre. Intestinal Bacterium Akkermansia Curbs Obesity. Available online: https://www.sciencedaily.com/releases/2013/05/130515113744.htm (accessed on 14 September 2019).
- Dao, M.C.; Everard, A.; Aron-Wisnewsky, J.; Sokolovska, N.; Prifti, E.; Verger, E.O.; Kayser, B.D.; Levenez, F.; Chilloux, J.; Hoyles, L.; et al. Akkermansia muciniphila and improved metabolic health during a dietary intervention in obesity: Relationship with gut microbiome richness and ecology. Gut 2016, 65, 426–436. [Google Scholar] [CrossRef] [PubMed]
- Derrien, M.; Belzer, C.; de Vos, W.M. Akkermansia muciniphila and its role in regulating host functions. Microb. Pathog. 2017, 106, 171–181. [Google Scholar] [CrossRef]
- Everard, A.; Belzer, C.; Geurts, L.; Ouwerkerk, J.P.; Druart, C.; Bindels, L.B.; Guiot, Y.; Derrien, M.; Muccioli, G.G.; Delzenne, N.M.; et al. Cross-talk between Akkermansia muciniphila and intestinal epithelium controls diet-induced obesity. Proc. Natl. Acad. Sci. USA 2013, 110, 9066–9071. [Google Scholar] [CrossRef]
- Van der Lugt, B.; van Beek, A.A.; Aalvink, S.; Meijer, B.; Sovran, B.; Vermeij, W.P.; Brandt, R.M.C.; de Vos, W.M.; Savelkoul, H.F.J.; Steegenga, W.T.; et al. Akkermansia muciniphila ameliorates the age-related decline in colonic mucus thickness and attenuates immune activation in accelerated aging Ercc1(-/7) mice. Immun. Ageing 2019, 16, 6. [Google Scholar] [CrossRef]
- Depommier, C.; Everard, A.; Druart, C.; Plovier, H.; Van Hul, M.; Vieira-Silva, S.; Falony, G.; Raes, J.; Maiter, D.; Delzenne, N.M.; et al. Supplementation with Akkermansia muciniphila in overweight and obese human volunteers: A proof-of-concept exploratory study. Nat. Med. 2019, 25, 1096–1103. [Google Scholar] [CrossRef]
- Monk, J.M.; Lepp, D.; Zhang, C.P.; Wu, W.; Zarepoor, L.; Lu, J.T.; Pauls, K.P.; Tsao, R.; Wood, G.A.; Robinson, L.E.; et al. Diets enriched with cranberry beans alter the microbiota and mitigate colitis severity and associated inflammation. J. Nutr. Biochem. 2016, 28, 129–139. [Google Scholar] [CrossRef]
- Monk, J.M.; Wu, W.; Hutchinson, A.L.; Pauls, P.; Robinson, L.E.; Power, K.A. Navy and black bean supplementation attenuates colitis-associated inflammation and colonic epithelial damage. J. Nutr. Biochem. 2018, 56, 215–223. [Google Scholar] [CrossRef]
- Monk, J.M.; Zhang, C.P.; Wu, W.; Zarepoor, L.; Lu, J.T.; Liu, R.; Pauls, K.P.; Wood, G.A.; Tsao, R.; Robinson, L.E.; et al. White and dark kidney beans reduce colonic mucosal damage and inflammation in response to dextran sodium sulfate. J. Nutr. Biochem. 2015, 26, 752–760. [Google Scholar] [CrossRef]
- Farzaneh, V.; Carvalho, I.S. A review of the health benefit potentials of herbal plant infusions and their mechanism of actions. Ind. Crops Prod. 2015, 65, 247–258. [Google Scholar] [CrossRef]
- Daniell, E.L.; Ryan, E.P.; Brick, M.A.; Thompson, H.J. Dietary dry bean effects on hepatic expression of stress and toxicity-related genes in rats. Br. J. Nutr. 2012, 108 (Suppl. 1), S37–S45. [Google Scholar] [CrossRef] [PubMed]
- Arouca, A.; Michels, N.; Moreno, L.A.; Gonzalez-Gil, E.M.; Marcos, A.; Gomez, S.; Diaz, L.E.; Widhalm, K.; Molnar, D.; Manios, Y.; et al. Associations between a Mediterranean diet pattern and inflammatory biomarkers in European adolescents. Eur. J. Nutr. 2018, 57, 1747–1760. [Google Scholar] [CrossRef] [PubMed]
- Cinti, S. UCP1 protein: The molecular hub of adipose organ plasticity. Biochimie 2017, 134, 71–76. [Google Scholar] [CrossRef]
- Bachmanov, A.A.; Reed, D.R.; Tordoff, M.G.; Price, R.A.; Beauchamp, G.K. Nutrient preference and diet-induced adiposity in C57BL/6ByJ and 129P3/J mice. Physiol. Behav. 2001, 72, 603–613. [Google Scholar] [CrossRef]


| Ingredient | Low Fat Control Diet 1 (g/100g) | High Fat Control Diet 1 (g/100g) | Cooked, Whole White Kidney Bean 1 (g/100g) |
|---|---|---|---|
| Solka-Floc | 4.7 | 6.5 | 0.0 |
| White kidney bean | 0.0 | 0.0 | 40.0 |
| Corn Starch | 29.9 | 0.0 | 0.0 |
| Casein (≥85% protein) | 19.0 | 25.8 | 17.1 |
| Cerelose (Dextrose) | 3.3 | 16.2 | 0.0 |
| Sucrose | 33.2 | 8.9 | 0.3 |
| Vitamin mix 2 | 1.0 | 1.3 | 1.3 |
| DL-Methionine | 0.3 | 0.4 | 0.4 |
| L-Tryptophan (Sigma T0254-25G) | 0.00 | 0.00 | 0.01 |
| Choline bitartrate (41% choline) | 0.2 | 0.3 | 0.3 |
| Mineral mix 3 | 4.3 | 5.8 | 5.8 |
| Soybean oil | 2.4 | 3.2 | 3.2 |
| Palm Oil | 1.9 | 31.7 | 31.7 |
| TOTAL (g) | 100.0 | 100.0 | 100.0 |
| Gene Expression Primers | Sequence | References |
| 18S FWD | 5′- ATTGGAGCTGGAATTACCGC -3′ | [19] |
| 18S REV | 5′- CGGCTACCACATCCAAGGAA -3′ | [19] |
| FXR FWD | 5′- TGGGCTCCGAATCCTCTTAGA -3′ | [19] |
| FXR REV | 5′- TGGTCCTCAAATAAGATCCTTGG -3′ | [19] |
| SHP FWD | 5′- TCTGCAGGTCGTCCGACTATTC -3′ | [19] |
| SHP REV | 5′- AGGCAGTGGCTGTGAGATGC -3′ | [19] |
| FGF15 FWD | 5′- GCCATCAAGGACGTCAGCA -3′ | [19] |
| FGF15 REV | 5′- CTTCCTCCGAGTAGCGAATCAG -3′ | [19] |
| Bacterial Primers | Sequence | References |
| 16S (926) FWD | 5′- AAA CTC AAA KGA ATT GAC GG -3′ | [21,22] |
| 16S (1062) REV | 5′- CTC ACR RCA CGA GCT GAC -3′ | [21,22] |
| Akkermansia Muciniphila FWD | 5′- CAG CAC GTG AAG GTG GGG AC -3′ | [23] |
| Akkermansia Muciniphila REV | 5′- CCT TGC GGT TGG CTT CAG AT -3′ | [23] |
| Bacteroidetes FWD | 5′- AAA CTC AAA KGA ATT GAC GG -3′ | [24] |
| Bacteroidetes REV | 5′- GGT AAG GTT CCT CGC GCT AT -3′ | [24] |
| Firmicutes (928) FWD | 5′- TGA AAC TYA AGG AAT TGA CG -3′ | [24] |
| Firmicutes (1040) REV | 5′- ACC ATG CAC CAC CTG TC -3′ | [24] |
| Diet 1 | Total Diet Eaten (g) | Total Weight Gained (g) | Feed Efficiency Ratio | Total Feces Excreted (mg/day) | Fecal Energy Concentration (kcal/g) | Total Fecal Energy/day (kcal) |
|---|---|---|---|---|---|---|
| Control | 154.5 ± 6.6 | 3.5 ± 1.8 | 0.023 ± 0.012 | 256.9 ± 18.4 | 3.77 ± 0.11 | 0.97 ± 0.09 |
| Bean | 167.3 ± 16.9 | 2.8 ± 1.7 | 0.016 ± 0.009 | 273.8 ± 33.7 | 3.77 ± 0.05 | 1.03 ± 0.13 |
| p-value | 0.0650 | 0.4467 | 0.2412 | 0.2350 | 0.9987 | 0.2601 |
| Diet 1 | Final Body Weight (g) | Body Mass Index 2 (g/mm) | Subcutaneous Fat Mass 3 (mg/mm) | Sum Visceral Fat Mass 4 (mg/mm) | Total Fat Mass 5 (mg/mm) |
|---|---|---|---|---|---|
| Control | 38.2 ± 3.3 | 2.2 ± 0.2 | 64.1 ± 9.1 | 189.1 ± 30.3 | 253.2 ± 38.3 |
| Bean | 38.4 ± 3.4 | 2.2 ± 0.2 | 47.6 ± 12.2 | 172.5 ± 33.3 | 220.1 ± 44.3 |
| p-value | 0.9182 | 0.9486 | 0.0085 | 0.3138 | 0.1323 |
| Measurement 1. | Tissue | HF Control | Bean | p-Value |
|---|---|---|---|---|
| Crypt height (µm2) | Ileum | 252.1 ± 41.1 | 274.5 ± 29.5 | 0.2916 |
| Ascending colon | 92.2 ± 9.3 | 82.2 ± 11.7 | 0.1141 | |
| Transverse colon | 182.2 ± 23.7 | 214.1 ± 13.1 | 0.0136 | |
| Descending colon | 135.9 ± 9.6 | 153.9 ± 16.6 | 0.0324 | |
| Alcian blue area (µm2) | Ileum | 1170.5 ± 557.5 | 1105.3 ± 280.1 | 0.8008 |
| Ascending colon | 1335.5 ± 248.7 | 1215.1 ± 312.6 | 0.4549 | |
| Transverse colon | 4344.1± 1274.9 | 5711.3 ± 1.518.2 | 0.1049 | |
| Descending colon | 1731.4 ± 360.6 | 1508.1 ± 263.1 | 0.2358 | |
| Ki-67 (%) 2 | Ileum | 26.3 ± 5.8 | 26.4 ± 4.8 | 0.9673 |
| Ascending colon | 19.4 ± 3.4 | 21.7 ± 3.2 | 0.2451 | |
| Transverse colon | 19.1 ± 5.9 | 22.9 ± 3.4 | 0.1908 | |
| Descending colon | 17.6 ± 2.0 | 17.5 ± 1.3 | 0.8658 |
© 2019 by the authors. Licensee MDPI, Basel, Switzerland. This article is an open access article distributed under the terms and conditions of the Creative Commons Attribution (CC BY) license (http://creativecommons.org/licenses/by/4.0/).
Share and Cite
Neil, E.S.; McGinley, J.N.; Fitzgerald, V.K.; Lauck, C.A.; Tabke, J.A.; Streeter-McDonald, M.R.; Yao, L.; Broeckling, C.D.; Weir, T.L.; Foster, M.T.; et al. White Kidney Bean (Phaseolus Vulgaris L.) Consumption Reduces Fat Accumulation in a Polygenic Mouse Model of Obesity. Nutrients 2019, 11, 2780. https://doi.org/10.3390/nu11112780
Neil ES, McGinley JN, Fitzgerald VK, Lauck CA, Tabke JA, Streeter-McDonald MR, Yao L, Broeckling CD, Weir TL, Foster MT, et al. White Kidney Bean (Phaseolus Vulgaris L.) Consumption Reduces Fat Accumulation in a Polygenic Mouse Model of Obesity. Nutrients. 2019; 11(11):2780. https://doi.org/10.3390/nu11112780
Chicago/Turabian StyleNeil, Elizabeth S., John N. McGinley, Vanessa K. Fitzgerald, Corey A. Lauck, Jeremy A. Tabke, Madyson R. Streeter-McDonald, Linxing Yao, Corey D. Broeckling, Tiffany L. Weir, Michelle T. Foster, and et al. 2019. "White Kidney Bean (Phaseolus Vulgaris L.) Consumption Reduces Fat Accumulation in a Polygenic Mouse Model of Obesity" Nutrients 11, no. 11: 2780. https://doi.org/10.3390/nu11112780
APA StyleNeil, E. S., McGinley, J. N., Fitzgerald, V. K., Lauck, C. A., Tabke, J. A., Streeter-McDonald, M. R., Yao, L., Broeckling, C. D., Weir, T. L., Foster, M. T., & Thompson, H. J. (2019). White Kidney Bean (Phaseolus Vulgaris L.) Consumption Reduces Fat Accumulation in a Polygenic Mouse Model of Obesity. Nutrients, 11(11), 2780. https://doi.org/10.3390/nu11112780