Disordered Eating Attitudes and Behavioral and Neuroelectric Indices of Cognitive Flexibility in Individuals with Overweight and Obesity


 and
and 
Abstract
1. Introduction
2. Materials and Methods
2.1. Participants and Procedures
2.2. Intelligence Quotient
2.3. Habitual Diet Quality
2.4. Anthropometric Measures
2.5. Eating Attitudes Test-26
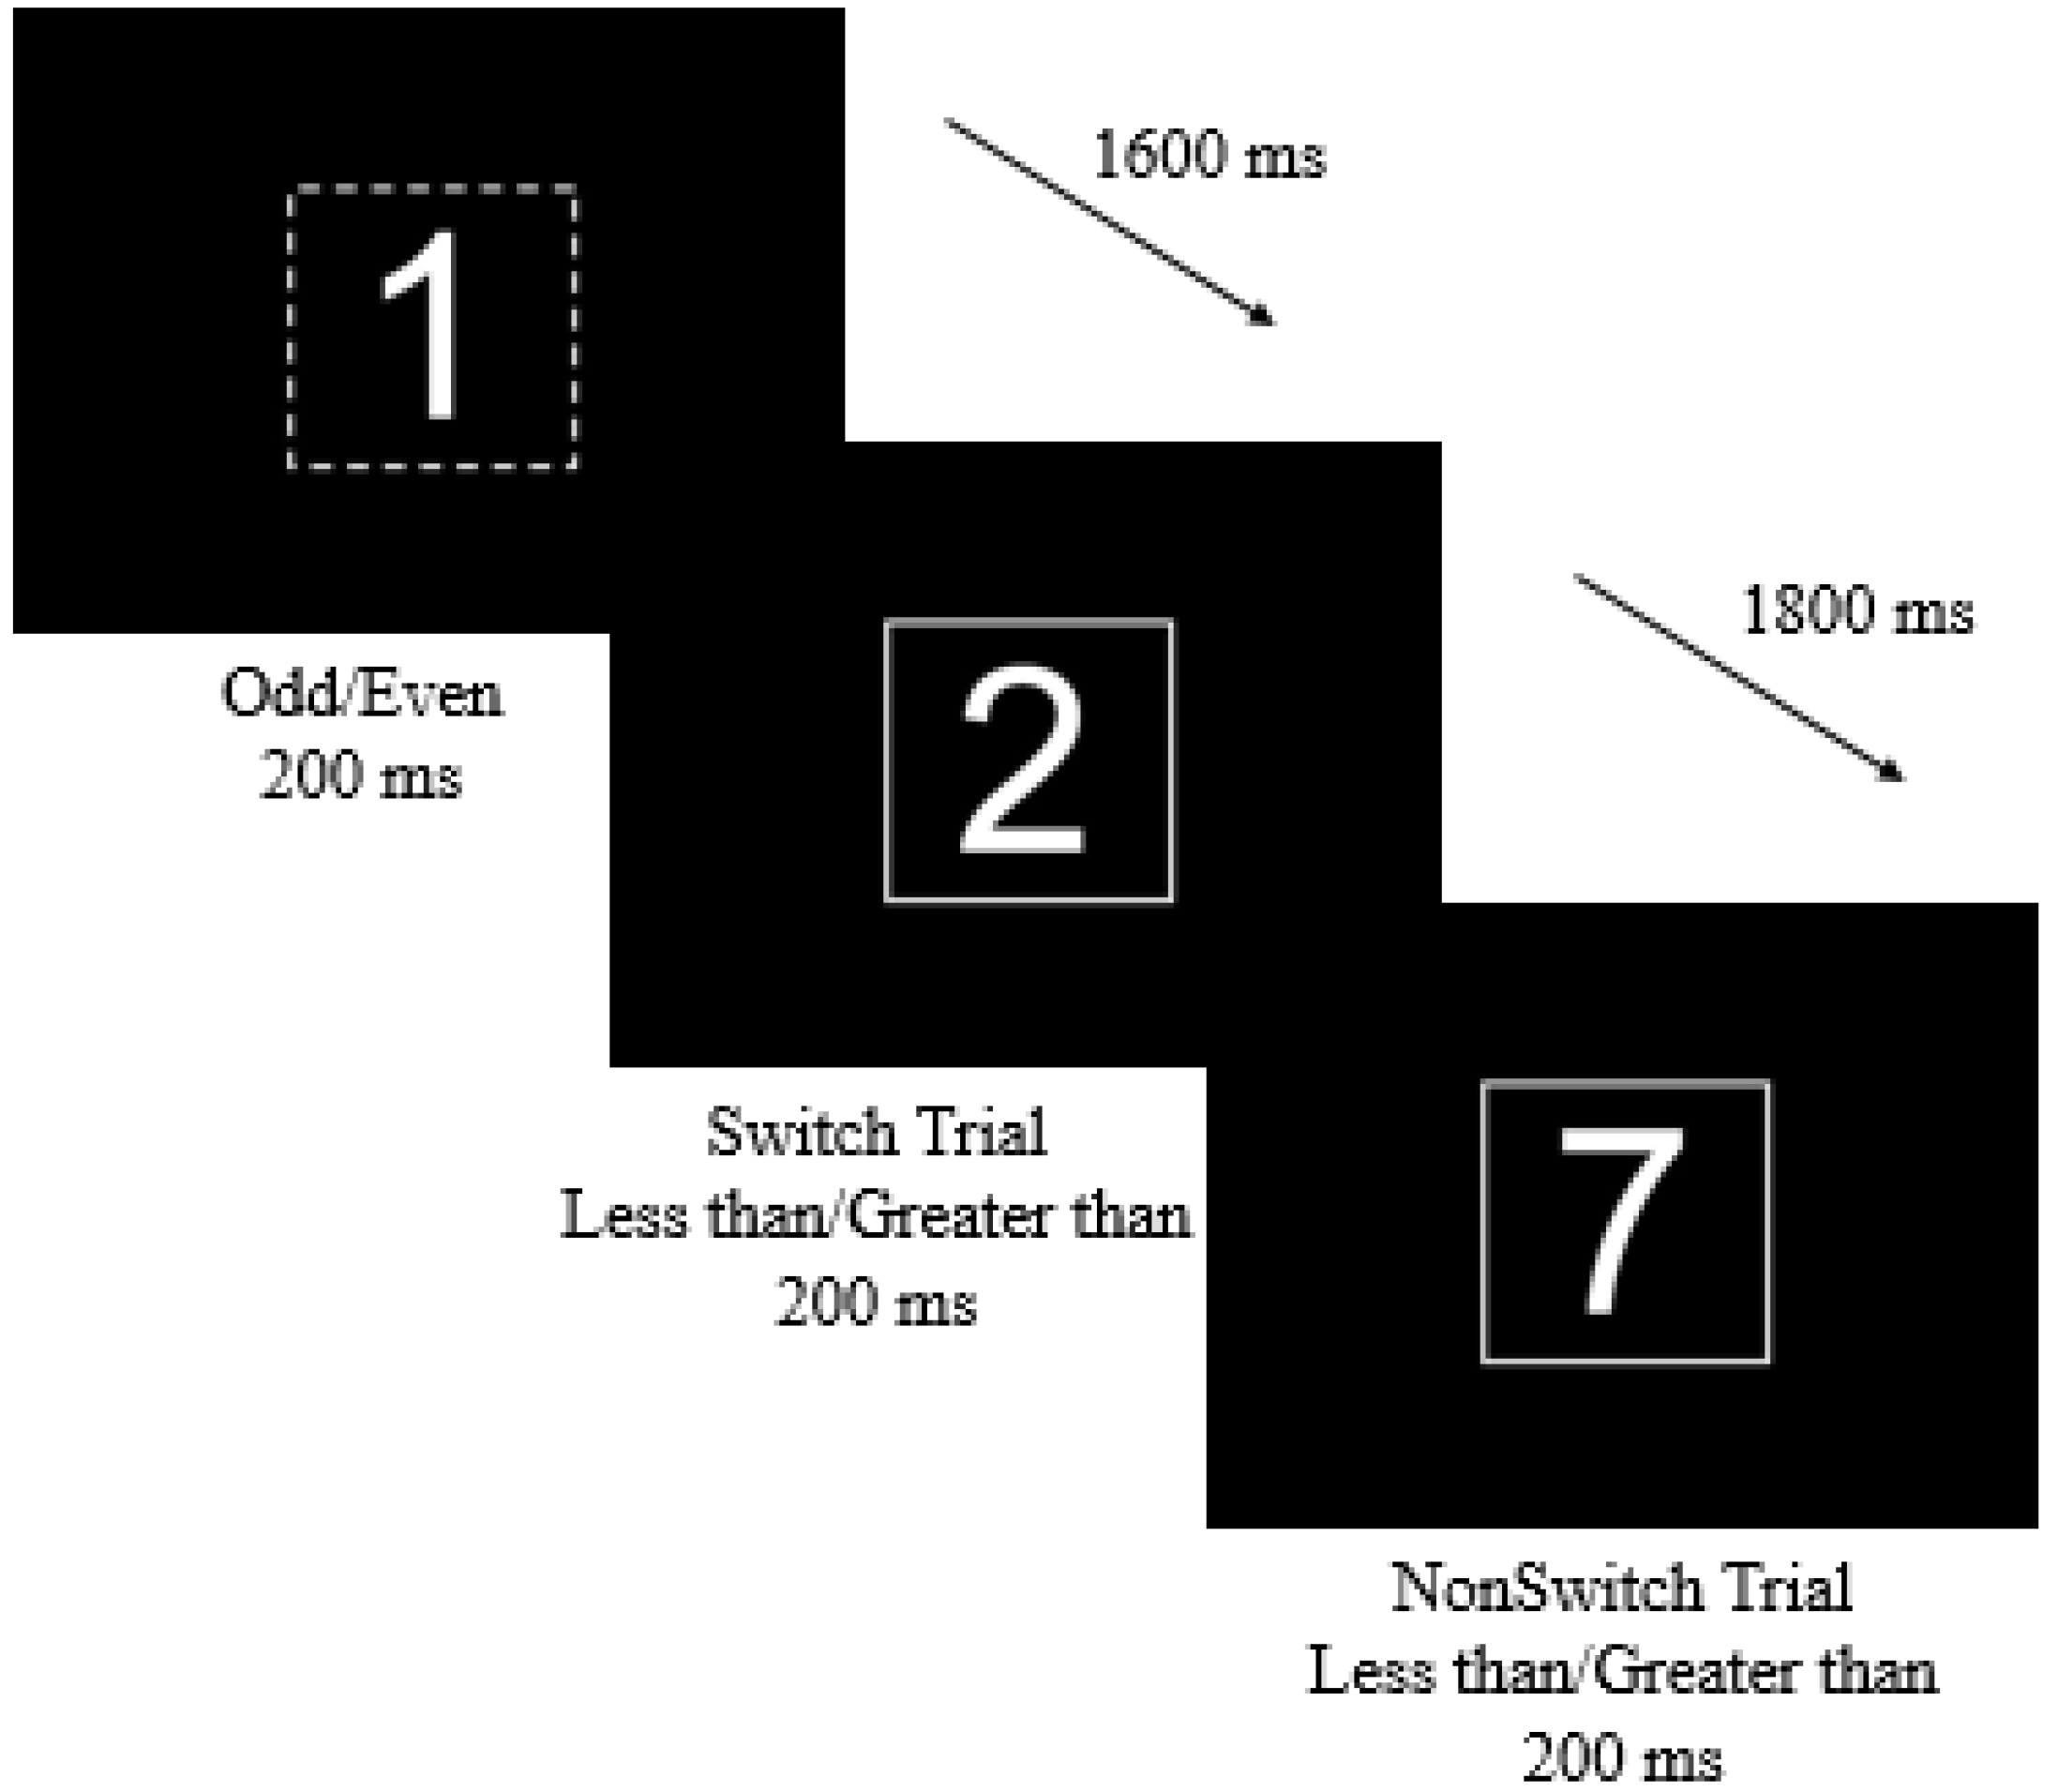
2.6. Switch Task
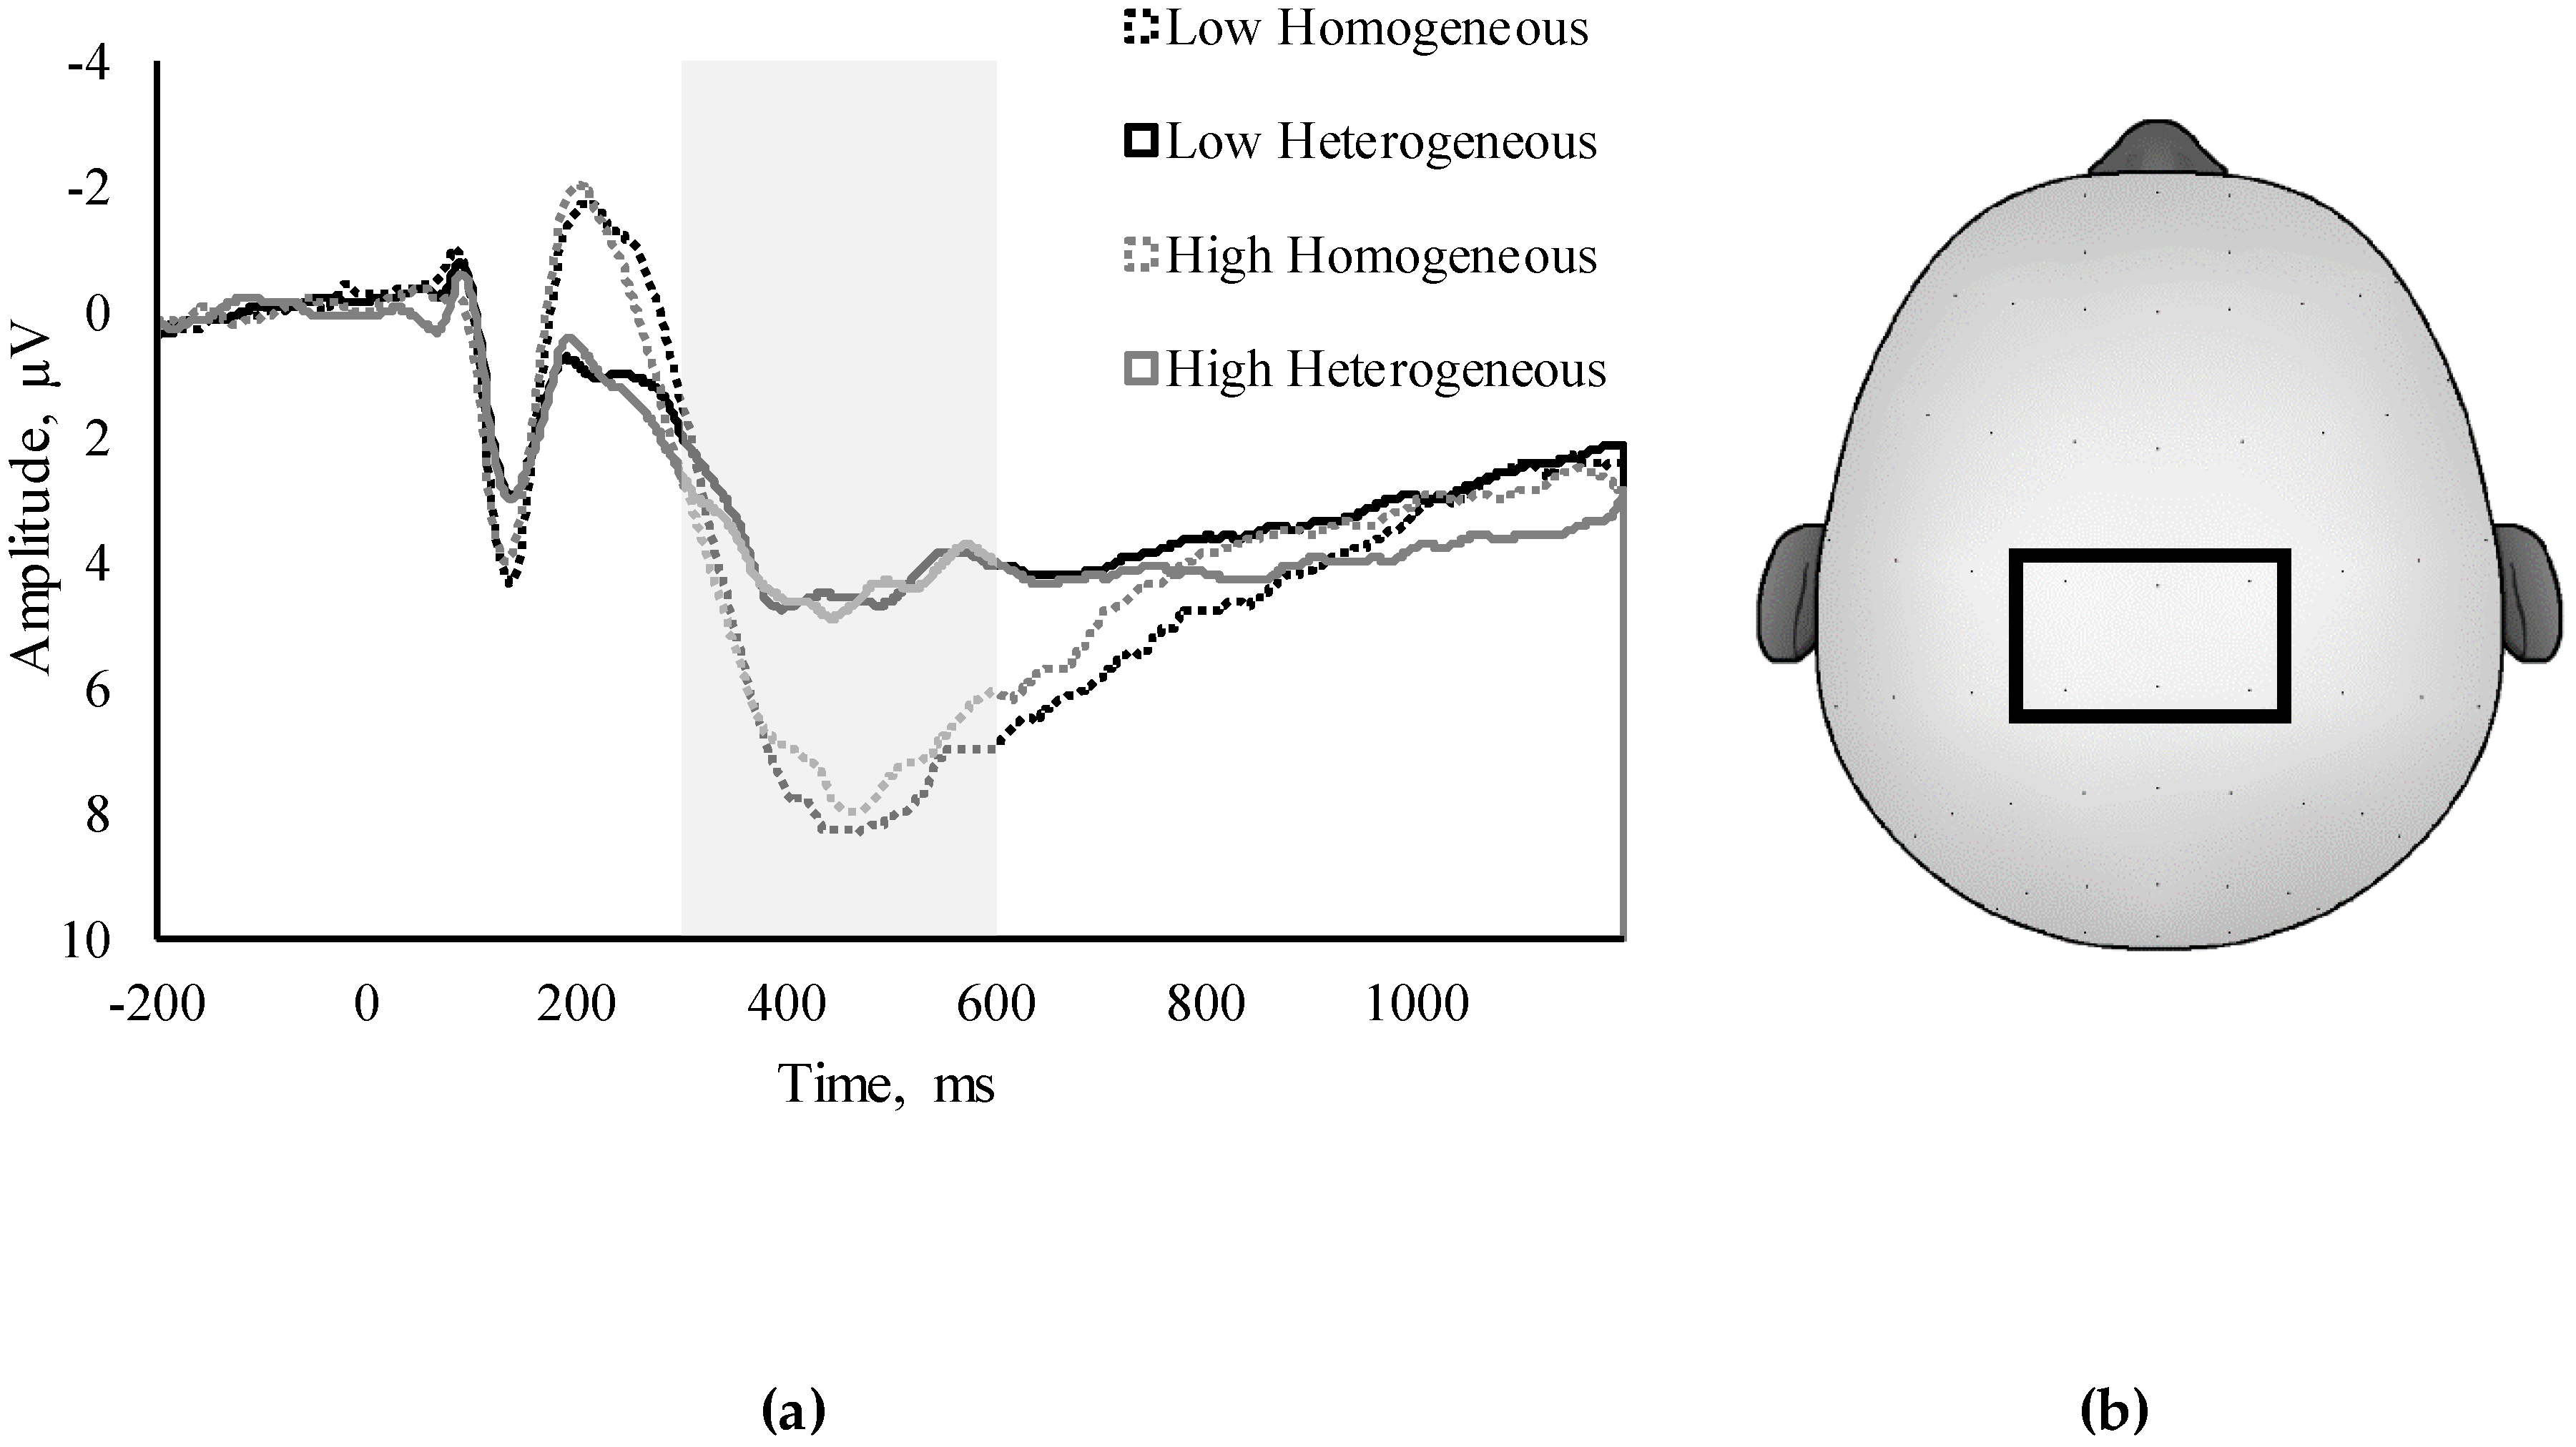
2.7. ERP Assessment
2.8. Statistical Analysis
3. Results
3.1. EAT-26
3.2. Bivariate Correlations
3.3. Regression Analyses
4. Discussion
5. Conclusions
Author Contributions
Funding
Acknowledgments
Conflicts of Interest
References
- Krebs-Smith, S.M.; Guenther, P.M.; Subar, A.F.; Kirkpatrick, S.I.; Dodd, K.W. Americans do not meet Federal Dietary Recommendations. J. Nutr. 2010, 140, 1832–1838. [Google Scholar] [CrossRef]
- Hofmann, J.; Ardelt-Gattinger, E.; Paulmichl, K.; Weghuber, D.; Blechert, J. Dietary restraint and impulsivity modulate neural responses to food in adolescents with obesity and healthy adolescents. Obesity 2015, 23, 2183–2189. [Google Scholar] [CrossRef] [PubMed]
- Diamond, A. Executive Functions. Annu. Rev. Clin. Psychol. 2013, 64, 135–168. [Google Scholar] [CrossRef] [PubMed]
- Dajani, D.R.; Uddin, L.Q. Demystifying cognitive flexibility: Implications for clinical and developmental neuroscience. Anal Chem. 2015, 25, 368–379. [Google Scholar] [CrossRef] [PubMed]
- Ziauddeen, H.; Alonso-Alonso, M.; Hill, J.O.; Kelley, M.; Khan, N.A. Obesity and the neurocognitive basis of food reward and the control of intake. Adv. Nutr. 2015, 6. [Google Scholar] [CrossRef] [PubMed]
- Mobbs, O.; Van der Linden, M.; d’Acremont, M.; Perroud, A. Cognitive deficits and biases for food and body in bulimia: Investigation using an affective shifting task. Eat. Behav. 2008, 9, 455–461. [Google Scholar] [CrossRef] [PubMed]
- Hendrikse, J.J.; Cachia, R.L.; Kothe, E.J.; Mcphie, S.; Skouteris, H.; Hayden, M.J. Attentional biases for food cues in overweight and individuals with obesity: A systematic review of the literature. Obes. Rev. 2015, 16, 424–432. [Google Scholar] [CrossRef]
- Roberts, M.E.; Tchanturia, K.; Stahl, D.; Southgate, L.; Treasure, J. A systematic review and meta-analysis of set-shifting ability in eating disorders. Psychol. Med. 2007, 37, 1075–1084. [Google Scholar] [CrossRef] [PubMed]
- Rosval, L.; Steiger, H.; Bruce, K.; Israël, M.; Richardson, J.; Aubut, M. Impulsivity in women with eating disorders: Problem of response inhibition, planning, or attention? Int. J. Eat. Disord. 2006, 39, 590–593. [Google Scholar] [CrossRef] [PubMed]
- Perpiñá, C.; Segura, M.; Sánchez-Reales, S. Cognitive flexibility and decision-making in eating disorders and obesity. Eat. Weight Disord. Stud. Anorexia Bulim. Obes. 2016, 22, 435–444. [Google Scholar] [CrossRef]
- Hudson, J.I.; Hiripi, E.; Pope, H.G.; Kessler, R.C. The Prevalence and Correlates of Eating Disorders in the National Comorbidity Survey Replication. Biol. Psychiatry 2007, 61, 348–358. [Google Scholar] [CrossRef] [PubMed]
- Wolz, I.; Fagundo, A.B.; Treasure, J.; Fernandez-Aranda, F. The processing of food stimuli in abnormal eating: A systematic review of electrophysiology. Eur. Eat. Disord. Rev. 2015, 23, 251–261. [Google Scholar] [CrossRef] [PubMed]
- Polich, J.; Kok, A. Cognitive and biological determinants of P300: An integrative review. Biol. Psychol. 1995, 41, 103–146. [Google Scholar] [CrossRef]
- Kray, J.; Li, K.Z.H.; Lindenberger, U. Age-related changes in task-switching components: The role of task uncertainty. Brain Cogn. 2002, 49, 363–381. [Google Scholar] [CrossRef] [PubMed]
- Hillman, C.H.; Kramer, A.F.; Belopolsky, A.V.; Smith, D.P. A cross-sectional examination of age and physical activity on performance and event-related brain potentials in a task switching paradigm. Int. J. Psychophysiol. 2006, 59, 30–39. [Google Scholar] [CrossRef] [PubMed]
- Kieffaber, P.D.; Hetrick, W.P. Event-related potential correlates of task switching and switch costs. Psychophysiology 2005, 42, 56–71. [Google Scholar] [CrossRef] [PubMed]
- Sellaro, R.; Colzato, L.S. High body mass index is associated with impaired cognitive control. Appetite 2017, 113, 301–309. [Google Scholar] [CrossRef] [PubMed]
- Yang, Y.; Shields, G.S.; Guo, C.; Liu, Y. Executive function performance in obesity and overweight individuals: A meta-analysis and review. Neurosci. Biobehav. Rev. 2018, 84, 225–244. [Google Scholar] [CrossRef] [PubMed]
- Waaddegaard, M.; Davidsen, M.; Kjøller, M. Obesity and prevalence of risk behaviour for eating disorders among young Danish women. Scand. J. Public Health 2009, 37, 736–743. [Google Scholar] [CrossRef] [PubMed]
- Kaufman, A.S.; Kaufman, N.L. K-BIT: Kaufman Brief Intelligence Test; American Guidance Service: Circle Pines, MN, USA, 1990. [Google Scholar]
- Diet History Questionnaire, Version 2.00; National Cancer Institute: Bethesda, MD, USA, 2010.
- Hoyland, A.; Lawton, C.L.; Dye, L. Acute effects of macronutrient manipulations on cognitive test performance in healthy young adults: A systematic research review. Neurosci. Biobehav. Rev. 2008, 32, 72–85. [Google Scholar] [CrossRef] [PubMed]
- Naugle, R.I.; Chelune, G.J.; Tucker, G.D. Validity of the kaufman brief intelligence test. Psychol. Assess. 1993, 5, 182–186. [Google Scholar] [CrossRef]
- Walk, A.M.; Edwards, C.G.; Baumgartner, N.W.; Chojnacki, M.R.; Covello, A.R.; Reeser, G.E.; Hammond, B.R.; Renzi-Hammond, L.M.; Khan, N.A. The role of retinal carotenoids and age on neuroelectric indices of attentional control among early to middle-aged adults. Front. Aging Neurosci. 2017, 9, 1–13. [Google Scholar] [CrossRef] [PubMed]
- Khan, N.A.; Raine, L.B.; Drollette, E.S.; Scudder, M.R.; Hillman, C.H. The relation of saturated fats and dietary cholesterol to childhood cognitive flexibility. Appetite 2015, 93, 51–56. [Google Scholar] [CrossRef] [PubMed]
- Garner, D.M.; Olmsted, M.P.; Bohr, Y.; Garfinkel, P.E. The Eating Attitudes Test: Psychometric features and clinical correlates. Psychol. Med. 1982, 12, 871–878. [Google Scholar] [CrossRef] [PubMed]
- Orbitello, B.; Ciano, R.; Corsaro, M.; Rocco, P.L.; Taboga, C.; Tonutti, L.; Armellini, M.; Balestrieri, M. The EAT-26 as screening instrument for clinical nutrition unit attenders. Int. J. Obes. 2006, 30, 977–981. [Google Scholar] [CrossRef]
- Pontifex, M.B. Stylized Topographic Map Plugin for EEGLAB/ERPLAB. Available online: http://education.msu.edu/kin/hbcl/software.html (accessed on 22 September 2018).
- Tchanturia, K.; Davies, H.; Roberts, M.; Harrison, A.; Nakazato, M.; Schmidt, U.; Treasure, J.; Morris, R. Poor Cognitive Flexibility in Eating Disorders: Examining the Evidence using the Wisconsin Card Sorting Task. PLoS ONE 2012, 7, 1–5. [Google Scholar] [CrossRef]
- Zastrow, A.; Kaiser, S.; Stippich, C.; Walther, S.; Herzog, W.; Tchanturia, K.; Belger, A.; Weisbrod, M.; Treasure, J.; Friederich, H.-C. Neural correlates of impaired cognitive-behavioral flexibility in anorexia nervosa. Am. J. Psychiatry 2009, 166, 608–616. [Google Scholar] [CrossRef] [PubMed]
- Wu, M.; Brockmeyer, T.; Hartmann, M.; Skunde, M.; Herzog, W.; Friederich, H.-C. Set-shifting ability across the spectrum of eating disorders and in overweight and obesity: A systematic review and meta-analysis. Psychol. Med. 2014, 44, 3365–3385. [Google Scholar] [CrossRef]
- Masuda, A.; Latzman, R.D. Psychological flexibility and self-concealment as predictors of disordered eating symptoms. J. Context. Behav. Sci. 2012, 1, 49–54. [Google Scholar] [CrossRef]


| Variable | Group | Female | Male |
|---|---|---|---|
| N | 132 | 82 | 50 |
| Age, years | 33.88 ± 6.00 | 34.28 ± 5.98 | 33.22 ± 6.06 |
| IQ | 108.48 ± 12.22 | 107.18 ± 11.67 | 110.60 ± 12.91 |
| BMI, kg/m 2 | 32.03 ± 5.81 * | 33.18 ± 5.39 | 30.14 ± 6.05 |
| HEI-2015 3 | 54.33 ± 13.71 | 53.49 ± 13.56 | 55.72 ± 13.96 |
| EAT-26 Summative Score | 6.73 ± 5.82 * | 7.72 ± 7.26 | 5.12 ± 4.55 |
| Dieting Subscale | 4.69 ± 4.38 | 5.22 ± 4.94 | 3.82 ± 3.10 |
| Bulimia and Food Preoccupation Subscale | 1.45 ± 2.75 | 1.56 ± 3.20 | 1.56 ± 3.20 |
| Oral Control Subscale | 1.26 ± 1.65 | 1.37 ± 1.76 | 1.08 ± 1.44 |
| Summative EAT-26 | Dieting Subscale | Bulimia and Food Preoccupation Subscale | Oral Control Subscale | |
|---|---|---|---|---|
| Homogeneous | ||||
| Overall Accuracy | −0.09 | −0.08 | −0.10 | 0.06 |
| Overall RT | 0.25 ** | 0.26 ** | −0.10 | 0.16 |
| Heterogeneous | ||||
| NonSwitch Accuracy | −0.17 | −0.22 * | 0.04 | 0.03 |
| NonSwitch RT | 0.16 | 0.19 * | −0.12 | 0.03 |
| Switch Accuracy | −0.19 * | −0.22 ** | 0.00 | −0.02 |
| Switch RT | 0.15 | 0.20 * | −0.04 | 0.10 |
| Switch Cost | ||||
| Global Accuracy | 0.16 | 0.21 * | −0.07 | 0.01 |
| Local Accuracy | 0.04 | 0.03 | 0.05 | 0.07 |
| Global RT | −0.01 | 0.03 | −0.02 | −0.05 |
| Local RT | 0.05 | 0.10 | 0.07 | 0.13 |
| Summative EAT-26 | Dieting Subscale | Bulimia and Food Preoccupation Subscale | Oral Control Subscale | |
|---|---|---|---|---|
| Homogeneous | ||||
| Amplitude | −0.09 | −0.17 † | 0.05 | 0.01 |
| Latency | 0.01 | 0.03 | −0.23 ** | 0.11 |
| Heterogeneous | ||||
| NonSwitch Amplitude | 0.08 | 0.03 | 0.09 | 0.04 |
| NonSwitch Latency | 0.01 | −0.01 | −0.17 † | −0.02 |
| Switch Amplitude | 0.10 | 0.06 | 0.06 | 0.05 |
| Switch Latency | 0.40 | 0.01 | −0.15 | 0.06 |
| Switch Cost | ||||
| Global Amplitude | 0.13 | 0.17 * | 0.12 | −0.01 |
| Local Amplitude | 0.00 | 0.02 | −0.09 | −0.07 |
| Global Latency | −0.10 | −0.08 | 0.00 | −0.16 |
| Local Latency | 0.07 | 0.10 | 0.04 | 0.11 |
| Homogeneous RT | NonSwitch RT | Switch RT | |||||||
|---|---|---|---|---|---|---|---|---|---|
| Step and Variable | β | ΔR2 | Model p | β | ΔR2 | Model p | β | ΔR2 | Model p |
| Step 1 | |||||||||
| Sex | 0.07 | 0.02 | 0.68 | 0.30 ** | 0.14 | p < 0.01 | 0.20 * | 0.08 | 0.05 |
| BMI | −0.03 | −0.05 | −0.11 | ||||||
| IQ | −0.10 | −0.12 | −0.10 | ||||||
| Age | 0.09 | 0.18 * | 0.12 | ||||||
| HEI-2015 | 0.05 | 0.02 | −0.01 | ||||||
| Step 2 | |||||||||
| Summative EAT-26 | 0.25 ** | 0.06 ** | 0.08 | 0.20 * | 0.04 * | p < 0.001 | 0.18* | 0.03 * | 0.02 |
| Dieting Subscale | 0.26 ** | 0.06 ** | 0.07 | 0.20 * | 0.04 * | p < 0.001 | 0.20 * | 0.04 * | 0.01 |
| Bulimia and Food Preoccupation Subscale | −0.08 | 0.01 | 0.69 | −0.10 | 0.01 | p < 0.001 | −0.01 | 0.00 | 0.09 |
| Oral Control Subscale | 0.15 | 0.02 | 0.41 | 0.03 | 0.00 | p < 0.001 | 0.09 | 0.01 | 0.06 |
© 2018 by the authors. Licensee MDPI, Basel, Switzerland. This article is an open access article distributed under the terms and conditions of the Creative Commons Attribution (CC BY) license (http://creativecommons.org/licenses/by/4.0/).
Share and Cite
Edwards, C.G.; Walk, A.M.; Thompson, S.V.; Mullen, S.P.; Holscher, H.D.; Khan, N.A. Disordered Eating Attitudes and Behavioral and Neuroelectric Indices of Cognitive Flexibility in Individuals with Overweight and Obesity. Nutrients 2018, 10, 1902. https://doi.org/10.3390/nu10121902
Edwards CG, Walk AM, Thompson SV, Mullen SP, Holscher HD, Khan NA. Disordered Eating Attitudes and Behavioral and Neuroelectric Indices of Cognitive Flexibility in Individuals with Overweight and Obesity. Nutrients. 2018; 10(12):1902. https://doi.org/10.3390/nu10121902
Chicago/Turabian StyleEdwards, Caitlyn G., Anne M. Walk, Sharon V. Thompson, Sean P. Mullen, Hannah D. Holscher, and Naiman A. Khan. 2018. "Disordered Eating Attitudes and Behavioral and Neuroelectric Indices of Cognitive Flexibility in Individuals with Overweight and Obesity" Nutrients 10, no. 12: 1902. https://doi.org/10.3390/nu10121902
APA StyleEdwards, C. G., Walk, A. M., Thompson, S. V., Mullen, S. P., Holscher, H. D., & Khan, N. A. (2018). Disordered Eating Attitudes and Behavioral and Neuroelectric Indices of Cognitive Flexibility in Individuals with Overweight and Obesity. Nutrients, 10(12), 1902. https://doi.org/10.3390/nu10121902