1. Introduction
Currently, the role of meat in human nutrition is widely discussed in the scientific literature [
1,
2,
3,
4,
5,
6,
7,
8,
9,
10]. From one point of view, being a valuable source of macro- and micro-nutrients, particularly of bioavailable iron and zinc [
10,
11,
12,
13], vitamins B1, B12, niacin [
10,
12,
13], proteins and vitamins A, D [
10,
13], meat has a very high nutritional value. It is underlined that heme iron is more efficiently absorbed from meat products (20–30%) than non-heme iron (5–15%) [
13]. Meat contains high biological value protein [
10,
14] with all essential amino acids [
13], better protein and amino acid digestibility and higher protein to energy ratios [
15]. From the other point of view some epidemiologic and large-scale studies analyzed the association between consumption of red and processed meat and the occurrence of common disease, that is, type 2 diabetes [
4,
10,
16,
17], certain types of cancer [
10], including esophageal, [
18], ovarian [
19], breast [
20,
21], esophagus and liver cancer [
22]. Some findings underlined the long-term increasing consumption of red and processed meat leading to the increased risk of total mortality [
10,
23,
24]. On the contrary, poultry consumption is associated with a risk reduction of developing overweight and obesity, cardiovascular diseases and type 2 diabetes. Poultry meat is considered moderately protective or neutral on cancer risk [
25].
At the same time, total meat consumption in the U.S., European Union and other developed countries has increased [
2,
26]. As a very important part of everyday diet [
27], meat contributes more than 15% to daily energy intake, 40% to daily protein intake and 20% to daily fat intake [
1]. In the structure of meat consumption, pork and poultry together account for 80% of the total meat consumption in the European countries and their share increases [
28]. In Poland, similar trends are observed. In 2000–2016, the increase of poultry consumption, the decrease of beef consumption and a high-level pork consumption were observed [
29,
30,
31,
32,
33]. Due to the above mentioned conditions, the level and structure of meat consumption is the subject of many studies [
1,
2,
3,
26,
34,
35,
36,
37,
38,
39,
40,
41,
42,
43,
44,
45] leading to the identification of meat consumption patterns [
46,
47], health-related aspects [
4,
10,
16,
17,
20,
21,
22,
24,
47,
48,
49,
50,
51,
52,
53] and factors determining the consumer’s choice including psychological [
30,
54,
55,
56,
57,
58], economic [
30,
58], social, health, education [
30], macroeconomic (e.g., tax regulation influencing price level) and market conditions [
27,
59,
60].
In many countries, including Poland, the increasing consumption of meat and meat products is accompanied by an increase in fish and seafood consumption [
61,
62,
63,
64,
65,
66]. This trend is determined by economic [
67], psychological [
61], religious [
62], health [
65,
66,
68,
69] factors and product availability [
67]. However, the increase in fish consumption leading probably to a decreased incidence of cardiovascular disease (due to long-chain n-3-fatty acids and vitamin D contribution) [
69,
70,
71,
72,
73,
74] should be considered with the increased concentrations of environmental toxins (polychlorinated biphenyls, poly and perfluoroalkyl substances and methylmercury) [
73,
74]. Contaminants detected in fish are associated with cardiovascular diseases, metabolic disorders and cancer [
74].
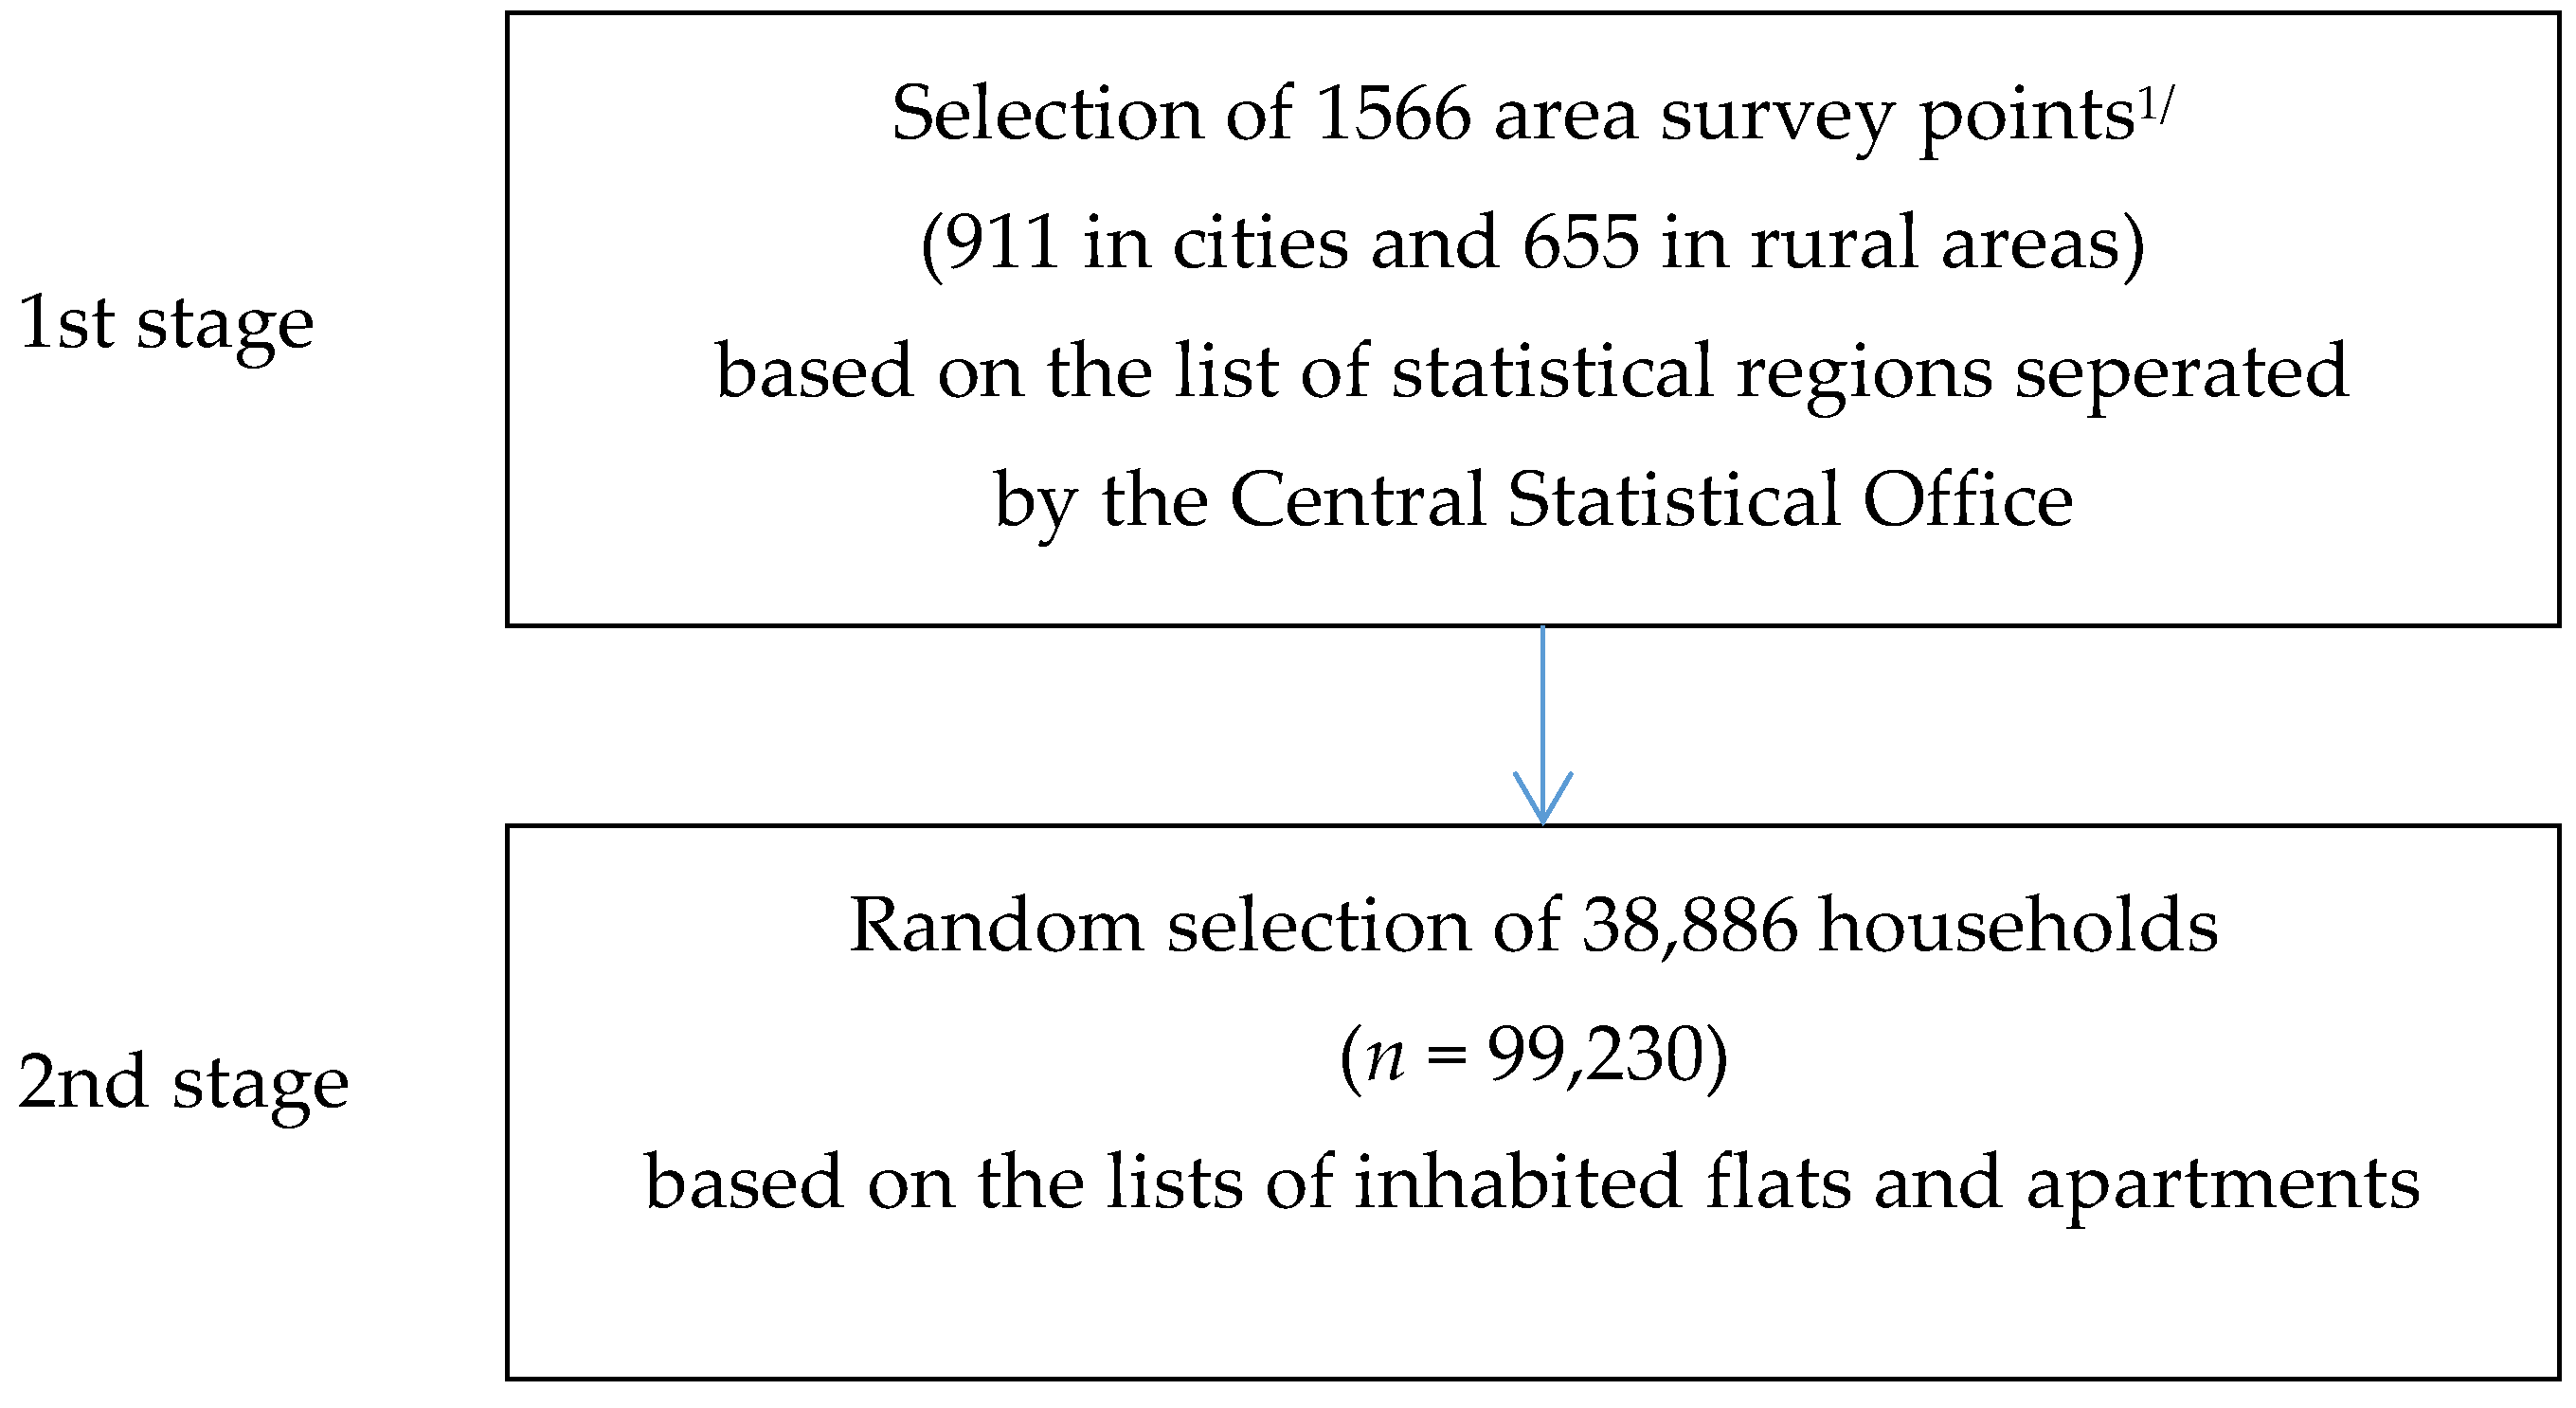
Based on the above-mentioned arguments and conditions, it is pointed that the analysis of meats and seafood as sources of energy and nutrients is important to ensure the proper structure of the balanced diet and to increase the nutrient adequacy. The aim of this study was to identify the share of meat, meat products and seafood in the contribution of energy and 22 nutrients to the average Polish diet. This analysis was conducted using data from a nationally representative sample of the Polish population selected by the Central Statistical Office within 2016 Household Budget Survey.
4. Discussion
Meat and meat products are an important component of Polish consumers’ diet and an important source of many nutrients. This analysis determined the contribution of meat, meat products and seafood to energy and 22 nutrients in the average Polish diet; it also ranked seven food groups and 16 food products to provide the energy and nutrient contribution. Findings of our research were compared (as listed below) with data from four studies widely discussed in the scientific literature: 2003–2006 American National Health and Nutrition Examination Survey (2003–2006 NHANES) [
5], 2011–2014 American National Health and Nutrition Examination Survey (2011–2014 NHANES) [
6], Australian National Nutrition and Physical Activity Survey (2011–2012 NNPAS) [
37] and the study of anthropometric data, macronutrients and micronutrients intake, practice of physical activity socioeconomic data and lifestyles in Spain (2013 ANIBES) [
9]. The comparison made it possible to point out the similarities and differences in energy and nutrients contribution to the diet of Polish, American, Australian and Spanish consumers. The similarities listed below indicate the homogenization of dietary patterns, whereas the differences are related with stabilized consumer preferences, price relations and the products availability. Such knowledge could be useful for health professionals to implement appropriate dietary activities and educational programmers to improve diet quality, especially among vegetarians.
Our finding indicated that the meats and the seafood categories contributed 18.5% of all the energy in the average Polish diet, while meat and meat products provided 17.6% of the energy, compared to seafood (below 1%). The detailed analyses of the energy contribution indicated some differences while compared with findings of other studies. In the average Polish diet, the highest sources of energy from meats and seafood were processed meat products (i.e., dried, boiled, salted or smoked meat of all kinds), red meat and poultry, providing 16.9% of the energy intake. In the structure of red meat consumption, the highest share was represented by pork (4.7% of the total energy intake). While the beef contribution to the energy supply amounted to 0.2% in the average Polish diet, in other population beef as an energy contributor is placed higher. For example, in the 2003–2006 NHANES, the highest ranked food groups from the meats and the seafood categories were beef (5.0% of the total energy intake), poultry (4.3%), frankfurters, sausages, luncheon meats (3.0%) and pork, ham and bacon (2.1%) [
5]. According to the data from the 2011–2014 NHANES, the highest sources of energy were meat, poultry and fish in mixed dishes (4.2%); poultry (3.0%); meats (2.7%); and cured meats/poultry (2.5%) [
6]. The differences in the energy sources in the diet of Polish and American consumers determined by the structure of the meat and meat products consumption are resulted from the specifics of Polish consumers, their preferences and factors determining the purchasing decision [
30,
32,
33,
58,
86]. The high consumption level of processed red meat products (i.e., dried, boiled, salted or smoked pork meat), poultry (mainly chicken), pork and processed poultry products influenced the structure of the contribution of particular nutrients to the average Polish diet. In 2000–2016, the consumption of pork was 39–42 kg per capita. This level of consumption resulted from stabilized consumer preferences, favorable price relations and the availability of meat [
30,
58,
59,
87]. In contrast, the consumption of beef in 2016 amounted to 1.9 kg per person [
29,
31,
32]. The years 2000–2012 showed a sharp drop in beef consumption from 7.1 kg to 1.2 kg, which was a consequence of price relations and the low repeatability of quality features [
33,
86].
Based on the comparison of our findings with the 2003–2006 NHANES and 2011–2014 NHANES, it should be pointed that the share of energy delivered by poultry and poultry products has increased. It should be treated as a positive trend because of the association of poultry consumption with the risk reduction of developing overweight and obesity, cardiovascular diseases and type 2 diabetes [
25]. In Poland, the consumption structure was dominated by chicken and determined by taste, dietary aspects and favorable prices [
30,
32,
58,
87,
88]. Furthermore, while comparing our findings with the 2011–2014 NHANES, it should be pointed that the share of energy delivered by seafood in the American diet (1.6%) [
6] was twice as large as in the Polish diet. It is related to economic factors influencing the level of seafood consumption in Poland. The prices influenced the consumption of salmon, herring, tuna, cod, mackerel and seafood [
89]. At the same time, changes in consumer behavior, increasing interest in the cuisines of other nations and increasing supply of fishes and seafood in the Polish market were observed [
67,
90].
When considering seven food groups and their contribution of the 22 nutrients, it should be underlined that meat products (i.e., processed red meat products, processed poultry products and other meat products) were ranked first for the contribution of 18 nutrients and energy. Meat products delivered more than 15% of the contribution for seven nutrients, namely niacin, cholesterol, protein, MUFA, thiamin, zinc, sodium and potassium. In the case of vitamin B6, iron, total fat and SFA, the contribution of meat products was 10–15% of the average daily intake, while for riboflavin, phosphorus and potassium, it was 5–10%. However, processed red meat consumption is associated with an increased risk of type 2 diabetes [
4,
16,
17] and coronary heart disease [
50] and may increase all-cause mortality [
23,
24]. Some findings underlined the long-term increasing consumption of red and processed meat leading to the increased risk of total mortality, cardiovascular disease, colorectal cancer and type 2 diabetes [
10].
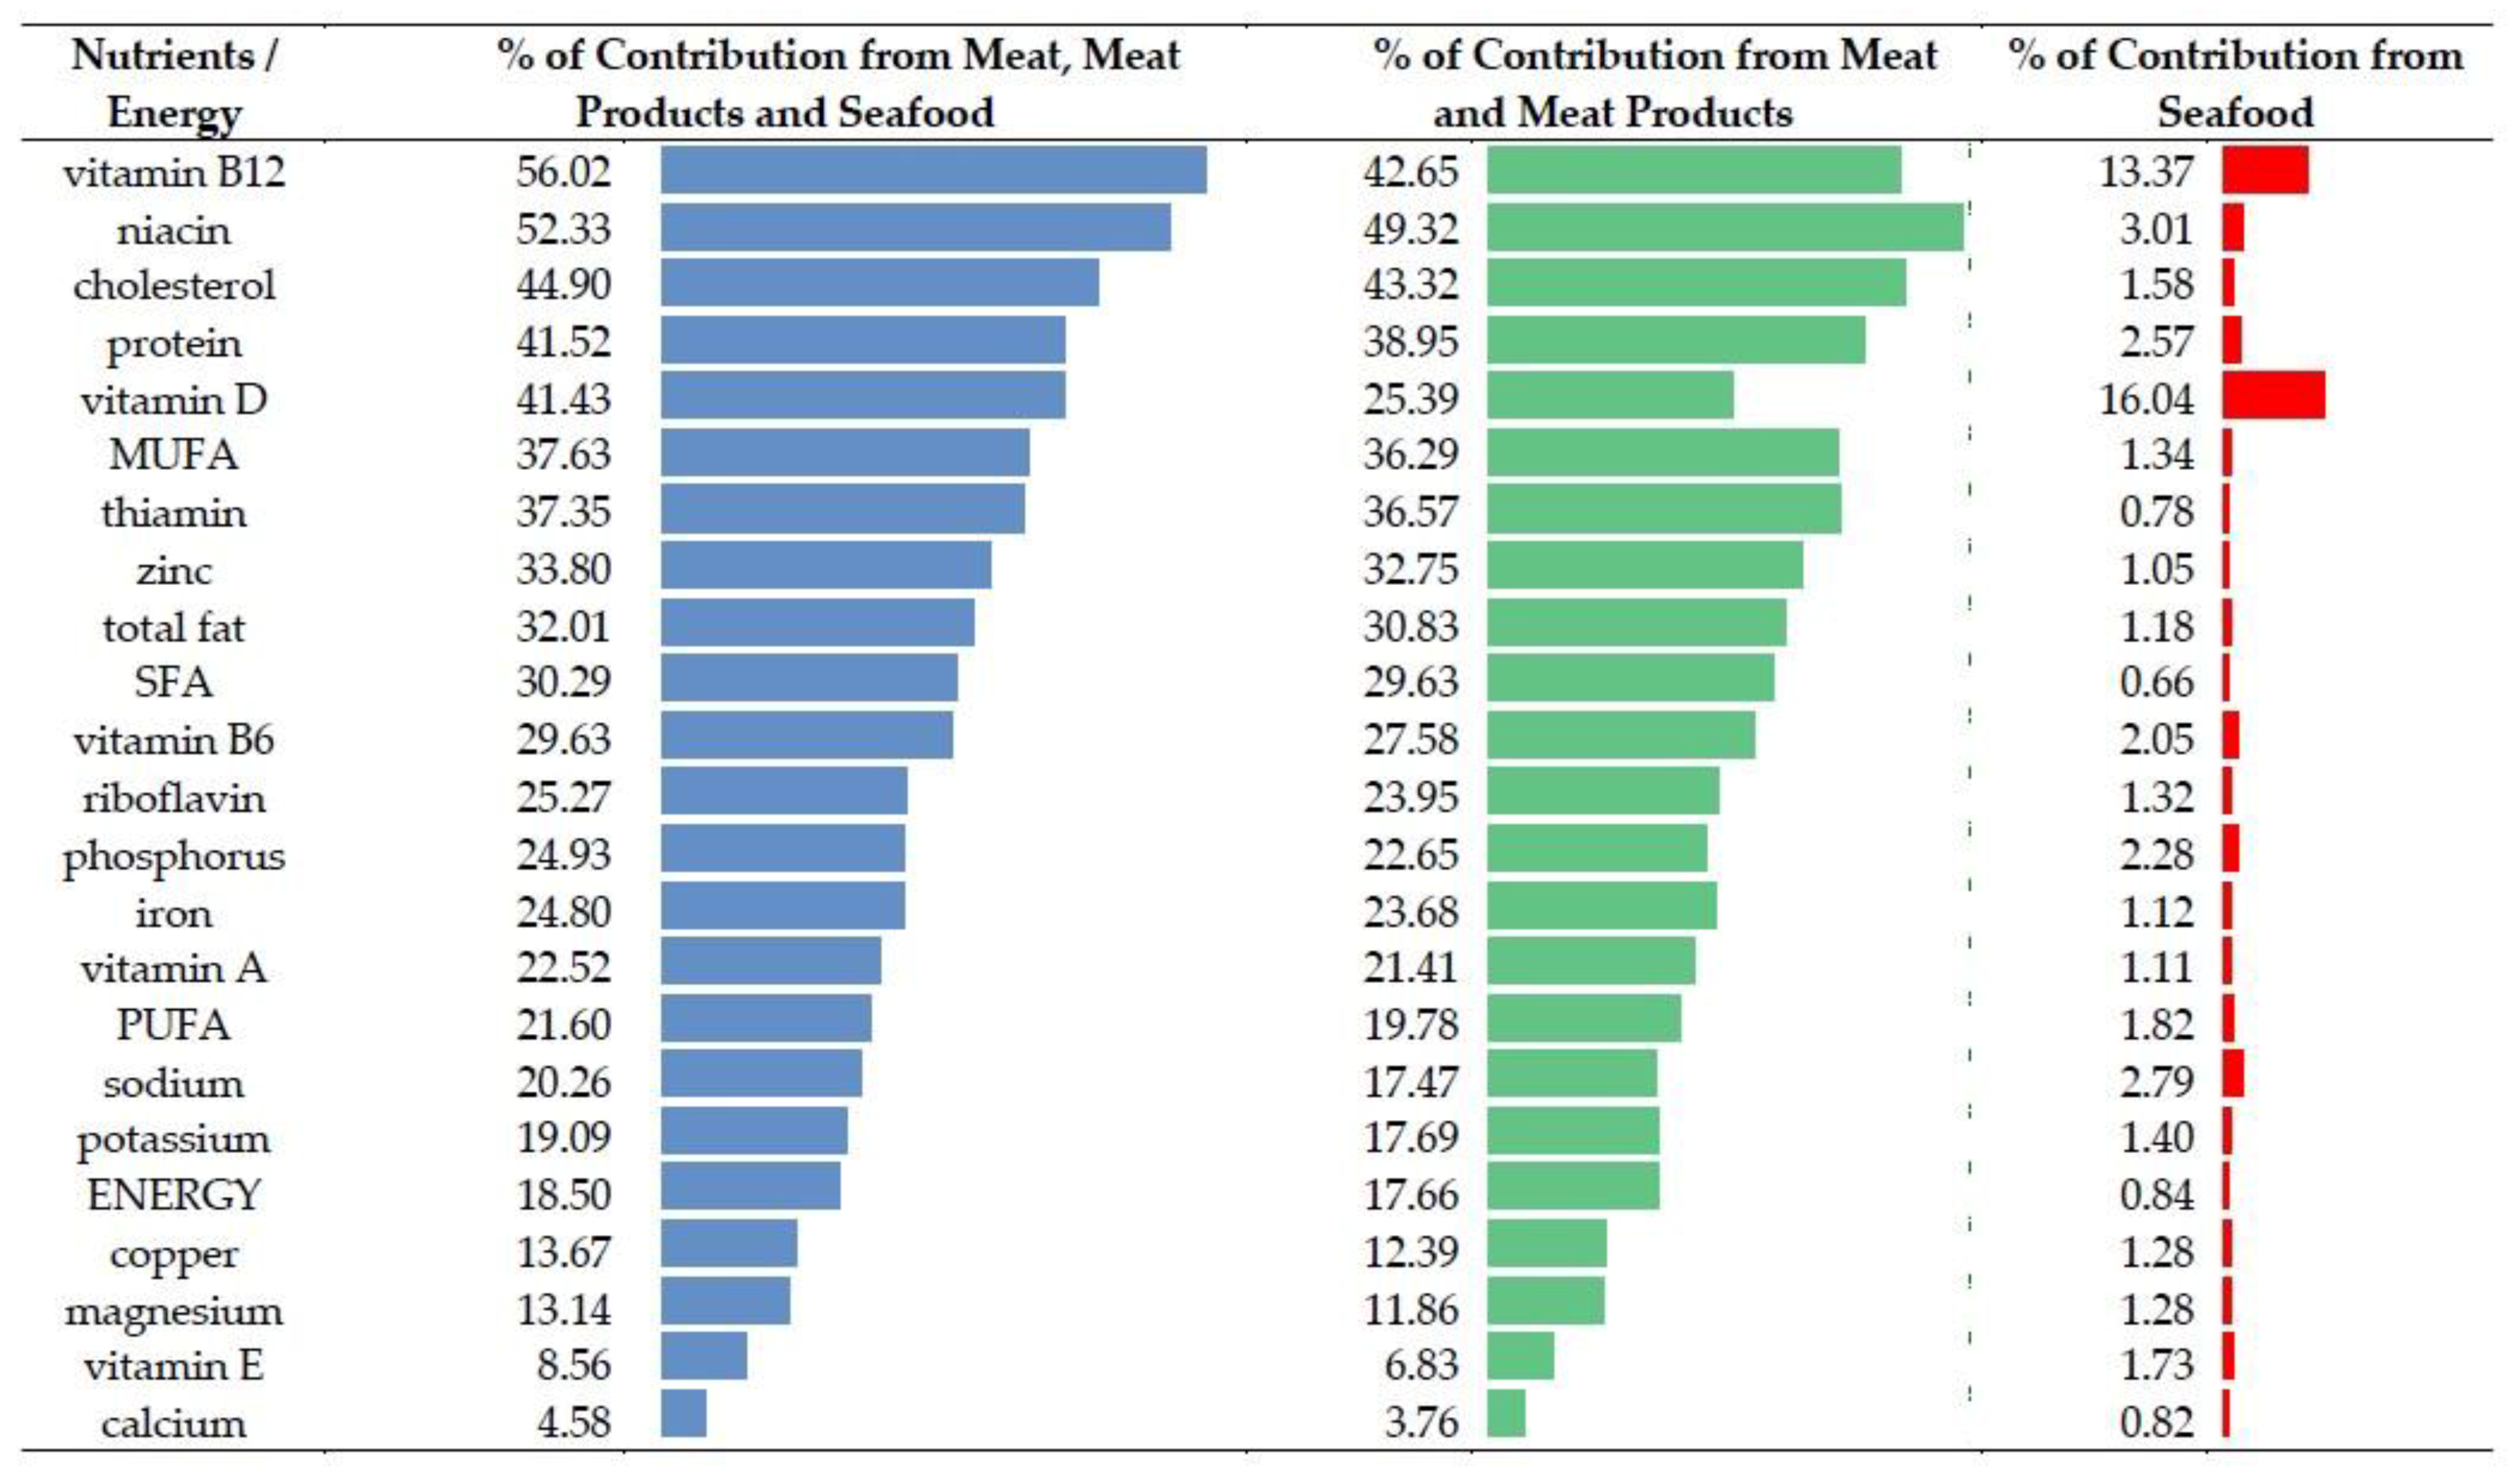
Meats were an important source of water-soluble B vitamins delivering a higher percentage of these nutrients than of energy in the average Polish diet. The contribution of meats and seafood amounted to 56.0% of vitamin B12 (meats and meat products: 42.7%, seafood: 13.3%), 52.3% of niacin (meats and meat products: 49.3%, seafood: 3.0%), 37.4% of thiamin (meats and meat products: 36.6%, seafood: 0.8%), 29.6% of vitamin B6 (meats and meat products: 27.6%, seafood: 2.0%) and 25.3% of riboflavin (meats and meat products: 24.0%, seafood: 1.3%). Based on the comparison of our studies with other findings, the high position of meat and meat products as contributors of water-soluble B vitamins has been underlined in the analysis conducted in other populations [
6,
8,
9]; however, some differences have been observed. For example, in our study the main sources of vitamin B12 were liver and organ meat (16.9%); processed meat products, pork, other fish and shellfish products and chicken, provided nearly 43% of vitamin B12. The highest position of liver and organ meat was related to the specifics of Polish consumers and the relatively high level of consumption of organ meat and organ meat products, such as the pluck sausages [
91]. In research conducted among American population, organ meat was ranked at a further position as a source of vitamin B12. In the 2003–2006 NHANES, the highest ranked food groups from the meats and the seafood categories were: (1) beef, (2) fish and shellfish, (3) frankfurters, sausages and luncheon meats, (4) organ meats, pork, ham and bacon and (5) poultry, delivering nearly 43% of vitamin B12 daily contribution [
5]. According to data from the 2011–2014 NHANES, the highest sources of vitamin B12 were meats, seafood, meat, poultry and fish in mixed dishes, cured meats and poultry, delivering nearly 37% of vitamin B12 contribution [
6].
With respect to niacin meats and seafood contributed 52.3% of the total intake with the main food groups: meat products (18.8%), red meat (13.9%) and poultry (13.6%). The detailed analyses pointed out the following food products: processed red meat products (14.4%), pork (13.0%) and chicken (11.9%). At the same time, findings of the niacin contribution to the American and Australian diets indicated poultry (15.4%), beef (9.2%) and pork, ham and bacon (4.3%) (2003–2006 NHANES) [
5]; poultry (9.6%); meat, poultry and fish in mixed dishes (6.5%); meats (6.4%) and cured meats/poultry (4.9%) (2011–2014 NHANES) [
6]; meat and meat products (34.6%) and fish (12.2%) (2013 ANIBES) [
9]. The thiamin contribution from meats and seafood was 36.6% with the food groups: meat products (16.5%), red meat (16.0%) and poultry (2.7%). The highest ranked detailed food products were as follows: pork (15.8%) and processed red meat (14.7%), comparing with the other findings of the American and Australian studies: pork, ham and bacon (8.0%); and frankfurters, sausages, luncheon meats (2.9%) (2003–2006 NHANES) [
5]; meat, poultry and fish in mixed dishes (4.1%); cured meat/poultry (3.6%); and poultry (3.2%) (2011–2014 NHANES) [
6]; and meat and meat products (28.2%) and fish (3.5%) (2013 ANIBES) [
9]. In the average Polish diet, the contribution of vitamin B6 was 29.6% from processed red meat products (8%), chicken (8%) and pork (5.9%) as compared to the other findings: poultry (9.5%), beef (8.6%), pork, ham, bacon (3.9%) and frankfurters, sausages, luncheon meats (2.8%) (2003–2006 NHANES) [
5]; poultry (8.5%), meat, poultry and fish in mixed dishes (5.5%), meats (5.4%) and cured meat/poultry (3.5%) (2011–2014 NHANES) [
6]; and meat and meat products (26.6%) and fish (9.1%) (2013 ANIBES) [
9]. The main sources of riboflavin were processed red meat products (6.6%), pork (5.1%), liver and organ meat (4.4%) and chicken (4.3%). In other findings, the highest sources of riboflavin were beef (3.6%), poultry (3.1%), pork, ham, bacon (2.3%) and frankfurters, sausages, luncheon meats (2.1%) (2003–2006 NHANES) [
5]; meats (3.8%), meat, poultry, fish in mixed dishes (3.3%), poultry (2.7%) and cured meat/poultry (2.1%) (2011–2014 NHANES) [
6]; meat and meat products (32.2%) and fish (4.7%) (2013 ANIBES) [
9]. These findings of Polish, American and Australian studies related to meat and meat products as sources of B vitamins should be taken into consideration in the evaluation of the quality of vegetarian diets.
Our findings indicated that meats and seafood contributed 41.5% of protein with meat products (17.4%), red meat (9.9%) and poultry (9.7%). Other findings reported the protein contribution of meats at the level of 49% in the Australian diet (2011–2012 NNPAS) [
37] and identified following sources of protein: poultry (14.4%), beef (14.0%), pork, ham, bacon (5.7%), fish and shellfish (5.0%), and frankfurters, sausages, luncheon meats (4.4%) in the American diet (2003–2006 NHANES) [
5].
With respect to zinc, phosphorus, iron, sodium and potassium, meats provided a higher percentage of these nutrients than the percentage of energy contribution. This indicates that meat and meat products have a higher density of these nutrients. Meats and seafood contributed 33.8% of zinc, 24.8% of iron, 20.3% of sodium and 19.1% of potassium. The four main sources of iron were meat products, red meat, poultry and other meat, delivering 23.7% of total iron intake. Other findings underline that meat and meat products are high sources of bioavailable hem [
12,
37,
92,
93,
94]. Findings from the 2013 ANIBES [
92] indicated that the highest sources of iron were meat, sausages and other meat product and poultry. According to the 2011–2012 NNPAS, meat/poultry/fish contributed approximately 26% of iron [
37]. In the average Polish diet, meats and seafood contributed 33.8% of zinc with main food groups (meat products, red meat, poultry and other meat) delivering 32.8% of total zinc. Other findings indicated that the zinc contribution was approximately 38% from meat/poultry/fish (2011–2012 NNPAS) in the Spanish diets [
37] and 35% from meats and fish, including 29% from meat and meats products and 6% from fish (2013 ANIBES) in the Australian diets [
94]. The main food sources of sodium in the average Polish diet were meat products (15.2% of total contribution), including processed meat products (12.4%). Other findings indicated that processed meat was the main contributor to daily sodium intake, representing 8% of the total sodium intake per capita [
95]. It should be underlined that excessive dietary sodium intake increases blood pressure and risk of hypertension, cardiovascular disease and kidney disease, as is widely discussed in the literature [
95,
96,
97,
98,
99,
100,
101,
102,
103,
104].
Total fat, cholesterol, MUFA, SFA and PUFA are delivered by meats and seafood in a higher percentage than the energy contribution. Meats and seafood contributed 44.9% of cholesterol, 37.6% of MUFA, 32.0% of total fat, 30.3% of SFA and 21.6% of PUFA. In the average Polish diet, the main food sources of cholesterol were meat products (16.3% of the total cholesterol intake), poultry (11.8%) and red meat (8.3%). In the case of the food products, the main sources of cholesterol were processed meat products (12.3%), chicken (10.4%) and pork (7.7%). Other findings (2011–2014 NHANES) indicated that meat contributed 42% to the total cholesterol intake (12% for poultry, 12% for mixed dishes, 8% for red meat, 5% for processed meat and 5% for seafood) [
105]. For SFA, meats and seafood contributed 30.3% to the average Polish diet as compared to 29% reported in the average Australian diet according to the 2011–2012 NNPAS [
37]. The three main food groups (meat products, meat and poultry) delivered 28.4% of SFA. Findings of the American studies indicated that the main food sources of SFA were beef (9.1%), frankfurters, sausages and luncheon meats (6.7%), poultry (4.2%) and pork, ham and bacon (3.5%) (2003–2006 NHANES) [
5]; meat, poultry, fish in mixed dishes (4.6%), cured meats/poultry (4.6%), meats (4.0%) and poultry (2.6%) (2011–2014 NHANES) [
6].


