1. Introduction
Characterizing precipitation in space and time is still a challenge. As the main input component of the water balance, rainfall is a key control of hydrologic variables such as evapotranspiration, soil moisture, streamflow and others, and thus essential to accurate estimation. While ground gauges can provide good measurements of point precipitation at the ground level, the number of functional and recording stations has progressively and significantly decreased since the 1980s [
1,
2].
For the last few decades, satellites and remote sensing technology have been providing numerous spatially distributed but indirect estimates of precipitation. These are indirect because they are derived from measurements of other parameters: cloud top temperatures and reflectivity using infrared (IR), passive micro-waves (PMW) or radar (active micro waves, R) which are used to estimate rainfall in or below the cloud—likely to be different from rainfall reaching the ground level. Thus, as the parameters of the intensity–reflectivity curve (Z-R relation) can change from storm to storm, these estimates come with errors that vary depending on the type of storm systems, geography, topography and cloud characteristics. Satellite Precipitation Products (SPPs) merge available data from sensors in different satellites to provide homogeneous gridded precipitation fields at a specific resolution and time aggregation. Errors depend on the number and type of sensors taking measurements over a specific location at a given time, and the algorithms used to assimilate the available data into a coherent gridded dataset.
The evaluation of the performance of SPPs and the characterization of their errors have been the object of numerous publications. Perhaps due to the difficulty of having good reference datasets for evaluation, the focus of most studies has often been local or regional in Africa [
3,
4,
5,
6,
7,
8,
9,
10,
11,
12,
13,
14,
15], with few continental or global evaluation efforts [
16,
17]. This is also illustrated at a global level by Maggioni et al. (2016), providing a review of SPP evaluation studies of Tropical Rainfall Measuring Mission (TRMM) Multi-satellite Precipitation Analysis (TMPA) Real Time (RT) and Version 7 (V7), Global Satellite Mapping of Precipitation (GSMaP), Climate Prediction Center (CPC) Morphing Technique (CMORPH), and the Precipitation Estimation from Remotely Sensed Information using Artificial Neural Networks (PERSIANN) with and without Cloud Classification System (CCS), across six continents [
18]. To address the lack of global or continent-wide analysis and further the understanding of the performance of SPPs over Africa, this paper presents an evaluation of three near real-time quasi-global satellite precipitation products over the African continent, compared against a quasi-global reference dataset. With an emphasis on the near real-time aspect of the products, and thus their potential for operational monitoring and predictive use, the goal of this work is to characterize their errors in relationship to latitude, topography, climate and season. Specifically, we analyze how errors vary with the dynamics of the main climatic mechanisms controlling rainfall in Africa such as the ITCZ. We also explore what error components can be reduced through bias correction techniques, as well as how and where model averaging approaches produce better estimates. The three quasi-global and near real-time products evaluated here are CMORPH, TMPA 3B42-RT, and PERSIANN. We have chosen the Global Precipitation Climatology Program—one degree daily (GPCP-1dd) as our reference dataset for being a well-established climatology dataset integrating ground observations and a range of satellite precipitation estimates over the continent. The results presented here illustrate the need for bias correction for any use of SPPs, and can inform their hydrologic applications in Africa, such as real-time monitoring of rainfall over poorly gauged regions and for streamflow monitoring and prediction (especially in medium to large basins where concentration times are high).
2. Background
Numerous case studies evaluate the performance of SPPs over specific locations, comparing them against local datasets including ground data and radar observations when available. In perhaps the most spatially extensive validation synthesis, Ebert et al. (2007) reports validation efforts covering the US, Australia and Northwestern Europe, finding that performance of SPP estimates is highly dependent on the rainfall regime, being more accurate in low latitudes and in summer, especially when the precipitation regime is controlled by deep convection [
16]. When estimating extreme events, performance of SPPs has been reported to decrease significantly in terms of biases and ability to correctly detect extreme rainfall [
19,
20,
21]. Different elevation and aspect dependent biases have been observed for SPPs in complex topography in various case studies. In general, performance tends to be poorer over mountains but locally calibrated products may do better [
11,
22,
23,
24,
25]. Detailed reviews on the accuracy of SPPs, past evaluation efforts and their applications, can be found in Demaria and Serrat-Capdevila (2015) and Serrat-Capdevila et al. (2013) [
26,
27].
In Africa, Adeyewa and Nakamura (2003) evaluate monthly and seasonal precipitation over main climate zones and find that the TRMM Precipitation Radar, an IR rainfall estimate (TMPI) and a monthly bias corrected TMPA product tended to overestimate rainfall in the tropical zone for the northern hemisphere winter and spring and produced better estimates during the rest of the year. High biases were found during dry seasons in semi-arid areas [
28].
In the Great Rift Valley in Ethiopia, PERSIANN and CMORPH overestimated the average monthly rainfall by 43% and 11%, respectively, and TMPA underestimated it by 5%, compared to ground gauge measurements. In the tropical region, CMORPH and TMPA 3B42-RT overestimated rainfall at low elevation, but gave reasonable results at higher elevations, while PERSIANN results were better in the low lands but degraded with altitude. In semi-arid climate, all the products underestimated rainfall [
29].
Streamflow simulations in the Nzoia Basin in Kenya, using TMPA real time estimates with a 0.5 correlation with the basin rain gauge, had a bias of 20% and a Nash-Sutcliffe (N-S) coefficient of 0.57. The use of the bias corrected research quality product TMPA 3B42-V6 improved the bias to 3.6% and the N-S efficiency to 0.71 [
30].
Thiemig et al. (2012) evaluated the performance of six SPP—CMORPH, Rainfall Estimation Algorithm Version 2 (RFE2.0), TRMM 3B42, Goddard Profiling Algorithm (GPROF), PERSIANN and GSMap Moving Vector with Kalman filter (MVK)—over the Zambezi, Volta, Baro-Akobo and Juba Shabelle basins on a daily, monthly and annual basis [
14]. The performance of SPPs was evaluated against a topography-based interpolation of rain gauge data, and was generally superior in the tropical zones. Poorer performance was found in semiarid, mountainous regions, and in capturing events on the extremes of the distribution. Over the basins in tropical zones, PERSIANN and CMORPH overestimate both the number of rainy days and precipitation rates. However, while PERSIANN underestimates rainfall in mountainous areas due to problems detecting high altitude and light rain, CMORPH has a superior ability to capture rain better in mountainous areas. The TRMM 3B42 showed the best performance, capturing seasonal variability, seasonal patterns, average annual precipitation and peaks. This is likely due to its incorporated bias correction from ground gauge networks information in the research product.
On the other hand, while Thiemig et al. (2012) provide an excellent analysis over three study areas in Africa using rain-gauge data, few studies exist that compare SPPs over large regions of the globe such as the African Continent, and that relate a spatially continuous analysis with the main climatic mechanisms that control precipitation dynamics. This is partly due to the challenges of obtaining an adequate reference dataset with a large regional coverage and with consistent quality. Relating the performance and error distributions of SPPs with continental scale precipitation-generating climatic mechanisms is especially difficult without a consistent “ground-truth” accurately characterizing precipitation in space and time.
The locations with high-quality reference datasets including dense rain gauge networks and/or stage IV radar products assimilating available ground gauges are very scarce and hardly exist in developing regions. In addition, catchment level rainfall errors from the use of a few rain gauges can be comparable to errors of satellite estimates aggregated over the catchment [
31]. Even in data-rich regions, an accurate definition of the precipitation “ground truth” is difficult.
This difficulty has led other research teams to adopt other approaches, such as comparing satellite precipitation products between each other instead of against a global reference dataset. Tian and Peters-Lidard (2010) computed a map of global measurement uncertainties as the spread of a six satellite dataset ensemble, finding smaller deviations from the average (40%–60%) over the oceans, especially on the tropics, and over South America, and the largest uncertainties (100%–140%) on latitudes over 40°, and mostly over the cold season [
17]. They also detected higher uncertainties over complex terrain, such as the Tibetan Plateau, the Rockies, the Andes, as well as coastlines and water bodies. The estimates agree more over tropical, convection driven rainfall regimes, and less on frontal and orographic precipitation, as found by many others. Thus, such dependence of the uncertainty and disagreement among SPPs on geography, topography and type of storms seems to be consistent with regional performance as found by Ebert et al. (2007). The lack of high-quality dense ground-gauge networks, even at the regional level, lead Casse et al. (2015) to use the 3B42-V7 research product as a reference dataset against which to compare and bias-correct other products, over the choice of a gauge-only product (CPC) in their Niger sub-basin study area. The gauge-only product was found to smooth the rainfall, spreading it over more rainy days and spatial area, due to the low density of available gauges, highlighting the advantages of multi-sensor products integrating different measurements [
32]. On the other hand, Ringard et al. (2015) found in their SPP evaluations over French Guiana and North Brazil that 3B42-V7 was only better in areas of intense precipitation and especially with extreme precipitation events. In drier areas all SPP showed similar performance, with PERSIANN equaling that of 3B42-V7; and in regions along the Amazon, PERSIANN was best [
33].
The efforts presented here contribute to the understanding of the spatial and temporal dynamics of near real-time satellite precipitation errors over the African continent by building upon the efforts described above, such as global quantifications of SPP uncertainty, regional validations, and basin-specific comparisons in Africa against ground gauge data. In this paper, we present a comparison of three near real-time SPPs against a reference dataset over the African continent through the quantification of different error metrics and their spatial distributions across latitude, topography, climate and season. Given that basis, we examine the spatial nature of biases, the efficiency of bias correction and evaluate potential improvements of averaging different SPPs. The choice of evaluating near real-time products (and not their a posteriori gauge-adjusted, improved research versions) responds to their operational usefulness for real-time rainfall estimation in large poorly-gauged areas and their use in real-time streamflow monitoring and prediction, especially in large basins with high concentration times.
One of the main challenges in the evaluation of satellite precipitation products is the choice of the reference “ground-truth” dataset. Precipitation can be highly heterogeneous in space and time and is thus difficult to monitor and represent accurately. Ground measurements and satellite estimates of precipitation are observations of different nature and are difficult to compare and integrate. Rain-gauge measurements represent the rainfall in a few square centimeters over intervals of seconds to days and with a spatial characterization limited by the number of rain-gauges. In developing settings, these are rarely available in real time. Satellite rainfall estimates are indirect measures (from infrared, passive microwave or radar sensors) and often have spatial resolutions ranging from 0.04° and 0.25°, where a precipitation value is representative of a 16 km2 and 625 km2, respectively, and time steps ranging from half hour to three hours or a day. While satellite estimates provide a spatially distributed picture with average precipitation values over their grid-cells, rain-gauges provide accurate direct measurements at the point scale. It is mostly the different spatial footprints between ground and space-born observations that pose difficulties in evaluating and validating remote sensing rainfall estimates, especially for daily and sub-daily time periods.
Remote sensing estimates of precipitation can contain three types of errors: missed events (no-detection of events), false alarms (detection of rainfall not recorded on the ground), and errors in the rain-rate magnitude of correctly detected rainfall events. Different performance metrics can be used to quantify performance based on these types of errors. However, the errors from ground measurement networks also need to be considered and reference datasets need to be benchmarked [
34]. It has been found that the true errors in satellite rainfall estimates are significantly lower when the errors in ground networks and the covariance between errors in the two types of observations are acknowledged [
35]. If errors in the ground truth are not accounted for, analysis can inflate error estimates of SPPs [
3,
35]. While satellite products are indirect estimates of rainfall at the ground surface, heterogeneous precipitation over a gridded area may or may not occur over ground gauges and rainfall rates may significantly vary in space, representing a significant source of error for most ground-based networks, the magnitude of which depends on network density and rainfall system structure, storm cell size.
Thus, the best representation of the precipitation “ground truth” is one that assimilates both types of data: (1) direct point observations of rainfall at the ground surface; and (2) satellite estimates that provide the spatial distribution of rainfall. For that reason and for the continental scope of this work, the GPCP-1dd was chosen as a reference dataset against which to compare the satellite precipitation products. As with every approach and choice of reference dataset, this one has some potential limitations that will be discussed below. In summary, any continental or global dataset integrating the best possible retrospective information from a range of in-situ measurements and satellite sensors will have some conflict of interest with the real-time satellite products evaluated. This conflict is minimized by evaluating near-real time estimates and not their improved versions that incorporate gauge data a posteriori. The alternative to using a global reference dataset is to constrain analysis to a location with a good rain-gauge and radar coverage, which is not the case of Africa. Without the use of a continuous reference dataset, one could not evaluate performance metrics in a continuous manner across space and time (different geographies and seasons) and connect this analysis with continental climate mechanisms and dynamics. The strength of our choice is that the GPCP-1dd is a well-established dataset that correctly captures the historical climatology of the African continent by integrating different sources of historical data for the period of analysis.
4. Results and Discussion
4.1. An Africa-Wide Analysis
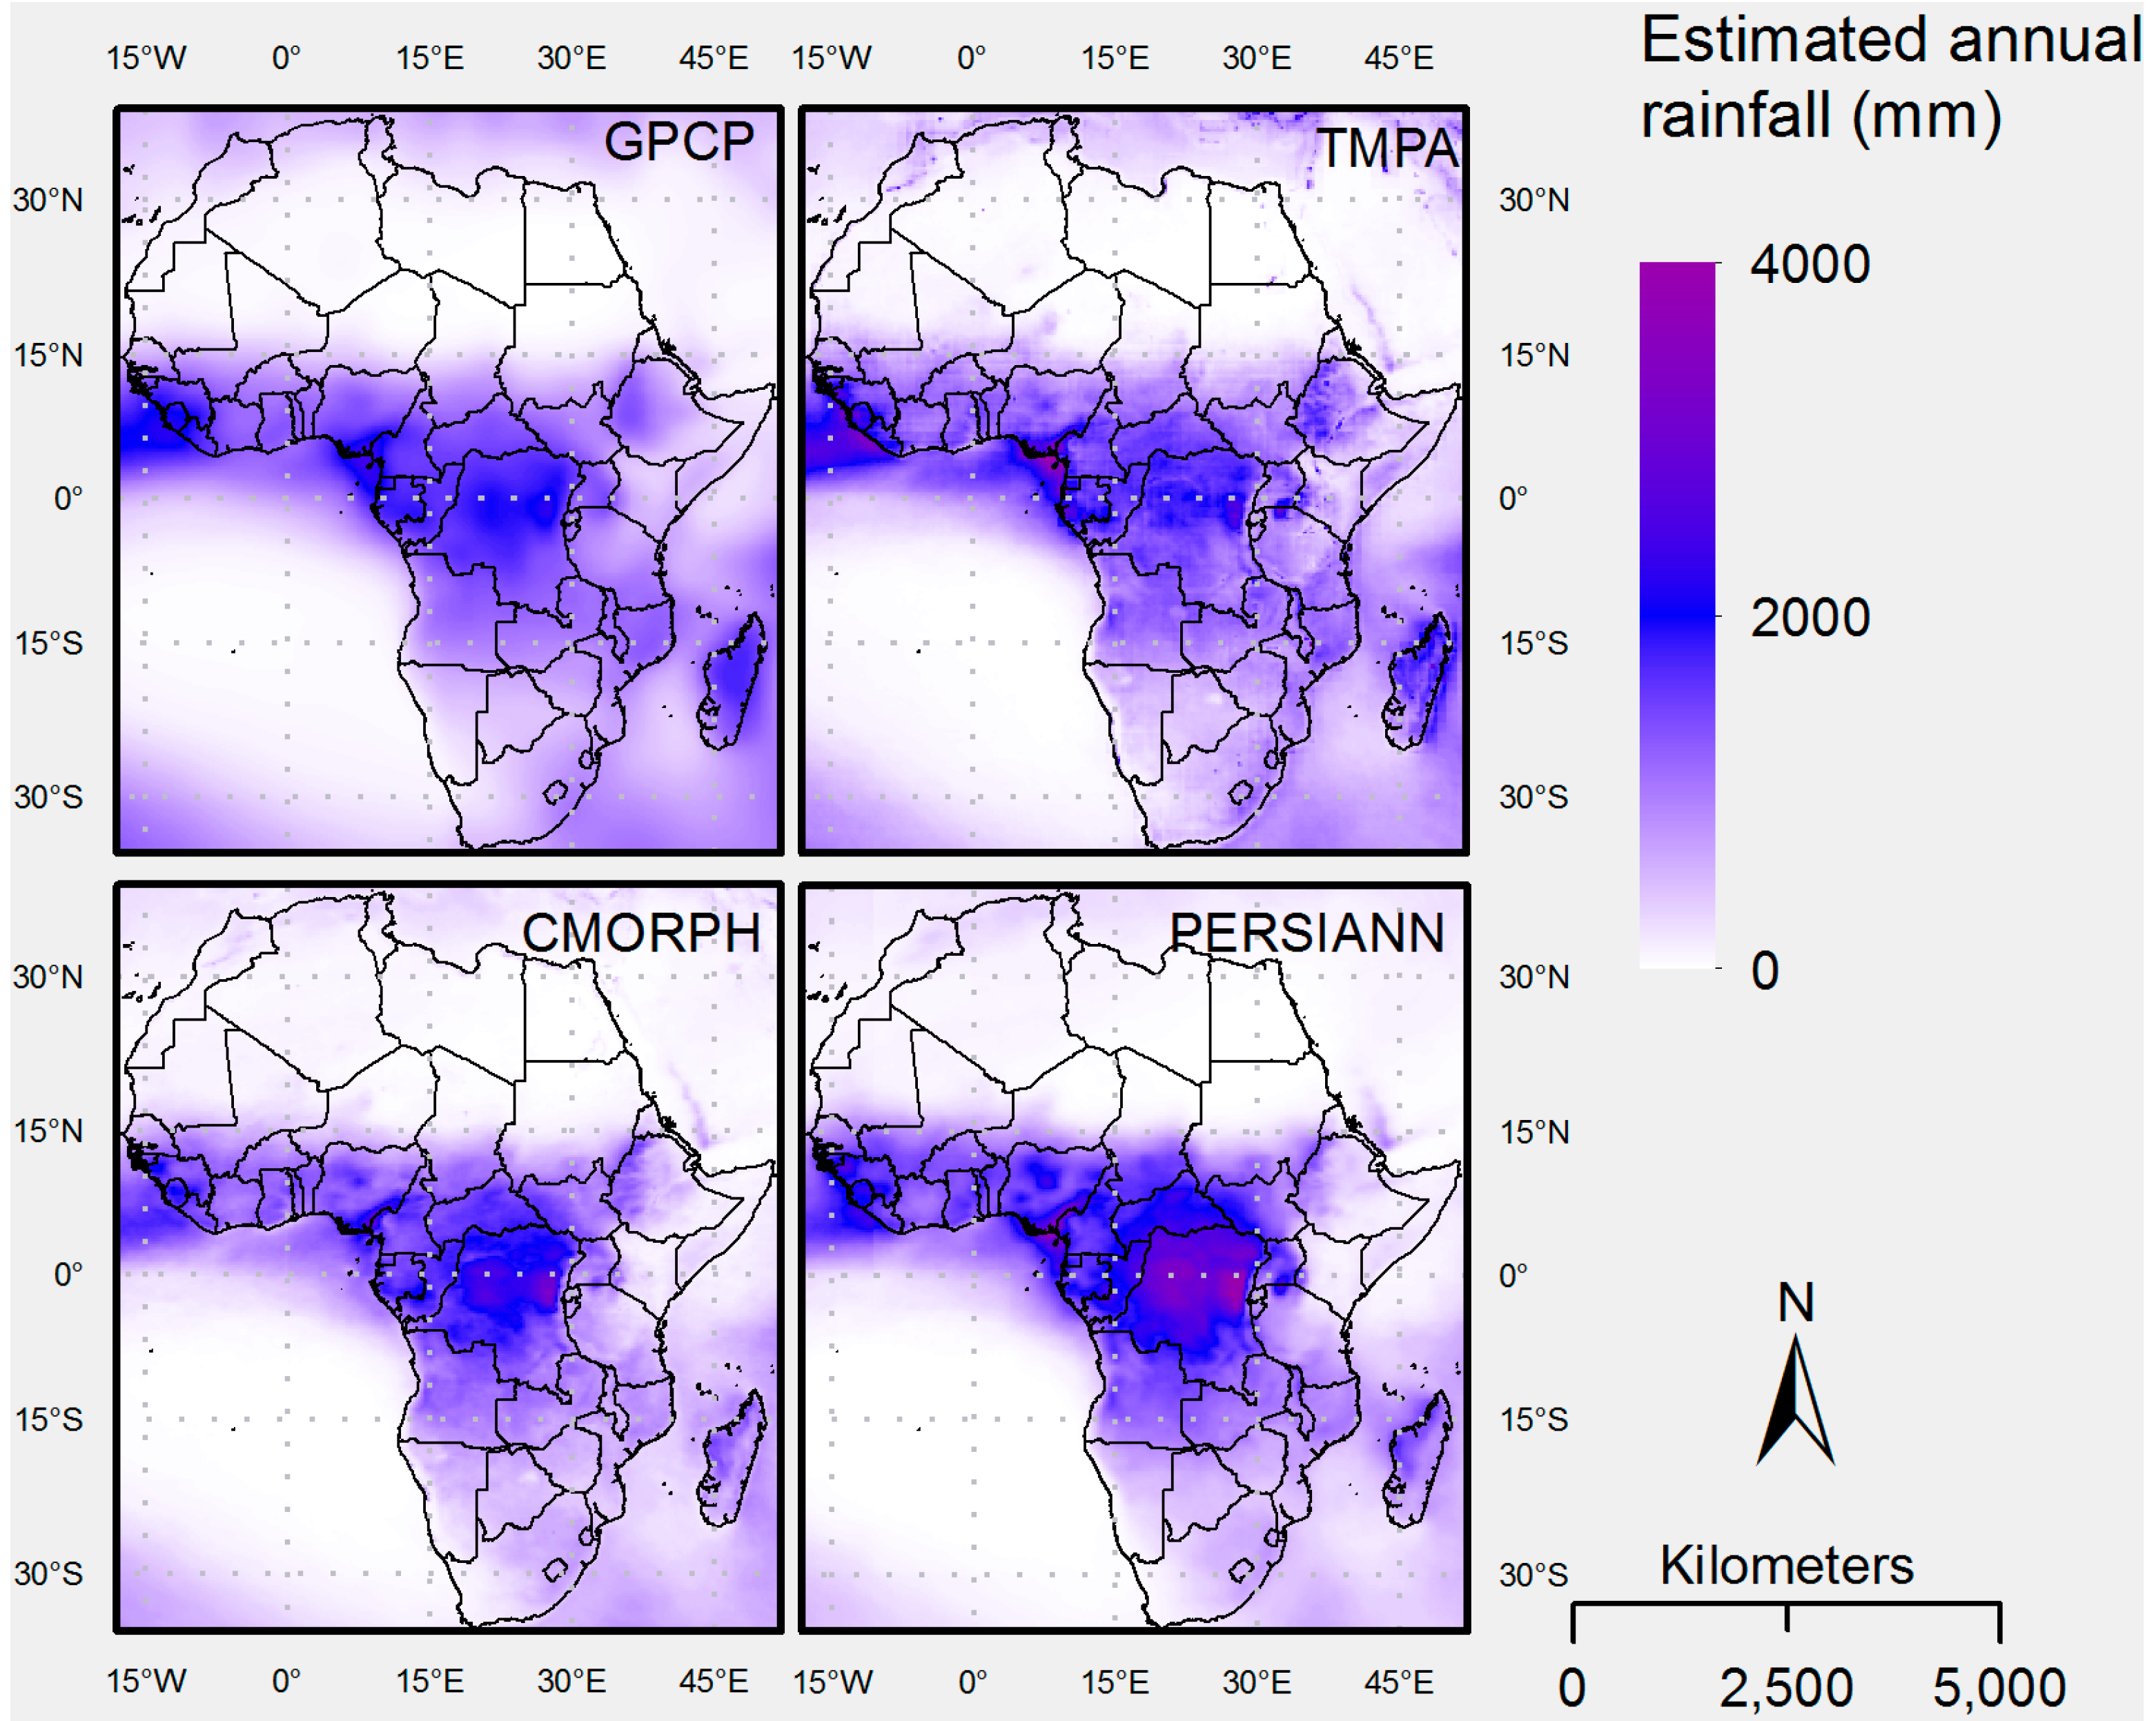
The average annual precipitation for the period 2001 to 2013, estimated by the SPPs—TMPA 3B42-RT, CMORPH and PERSIANN—is shown in
Figure 2, as well as for the GPCP-1dd reference dataset. It can be observed that the greatest difference between SPP estimates is in the Central Africa region. In the absence of ground gauges to help calibrate algorithms in that area, the difference is due to the fact that while CMORPH and PERSIANN only assimilate information from IR and MW, TMPA also incorporates information from TRMM’s orbital radar, thus yielding different estimates. As seen in
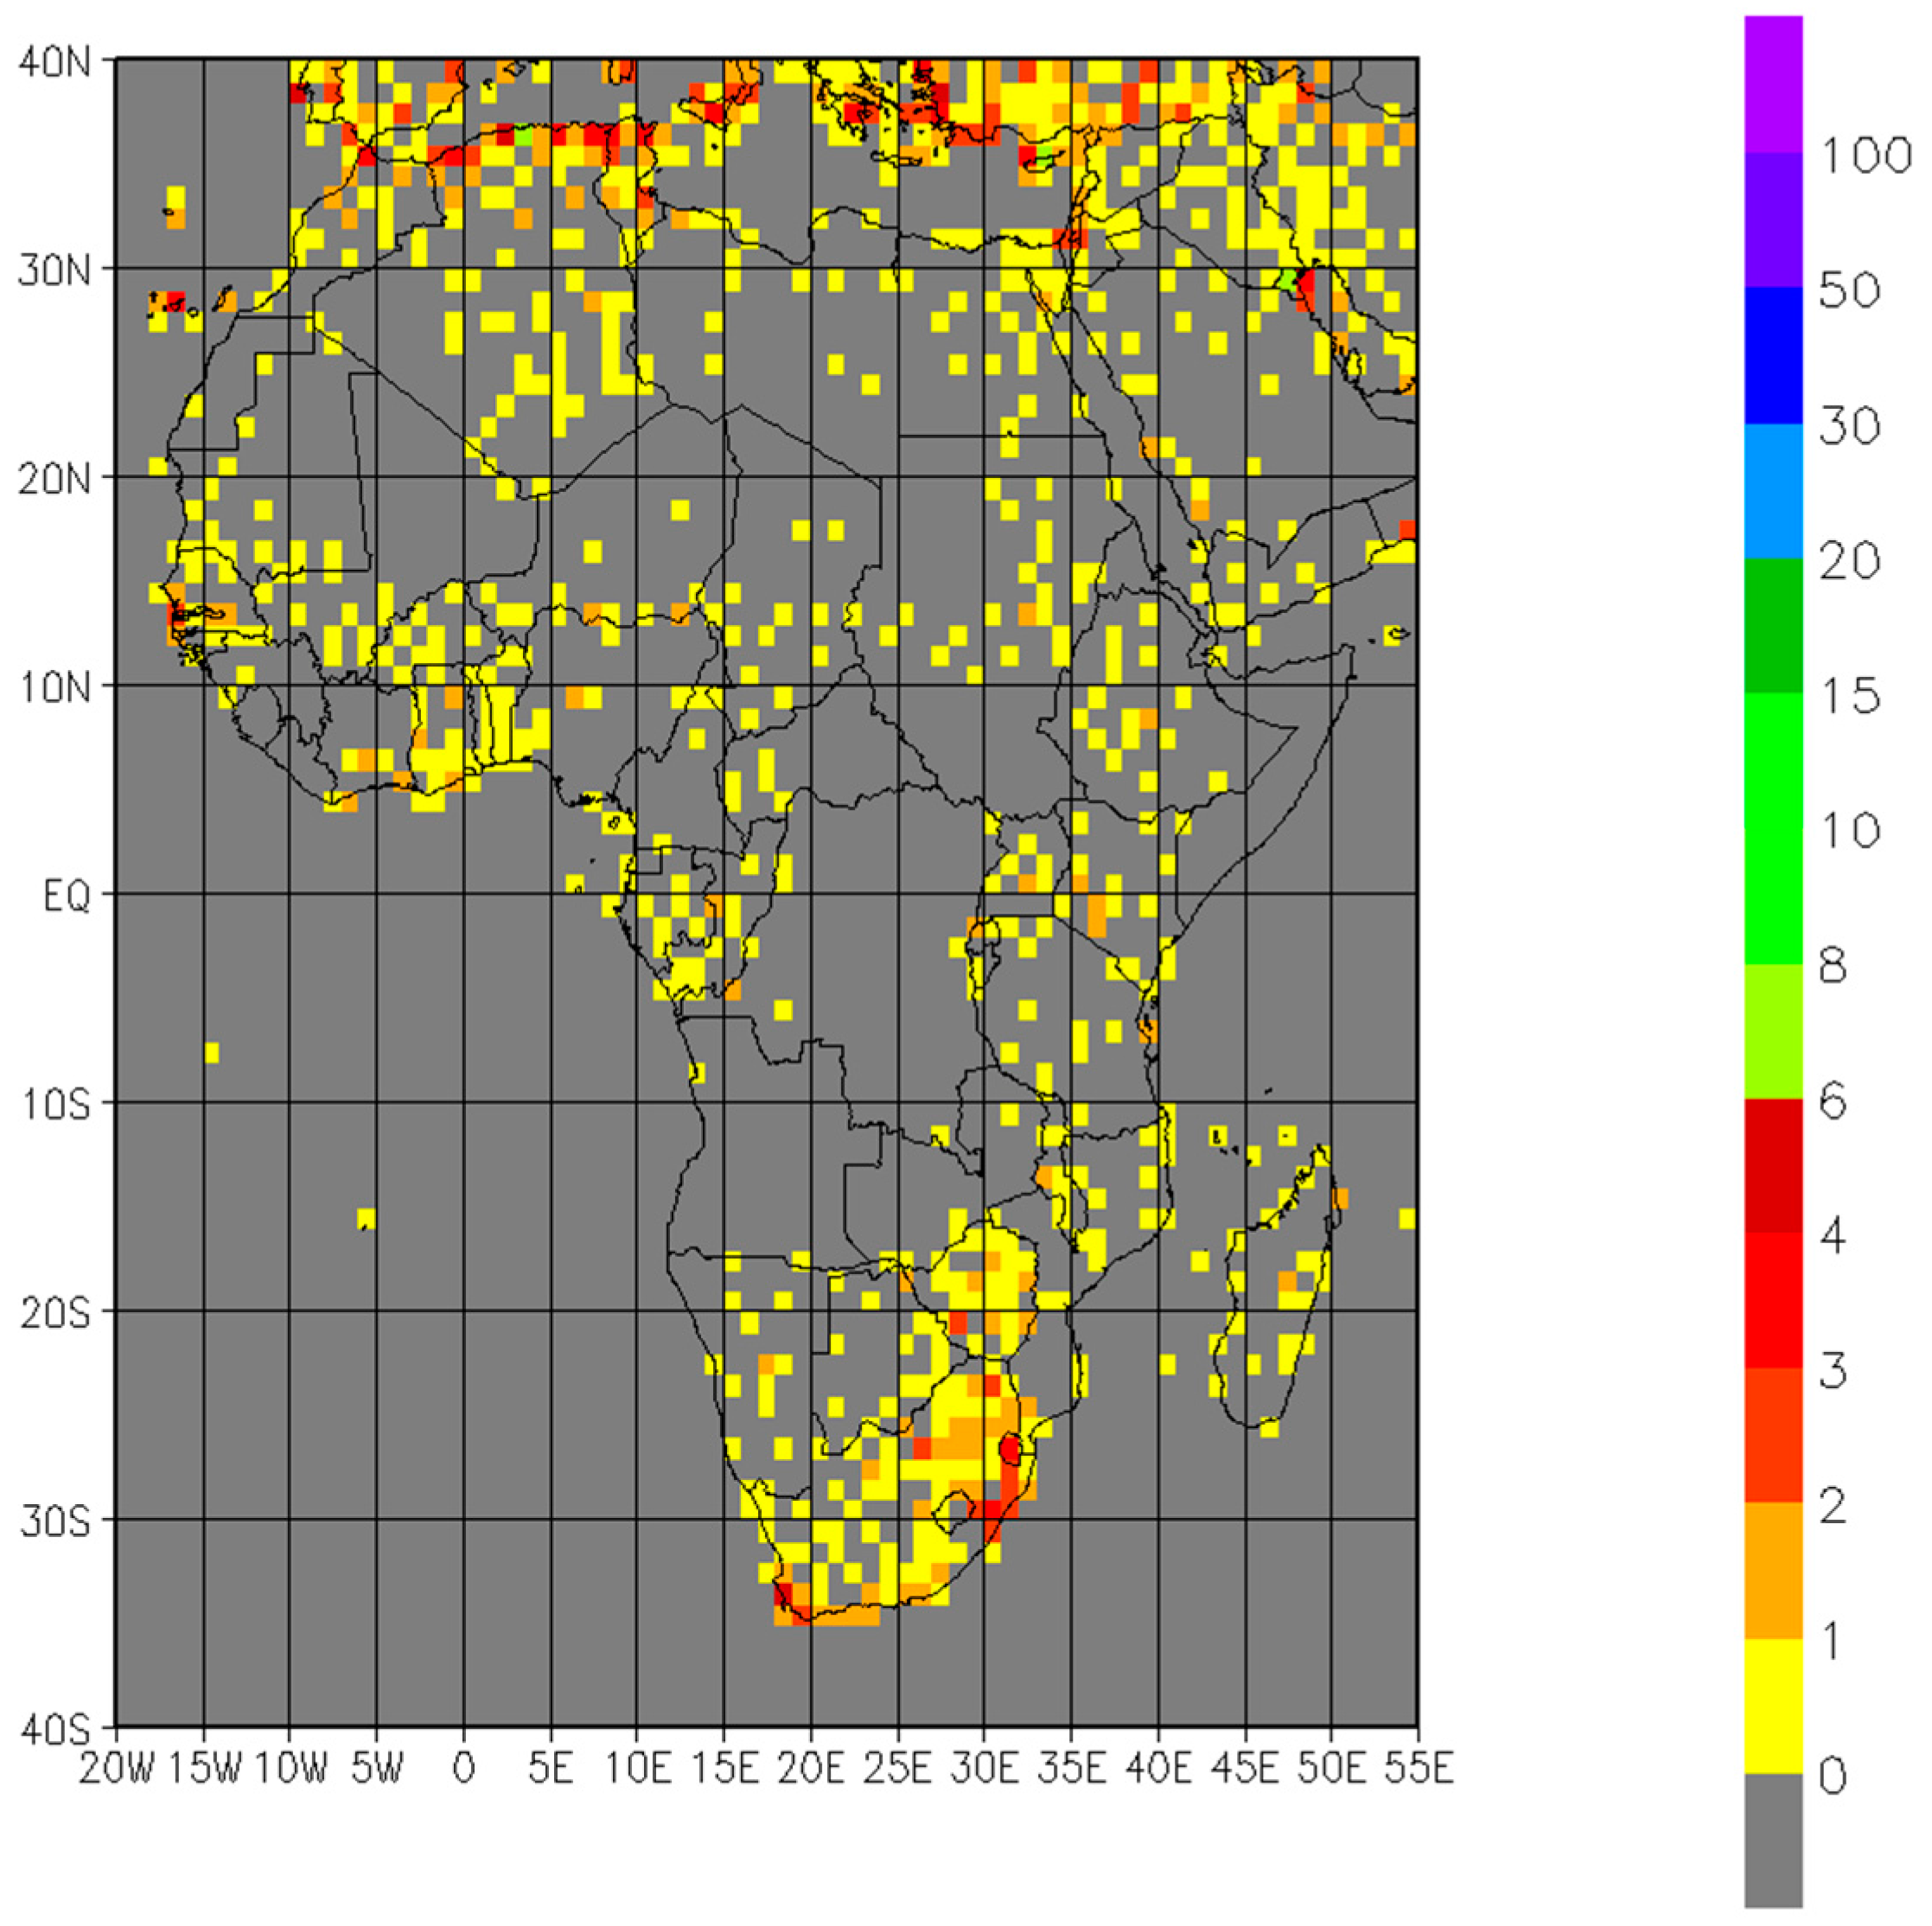
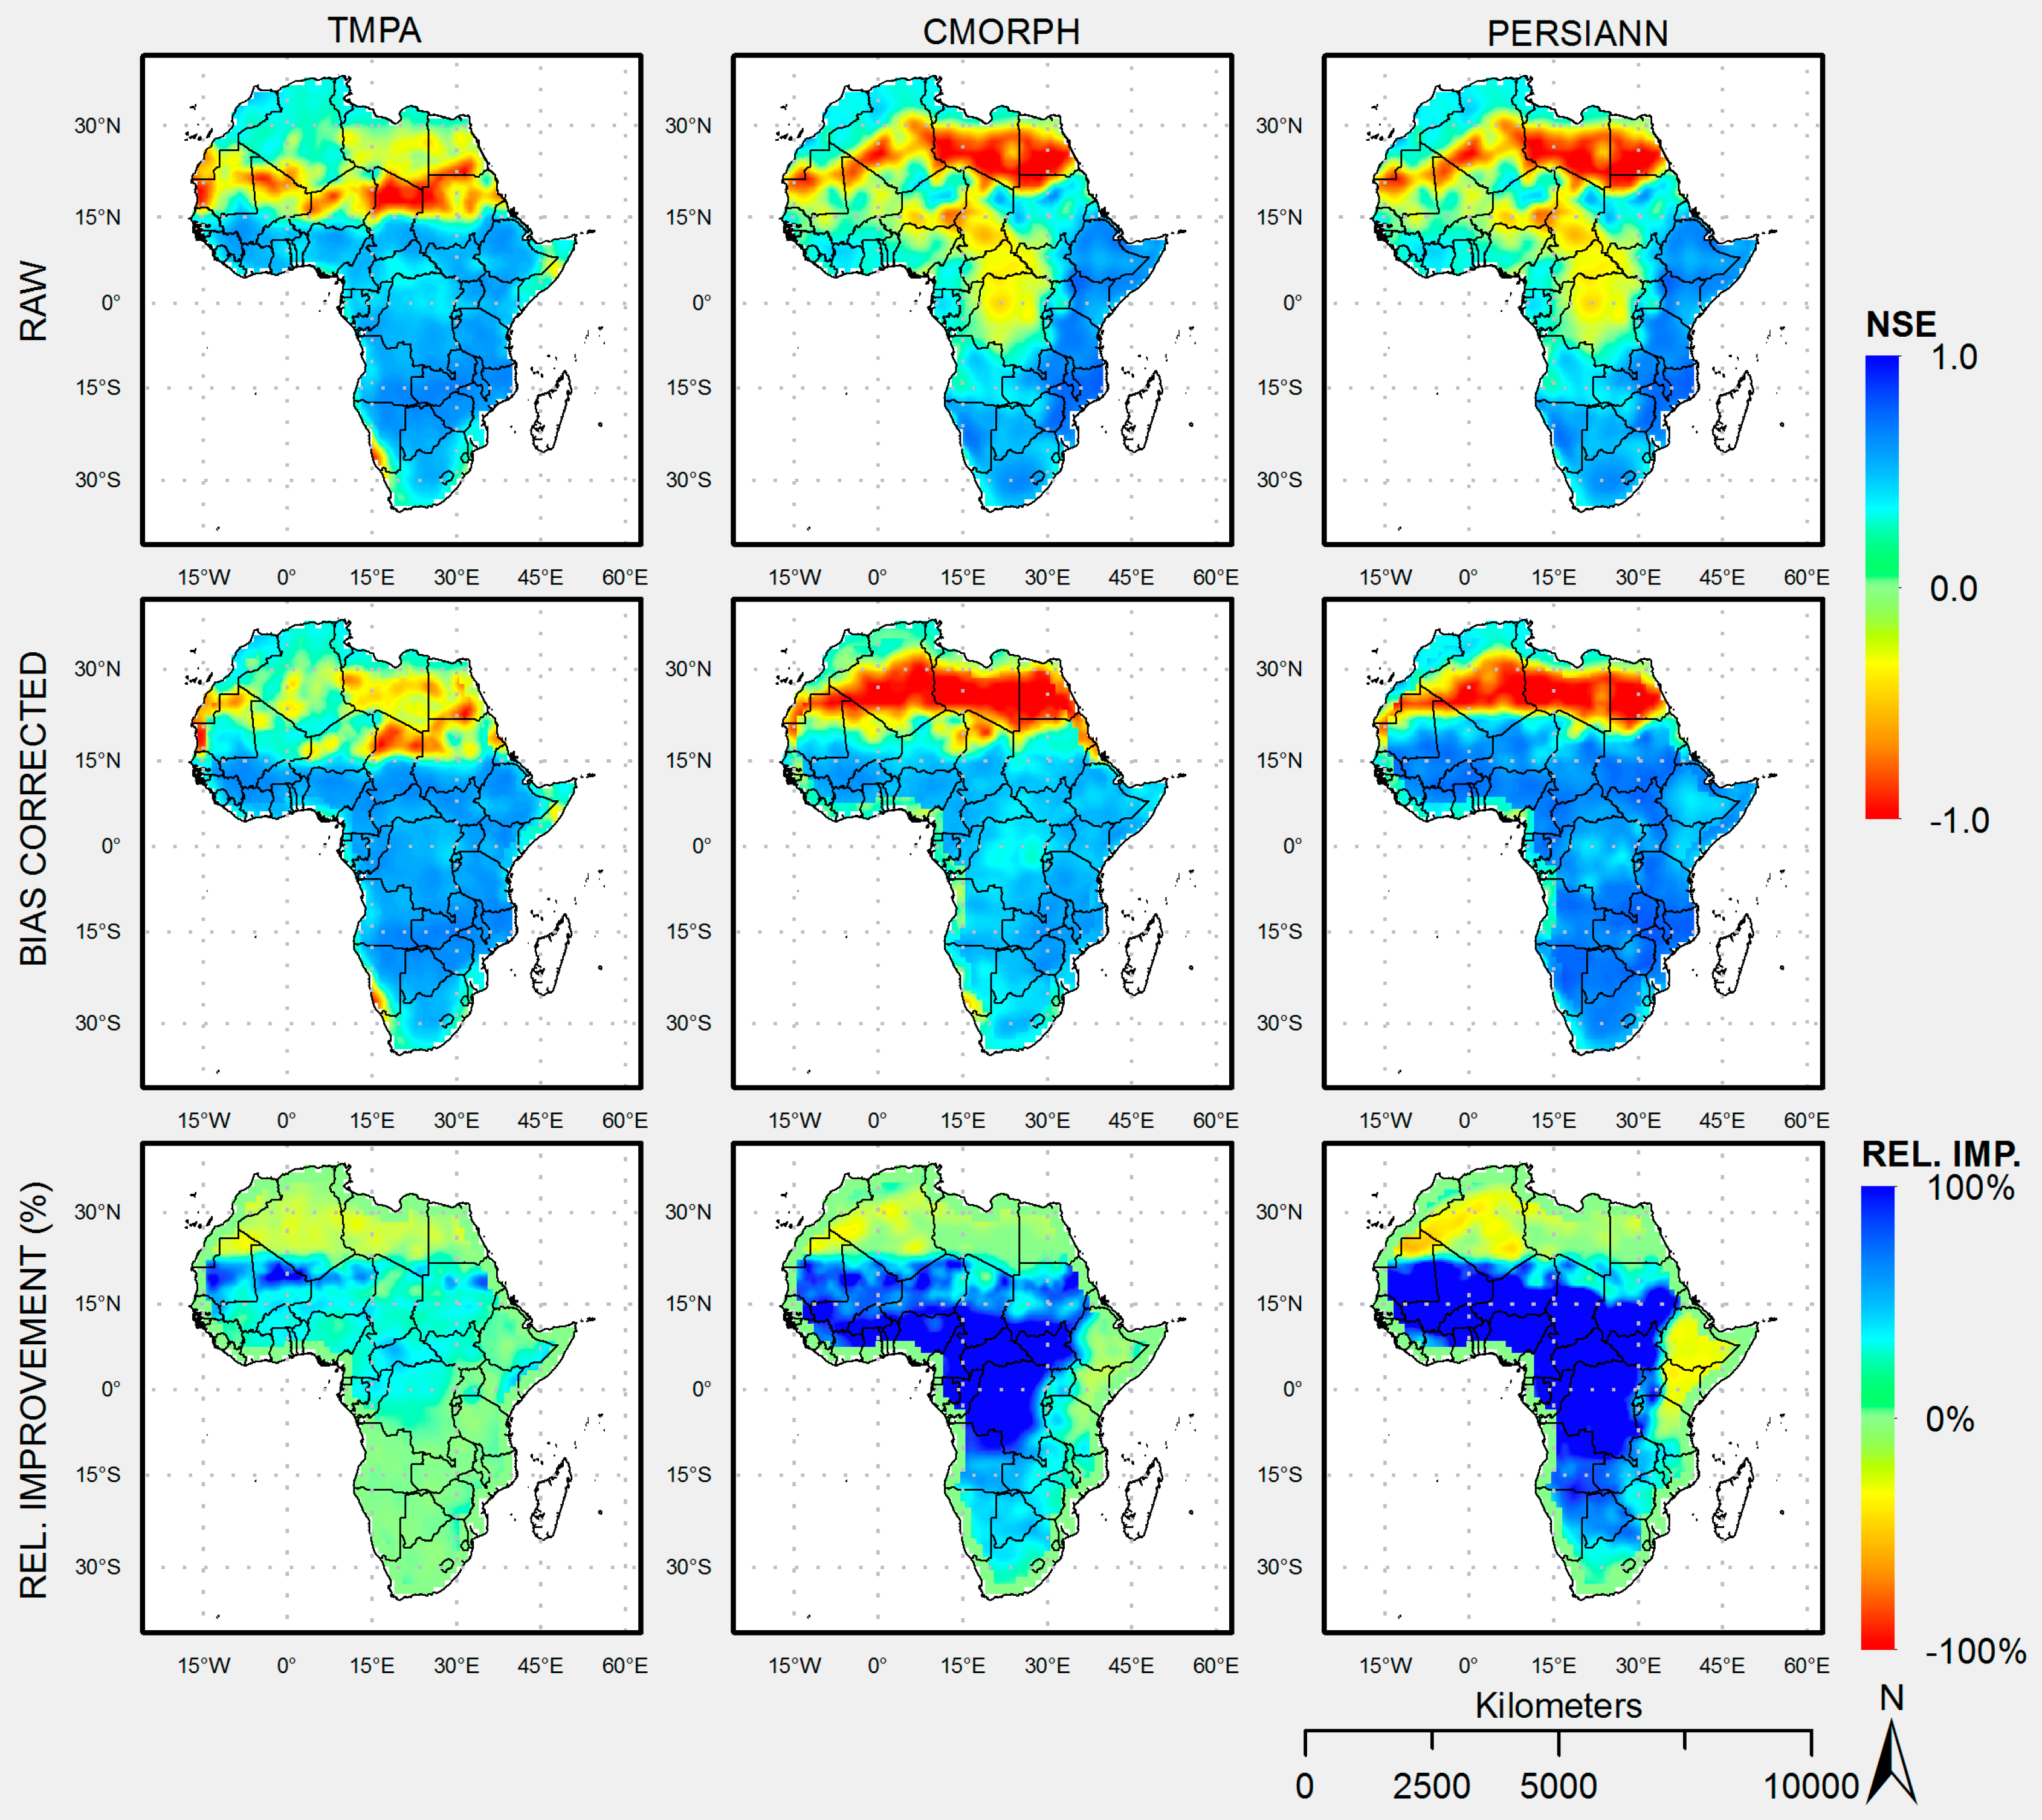
Figure 3, the number of rain-gauges available for the reference dataset has a very poor coverage in the Central Africa region. The NSE Coefficients between each one of the SPPs and the GPCP-1dd reference dataset (
Figure 4) reflect a potential conflict of interest between the latter and the TMPA product. TMPA has higher NSE values over the entire continent but especially in the Central Africa region where the other products have low or negative NSE values (over DR Congo, Central African Republic, South Sudan and Angola). This difference could be due to the fact that the reference dataset does not have ground observations in Central Africa and thus relies more on the TRMM radar, one of the main data sources of the TMPA product. Thus, TMPA does significantly better in that region while CMORPH and PERSIANN (which do not use TRMM data) do worse in this comparison. This may illustrate a conflict of interest between the TMPA 3B42-RT and the reference dataset, especially over that region, where the reference dataset heavily relies on TRMM, one of the main inputs to TMPA. However, CMORPH and PERSIANN also do worse over neighboring regions with rain gauges, such as Republic of Congo, Gabon, Western part of Central African Republic, Southern Chad, and further to the West over Ghana, Togo and Benin. On the other hand, CMORPH and PERSIANN do significantly better than TMPA over the Horn of Africa region, where no rain gauges are used in the GPCP product. Thus, the potential conflict of interest between TMPA and the reference dataset due to their use of TRMM radar data does not necessarily influence the performance of TMPA with respect to GPCP. Over the Horn of Africa region, results show that IR and PMW data used in PERSIANN and CMORPH may be providing the core of the information for the GPCP estimates over the region.
NSE values deteriorate quickly for the three products beyond the area of influence of the ITCZ, and are worse between 15°N and 30°N, over the Saharan Desert. This significant decrease in performance, mirrored by POD and FAR (see
Figure 5), is mainly due to the scarce rainfall and its high spatial variability at all-time scales. Ali et al. (2005b) shows how global products tend to highly underestimate the frequency of small rain events, linked to the high spatial intermittency at the rain event scale, which may better be captured by point measurements [
3]. While TMPA does better in the Northern part of the Sahara between 20°N and 30°N, CMORPH and PERSIANN do slightly better in the region between 15°N and 20°N. NSE values remain positive and relatively high—especially for TMPA—over all of Southern Africa, down to 32°S. The region where CMORPH and PERSIANN have higher NSE values is along the Eastern Coastal countries of Africa, from Ethiopia to Mozambique.
Bias correction significantly improves NSE values for CMORPH and PERSIANN across the continent south of latitude 20°N, Efficiency values for CMORPH and PERSIANN over some regions in the arid areas of the Sahara and the Horn of Africa very slightly decrease after bias correction, likely due to an artifact of bias correction in these arid regions with erratic rainfall events. As shown in the relative improvement of
Figure 4, the bias correction increases NSE over most of the continent below 20°N for CMORPH and PERSIANN but the highest improvements for TMPA are limited to the southern fringes of the Sahel with a slight increase in NSE across the continent, and mostly between 20°N and the equator. It is worth noting that PERSIANN has the highest NSE values over the largest extension of the African continent after bias correction, due to its better efficiency in the fringe between 15 and 20°N. Notably, the bias correction does little to improve values over most of the Saharan Desert and North Africa, which is an indication that most of the error over the region is a correlation error, related to the difficulty of correctly detecting rain.
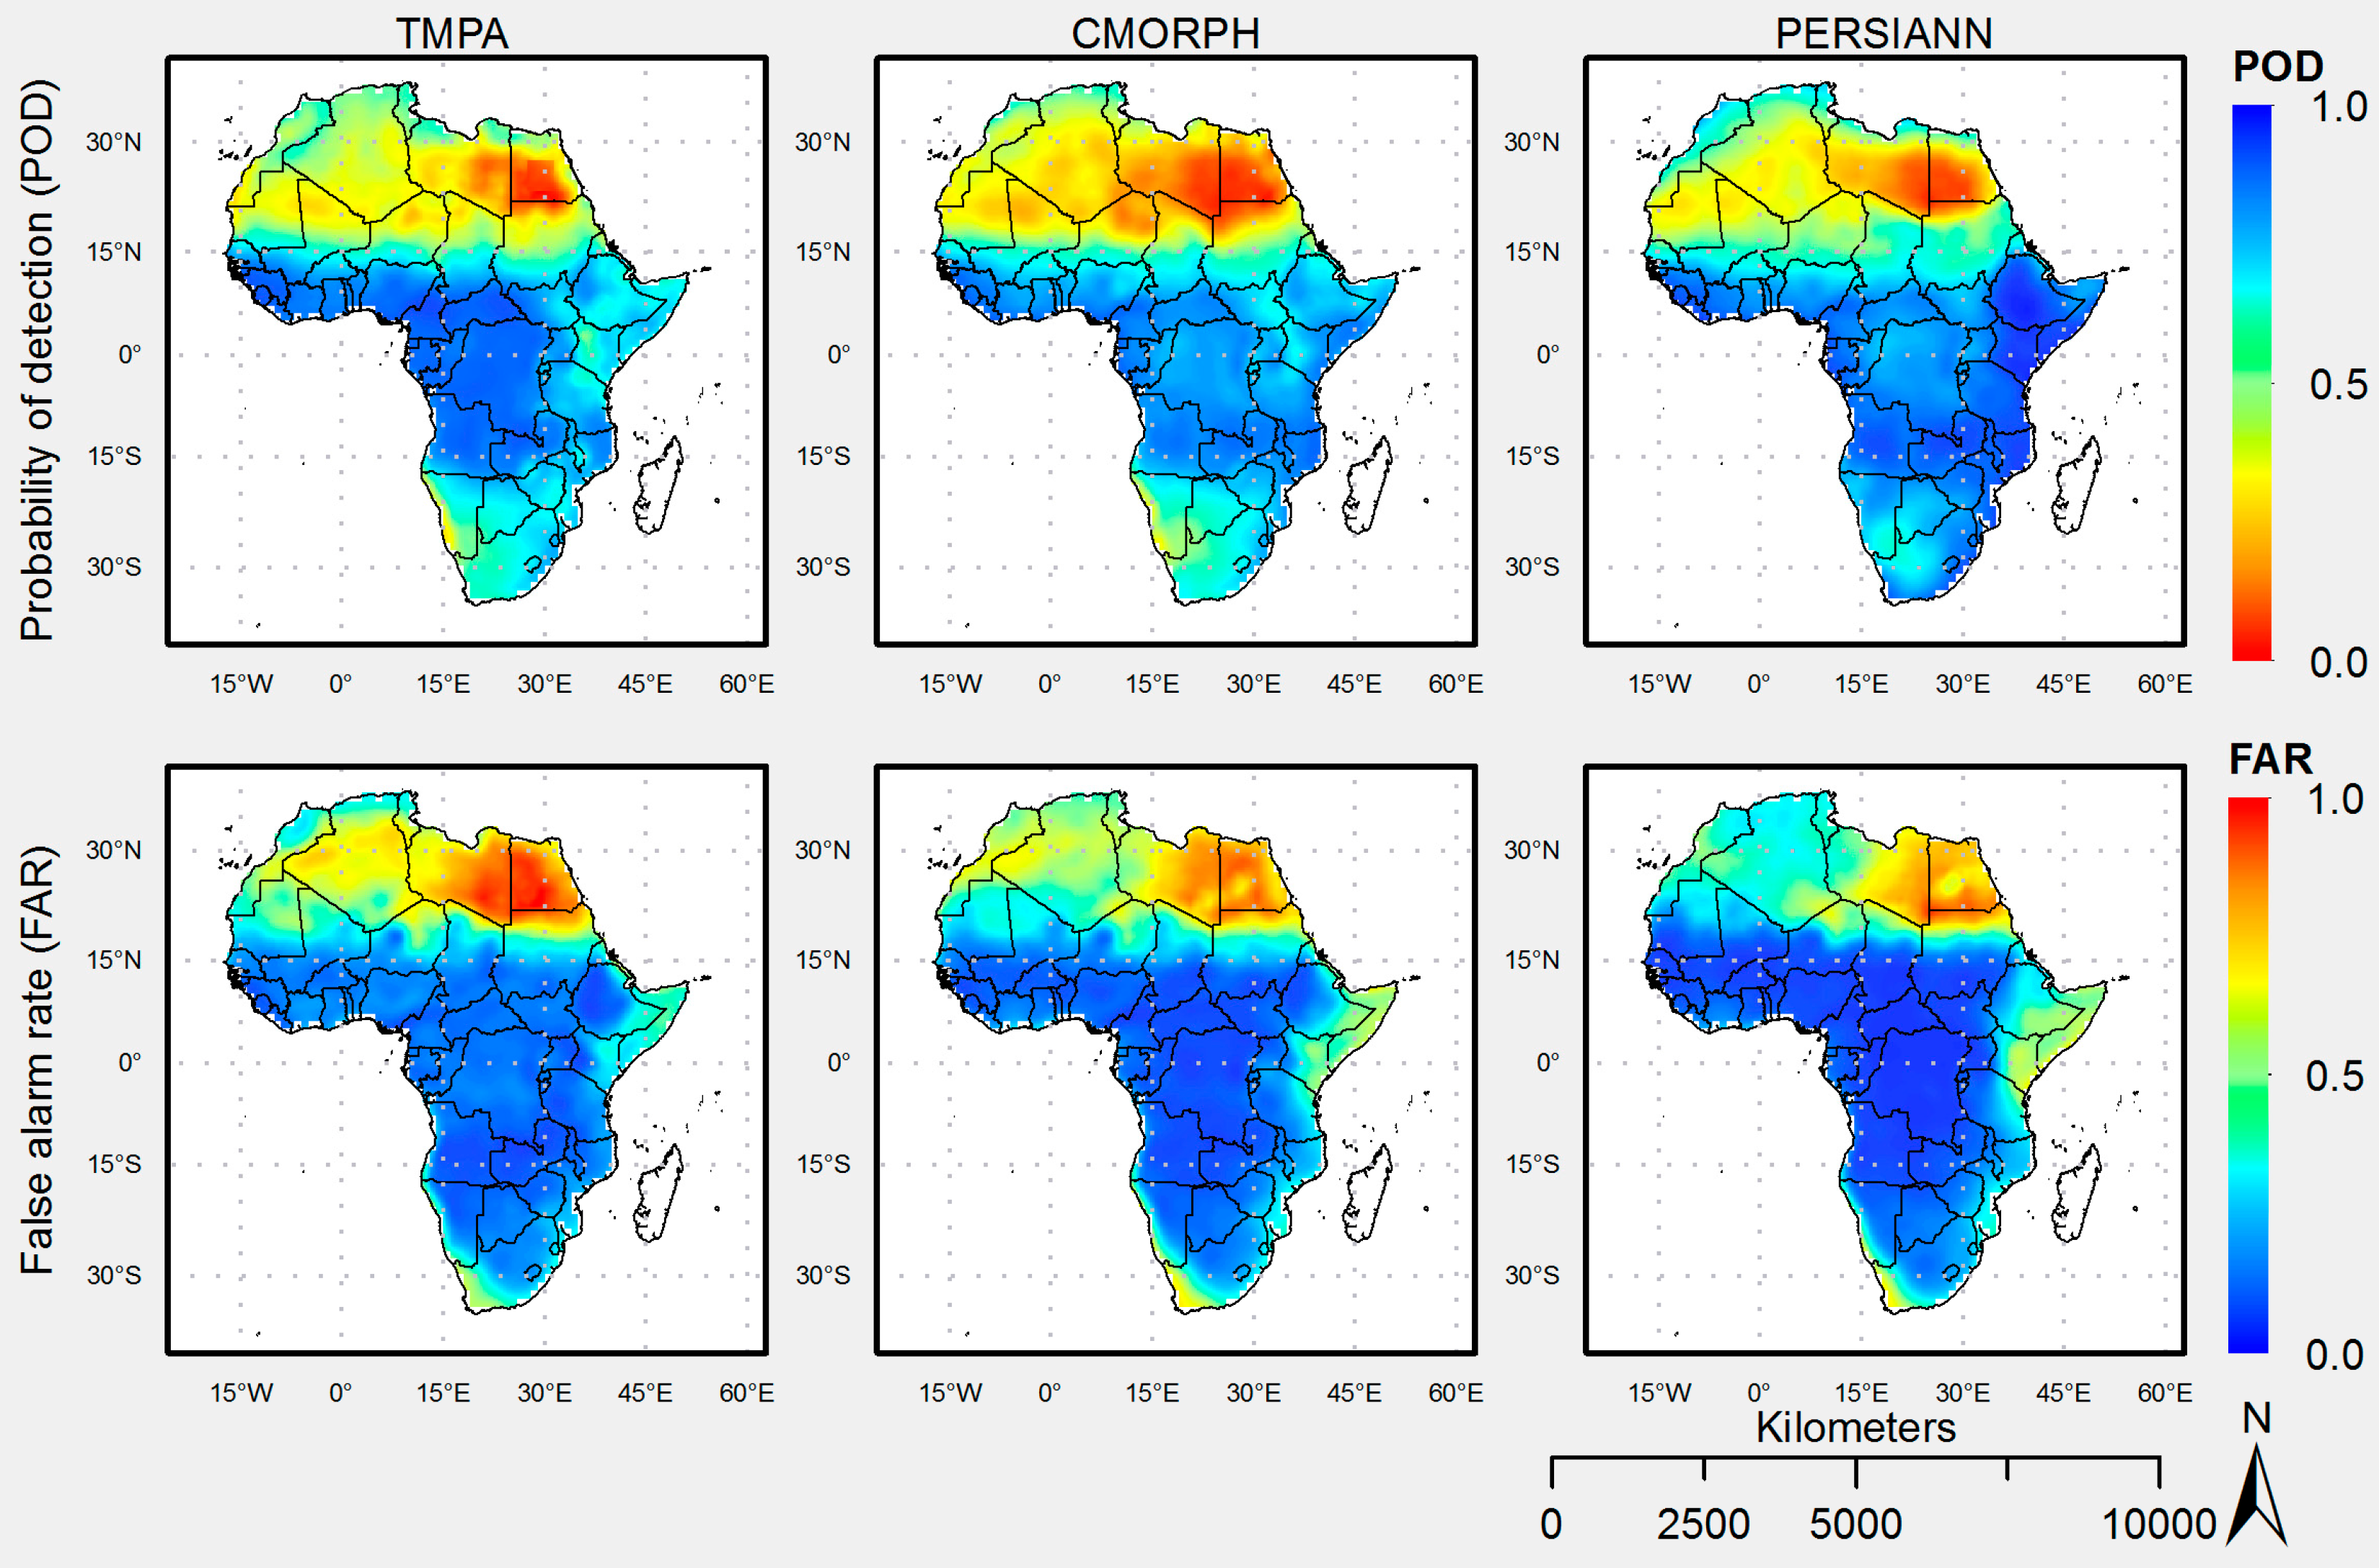
The Probability of Detection is high for the three products except in the Saharan Desert, the Horn of Africa, and Southern Africa (Namibia, Botswana, and South Africa) region (
Figure 5). While TMPA shows slightly higher POD values over Central Africa and Western sub-Saharan Africa PERSIANN shows a clear superiority detecting rain events over the Horn of Africa and East Africa regions. FAR values are lowest over the ITCZ area of influence. Over the Horn of Africa FAR values increase for all products, with PERSIANN showing the biggest spatial extent of higher False Alarm Rates over that region. Both POD and FAR values are best over the continent below 15°N, but while POD deteriorates below 15°S, especially for TMPA and CMORPH, FAR values remain low (good) beyond the area of influence of the ITCZ until beyond 30°S. The decrease in event detection with increasing aridity is in agreement with previous findings [
13,
14].
This change in performance beyond the southern boundaries of ITCZ influence is not reflected in NSE or FAR values. The overall better performance of SPPs beyond the ITCZ influence to the South, as compared to the North (Saharan Desert), is due to the influence of the Indian Ocean and the East African Monsoon, which result in the dominance of convective rainfall over the region, which SPPs estimate best.
The POD and the FAR of a rainfall product are the result of several factors, including the calibrated relationships between sensor reflectivity and estimated rain-rate, and the sampling error depending on the timing of satellite overpasses. They are related metrics to a certain extent, and their relationship depends on the algorithms and procedures used in the product development.
4.2. Latitudinal Band Analysis
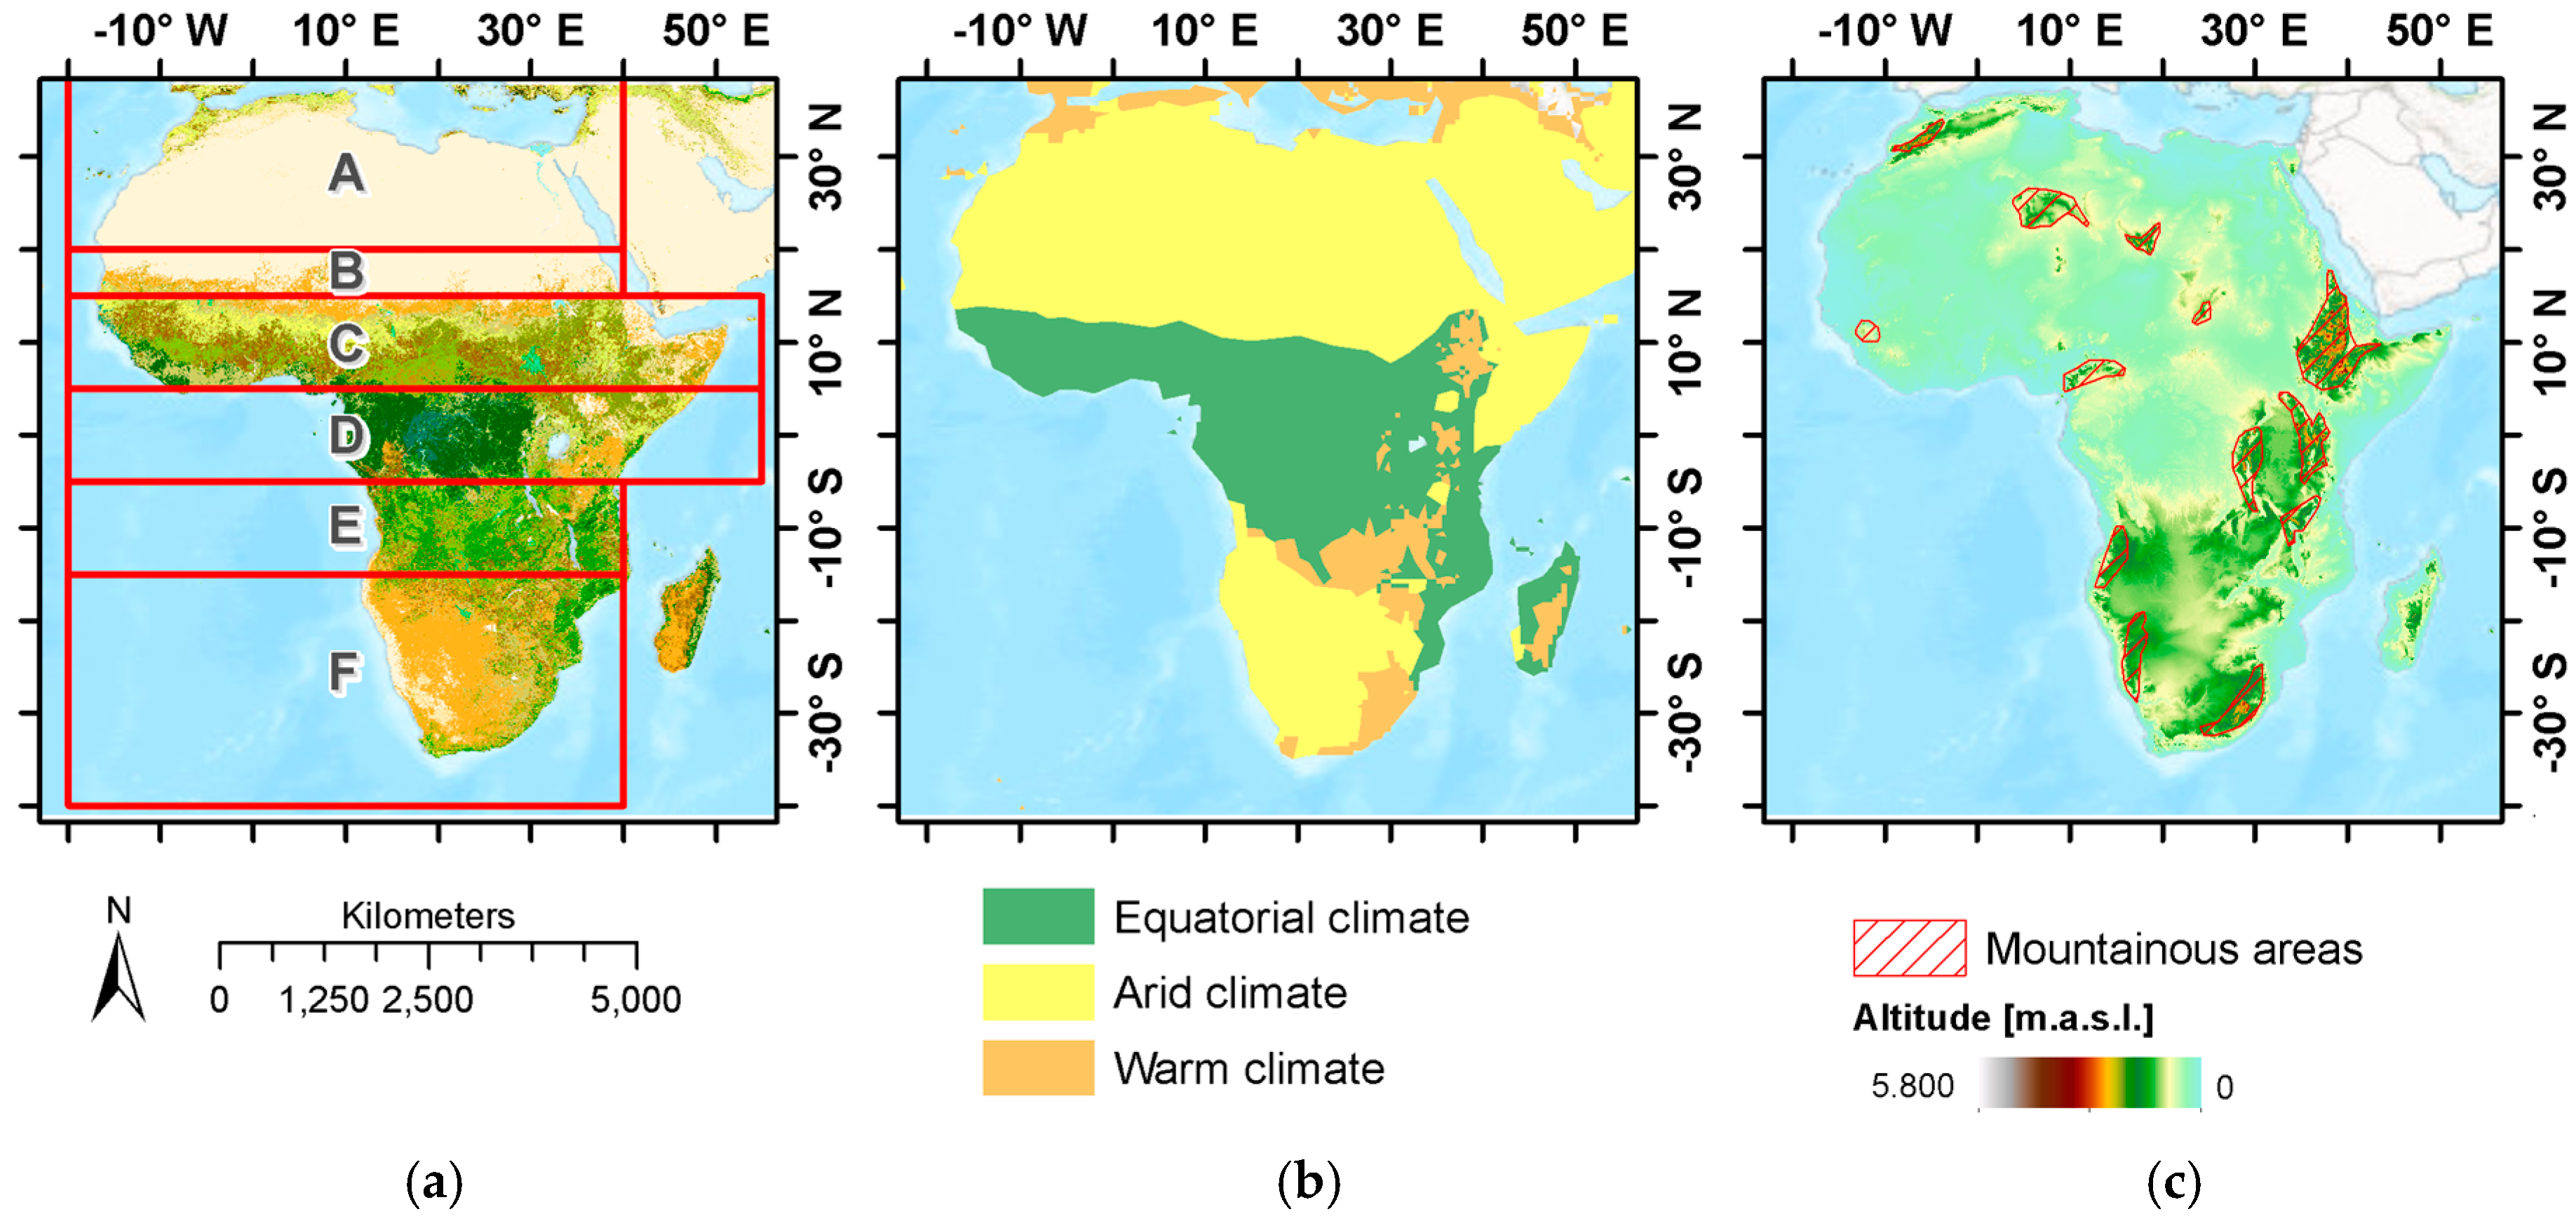
The dependency of satellite precipitation errors on the dynamics of rain producing mechanisms—specifically the ITCZ over the African continent—is illustrated at the seasonal level in
Table 3, which shows the relative errors of each SPP for each season and for each latitudinal band as defined in
Figure 1. The cell color indicates higher (red) and lower (green) errors. The lower errors are always in the bands where the ITCZ is located during a specific season. Smaller relative errors where rainfall mechanisms are convective, frequent and regional is in agreement with findings from Artan et al. (2007), who attributed the good results in simulations of Mekong sub-basins during the monsoons to those characteristics [
44].
Band A: In general, none of the products show a good performance in this area. The ETS (Equitable Threat Score) shows no skill in the detection of rain, poor POD and FAR values. These results are mostly due to the lack of regional convective rainfall activity, and the difficulty of SPPs in detecting frontal rainfall processes. They are in agreement with previous results reported in the literature for such latitudes [
3].
Band B: This fringe is a transition between the Sahel and the zone influenced by the ITCZ. Rainfall occurs mostly between June and August, coinciding with the movement of the ITCZ, but there are rainfall events up to November. All the products show a strong positive bias during the rainy season that is successfully removed with the bias correction. An interesting feature of the PERSIANN data is that is seems to be more accurate than TMPA and CMORPH, but it also shows more frequent non detected precipitation events than the other products. It has better skill on estimating the rain-rate if correctly detected, but a higher failure rate in detecting it. The detection skill (ETS) of all SPPs is low, with better performance in JJA, when most of the rain occurs.
Band C: This latitudinal band is where the SPPs show the best overall skill in observing rainfall. Most of the rainfall occurs between June and August, but with significant rainfall in the seasons before and after. CMORPH and PERSIANN overestimate annual rainfall by nearly 50%. The bias correction has a significant impact, improving the NSE from the vicinity of −1 to 0.78–0.95. TMPA has the least bias of the three SPPs, and its NSE ranges between 0.7 and 0.9 that is increased to 0.88–0.95 after the bias correction. It is also in this band where the errors seem less dependent of the magnitude of rainfall, but heteroscedastic nevertheless, as shown by the Mann–Kendall tests. The POD, FAR and ETS are good and relatively similar between products during the rainy seasons, but the detection on the dry season is still poor.
Band D: This tropical band is characterized by two rainy seasons due to the double transit of the ITCZ over the equator during the spring and fall of the Northern hemisphere. The error characteristics are very similar throughout the year: TMPA underestimates less than 10% in all seasons, while CMORPH and PERSIANN overestimate over 30% of the actual rainfall. After correction, the bias is reduced to less than 5%, except for PERSIANN, where the missed rainfall events seem to affect the overall good performance of the hits. This latitudinal band shows the best performances in rain detection for all seasons, confirming past findings that SPPs work best detecting tropical convective storms. The higher performance of SPPs in tropical and equatorial regions with strong convective activity has been widely reported [
7,
10,
14,
15,
16].
Band E: Mirroring band C, most of the annual rainfall occurs between December and February, with significant precipitation on the seasons before and after. Biases are similar to those of bands C and D, with underestimation of TMPA and overestimation of PERSIANN and CMORPH, but with highest bias between September and November. The errors after the correction seem to be greater than those on band C. Again, PERSIANN has the least dispersion between SPP estimates and observations, but many missed rainfall events. The rain detection skill during the dry season is notably poorer than during other seasons, and the best performance is between December and February, when the ITCZ is over the area.
Band F: In this zone, the bias is positive on the rainy months and negative on the dry season. Precipitation occurs mostly between December and February that is only partially removed by the bias correction.
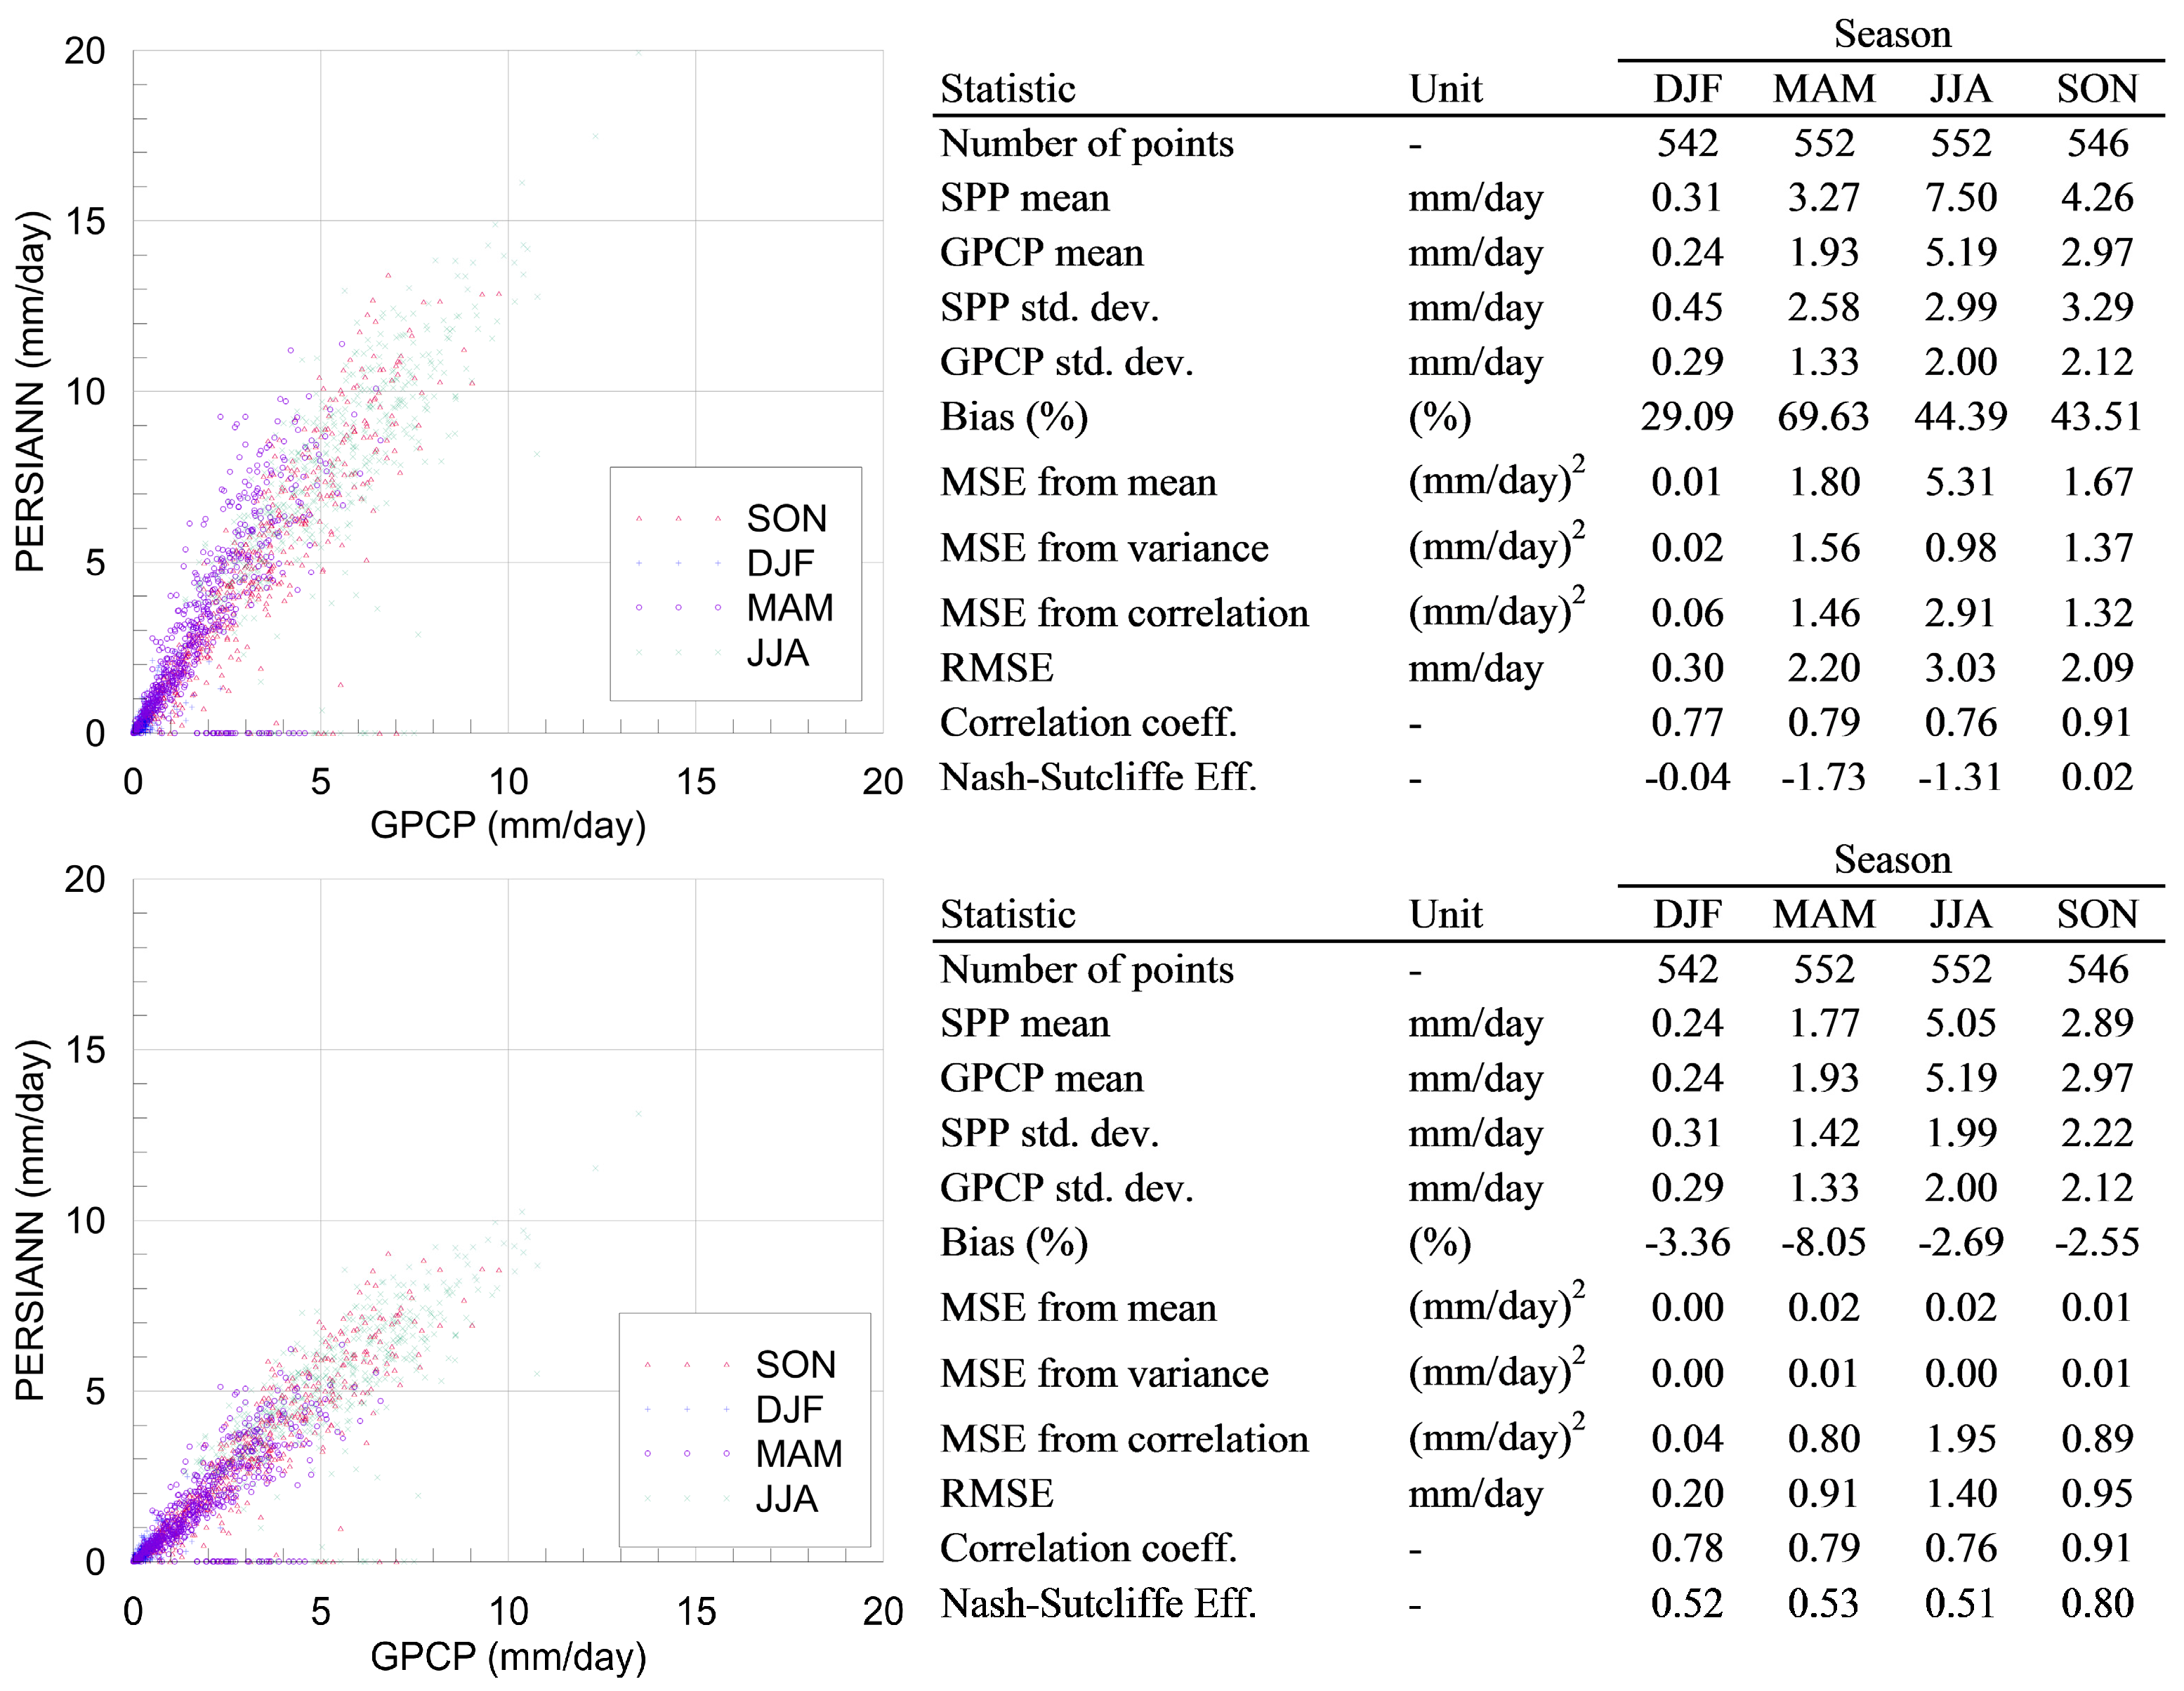
The effects of bias-correction are also shown in
Figure 6 for seasonal precipitation of PERSIANN and latitudinal band D. Most notably, the mean and standard deviation error terms have been almost eliminated, but have a less significant effect on the correlation error term. The figure is representative of other latitudinal bands.
4.3. Climatic and Topographic Classification Analysis
In regards to the Koppen Geiger Climatic zone classification, SPPs work the best in the tropical zones due to the convective nature of rainfall. Raw CMORPH and PERSIANN clearly overestimate rainfall by 30% and 40%, respectively, and TMPA slightly underestimates it by about 3% on average (not shown here, see climate classification scatterplots and tables in the
Supplementary Materials online). The bias correction improves the estimates, but not nearly as much as with the latitude band groupings. The rather constant values of POD, FAR and ETS through the year indicate poor isolation of specific rain regimes. In general, the best skill is for tropical zones, followed by arid zones. For warm zones the performance is poor because of the very high FAR, even if TMPA and CMORPH show small bias while PERSIANN has a strong negative bias between March and August, and a positive bias the rest of the year. On arid zones the products overestimate 5% to 50% of the rainfall, a bias that is partially removed by the correction, yielding a mixture of overestimations up to 10% and underestimations down to −30%. The NSE value does not improve much for TMPA, but it does for CMORPH and PERSIANN between September and February, from negative values to low positive values.
While the NSE of plains is consistently better than that of mountainous areas, the lack of other significant differences between flat and mountainous areas suggest that the topographic classification used here, grouping distant mountainous areas across the continent, at different latitudes and with different rainfall regimes and climatology (and at the scale of one degree), is likely smoothing out other differences that could be better characterized locally through limited-area case studies.
4.4. Characterizing Biases and the Effect of Bias Correction
The effects of bias correction on the MSE error terms (mean, variance, correlation) and the NSE values can be seen for each spatial area (latitudinal band, climate and topographic) for a specific season (
Table 4,
Table 5 and
Table 6). The statistics are calculated for the daily spatial average over each area. Results show that bias correction is generally very successful at removing the mean error term of MSE as well as a significant portion of the variance error term. However, since the correlation term depends on the lack of co-fluctuation between estimates and observations, bias correction does little to reduce it. In the majority of the cases, for all seasons and products, the Nash–Sutcliffe Efficiency values improve with bias correction, especially for CMORPH and PERSIANN. The climatic warm areas are an exception to this improvement, where bias correction does not improve NSE values and in almost 50% of the cases, it worsens it. The likely reason for this is the spotty and uneven distribution of warm areas on the northern and southern hemispheres. By grouping these areas together, the bias correction mixes different rainfall regimes, thus losing its efficiency. For better results, the bias correction should be performed separately in each warm area.
Our approach to delimit spatial areas of analysis and seasonal evaluations is based on the assumption that such grouping of data allows us to isolate rainfall regimes and climatic controls for which SPPs may exhibit specific error characterizations. In cases where that holds true, bias correction can successfully remove or reduce significant parts of the error. On the other hand, if the grouping is unsuccessful, and several rainfall regimes are mixed together, as may be the case for climatic warm areas, bias correction will be challenged by the presence of data samples with errors of different nature. From this analysis, it becomes apparent that latitudinal bands are the large areas of analysis that better capture the seasonality of rainfall regimes over Africa, as they align well with the dynamics of the ITCZ.
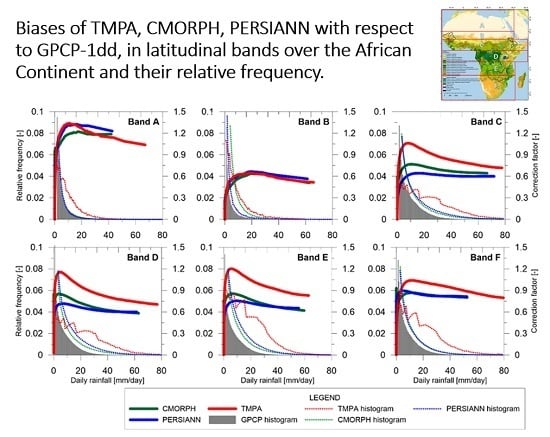
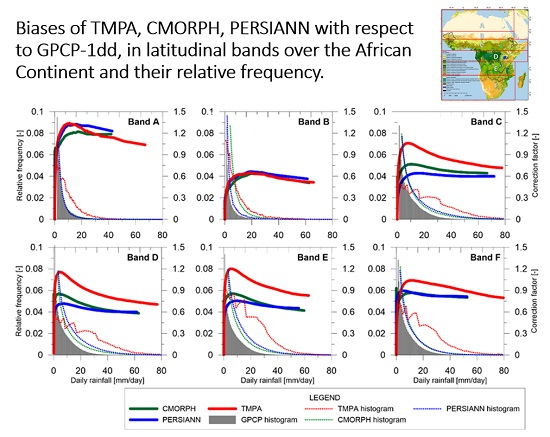
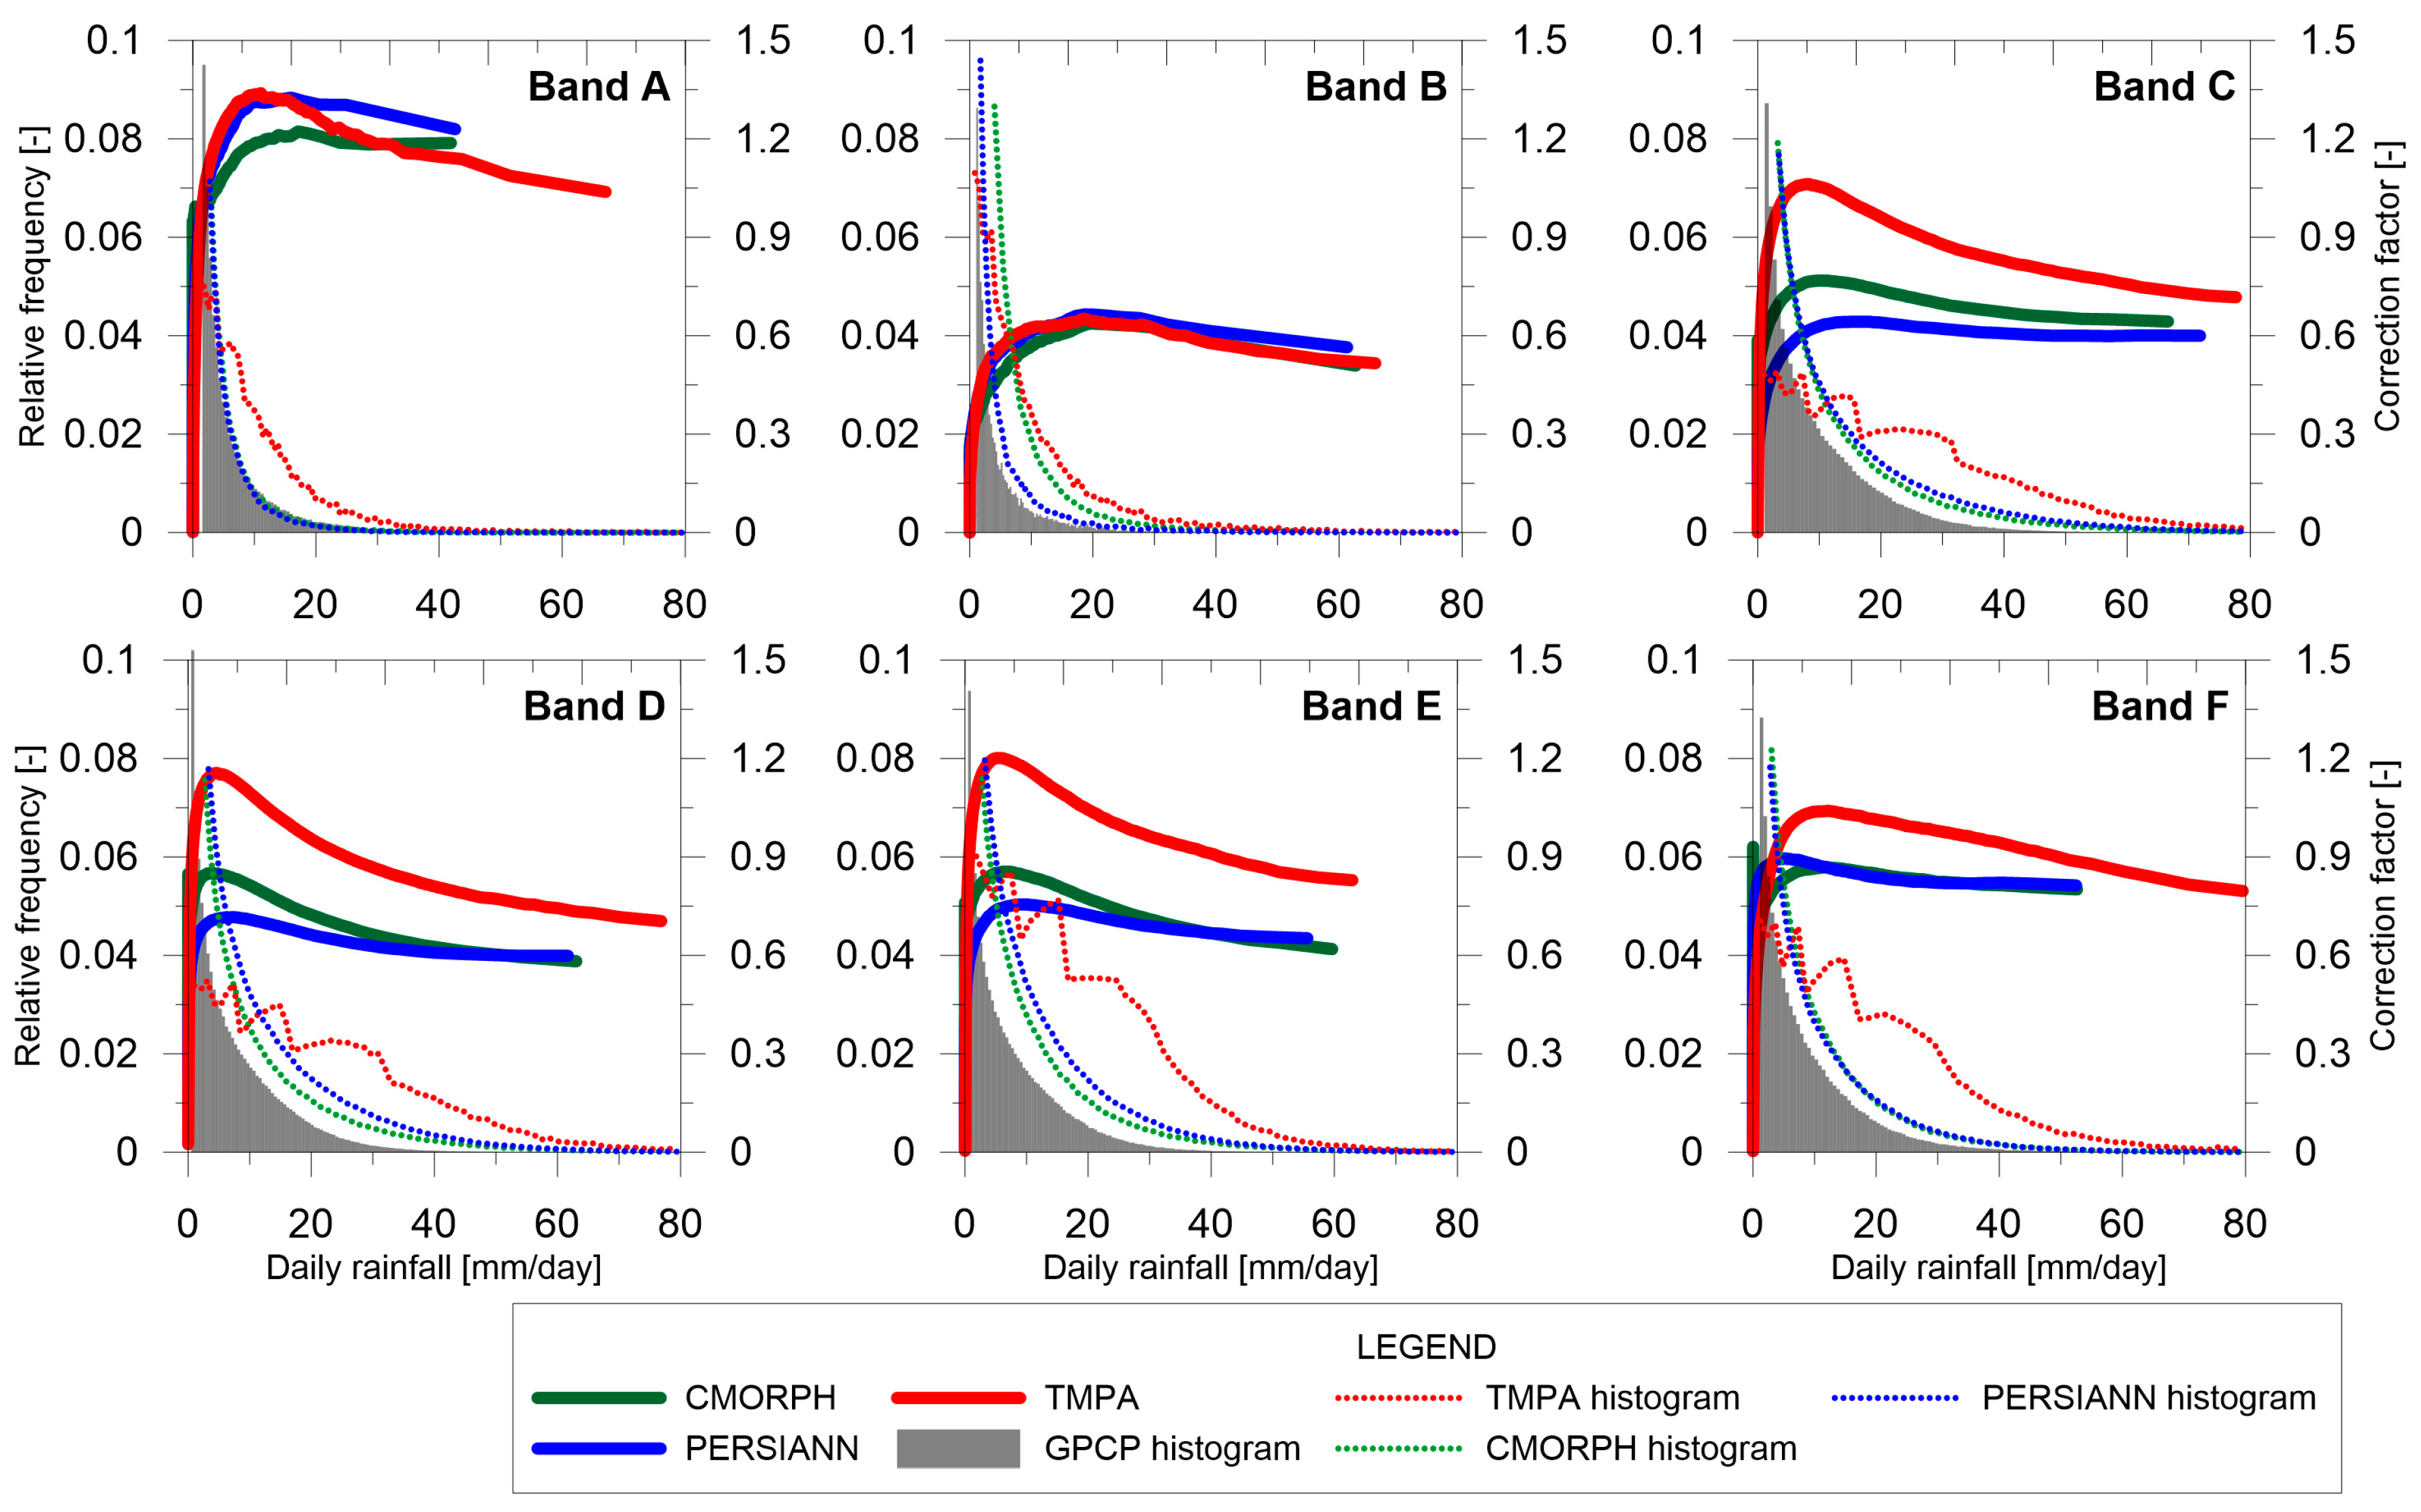
The average bias of daily rainfall estimates is shown for each of the three SPPs in
Figure 7 as a function of rainfall intensity, for each latitudinal band. The bias for a given rainfall intensity has been computed by averaging estimates from “hit” events in all the cells within the latitudinal band, before bias correction. The red histogram in the figures represents the relative frequency of errors within the band. The dependency of bias on rainfall intensity is different for the three products. Overall, the bias of CMORPH and PERSIANN is less dependent on rainfall intensity, with a slightly increasing bias with higher rain-rates. In bands C to E where it rains the most, CMORPH bias factors can range between 0.8 (+25% bias) and 0.6 (+66%), with an overall increasing bias. PERSIANN exhibits similar trends, but with slightly different shapes such as flatter line for most intensities, resulting in higher biases for lower intensities, and a slight increase in bias with increasing intensities (i.e., a decrease in bias factors). Because the Saharan Desert and North Africa is where all products perform the worst and hit events are fewer, the relationship is noisier than in the other bands but similarly shaped in the two products. TMPA estimates have a clear dependency on rainfall intensity. Bias factors have a clear peak between intensities of 5 and 10 mm/day, which in bands C, D, and E is around 1.2 (−16%). As intensities increase, the bias increases up to values of 33% and 66% (with bias factors decreasing to 0.75 and 0.6 respectively). In general, all SPPs have relatively similar biases for mid and high rain intensities, with TMPA showing lower biases at low rain intensities. All products overestimate high rain intensities, as found by others [
11].
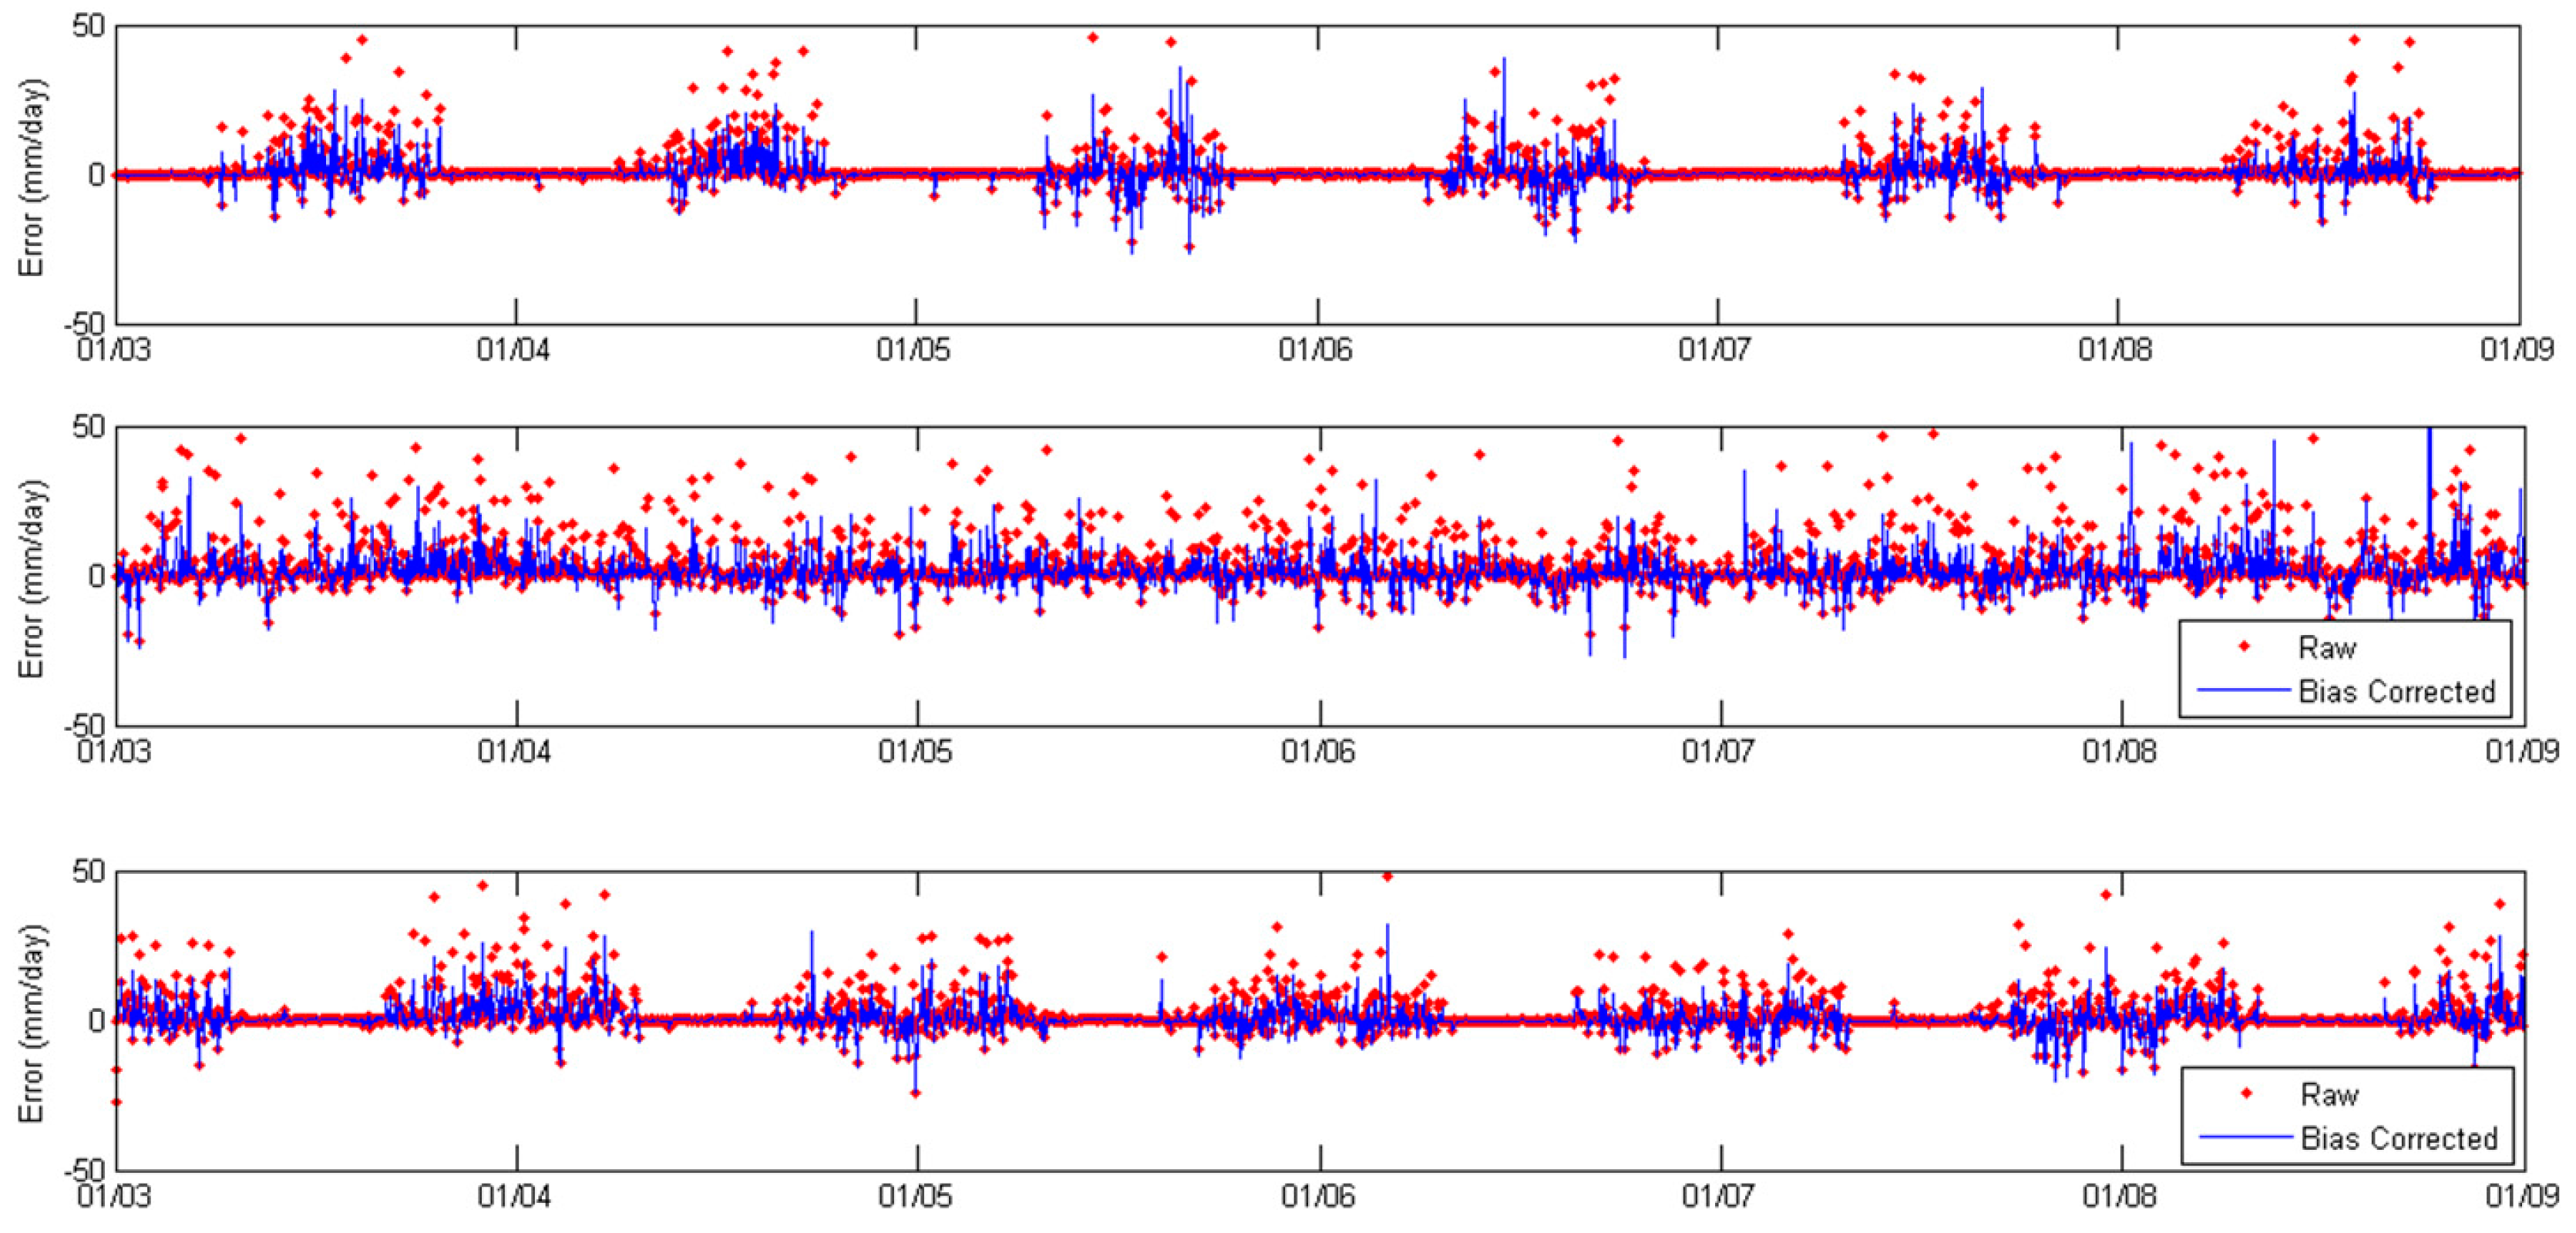
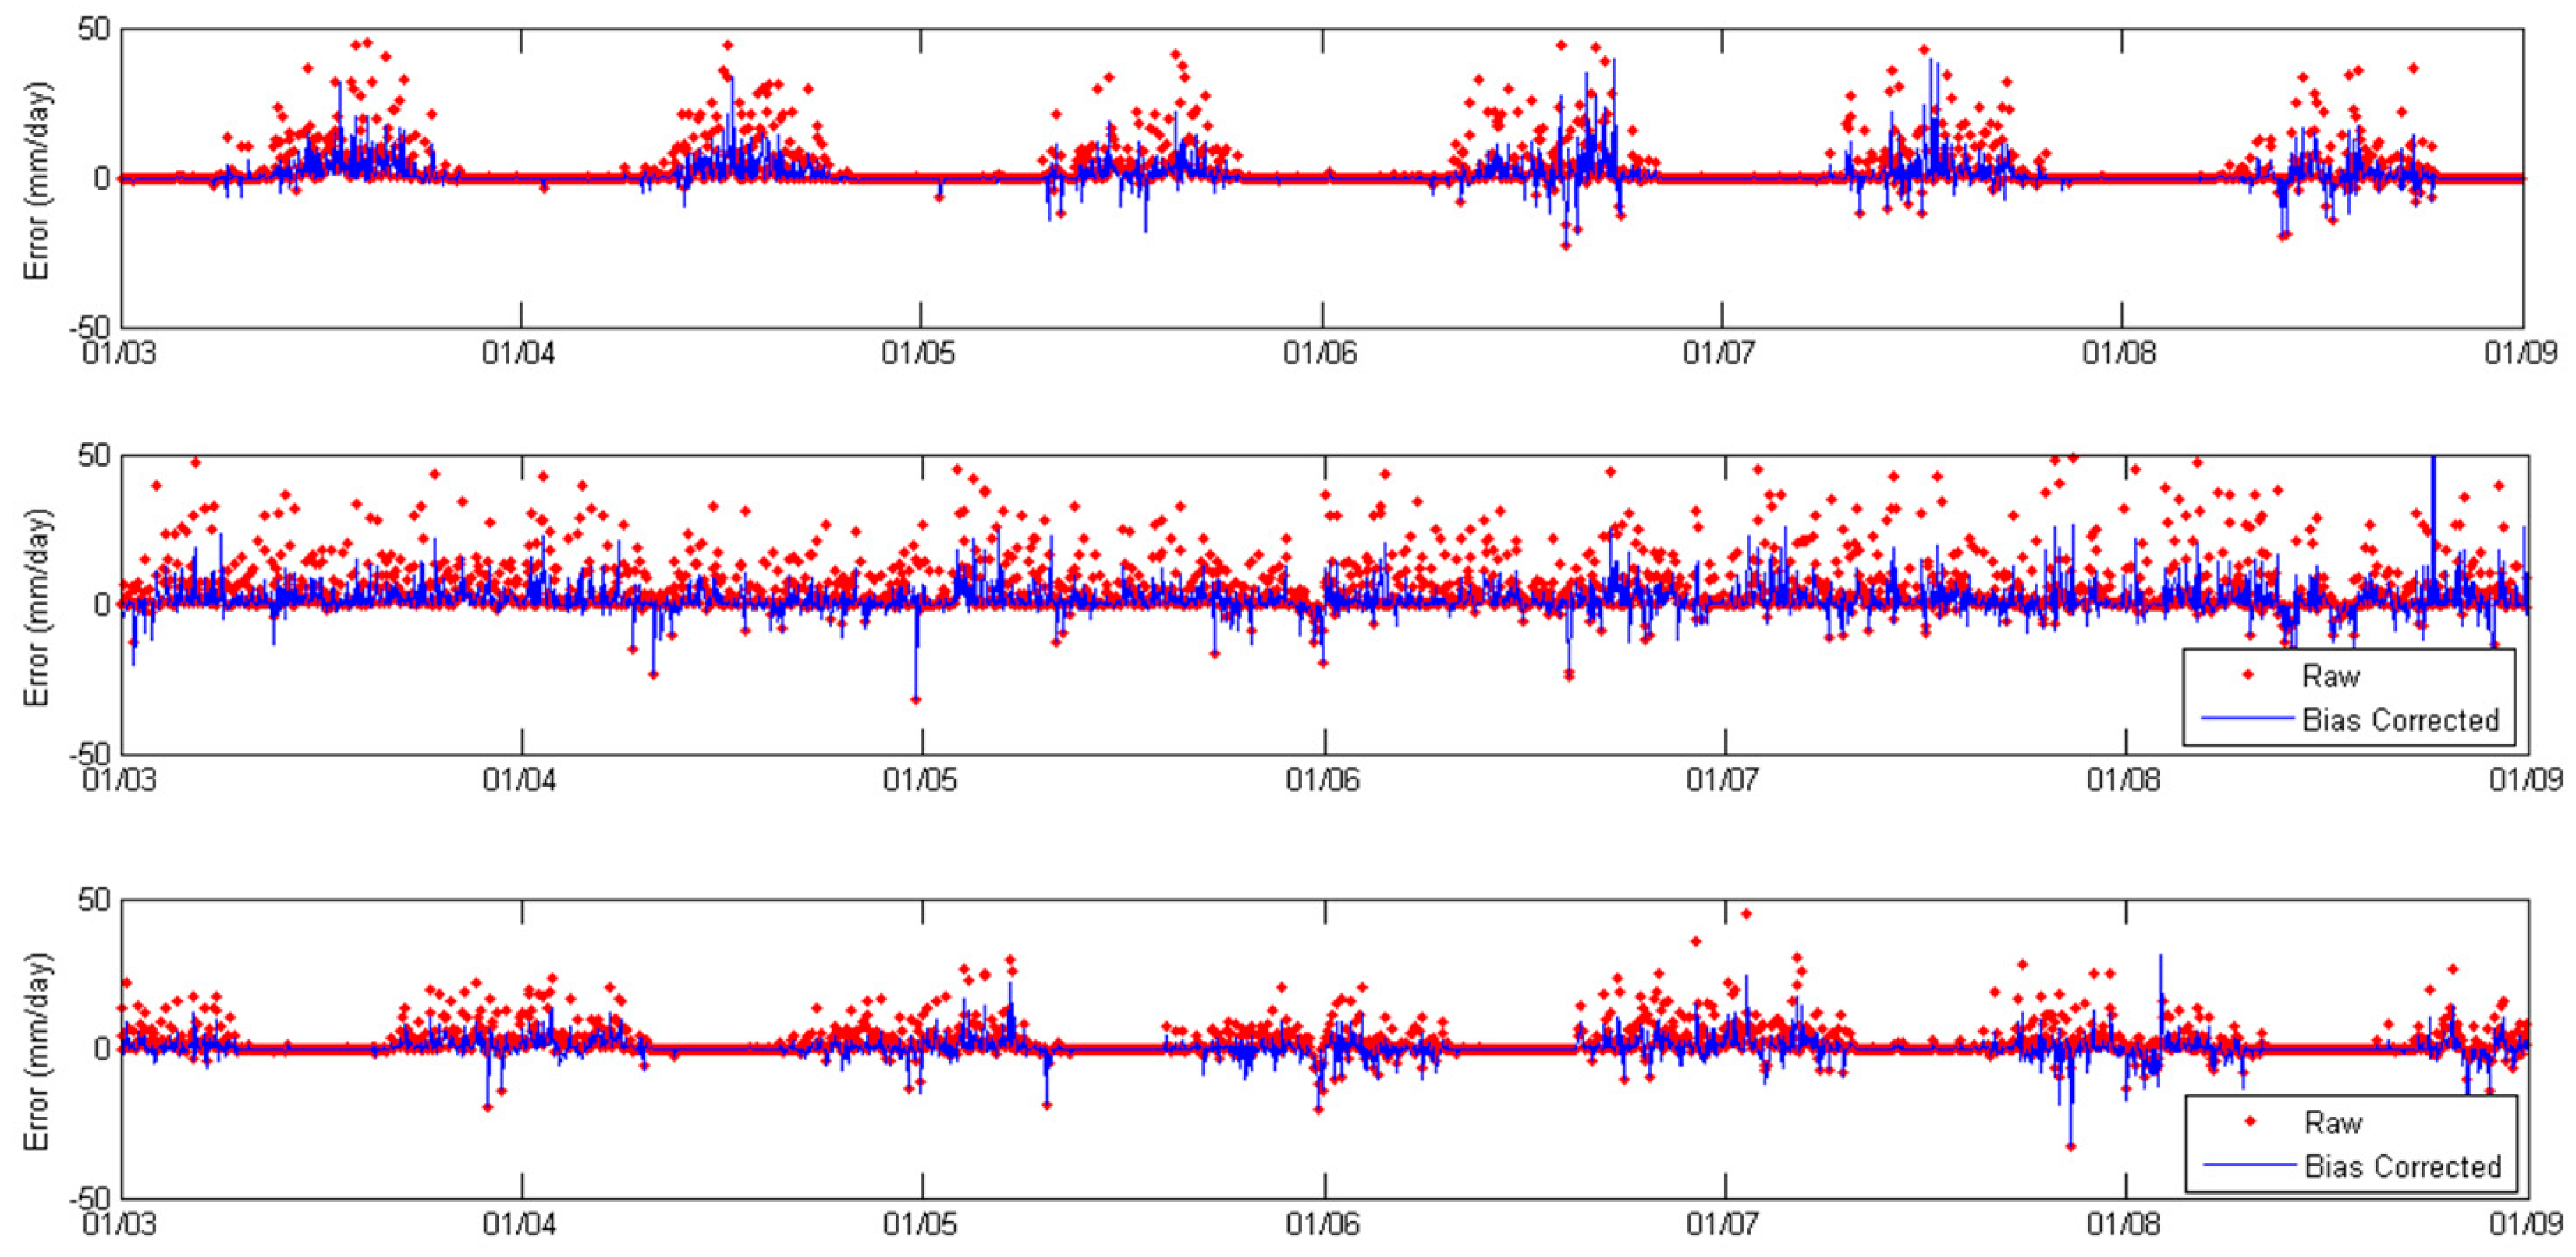
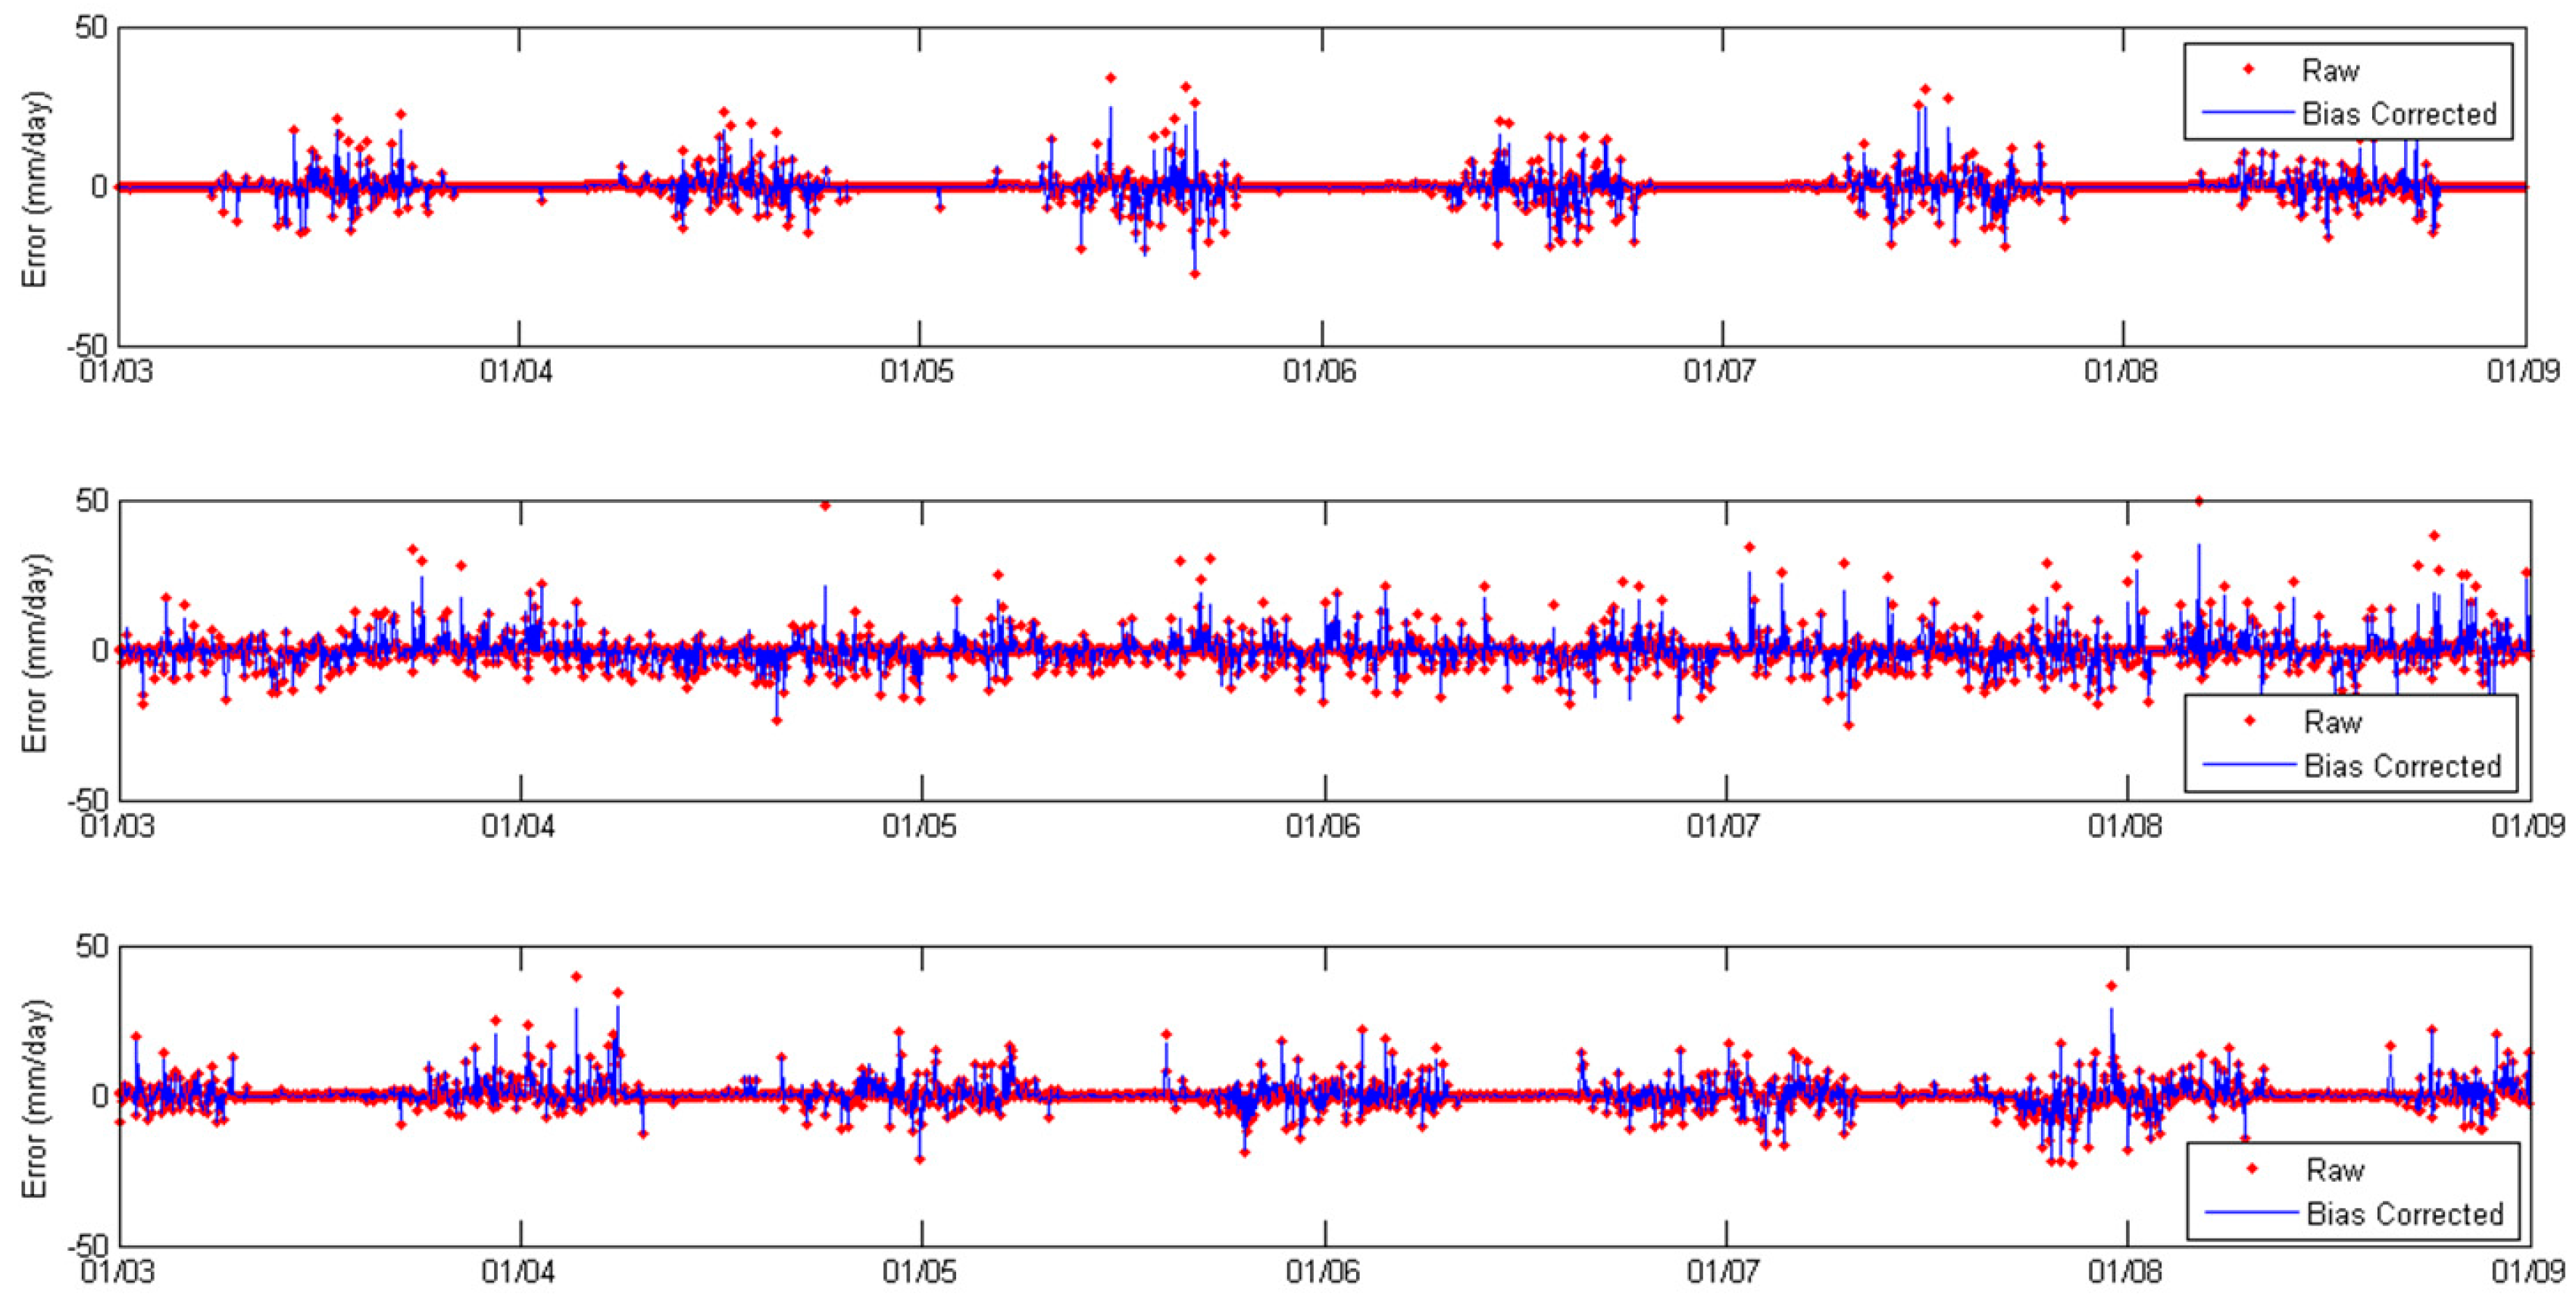
The effect of the bias correction at specific locations was also analyzed looking at time series of rainfall errors before and after the correction, in cells of each latitudinal band.
Figure 8,
Figure 9 and
Figure 10 display the time series of raw and bias corrected estimates in a representative cell within bands C (upper plot), D (middle) and E (lower), for each SPP. The errors show CMORPH and PERSIANN’s general tendency towards overestimation of rainfall, in the three bands. Coherent with TMPA’s varying biases depending on intensity,
Figure 10 shows both over and underestimation errors. The positive bias is more persistent in PERSIANN and the error is on the side of overestimation for the great majority of days. Because the variance is smaller, the final residual series follow closely the observed data and show slightly lesser errors than TMPA and CMORPH, for these three specific cells. After bias correction, the error distributions are symmetrical with zero mean.
Using the bias corrected estimates, the daily errors over each pixel were grouped for each season, SPP and analysis area (latitude bands, climatic zone, and topography type). The error distribution was symmetric with zero mean, and because of that, the absolute value of the error was taken. The Mann–Kendall tests for each product, latitudinal band and season, found positive trends between the magnitude of the errors after bias correction and the magnitude of the rainfall in all products, bands and seasons, except in one case (band C, JJA season, PERSIANN). The existence of the trend indicates that the magnitude of the errors vary with the magnitude of the rainfall, implying a non-constant variance and heteroscedasticity.
The absolute values of the rain-rate errors (considering “hits” only: when rain occurs and is detected by the SPP) after bias correction can be approximated by a Gamma distribution.
Table 7 shows the median rain-rate errors considering the “hit” cases only. Minimum values are marked in bold. While TMPA and CMORPH have shown better correlation coefficients, NSE, and MSE values than PERSIANN, it can be seen that the median error of PERSIANN is usually smaller than for the other two products. This can be explained by the fact that only “hit” events are used to compute the histogram of errors: days where rain occurred and the SPPs correctly detected it. This leaves out missed events, false alarms, and correct negatives. Thus, it can be stated that while it has higher detection errors as seen in the x-axis of
Figure 6, PERSIANN is shown here to be more accurate in the rain-rate estimation once it correctly detects rainfall.
4.5. On Product Averaging
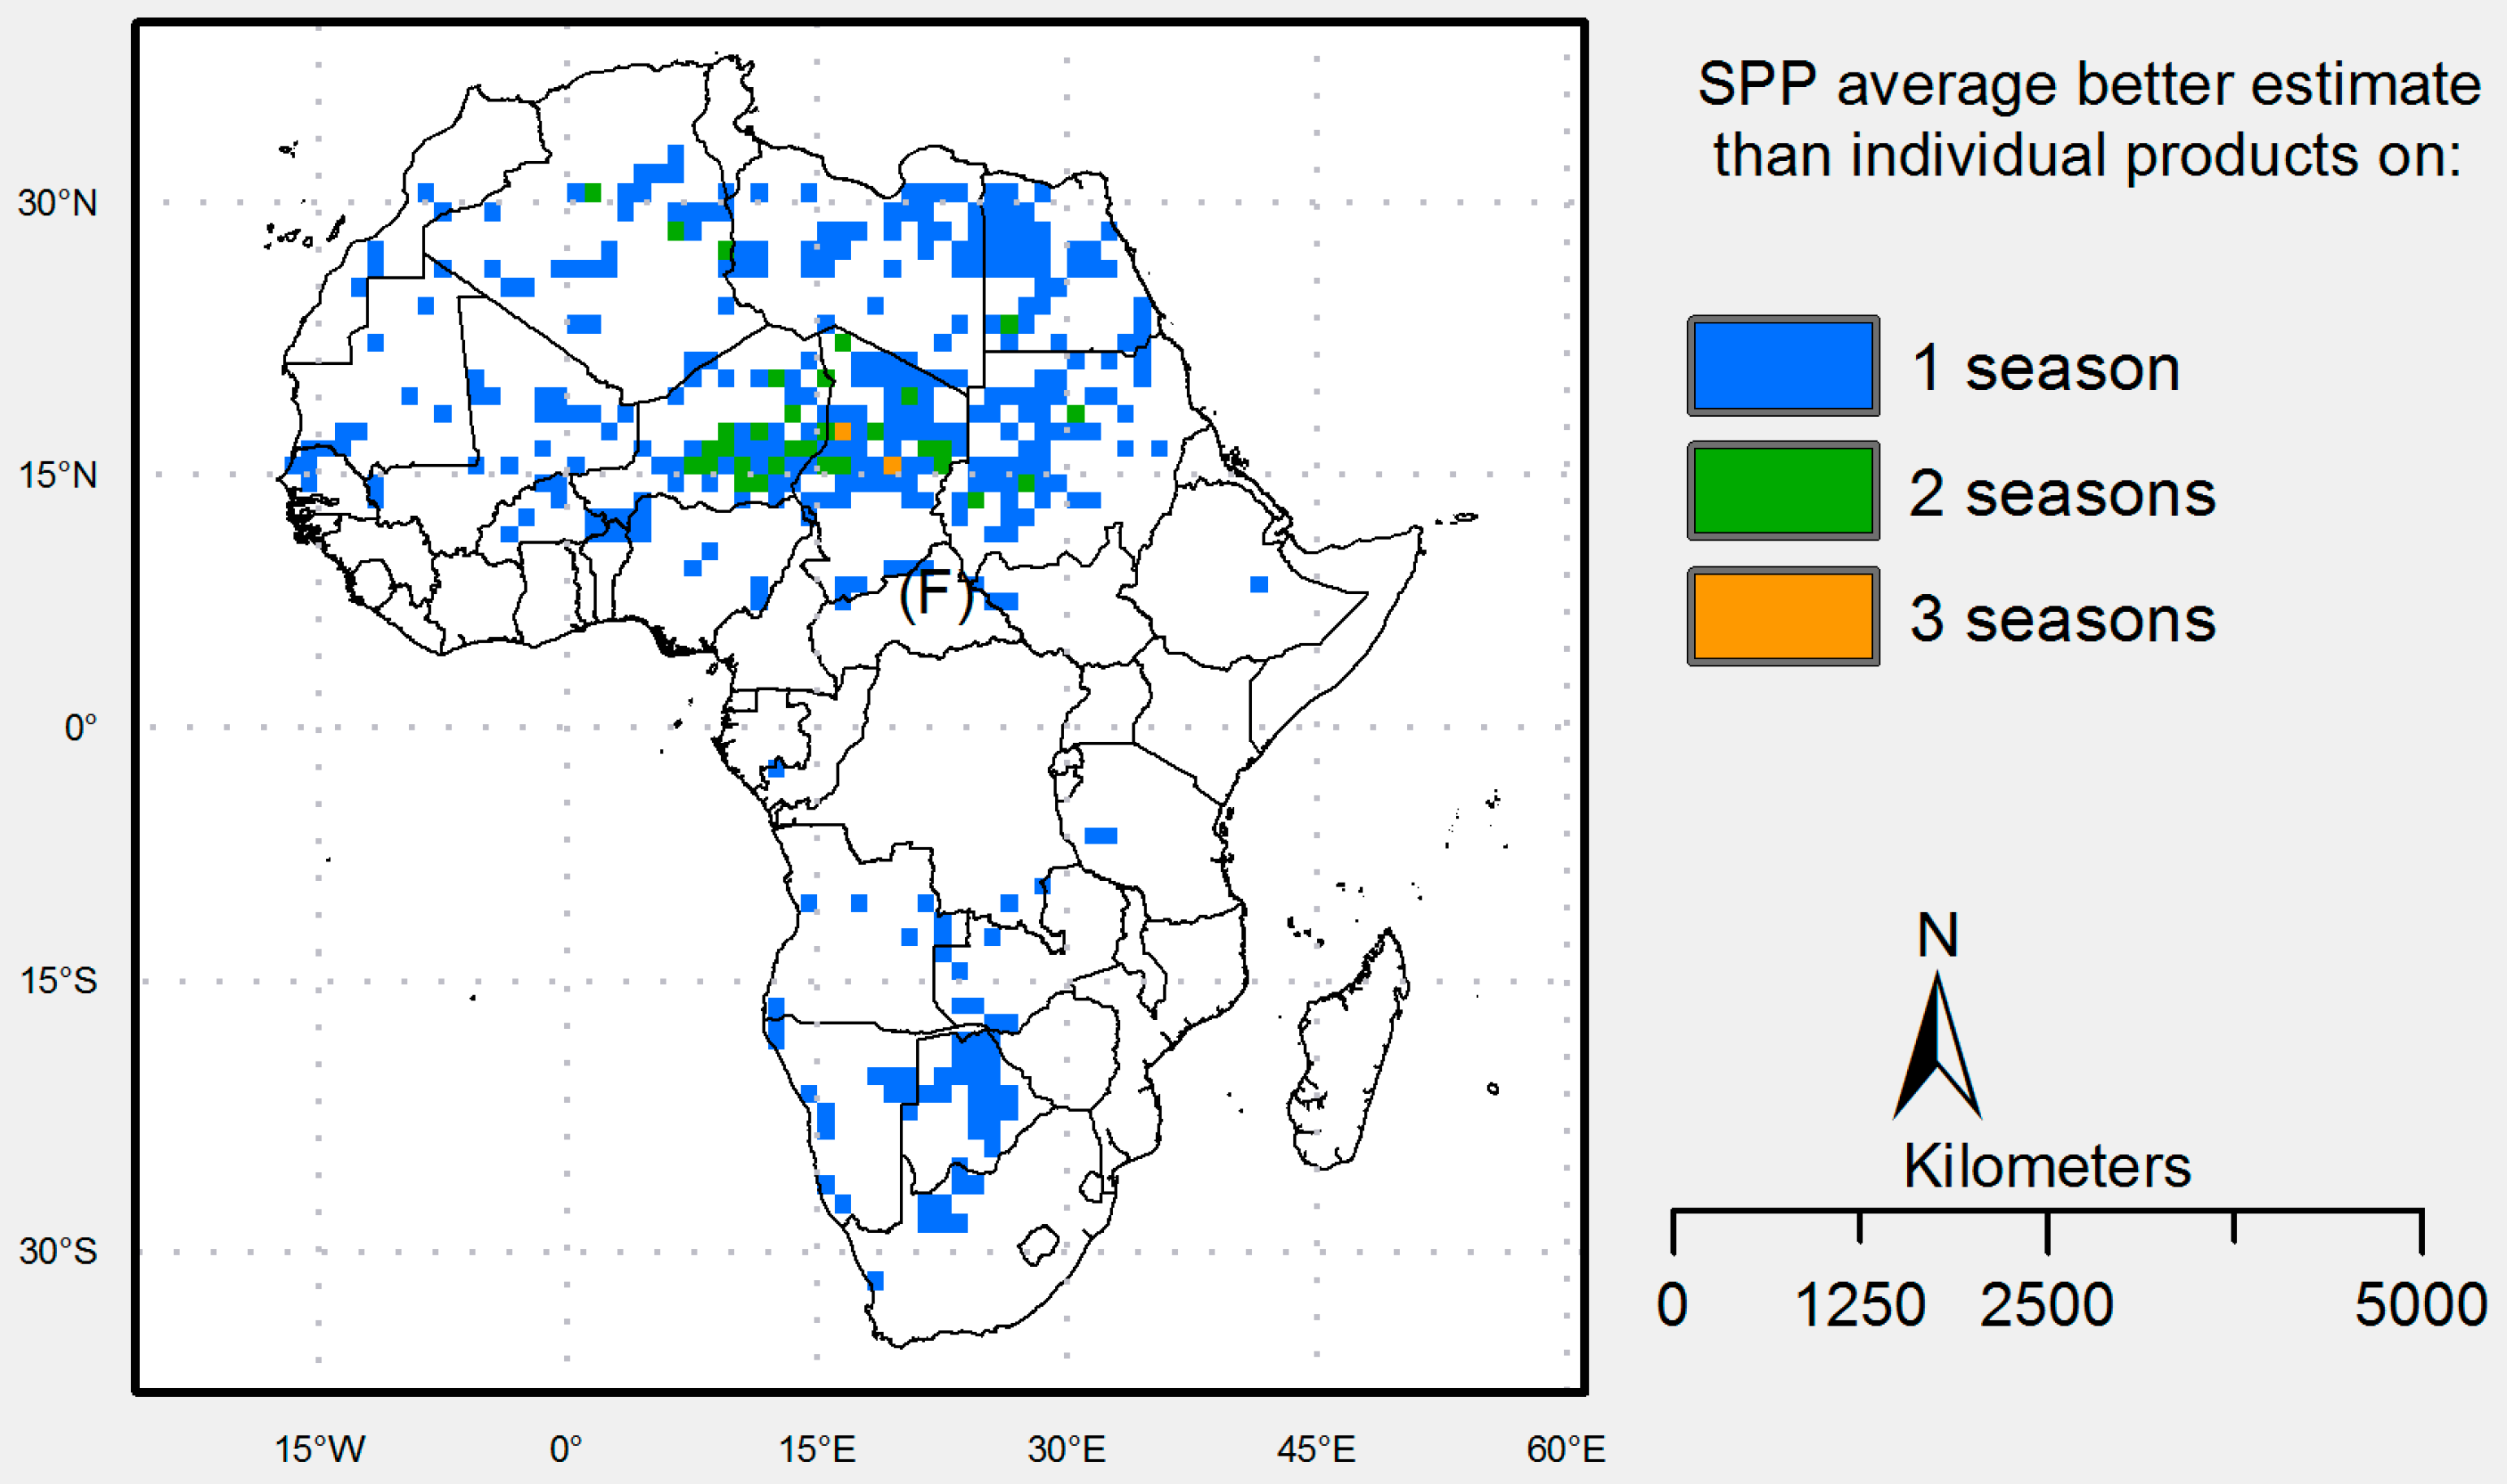
In order to determine if the average of several SPPs has more skill than the most skilled product, the condition from Winter and Nichka described in the Methods Section was computed for each pixel in the domain.
Figure 11 shows the few locations where averaging was found to perform better than the best individual product. The colors indicate the number of seasons in which this condition holds true. Product averaging shows promise on the Sahel region, especially over Egypt. In general, the satellite precipitation products used here are too similar to present the negative correspondence property that makes averages better than the individual products.
In a pragmatic and original approach to benefit hydrologic applications in un-gauged regions where SPPs are difficult to evaluate due to lack of reference datasets, Gebregiorgis and Hossain (2014) develop a regression error model between runoff error variance and satellite precipitation estimates that enables the weighting of satellite products to produce a merged rainfall product [
45]. The new estimate should yield improved runoff error variance and better performance in hydrologic applications. In regions with ground observations the parameters of the regression are calibrated minimizing the runoff error variance using the output of model simulations driven by ground rainfall as runoff observations. The parameters can then be extrapolated to un-gauged regions—based on climate and topography similarities—to calculate the runoff error variance, which in turn is then used in each cell to weight and merge different estimates. Of all products, the merged estimate showed the highest POD in all regions, a high FAR (but not highest), comparable threat score, and consistently lower RMSE, thus the approach effectively merges some products’ higher ability to detect rain of the less biased rain rate estimates of other products.
5. Conclusions
A daily error and bias correction analysis of three quasi-global satellite precipitation products across the African continent is presented here at a seasonal level for latitudinal bands, climatic regions and topography. Because of the main influence of the ITCZ, a rain-producing mechanism with an East–West alignment oscillating around the equator, and the East African Monsoon, latitudinal bands are found to capture well the changing nature of SPP errors across latitude and seasons. As widely established, satellite estimates do best in tropical and sub-tropical regions with convective precipitation regimes, both in detecting rain, as well as in terms of relative errors. Highlighting the strong dependency of rainfall errors on precipitation dynamics, the areas with smallest relative errors follow the position of the ITCZ across the seasons. The lowest performance for all products occurs over the Saharan Desert between 15°N and 30°N due to the difficulties in correctly detecting rain, as shown by low POD and high FAR values.
The bias correction analysis provides insights as to what error components can be reduced over what regions. The bias correction approach of adjusting rainfall distributions in each latitudinal band is very successful in removing the mean and variance error terms, but as expected does not correct the correlation error. While it significantly increases efficiency values over the continent below 15°N latitude, especially for CMORPH and PERSIANN, it has no effect on errors over the Saharan Desert to the North, as these arise from difficulties in detecting rainfall. The bias correction in areas delimited through the climatic and topographic classification did not yield good results due to the fact that such delimitations did not successfully isolate rainfall regimes. Individual case studies have better characterize errors in complex terrain.
Bias of TMPA estimates in each latitudinal band showed a higher dependency on rainfall intensity, going from negative values for lower intensities (<20 mm/day) to positive bias for higher intensities (>20 mm/day) in the tropical and subtropical latitudinal bands. CMORPH and PERSIANN were found to consistently overestimate rainfall but showed little dependency on rainfall rate, suggesting that a simple average bias correction may yield similar results as a pdf matching approach.
While TMPA and CMORPH have better correlations, NSE and MSE values, PERSIANN has generally the smallest rain-rate errors when only hits are considered, suggesting it is better at estimating the magnitude of the rainfall, but worse at correctly detecting precipitation events. While product averaging shows promise in some areas of the Saharan Region and Egypt, the products generally do not have the condition of a negative error correspondence for product averaging to work across the continent.
The reference dataset used in this study assimilates historical TRMM data, thus having a conflict of interest with TMPA, which is perhaps the reason for the higher NSE of TMPA raw estimates. However, interesting results such as the high bias dependency of TMPA on rainfall rates, and the lower median error of PERSIANN’s hits, as well as the higher NSE of PERSIANN after bias correction, suggest this conflict is not a major one. Since this study was completed, higher resolution reference datasets such as CHIRPS (5 km) have become available for use, with the caveat of that CHIRPS was developed for drought monitoring thus adjusted to match pentads and dekads, and not daily rainfall.
The error characterization of three SPPs over the African Continent, in relationship to latitude, topography, climate and season, allows for a better understanding of the relationships between the main climatic mechanisms controlling rainfall in Africa, such as the ITCZ; as well as the effects of bias correction approaches. Real-time SPPs constitute the best available tool to monitor spatial and temporal rainfall dynamics in poorly gauged basins and across Africa. Bias correction of real-time estimates is an essential step to improve their value and usability, and should be included in any application or research effort. A bias correction procedure that adjusts probability distributions of SPP to those of a reference dataset will take into account the biases of different sign and magnitude present for different rainfall intensities. The differences between SPPs are greatly reduced after bias correction, making them more consistent and usable for hydrologic monitoring applications at their current resolutions. Streamflow prediction for water allocation and reservoir operations in medium to large poorly-gauged basins, can greatly benefit from bias corrected real-time SPPs. While the existence of multiple SPPs is beneficial to the scientific community, their combined use can be advantageous for hydrologic applications such as the above. We hope the results presented here will continue to inform hydrologic applications of SPPs in Africa.


