Article

Correlation and Semantic Prior-Guided Multi-Scale Cross-Modal Interaction Network for SAR-OPT Image Fusion

1
School of Electronic Engineering, Naval University of Engineering, Wuhan 430033, China
2
School of Artificial Intelligence and Robotics, Hunan University, Changsha 410082, China
*
Author to whom correspondence should be addressed.
These authors contributed equally to this work.
Remote Sens. 2026, 18(7), 975; https://doi.org/10.3390/rs18070975
Submission received: 21 January 2026 / Revised: 7 March 2026 / Accepted: 21 March 2026 / Published: 24 March 2026

Highlights

What are the main findings?
  • A correlation and semantic prior-guided multi-scale cross-modal interaction network, termed CSP-MCIN, is proposed to accurately align and aggregate complementary features from SAR and optical images. CSP-MCIN consists of two modality-specific encoders based on ResNet-18 and a multi-scale interactive decoder integrating cross-modal Transformers and multi-modal gated fusion units.
  • A novel loss function combining a pixel-domain correlation loss and a CLIP-guided semantic consistency loss is constructed to enhance the representation of source-modal information in the fused results. Furthermore, a PCGrad-based optimization strategy is introduced to effectively mitigate modality bias and enable balanced learning across multiple modality-specific loss objectives.
What are the implications of the main findings?
  • Experimental results on public datasets demonstrate that CSP-MCIN outperforms state-of-the-art methods in terms of both fusion performance and computational efficiency. Accordingly, CSP-MCIN can provide more reliable fusion representations for downstream remote sensing image interpretation tasks.
  • Corresponding ablation studies verify the effectiveness of the cross-modal Transformers and gated fusion units in aligning and fusing low-level details and high-level semantic features. Moreover, within the PCGrad-based multi-objective optimization scheme, incorporating pixel-domain correlations and CLIP-derived semantic priors enhances detail fidelity and semantic consistency between the fused results and the source modalities. The proposed network architecture and loss function design provide new insights and guidance for future research on multi-modal image fusion methods.

Abstract

Syntheticaperture radar (SAR) and optical (OPT) image fusion aims to leverage their complementary information to obtain a more comprehensive representation of ground objects. However, significant discrepancies exist between the two modalities in terms of imaging mechanisms and feature distributions. Consequently, existing multi-modal image fusion methods struggle to achieve robust cross-modal feature alignment and deep semantic consistency between the fused results and the source modalities. To address the above challenges, this paper proposes a correlation and semantic prior-guided multi-scale cross-modal interaction network (CSP-MCIN) for effective SAR-OPT image fusion. Specifically, CSP-MCIN first employs two modality-specific encoders based on ResNet-18 to extract low-level details and high-level semantic features from SAR and OPT images, respectively. Subsequently, a multi-scale interactive decoder integrating cross-modal Transformers and gated fusion units is constructed to align and aggregate semantic and detail information from both encoders. Finally, to strengthen source-modality representations, a novel loss function combining a pixel-domain correlation loss and a CLIP-guided semantic consistency loss is designed and optimized under a PCGrad-based multi-objective optimization scheme. Experimental results on public SAR-OPT image datasets demonstrate that the proposed CSP-MCIN achieves superior fusion performance and computational efficiency compared with state-of-the-art approaches.

1. Introduction

With the rapid development of aerospace and Earth observation technologies, multi-modal image fusion [1] has emerged as a key research direction in remote sensing. As two representative heterogeneous remote sensing modalities, synthetic aperture radar (SAR) and optical (OPT) images have become a central focus of current multi-modal image fusion research due to their complementary imaging properties. SAR images, based on active microwave imaging, allow all-weather, day-and-night observation and are insensitive to clouds, rain, snow, and complex illumination conditions. However, SAR images inherently suffer from severe speckle noise, complex texture structures, and high interpretation difficulty. In contrast, OPT images, relying on passive OPT imaging, provide rich spectral and visual information, but are highly susceptible to weather and lighting variations. SAR-OPT image fusion effectively overcomes the inherent limitations of single-modality data. It aims to preserve the fine-grained details and deep semantic information of OPT imagery while leveraging the structural stability and environmental robustness of SAR data. Such complementary fusion produces more informative and discriminative composite images, which help improve the performance and reliability of remote sensing tasks such as land cover classification [2,3], target recognition [4], and change detection [5].
Existing multi-modal image fusion methods can be broadly categorized into traditional approaches and deep learning-based approaches. Traditional fusion methods typically perform feature representation and information decomposition of multi-modal source images in the spatial or transform domains, followed by information recombination through manually designed fusion rules. Their core idea is to exploit the complementary characteristics of different modalities in terms of local activity levels, salient features, or structural components. According to differences in feature representation and fusion mechanisms, existing traditional methods can be roughly divided into component substitution-based methods, multi-scale decomposition-based methods, hybrid methods, and model-based approaches [6]. These methods have clear structures and strong interpretability, and can achieve stable fusion results in simple scenarios and tasks. However, their fusion rules and parameter settings heavily rely on handcrafted designs, often resulting in poor adaptability and generalization ability in fusion tasks with large modal discrepancies. In recent years, the rapid evolution of artificial intelligence has propelled deep learning-based multi-modal image fusion into a primary research focus within the remote sensing community. Compared to traditional algorithms, these methods automatically learn richer cross-modal feature representations in a data-driven manner, thereby alleviating the reliance on handcrafted feature design and empirical fusion rules. Typical deep learning-based image fusion frameworks mainly include auto-encoders (AEs), convolutional neural networks (CNNs), and generative adversarial networks (GANs) [7]. To further improve the quality and semantic richness of the fusion results, recent studies have introduced emerging techniques such as Transformers [8,9], diffusion models [10,11], and vision–language foundation models (VLFMs) [1,12], enabling fusion models to achieve superior performance in global modeling and deep semantic alignment. However, when these advanced methods are directly applied to the fusion of heterogeneous data with vastly different physical properties, such as SAR and OPT imagery, significant challenges remain regarding semantic alignment and modality bias. First, SAR and OPT images exhibit intrinsic discrepancies in imaging mechanisms, noise distributions, and spatial geometric expressions. Nevertheless, most existing approaches still focus on utilizing heuristic loss functions to constrain fusion performance at the pixel level and low-level textural dimensions. Such strategies neglect the explicit modeling of cross-modal semantic mapping relationships, making it difficult for models to establish robust feature alignment and high-level semantic consistency between the source images and the fusion results. Second, current fusion frameworks often employ static weighted loss optimization strategies, which are prone to introducing modality bias [13]. This bias causes the network to overfit the modality with richer information content, thereby implicitly suppressing the extraction of critical complementary information from the other modality. Consequently, considering the unique modal attributes of SAR and OPT images, it is imperative to construct a novel fusion framework capable of effectively aligning heterogeneous remote sensing features, guiding high-level semantic consistency, and mitigating modality bias.
To this end, this paper proposes a correlation and semantic prior-guided multi-scale cross-modal interaction network (CSP-MCIN) for effective SAR-OPT image fusion. Specifically, CSP-MCIN first employs dual ResNet-18-based modality-specific encoders (MEs) to extract both shallow details and deep semantic features from the input modalities. Then, a multi-scale interaction decoder (MID) is constructed to fully align and fuse the multi-level information extracted by the MEs and generate the desired fused image. The MID primarily comprises a series of high-level semantic fusion modules (HSFMs) and a low-level detail fusion module (LDFM). Each HSFM employs a cross-modal Transformer to enhance the global semantic features from different modalities and incorporates a gated fusion unit (GFU) for adaptive cross-modal feature alignment and integration. The LDFM further applies two GFUs to supplement the fused semantic features with low-level structural and textural details. Finally, to enhance the preservation of source modality cues, a novel loss function composed of a pixel-domain correlation loss and a CLIP-guided semantic consistency loss is designed. This objective is optimized via a PCGrad-based strategy to mitigate modality bias and ensure balanced cross-modal learning. Experimental results on public SAR-OPT image datasets demonstrate that the proposed CSP-MCIN achieves superior fusion performance and computational efficiency compared with current state-of-the-art (SOTA) approaches.
In summary, the main contributions of this work can be summarized as follows:
  • A SAR-OPT image fusion network, termed CSP-MCIN, is proposed for generating fused images with enhanced cross-modal complementary features.
  • A feature fusion decoder, named MID, is designed based on cross-modal Transformers and GFUs to align and aggregate high-level semantic and low-level detail features from different modal images.
  • A novel loss function, composed of a pixel-domain correlation loss and a CLIP-guided semantic consistency loss, is developed to enhance the representation of source modalities. Furthermore, to alleviate the effect of modality bias during training, a PCGrad-based multi-objective optimization strategy is incorporated into the loss function.
  • Extensive experimental results on public SAR-OPT image datasets demonstrate the effectiveness and high computational efficiency of the proposed method.
The remainder of this paper is organized as follows. Section 2 provides a brief review of research progress in the field of multi-modal image fusion. Section 3 presents the proposed CSP-MCIN network and its loss function. Section 4 provides a detailed presentation and analysis of the experimental results. Section 5 discusses the experimental results in depth and explores potential directions for future improvements. Section 6 summarizes the entire work.

2. Related Works

In this section, we review representative traditional methods and deep learning-based approaches for multi-modal image fusion, and provide a corresponding summary and analysis.

2.1. Traditional Methods

Traditional image fusion methods are generally categorized into component substitution (CS), multi-scale decomposition (MSD), hybrid approaches, and model-based methods [6]. CS-based methods, such as principal component analysis (PCA) [14], intensity-hue-saturation (IHS) [15], and Gram–Schmidt (GS) [16], transform images into a specific space to replace components of one modality with another. Although simple to implement, they often suffer from spectral distortion and structural artifacts when applied to SAR-OPT image pairs with large feature discrepancies. MSD-based methods, including Laplacian pyramid (LP) [17], discrete wavelet transform (DWT) [18], and non-subsampled contourlet transform (NSCT) [19], decompose images into multiple scales for fusion and reconstruction. These techniques alleviate color and structural distortion but incur high computational complexity. Hybrid methods combine CS and MSD to leverage multiple representation levels, such as PCA-DWT [20] and IHS-NSCT [21]. While these approaches enhance spatial details, they struggle with the severe speckle noise inherent in SAR images. Model-based methods, including variational models [22] and sparse representation (SR) [23], formulate fusion as a mathematical optimization problem. Despite their ability to integrate multi-modal features via energy minimization or dictionary learning, these methods rely heavily on handcrafted priors. Consequently, they often fail to balance noise suppression and detail preservation in SAR-OPT image fusion and are sensitive to parameter settings.

2.2. Deep Learning-Based Methods

Compared with traditional image fusion methods, deep learning-based approaches can automatically learn effective discriminative features from data, thereby strengthening the representation of source modalities in the fusion results. Existing methods are primarily categorized based on their architectures into AE-based, CNN-based, and GAN-based frameworks [7].
AE-based methods utilize a pre-trained encoder–decoder structure. The encoder extracts general features, which are then integrated via manually designed or learnable fusion rules before being reconstructed by the decoder. For example, Li et al. [24] proposed a pioneering AE-based method and investigated the effects of direct addition and 1 -regularized fusion strategies for visible and infrared image fusion. To achieve learnable feature fusion, Li et al. [25,26] further designed feature fusion modules based on attention mechanisms and residual networks, respectively. Xu et al. [27] proposed a learnable fusion rule with interpretability, which employs a classifier to quantify the importance of each pixel. To enhance the spatial structure and texture details of the fused results, Ye et al. [28] proposed structure and texture losses based on cartoon-texture decomposition. Liu et al. [29] designed a coarse-to-fine feature extractor through dilated convolutions and introduced an edge-guided attention mechanism. Furthermore, Cheng et al. [30] introduced an information probe to decompose the initial fused result, and then leverages the source-modality images to selectively enhance the decomposed degraded components. However, AE-based methods often struggle to model explicit complementary relationships and suffer from low training efficiency due to staged training strategies.
CNN-based methods achieve end-to-end feature extraction and image reconstruction by designing appropriate network architectures and loss functions. For example, Liu et al. [31] combined CNNs with LP and used a Siamese network to learn the fusion weights of decomposition coefficients from multi-modal medical images. Based on the α -matte defocus model and the training data generated from it, Ma et al. [32] proposed a cascaded boundary-aware CNN for multi-focus image fusion. Moreover, Xu et al. [33] integrated adaptive similarity measurement with continual learning and proposed a unified multi-modal image fusion framework, termed U2Fusion. To enhance the deep semantics of the fused images, Tang et al. [34] achieved joint training of the fusion network and the semantic segmentation network. Considering the effects of varying illumination conditions, they [35] further constructed an illumination-aware loss to guide the network in recovering the brightness distribution and texture information of salient targets. In addition, Duan et al. [36] presented a multi-scale feature pyramid network to achieve cloud removal in SAR-OPT image fusion. Zhao et al. [37] argued that handcrafted empirical loss functions cannot effectively promote the network to fully learn the important features from different modalities. Therefore, they proposed a cross-reconstruction learning framework, termed FreeFusion, to simultaneously support cross-modal image translation and fusion segmentation. While CNNs have achieved remarkable success, their restricted receptive fields pose a major bottleneck in capturing global scene representations. Consequently, high-level semantic alignment remains insufficient within the complex and heterogeneous feature spaces of SAR and OPT images.
GAN-based methods employ an adversarial game between a generator and a discriminator to produce realistic results. With the rapid development of GANs, many of their variants have been applied to multi-modal image fusion tasks. For instance, Ma et al. [38] were the first to introduce GANs into visible-infrared image fusion and proposed the FusionGAN model. However, a single discriminator tends to cause the fused images to be biased toward one of the source images, resulting in the loss of information from the other source. To address this issue, they [39,40] subsequently proposed the DDcGAN and GANMcC models. DDcGAN employs two discriminators to equally distinguish the differences between the fused result and the two input sources, while GANMcC adopts a multi-classifier as the discriminator to estimate the probabilities that the generated image belongs to the visible and infrared modalities. Inspired by U2Fusion [33], Le et al. [41] proposed a novel GAN model with continual learning capability for various image fusion tasks. Considering the severe speckle noise in SAR images, Kong et al. [42] presented a SAR-OPT image fusion method combining GANs with GS transform. In addition, to encourage the generator to better learn the unique and complementary features of different modalities, Sui et al. [7] established cross-modal interactive detail and content enhancement branches based on cross-attention. However, although GANs generate visually appealing images, they often face training instability and mode collapse. Moreover, their focus on visual realism often comes at the expense of structural and semantic consistency of the fused images.
In recent years, several new paradigms for image fusion have also emerged. For example, SwinFusion [8] and TUFusion [9] utilize hybrid CNN–Transformer architectures to jointly capture global context and local details. OmniFuse [11] and DRMF [10] leverage diffusion models to mitigate complex degradation issues present in source images. Furthermore, FILM [12] and MTG-Fusion [1] employ text descriptions generated by VLFMs to guide the fusion of critical semantic features in multi-modal images. Despite these advancements, SAR-OPT image fusion still faces two fundamental challenges. First, existing methods often rely on heuristic loss functions to constrain the fusion process solely within pixel-level details and low-level textures, overlooking the explicit modeling of cross-modal semantic alignment. Second, current fusion frameworks often adopt static weighted loss optimization strategies, which significantly increases the susceptibility to modality bias [13].
To tackle these issues, a novel multi-modal image fusion framework termed CSP-MCIN is proposed in this paper. It achieves effective aggregation of low-level details and high-level semantic features from SAR and OPT images through a coarse-to-fine feature alignment and interaction strategy. Notably, the cross-modal feature calibration and fusion network (CFCFNet) proposed by Ding et al. [43] exhibits a construction logic similar to our work in terms of network architecture. Specifically, CFCFNet employs a cross-modal feature calibration (CMFC) module and a convolutional attention-based dynamic fusion (CADF) module to facilitate cross-modal feature interaction and fusion. However, the CMFC module directly concatenates dual-modal features for self-attention, which lacks explicit semantic alignment and potentially leads to the suppression of weaker modal information. Similarly, the CADF module calculates fusion weights from the simple addition of SAR and OPT features, which masks cross-modal conflicts and prevents the network from perceiving modal disparities. Motivated by these observations, we develop a cross-modal Transformer and a GFU, aiming to achieve more discriminative cross-modal interaction learning and more efficient modality-adaptive fusion.

3. Proposed Method

In this section, the proposed CSP-MCIN is described in detail. First, the overall network structure is elaborated. Then, its key components are introduced sequentially. Finally, the design details of the loss function and the corresponding multi-objective optimization strategy are presented.

3.1. Network Architecture Overview

Let X s a r R C s × H × W and X o p t R C o × H × W denote the coregistered SAR and OPT images, respectively, where C s and C o represent the number of channels, and H and W denote the height and width of the images. Here, coregistration (detailed image coregistration processes, which address geometric distortions such as rotations, translations, and the presence of outliers, are beyond the primary scope of this paper. For comprehensive reviews and specific methods regarding SAR-OPT registration, readers may refer to [44,45]) implies that the SAR and OPT images have been spatially aligned to the same geographic area through advanced multi-modal registration techniques. Based on this premise, the proposed CSP-MCIN aims to learn the following mapping process:
Y ^ = f θ X s a r , X o p t ,
where Y ^ R C o × H × W indicates the desired fused image, which inherits the spatial details and semantic information from both source modalities.
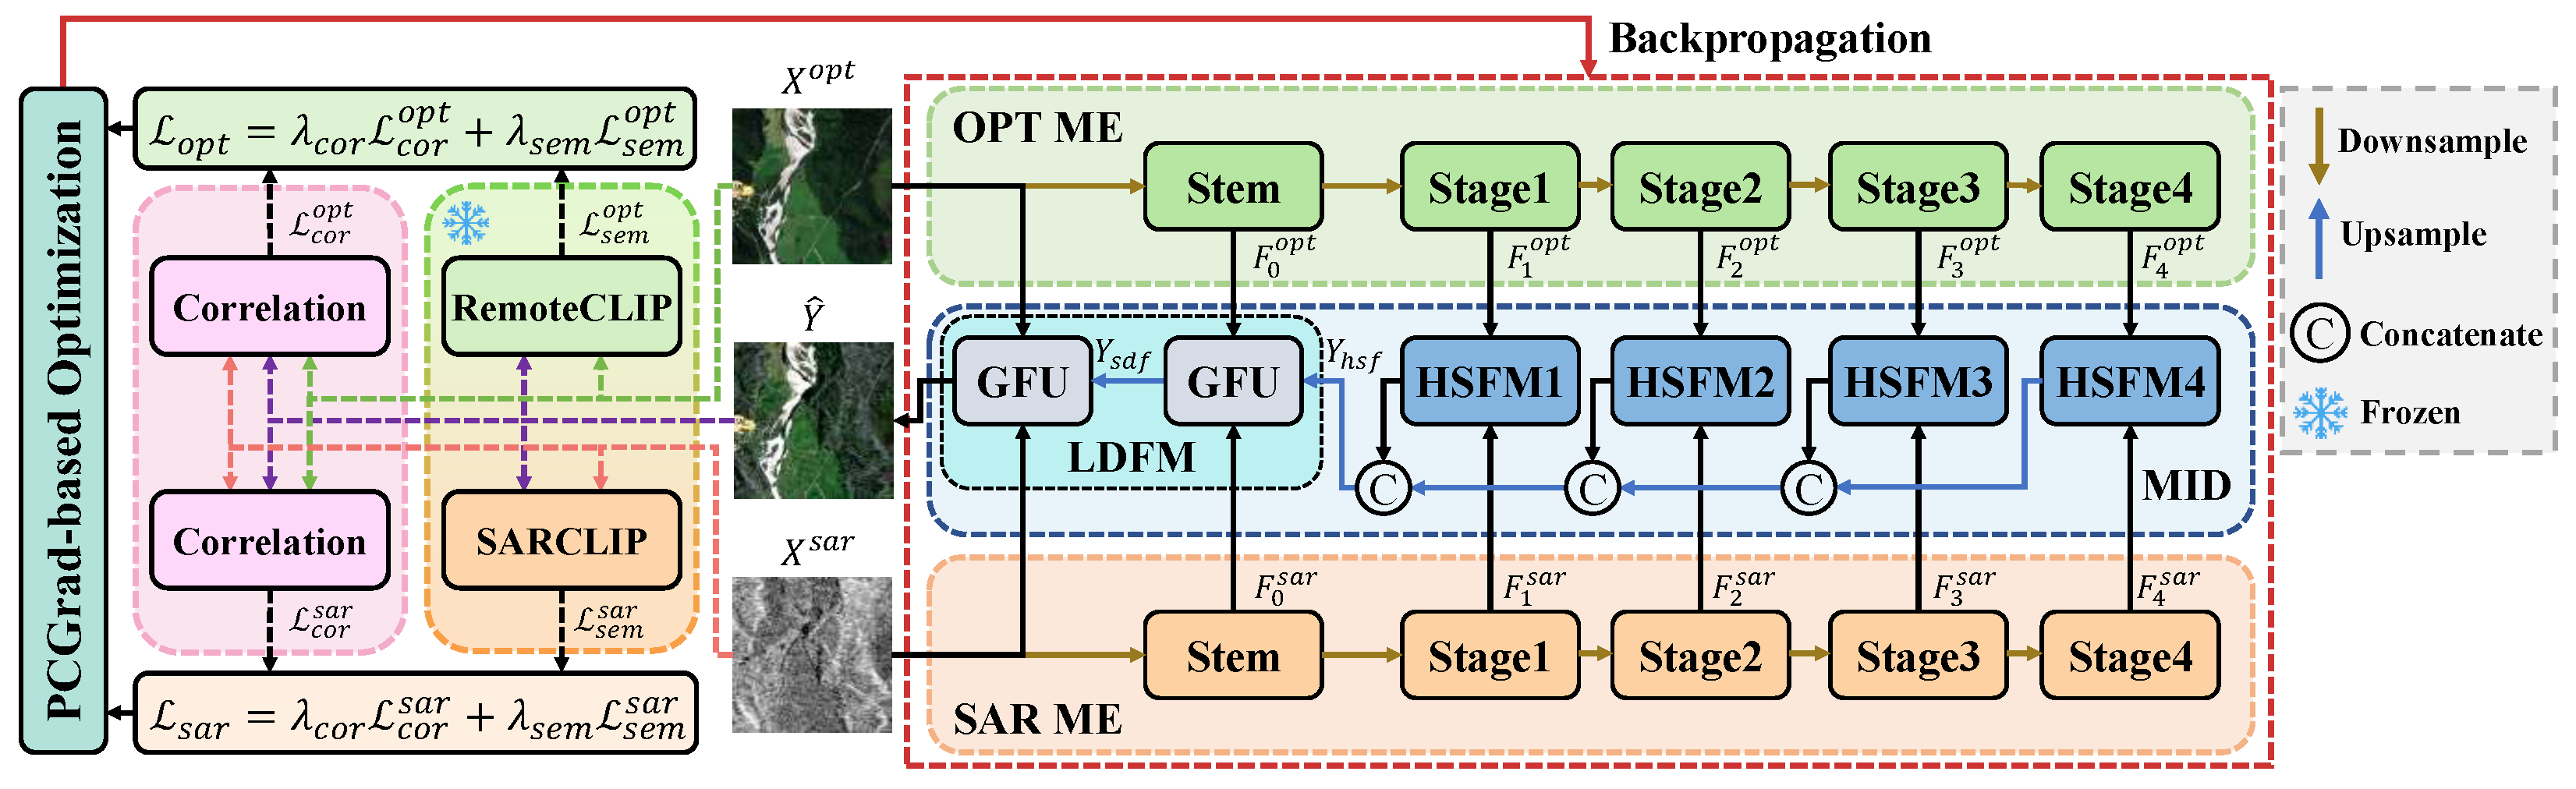
The overall architecture of our CSP-MCIN is illustrated in Figure 1, mainly consisting of an SAR ME, an OPT ME, and an MID. The SAR ME and OPT ME are responsible for performing spatial downsampling on the input images X s a r and X o p t , respectively, and extracting detail and semantic features at corresponding scales. The MID progressively performs cross-modal interactive fusion and spatial upsampling of multi-scale semantic and detail features from the two MEs, and finally injects the original modal observations to reconstruct the fused image Y ^ . The key components of the proposed network and the loss function utilized are presented in detail below.

3.2. Modality-Specific Encoder

ResNet is a widely adopted CNN framework that has been successfully applied to feature extraction tasks for both SAR and OPT images [2,36,46]. It is capable of effectively modeling latent detail information and deep semantic features in images. To balance model performance and computational efficiency, ResNet-18 is employed as the backbone of the ME. As shown in Figure 1, this network comprises a stem stage followed by four residual convolutional stages, with each stage performing a 2× downsampling operation on the input. Since image fusion does not involve classification, its final global average pooling and fully connected layers are removed, and only the remaining convolutional layers are retained to extract multi-scale feature representations.
Due to the significant cross-modal differences between SAR and OPT images, the proposed CSP-MCIN employs two MEs with identical structures but independent parameters to extract multi-scale features from each modality. The computation processes of the SAR ME and OPT ME can be expressed as:
F l s a r = E l s a r X s a r , l = 0 , , 4 , F l o p t = E l o p t X o p t , l = 0 , , 4 ,
where F l s a r R C l × H 2 ( l + 1 ) × W 2 ( l + 1 ) and F l o p t R C l × H 2 ( l + 1 ) × W 2 ( l + 1 ) denote the features of the SAR and OPT modalities extracted by ResNet-18 at stage l, respectively, and C l indicates the number of feature channels. E l s a r ( · ) and E l o p t ( · ) represent the corresponding convolutional encoding operators at each stage, where l = 0 corresponds to the stem layer, and l = 1 , , 4 correspond to stages 1 through 4, respectively. Through the above operations, the resulting shallow feature set { F 0 s a r , F 0 o p t } generally capture more image edges and texture details, whereas the deep feature set { F l s a r , F l o p t } l = 1 4 possess larger receptive fields and encode richer global semantic information. These features are subsequently fed into the MID for carefully designed enhancement and cross-modal interaction.

3.3. Multi-Scale Interaction Decoder

The specific components of the MID are shown in Figure 1, which primarily comprises four HSFMs and one LDFM. Specifically, a HSFM is first applied to the semantic feature pairs { F l s a r , F l o p t } l = 1 4 at different stages from the SAR ME and the OPT ME for semantic alignment and fusion, producing a cross-modal semantic fusion feature set { F l g R C l × H 2 ( l + 1 ) × W 2 ( l + 1 ) } l = 1 4 . Then, all features in { F l g } l = 1 4 are progressively aggregated across multiple scales through spatial upsampling and concatenation operations to obtain the high-level semantic fusion features Y h s f R C 0 × H 2 × W 2 . Finally, taking the shallow detail feature pair { F 0 s a r , F 0 o p t } and the source modality images as input, an LDFM is employed to inject low-level detail information into Y h s f and decode the target fused image Y ^ . As the core computational units of the MID, the internal structures of the HSFM and LDFM are elaborated in the following.

3.3.1. High-Level Semantic Fusion Module

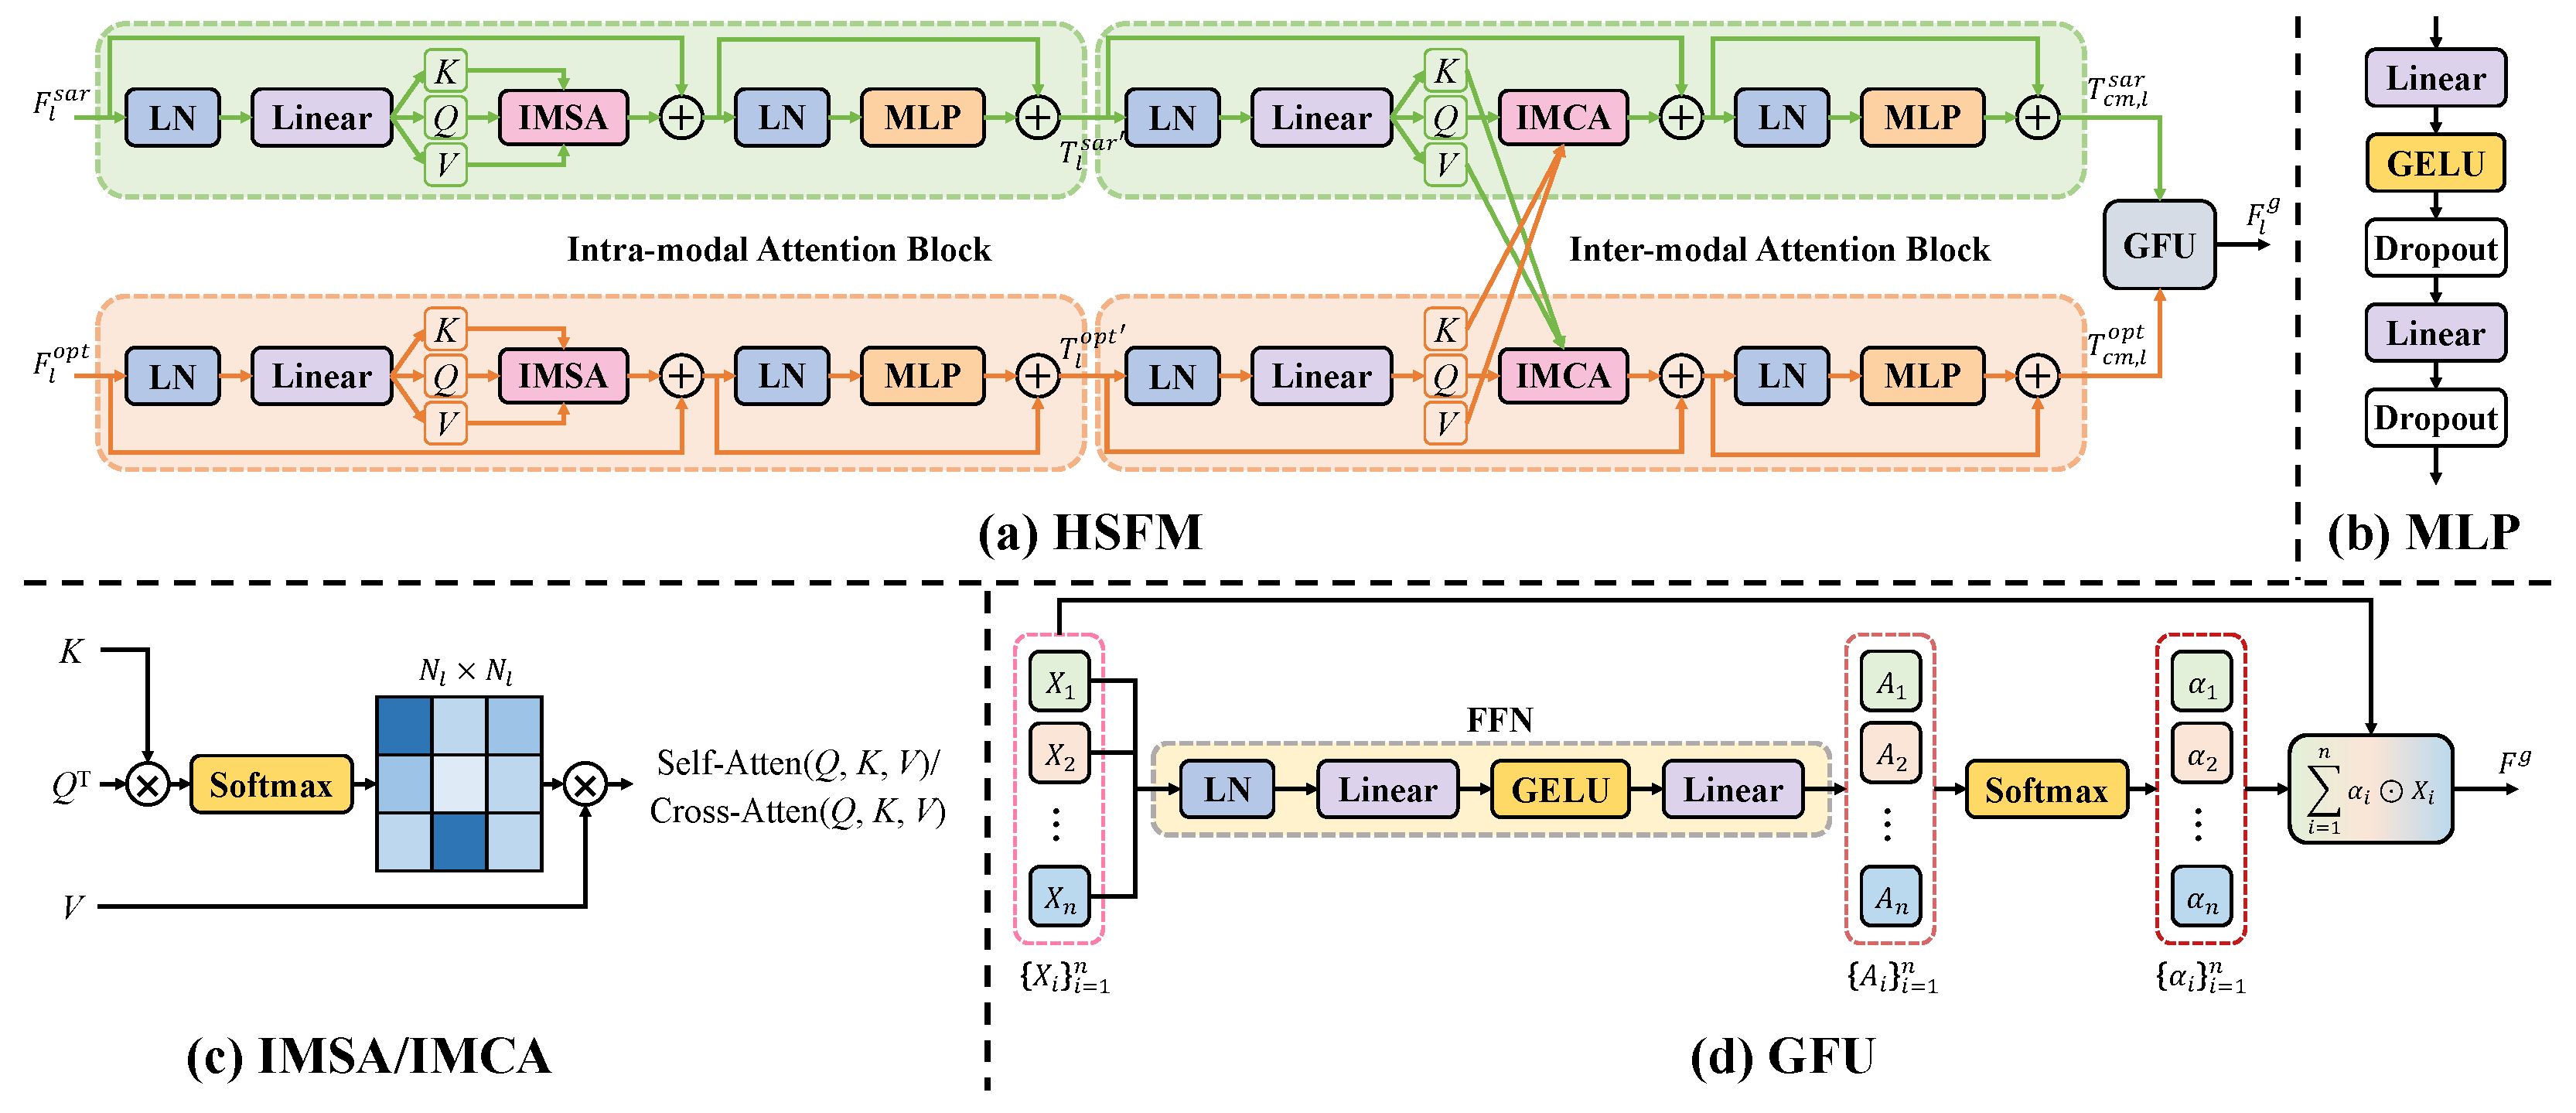
The HSFM is responsible for effectively aligning and fusing high-level semantic feature pairs { F l s a r , F l o p t } extracted from the two MEs, where l = 1 , , 4 . As depicted in Figure 2a, it consists of a cross-modal Transformer and a GFU. The cross-modal Transformer is employed to enhance and align semantic features from different modalities, and the GFU performs adaptive cross-modal fusion by perceiving the importance of contextual information from each modality.
Cross-modal Transformer: Transformer [47] is a popular sequence modeling architecture based on the self-attention mechanism. Compared with CNNs, it is more effective at capturing and modeling long-range contextual dependencies. To more thoroughly exploit both the global representations within each modality and the complementary information across different modalities, a cross-modal Transformer is introduced. Specifically, it sequentially connects an intra-modal attention block with an inter-modal attention block. The intra-modal attention block first computes self-attention within each modality independently to enhance modality-specific representations. Subsequently, the inter-modal attention block employs bidirectional cross-attention to achieve cross-modal feature alignment and information complementarity.
The complete computational pipeline of the cross-modal Transformer is illustrated in Figure 2a. Given a pair of semantic features { F l s a r , F l o p t } from SAR and OPT images, they are first flattened along the spatial dimension to form the corresponding token sequences T l s a r R C l × N l and T l o p t R C l × N l , where N l = H 2 ( l + 1 ) × W 2 ( l + 1 ) . Then, each sequence is processed by an intra-modal attention block to enhance the modeling of long-range dependencies within its own modality. This block mainly consists of two layer normalization (LN) layers, an intra-modal self-attention (IMSA) module, a multilayer perceptron (MLP), and two residual connections. As depicted in Figure 2b, the MLP is composed of two linear layers, a GELU activation function, and two dropout layers with a probability of 0.1. The specific computational procedure of the intra-modal attention module for T l s a r and T l o p t is formulated as follows.
T ^ l s a r = T l s a r + IMSA LN ( T l s a r ) , T ^ l o p t = T l o p t + IMSA LN ( T l o p t ) , T l s a r = T ^ l s a r + MLP LN ( T ^ l s a r ) , T l o p t = T ^ l o p t + MLP LN ( T ^ l o p t ) ,
where T ^ l s a r R C l × N l and T ^ l o p t R C l × N l represent the IMSA outputs for each modality, while T l s a r R C l × N l and T l o p t R C l × N l are the corresponding MLP outputs. As shown in Figure 2c, the self-attention computation of the IMSA can be expressed as follows:
Q = W Q X , K = W K X , V = W V X , Self - Atten ( Q , K , V ) = V · Softmax Q K d ,
where X R C l × N l denotes the input features of the IMSA module. W Q R C l × C l , W K R C l × C l , and W V R C l × C l correspond to the learnable linear projection matrices for the query ( Q R C l × N l ), key ( K R C l × N l ), and value ( V R C l × N l ) tokens, respectively. In addition, d denotes the feature dimension.
After obtaining the globally enhanced features T l s a r and T l o p t through the intra-modal attention block, an inter-modal attention block is further employed to achieve cross-modal semantic alignment and information complementation. This block consists of two LN layers, an intra-modal cross-attention (IMCA) module, an MLP, and two residual connections. Its computation can be formulated as follows:
T ˜ l s a r = T l s a r + IMCA LN ( T l s a r ) , LN ( T l o p t ) , T ˜ l o p t = T l o p t + IMCA LN ( T l o p t ) , LN ( T l s a r ) , T c m , l s a r = T ˜ l s a r + MLP LN ( T ˜ l s a r ) , T c m , l o p t = T ˜ l o p t + MLP LN ( T ˜ l o p t ) ,
where T ˜ l s a r R C l × N l and T ˜ l o p t R C l × N l represent the IMCA outputs for each modality, while T c m , l s a r R C l × N l and T c m , l o p t R C l × N l are the corresponding MLP outputs. Following a procedure similar to the IMSA, the cross-attention computation of the IMCA can be expressed as follows:
Q = W Q X , K = W K Y , V = W V Y , Cross - Atten ( Q , K , V ) = V · Softmax Q K d ,
where X R C l × N l and Y R C l × N l denote the two modal features input to the IMCA module. A learnable linear transformation W Q is applied to X to obtain the Q tokens, while linear transformations W K and W V are applied to Y to obtain the K and V tokens, respectively. Additionally, d corresponds to the dimensionality of the input features. Through the above operations, bidirectional cross-attention is performed on features T l s a r and T l o p t , producing cross-modal complementary features with enhanced semantic alignment. Overall, compared to the CMFC module in CFCFNet [43], the proposed cross-modal Transformer explicitly models the semantic correspondences between the two modalities by incorporating the cross-attention mechanism, thereby enhancing the capability for cross-modal information interaction.
Gated Fusion Unit: The designed cross-modal Transformer effectively enhances and aligns the semantic features extracted from SAR and OPT images. However, features from different modalities exhibit distinct strengths. For example, the SAR modality is more sensitive to structural information, whereas OPT images are more responsive to texture and semantic cues. Therefore, to fully exploit the complementary advantages of different modalities, it is necessary to design an appropriate fusion strategy to thoroughly integrate their features. Simple fusion schemes, such as direct addition [36] or concatenation [3], fail to adequately distinguish between informative and less relevant feature regions. Although attention-based fusion methods [7,37] often achieve improved performance, they typically suffer from complex architectures and high computational overhead. To address these issues, inspired by MGFNet [48], an efficient multi-modal GFU is developed for dynamically aggregating semantic or detailed features from an arbitrary number of modalities. Its specific structure is illustrated in Figure 2d.
Let the inputs to the proposed GFU be denoted as a multi-modal feature set { X i R C × N } i = 1 n , where n indicates the total number of input features, and C and N represent the channel dimension and the length of each feature, respectively. To explore an optimal mixture representation across different modalities, a lightweight feed-forward network (FFN) is constructed to process the feature set. Specifically, features from all modalities are first normalized via LN. Next, a linear layer is applied to reduce the channel dimensionality by half, followed by a GELU activation function to introduce nonlinearity. Another linear layer is then employed to restore the original channel dimension, leading to a transformed feature set { A i R C × N } i = 1 n . Subsequently, a Softmax operation is performed on the entire set to obtain the importance distribution maps { α i R C × N } i = 1 n corresponding to different modal features. Finally, these maps are used as coefficient weights to perform a weighted summation on the input set { X i } i = 1 n , resulting in the final multi-modal fused features F g R C × N . The overall processing of the GFU can be summarized as follows:
A i = Linear GELU Linear ( LN ( X i ) ) , i = 1 , 2 , , n , α i = Softmax ( A i ) = exp ( A i ) j = 1 n exp ( A j ) , i = 1 , 2 , , n , F g = GFU X 1 , , X n = i = 1 n α i X i ,
where exp ( · ) denotes the natural exponential function, and the symbol ⊙ indicates element-wise multiplication. Through the above steps, the GFU adaptively learns appropriate mixing coefficients for all modal features, thereby achieving high-quality feature fusion. Accordingly, in the HSFM, when the GFU takes two cross-modally enhanced features T c m , l s a r and T c m , l o p t as inputs, the corresponding optimal fused representation F l g can be formulated as follows:
F l g = Unflatten GFU ( T c m , l s a r , T c m , l o p t ) ,
where Unflatten refers to restoring the token sequence back to its original image structure. Overall, to effectively preserve modality-specific information, the proposed GFU employs a shared FFN to independently process the input features of different modalities, in contrast to the CADF module in CFCFNet [43]. Such a design not only ensures computational efficiency but also facilitates the generation of more discriminative fusion weights adaptively.

3.3.2. Low-Level Detail Fusion Module

As another key component of the decoder, the LDFM plays a dual role. First, it injects high-frequency detail information from the SAR ME and OPT ME into the obtained features Y h s f , yielding the semantic-detail fused feature Y s d f R C 0 × H 2 × W 2 . Second, it incorporates the original modality observations X s a r and X o p t into the upsampled semantic-detail fused features, further enriching fine-grained details and structural information, and finally decodes the desired image Y ^ . Figure 1 depicts the core structure of the LDFM, primarily implemented based on the proposed GFU, and its computational process is outlined as follows:
Y s d f = Unflatten GFU Flatten ( F 0 s a r , F 0 o p t , Y h s f ) , Y ^ = Unflatten GFU Flatten ( X s a r , X o p t , Up ( Y s d f ) ) ,
where Flatten ( · ) and Unflatten ( · ) respectively unfold the features along the spatial dimension and restore them to the original spatial structure. In addition, Up ( · ) represents a 2× spatial upsampling operation implemented by bilinear interpolation followed by a 5 × 5 convolution.

3.4. Loss Function

Since no ground-truth labels are available for the SAR-OPT image fusion task, the proposed network is trained in an unsupervised manner. However, most existing approaches [7,8,9,49] rely heavily on handcrafted empirical losses imposed at the low-level feature or pixel domain, lacking effective constraints on the high-level semantic consistency between the fused results and the source-modality images. Recently, VLFMs, represented by CLIP [50,51,52], have achieved remarkable progress in cross-modal representation learning. Benefiting from large-scale vision–language joint pre-training, these models are capable of mining rich semantic priors from images, which can be leveraged to enhance the performance of multi-modal information fusion. Motivated by this, we design a novel loss function composed of a pixel-domain correlation loss and a CLIP-guided semantic consistency loss to encourage the fused image to exhibit greater consistency with the source modalities at both low-level and high-level representations. Moreover, to promote a more balanced learning of salient information from the two modalities, this loss function is separately applied to the SAR and OPT images, yielding modality-specific loss objectives L s a r and L o p t . A PCGrad-based multi-objective optimization strategy [53] is then introduced to decouple these loss objectives and achieve simultaneous optimization. Figure 1 presents the overall process of constructing and optimizing the target loss function on the two source modalities, which can be formally represented as:
L s a r = λ c o r L c o r s a r + λ s e m L s e m s a r , L o p t = λ c o r L c o r o p t + λ s e m L s e m o p t , g ˜ s a r , g ˜ o p t = PCGrad θ ( λ s a r L s a r ) , θ ( λ o p t L o p t ) , θ θ η ( g ˜ s a r + g ˜ o p t ) ,
where L c o r s a r and L c o r o p t denote the correlation losses between the fused image and the SAR and OPT images, respectively, while L s e m s a r and L s e m o p t represent the corresponding semantic consistency losses. The weighting coefficients for the correlation and semantic consistency losses are denoted by λ c o r and λ s e m , respectively. In addition, λ s a r and λ o p t indicate the weighting factors associated with losses L s a r and L o p t . The gradient operator is denoted by θ ( · ) , and g ˜ s a r and g ˜ o p t represent the PCGrad-projected gradients of L s a r and L o p t . Finally, θ and η denote the network parameters and the learning rate, respectively.

3.4.1. Pixel-Domain Correlation Loss

Inspired by the Pearson correlation coefficient (CC) and the sum of correlations of differences [54], pixel-domain correlation losses L c o r s a r and L c o r o p t are constructed to respectively constrain the similarity between the fused result and the SAR and OPT modalities. Unlike methods that directly minimize pixel-wise distances, these losses emphasize the correlation between the fused image and the source-modality images in local pixel distributions, making it more suitable for SAR-OPT image fusion tasks. The correlation losses L c o r s a r and L c o r o p t are defined as follows:
L c o r s a r = λ c o r 1 L d c s a r + λ c o r 2 L r c s a r = λ c o r 1 1 CC Y ^ , X s a r + λ c o r 2 1 CC Y ^ X o p t , X s a r , L c o r o p t = λ c o r 1 L d c o p t + λ c o r 2 L r c o p t = λ c o r 1 1 CC Y ^ , X o p t + λ c o r 2 1 CC Y ^ X s a r , X o p t ,
where L d c s a r and L d c o p t denote the direct correlation loss, which aims to enforce global distributional consistency between the fused image and its corresponding source modality in the pixel domain. However, in heterogeneous remote sensing fusion, the fundamental differences in imaging mechanisms between SAR and OPT sensors mean that pursuing excessive cross-modal correlation can inadvertently trigger modality bias. This bias leads the network to overfit to the modality with stronger correlation, thereby suppressing the unique and critical features of the other modalities. To address this issue, we introduce the residual correlation losses L r c s a r and L r c o p t on top of the direct correlation constraints. By leveraging a residual learning mechanism, these terms explicitly guide the network to preserve complementary information from the source images, effectively mitigating the cancellation of heterogeneous features. The trade-off between these two correlation components is controlled by the weight coefficients λ c o r 1 and λ c o r 2 .

3.4.2. CLIP-Guided Semantic Consistency Loss

Relying solely on pixel-level correlation constraints may cause the fusion network to overemphasize low-level information while neglecting high-level semantic content. To address this issue, we design CLIP-guided semantic consistency losses L s e m s a r and L s e m o p t based on SARCLIP-RN50 [50] and RemoteCLIP-RN50 [51], which injects richer high-level semantic priors from both modalities into the fused image. Specifically, the image encoders of the two CLIP models are first frozen and then employed to extract intermediate features and final embedding representations from the fused image, the SAR image, and the OPT image. For SARCLIP-RN50, the intermediate features and embeddings of the SAR image and the fused image are denoted as sets { S l s a r , S l f u s R C l × H 2 ( l + 1 ) × W 2 ( l + 1 ) } l = 0 4 and { S e m b s a r , S e m b f u s R 1 × 1024 } , respectively. For RemoteCLIP-RN50, the intermediate features and embeddings of the OPT image and the fused image are denoted as sets { R l o p t , R l f u s R C l × H 2 ( l + 1 ) × W 2 ( l + 1 ) } l = 0 4 and { R e m b o p t , R e m b f u s R 1 × 1024 } , respectively. Based on the obtained multi-modal intermediate features and embeddings, semantic consistency losses L s e m s a r and L s e m o p t are constructed, which are defined as follows:
L s e m s a r = λ f e a t L f e a t s a r + λ n c e L n c e s a r , = λ f e a t ( l = 0 4 w l S l f u s S l s a r 2 2 ) + λ n c e L InfoNCE ( S e m b s a r , S e m b f u s ) , L s e m o p t = λ f e a t L f e a t o p t + λ n c e L n c e o p t , = λ f e a t ( l = 0 4 w l R l f u s R l o p t 2 2 ) + λ n c e L InfoNCE ( R e m b o p t , R e m b f u s ) ,
where L f e a t s a r and L f e a t o p t respectively constrain the semantic similarity between the fused image and the two source images at the intermediate feature level. L n c e s a r and L n c e o p t enforce their semantic consistency at the embedding level. L InfoNCE denotes the InfoNCE loss commonly used in contrastive learning [52]. Additionally, λ f e a t and λ n c e represent the weighting coefficients for L f e a t s a r and L f e a t o p t , respectively.

3.4.3. Multi-Objective Optimization

To avoid bias towards a specific modality during training, we adopt a PCGrad-based multi-objective optimization strategy to jointly optimize losses L s a r and L o p t , rather than simply summing them into a single objective. Owing to the significant discrepancies in feature distributions between SAR and OPT images, the gradient update directions of L s a r and L o p t may conflict during training. In such cases, conventional single-objective optimization tends to favor the modality with larger gradient contributions, resulting in modality bias. In contrast, PCGrad [53] explicitly corrects conflicting gradients and yields an update direction that is simultaneously beneficial for optimizing both L s a r and L o p t . Based on this, the PCGrad principle is incorporated into the proposed loss function to enable more balanced and reliable multi-modal fusion training.

4. Experiments

This section conducts comprehensive experiments to evaluate the proposed CSP-MCIN, followed by a detailed description and analysis of the experimental results. First, the experimental settings are introduced, including the employed datasets, the compared methods, and the performance evaluation metrics. Then, the implementation details of the experiments are described. Subsequently, the proposed method is compared with SOTA fusion approaches to demonstrate its effectiveness. Finally, ablation studies are performed to validate the contributions of key components and the design of the loss function.

4.1. Experimental Setup

4.1.1. Datasets

The experiments involve four public SAR-OPT image datasets, namely WHU-OPT-SAR (WOS) [55], SEN1-2 [56], QXS-SAROPT (QS) [57], and OGSOD [58]. Specifically, the WOS dataset contains 100 pairs of registered SAR-OPT images with a resolution of 5556 × 3704 pixels and their corresponding land-cover segmentation masks. These images feature a 5 m spatial resolution and cover an area of nearly 50,000 km2 in Hubei Province, China. The SEN1-2 dataset provides 282,384 registered SAR-OPT image patches of 256 × 256 pixels at a 10 m spatial resolution, spanning diverse global regions across four seasons. The QS dataset includes 20,000 registered SAR-OPT image patches of 256 × 256 pixels at a 1 m spatial resolution, focusing on the urban areas of San Diego, Shanghai, and Qingdao. The OGSOD dataset comprises 20,359 registered image patches of 256 × 256 pixels at a 20 m spatial resolution, accompanied by 54,000 high-quality object category annotations. For the WOS dataset, the original images are first cropped into 29,400 pairs of 256 × 256 SAR-OPT image patches using a sliding-window strategy. Among them, 23,520 pairs are randomly selected for training, and the remaining 5880 pairs are used for testing. For the SEN1-2 dataset, 15,902 image pairs are randomly selected for training, and 3872 pairs are used for testing. For the QS dataset, 16,000 pairs are randomly sampled for training, with the remaining 4000 pairs used for testing. For the OGSOD dataset, 14,250 pairs are randomly sampled for training, with the rest used for testing. Furthermore, it is worth noting that the OPT images in the WOS dataset contain four spectral bands, including RGB and NIR, while the other three datasets only have RGB bands. To ensure a fair performance comparison and consistent input dimensions across different datasets, only the RGB bands are retained for all OPT images.

4.1.2. Compared Methods

Nine SOTA multi-modal image fusion methods are selected for performance comparison on the WOS and SEN1-2 datasets, covering both traditional and deep learning paradigms. The traditional methods include LP [17] and VSFF [59]. The deep learning-based methods comprise FusionGAN [38], DDcGAN [39], GANMcC [40], U2Fusion [33], SwinFusion [8], TUFusion [9], and FreeFusion [37]. LP is a Laplacian pyramid-based method, while VSFF is based on a variational model. FusionGAN, DDcGAN, and GANMcC are GAN-based approaches. U2Fusion and FreeFusion are CNN-based methods. Both SwinFusion and TUFusion employ a CNN–Transformer hybrid architecture, with SwinFusion being an end-to-end method and TUFusion based on an autoencoder.

4.1.3. Evaluation Metrics

To comprehensively evaluate the quality of fused images generated by different comparison methods, six quantitative evaluation metrics are employed, including Standard Deviation (SD), Correlation Coefficient (CC), Entropy (EN) [60], Visual Information Fidelity for Fusion (VIFF) [61], Language-driven Image Quality Evaluation (LIQE) [62], and CLIP-based Image Quality Assessment (CLIP-IQA) [63]. Among them, SD and EN are no-reference statistical metrics that reflect the overall contrast and information content of the fused images. CC and VIFF are full-reference metrics that rely on source images to assess the capability of fusion methods in preserving multi-modal information. In contrast, LIQE and CLIP-IQA leverage VLFMs to perform no-reference evaluation of fusion quality from perceptual and semantic perspectives. Furthermore, to holistically characterize the proximity between fused results and each source modality in the feature space, we extend CLIP-based Maximum Mean Discrepancy (CMMD) [64] and present a novel fusion evaluation metric, termed CMMD for Fusion (CMMDF). Specifically, the image encoders of SARCLIP-RN50 and RemoteCLIP-RN50 are first employed to extract the final semantic embeddings of the fused image, the SAR image, and the OPT image, respectively. Subsequently, the Maximum Mean Discrepancy is computed between the fused embedding distribution and the SAR embedding distribution, as well as between the fused embedding distribution and the OPT embedding distribution. Finally, the two distribution distances are averaged to obtain the final CMMDF score. Thus, the computation procedure of CMMDF can be summarized as follows:
CMMDF = MMD ( S e m b s a r , S e m b f u s ) + MMD ( R e m b o p t , R e m b f u s ) 2 .
where S e m b s a r and S e m b f u s denote the embedding representations extracted from the SAR image and the fused image via SARCLIP-RN50, respectively. Likewise, R e m b o p t and R e m b f u s represent the embedding representations extracted from the OPT image and the fused image via RemoteCLIP-RN50, respectively. In addition, the implementations of SD, CC, EN, and VIFF follow the General Evaluation Metric toolbox (https://github.com/Linfeng-Tang/Image-Fusion, accessed on 1 January 2026), while LIQE and CLIP-IQA are implemented using the IQA-PyTorch toolbox (https://github.com/chaofengc/IQA-PyTorch, accessed on 1 January 2026). It is worth noting that, except for the CMMDF metric, where a lower value indicates better fusion performance, all the other evaluation metrics achieve better performance with higher values.

4.2. Implementation Details

All experiments are conducted on a workstation equipped with a single NVIDIA A100 GPU and an Intel Xeon Platinum 8383C CPU, running Ubuntu 20.04, Python 3.10, and PyTorch 2.5 with CUDA 12.1. For the WOS, SEN1-2, QS, and OGSOD datasets, the batch size for CSP-MCIN is set to 15, with the number of training epochs configured at 65, 100, 120, and 100, respectively. Furthermore, the ResNet-18 backbones for both modalities are trained from scratch without using pre-trained models for initialization. The Adam optimizer is employed to optimize the network, with a constant learning rate of 1 × 10 4 throughout the training process. All hyperparameters for the proposed loss function are empirically determined, and their specific values are provided in Table A1 of Appendix A. To ensure a fair comparison, the parameters of the other compared methods are adjusted to their optimal settings according to the recommendations in the corresponding references. Since the SEN1-2 dataset lacks segmentation annotations, the segmentation loss is omitted when training FreeFusion on this dataset.
In terms of data preprocessing, directly fusing SAR and OPT images may distort the color structure of the OPT images. Following previous works [8,33,37], the OPT images are first converted to the YCbCr color space, and the Y channel, which primarily represents luminance and structural information, is fused with the SAR images. After the network outputs the fused grayscale image, it is combined with the Cb and Cr channels and transformed back to produce the final fused image with preserved natural colors.

4.3. Training Stability Analysis

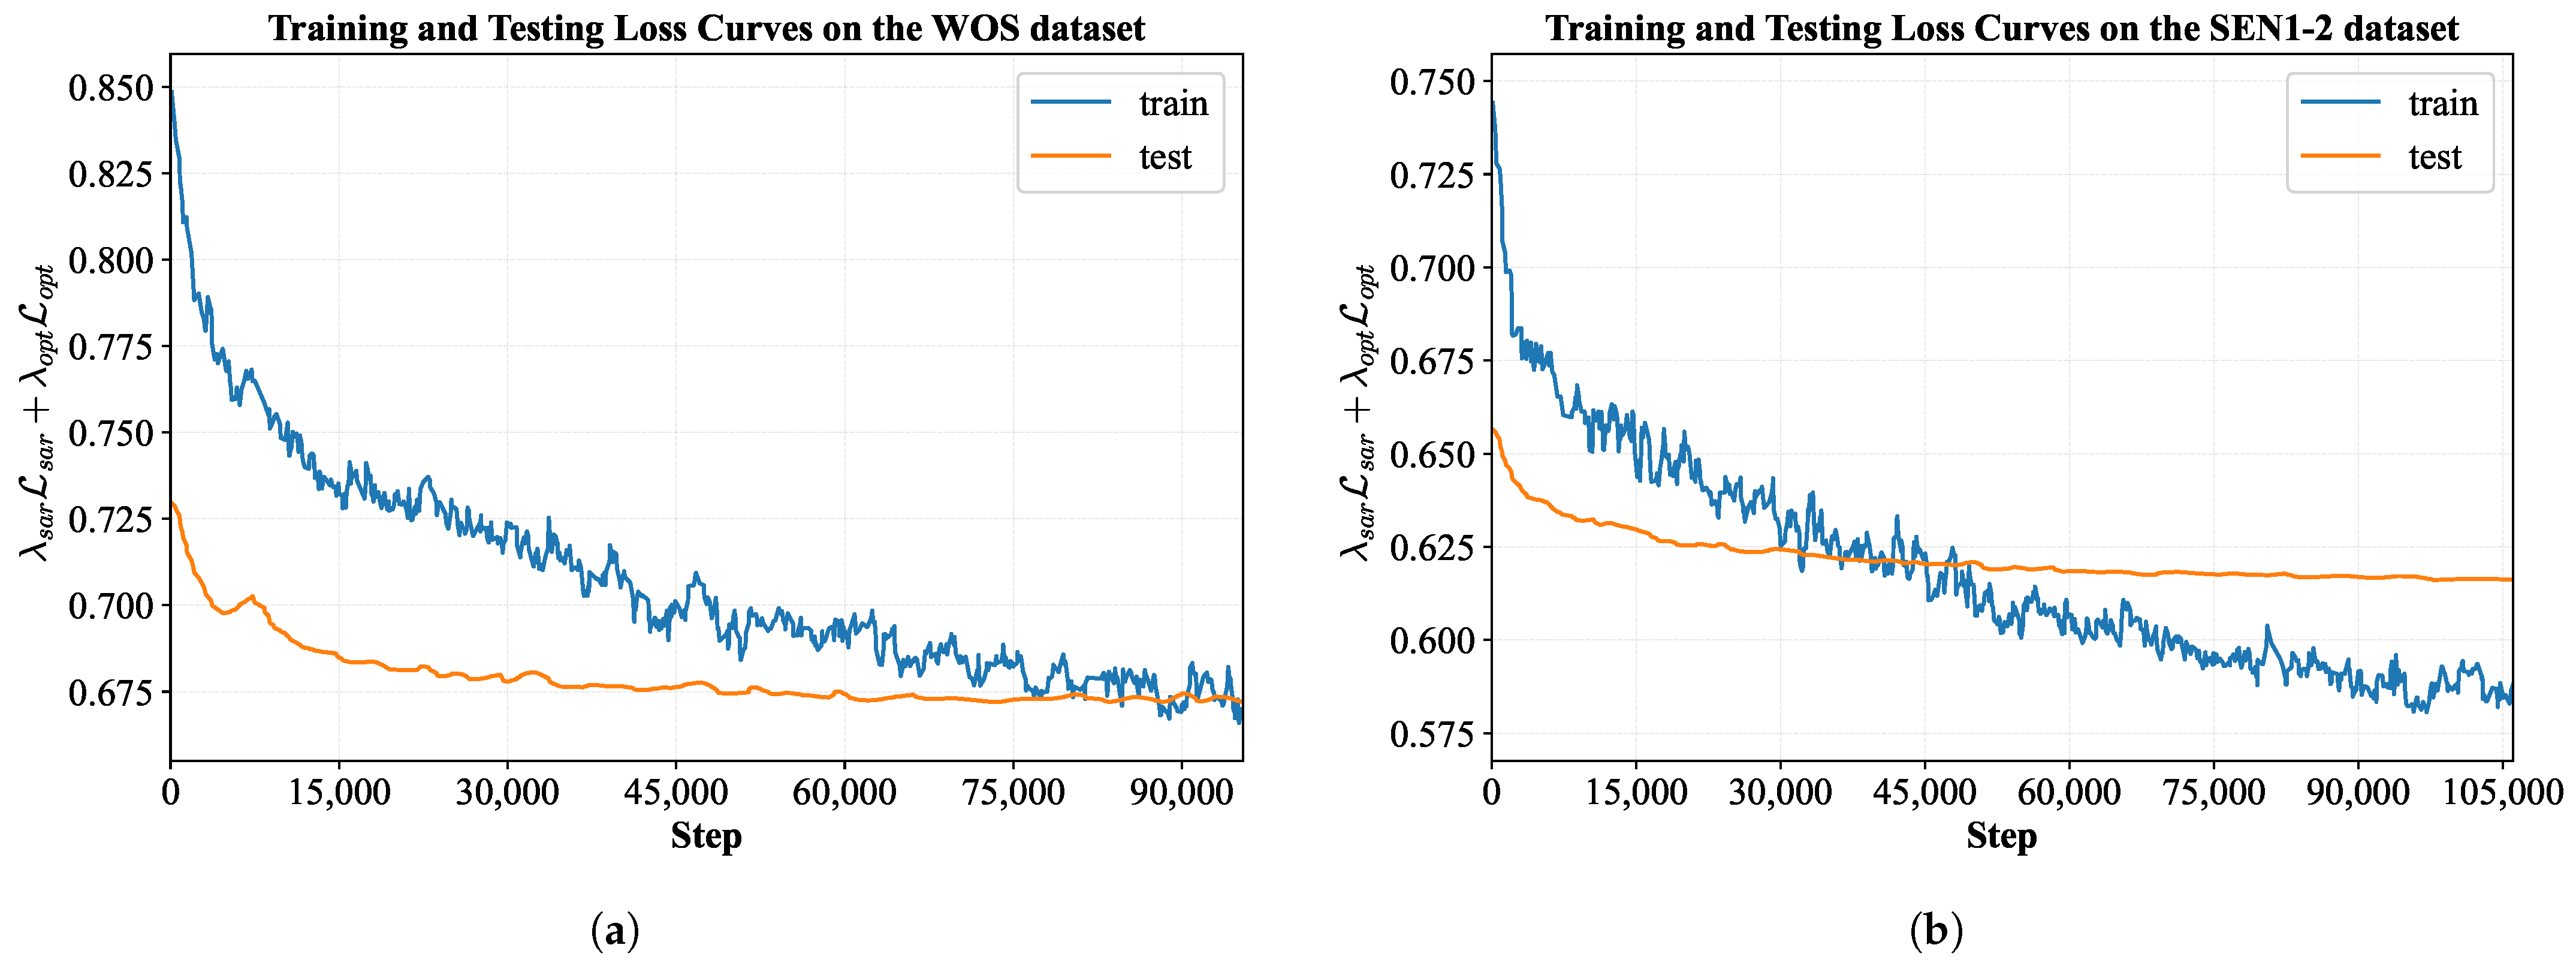
To investigate the training stability and potential overfitting risk of the proposed CSP-MCIN, we visualize the training and testing loss curves on the WOS and SEN1-2 datasets. As shown in Figure 3, all training loss curves exhibit a smooth and continuous decline, while the corresponding testing loss curves follow a similar downward trend and converge to a stable level without noticeable divergence. This behavior indicates that no obvious overfitting occurs during the training process of CSP-MCIN. Moreover, the marginal gap between the training and testing loss curves further demonstrates the effectiveness and robust training stability of the proposed model.

4.4. Experimental Results

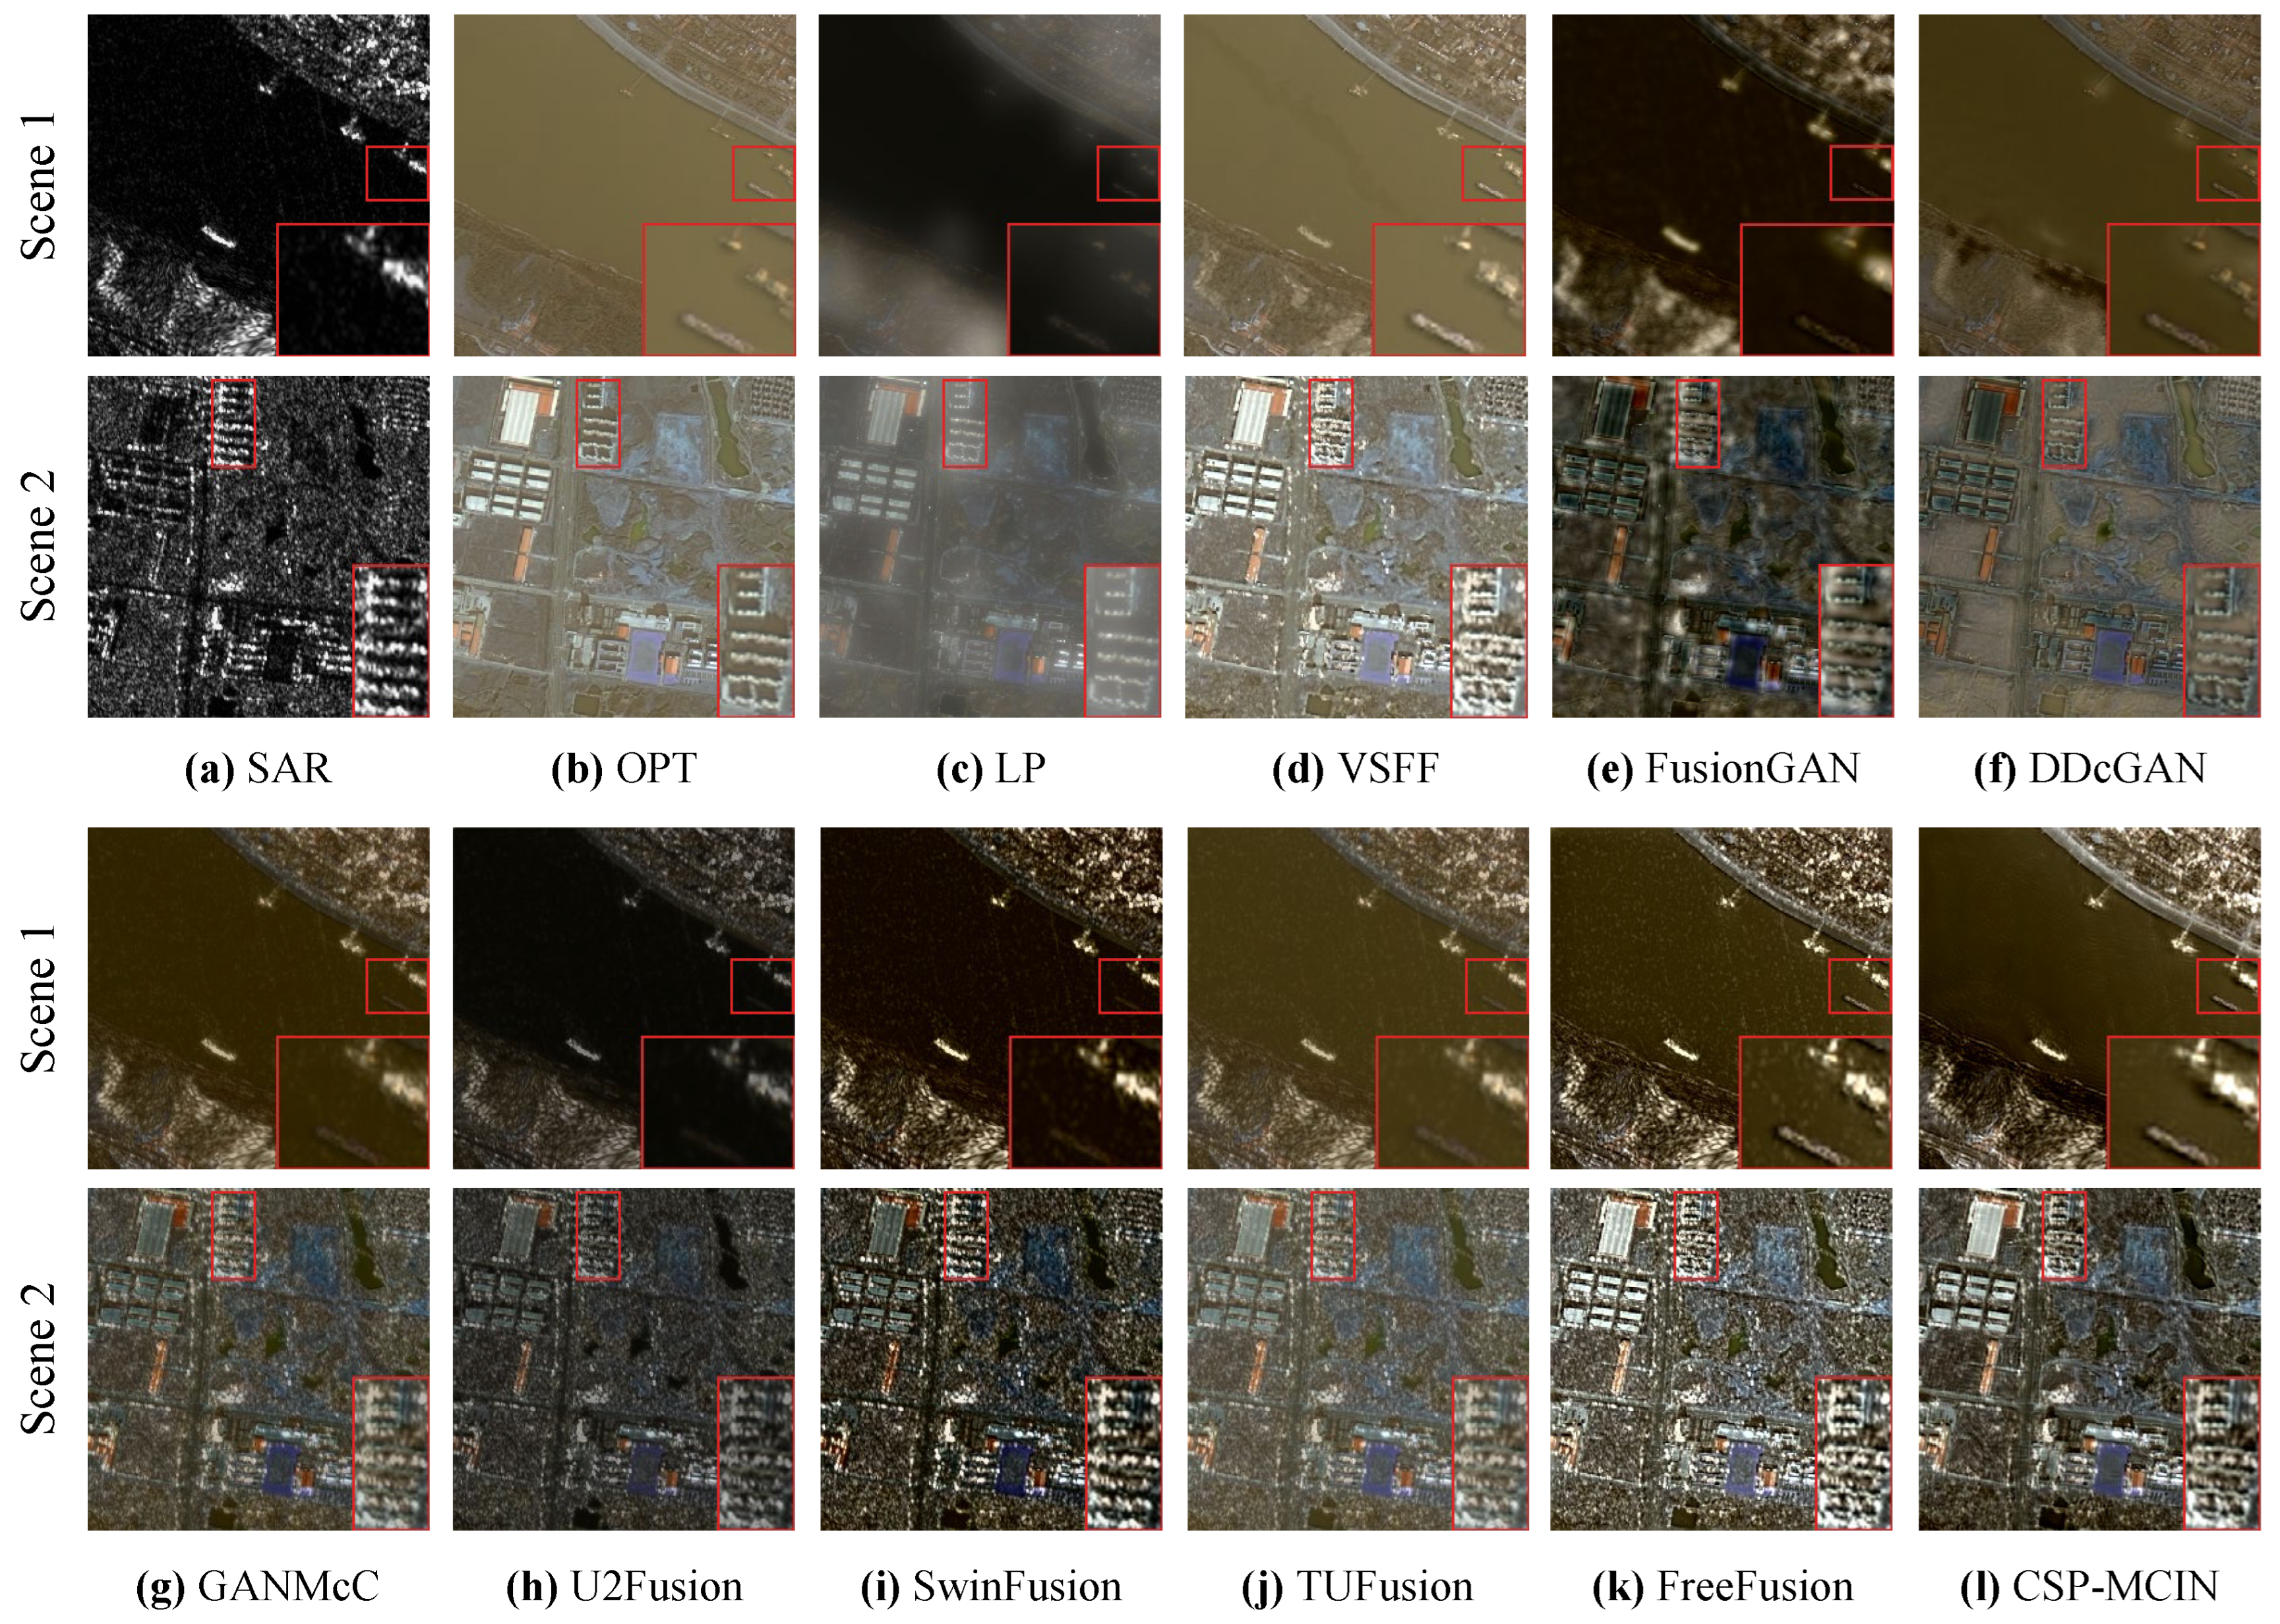
Table 1 reports the quantitative evaluation results of different compared methods on the WOS test dataset, where the best and second-best values are highlighted in red and blue bold fonts, respectively. It can be observed that the proposed CSP-MCIN achieves superior performance on the majority of evaluation metrics. Specifically, CSP-MCIN outperforms the second-best method by 0.049 and 0.086 on the CC and EN metrics, respectively. On the LIQE and CLIP-IQA metrics, CSP-MCIN improves upon the second-best method by 0.139 and 0.017, respectively, while its CMMDF value is reduced by 0.196. Although CSP-MCIN performs slightly worse than FreeFusion on the SD and VIFF metrics, it still achieves the second-best results. Notably, a significant performance disparity is observed in the VIFF metric among different methods. As an evaluation metric rooted in information theory and the human visual system, VIFF quantifies the effective visual information retained in the fused image relative to each source modality [61,65]. A higher VIFF indicates that the fused image more accurately restores the structural features of the SAR image and the textural details of the OPT image. Conversely, a lower VIFF suggests that the fusion process is accompanied by significant information loss or artifact interference, leading to compromised visual fidelity. Therefore, the VIFF metric intuitively reflects the extent to which different fusion algorithms preserve the information from source modalities. For instance, traditional methods, GAN-based frameworks, as well as U2Fusion and TUFusion, exhibit lower VIFF values, indicating a failure to adequately preserve the visual information from the source images. In contrast, SwinFusion, FreeFusion, and our CSP-MCIN demonstrate higher VIFF, reflecting a more effective capability for visual information extraction and fusion. Furthermore, Figure 4 illustrates the SAR images, OPT images, and fusion results produced by different compared methods for two representative scenes from the WOS test dataset. For a better visual comparison, a key local region in each image is marked and enlarged. In Scene 1, compared with other methods, CSP-MCIN better preserves the luminance information and salient targets from the SAR image, where ships and port regions are noticeably enhanced relative to the OPT image. In contrast, the fusion results generated by FreeFusion exhibit more noticeable noise. GANMcC, SwinFusion, and TUFusion show limited capability in depicting maritime ship targets, while VSFF suffers from certain artifacts on the sea surface. In Scene 2, the fused image produced by CSP-MCIN and VSFF effectively inherits the backscattering intensity characteristics of SAR and the spectral features of the OPT image, making building targets more distinguishable. By comparison, the fusion results of FreeFusion and SwinFusion introduce more noise, whereas TUFusion and U2Fusion fail to sufficiently integrate the geometric structural information from the SAR images.
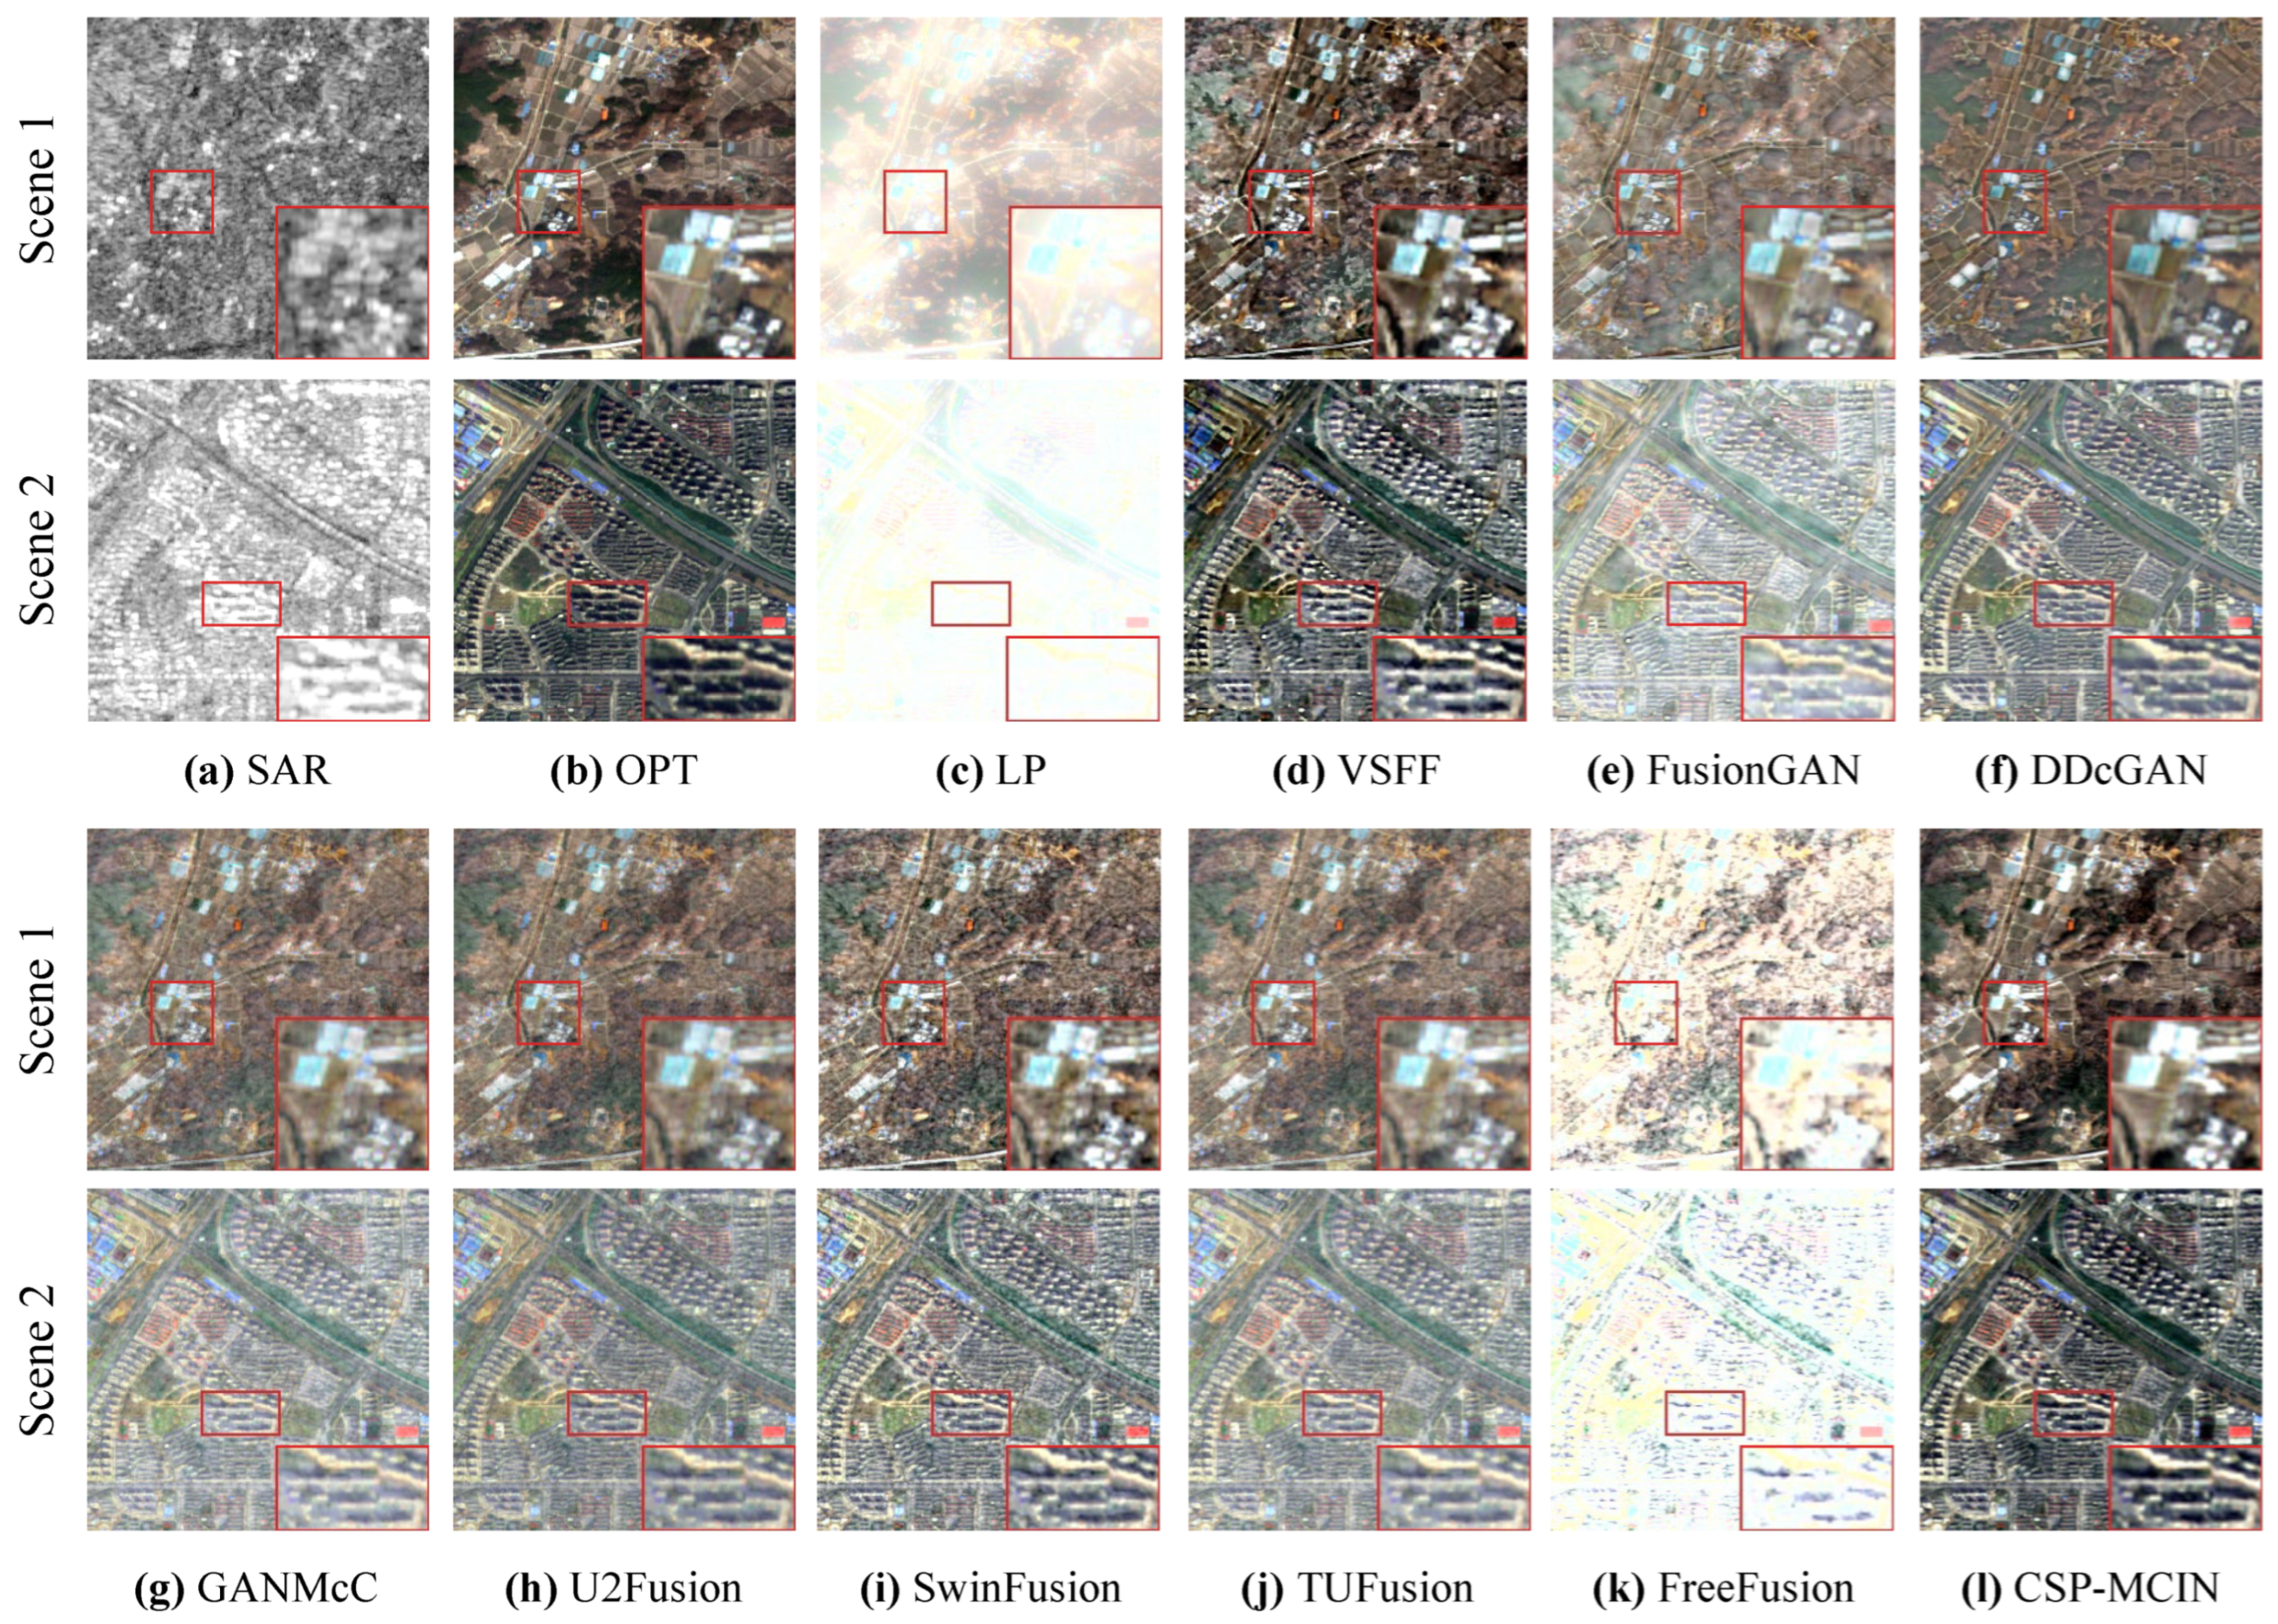
The quantitative evaluation results on the SEN1-2 test dataset are reported in Table 2. It can be observed that the proposed CSP-MCIN still maintains a clear overall advantage in terms of performance. Specifically, CSP-MCIN achieves the best results on the SD, EN, VIFF, and CMMDF metrics, and ranks second on the CLIP-IQA metric, only slightly inferior to DDcGAN. Moreover, its performance on the CC and LIQE metrics is comparable to U2Fusion and DDcGAN. Similarly, a substantial disparity remains evident among different fusion methods regarding the VIFF metric. For example, traditional approaches, GAN-based methods, and U2Fusion continue to yield poor VIFF performance. In contrast, SwinFusion, TUFusion, FreeFusion, and our CSP-MCIN exhibit significantly higher VIFF values, which align more closely with normal human visual perception. Moreover, Figure 5 presents the SAR images, OPT images, and fused images produced by different methods for two representative scenes from the SEN1-2 test dataset. For a better visual comparison, a key local region in each image is marked and enlarged. From the visual comparison, it is evident that, compared with other methods, only our CSP-MCIN and VSFF are able to better preserve the spectral color information from the OPT images. When compared with VSFF, CSP-MCIN produces clearer and more detailed texture representations. The fusion results of FreeFusion and LP suffer from severe overexposure, while the remaining methods fail to adequately reflect the intensity and structural characteristics of the SAR images. Overall, the experimental results on both datasets demonstrate that CSP-MCIN not only achieves superior fusion performance but also exhibits strong generalization capability.

4.5. Effectiveness of High-Level Semantic Alignment Strategy

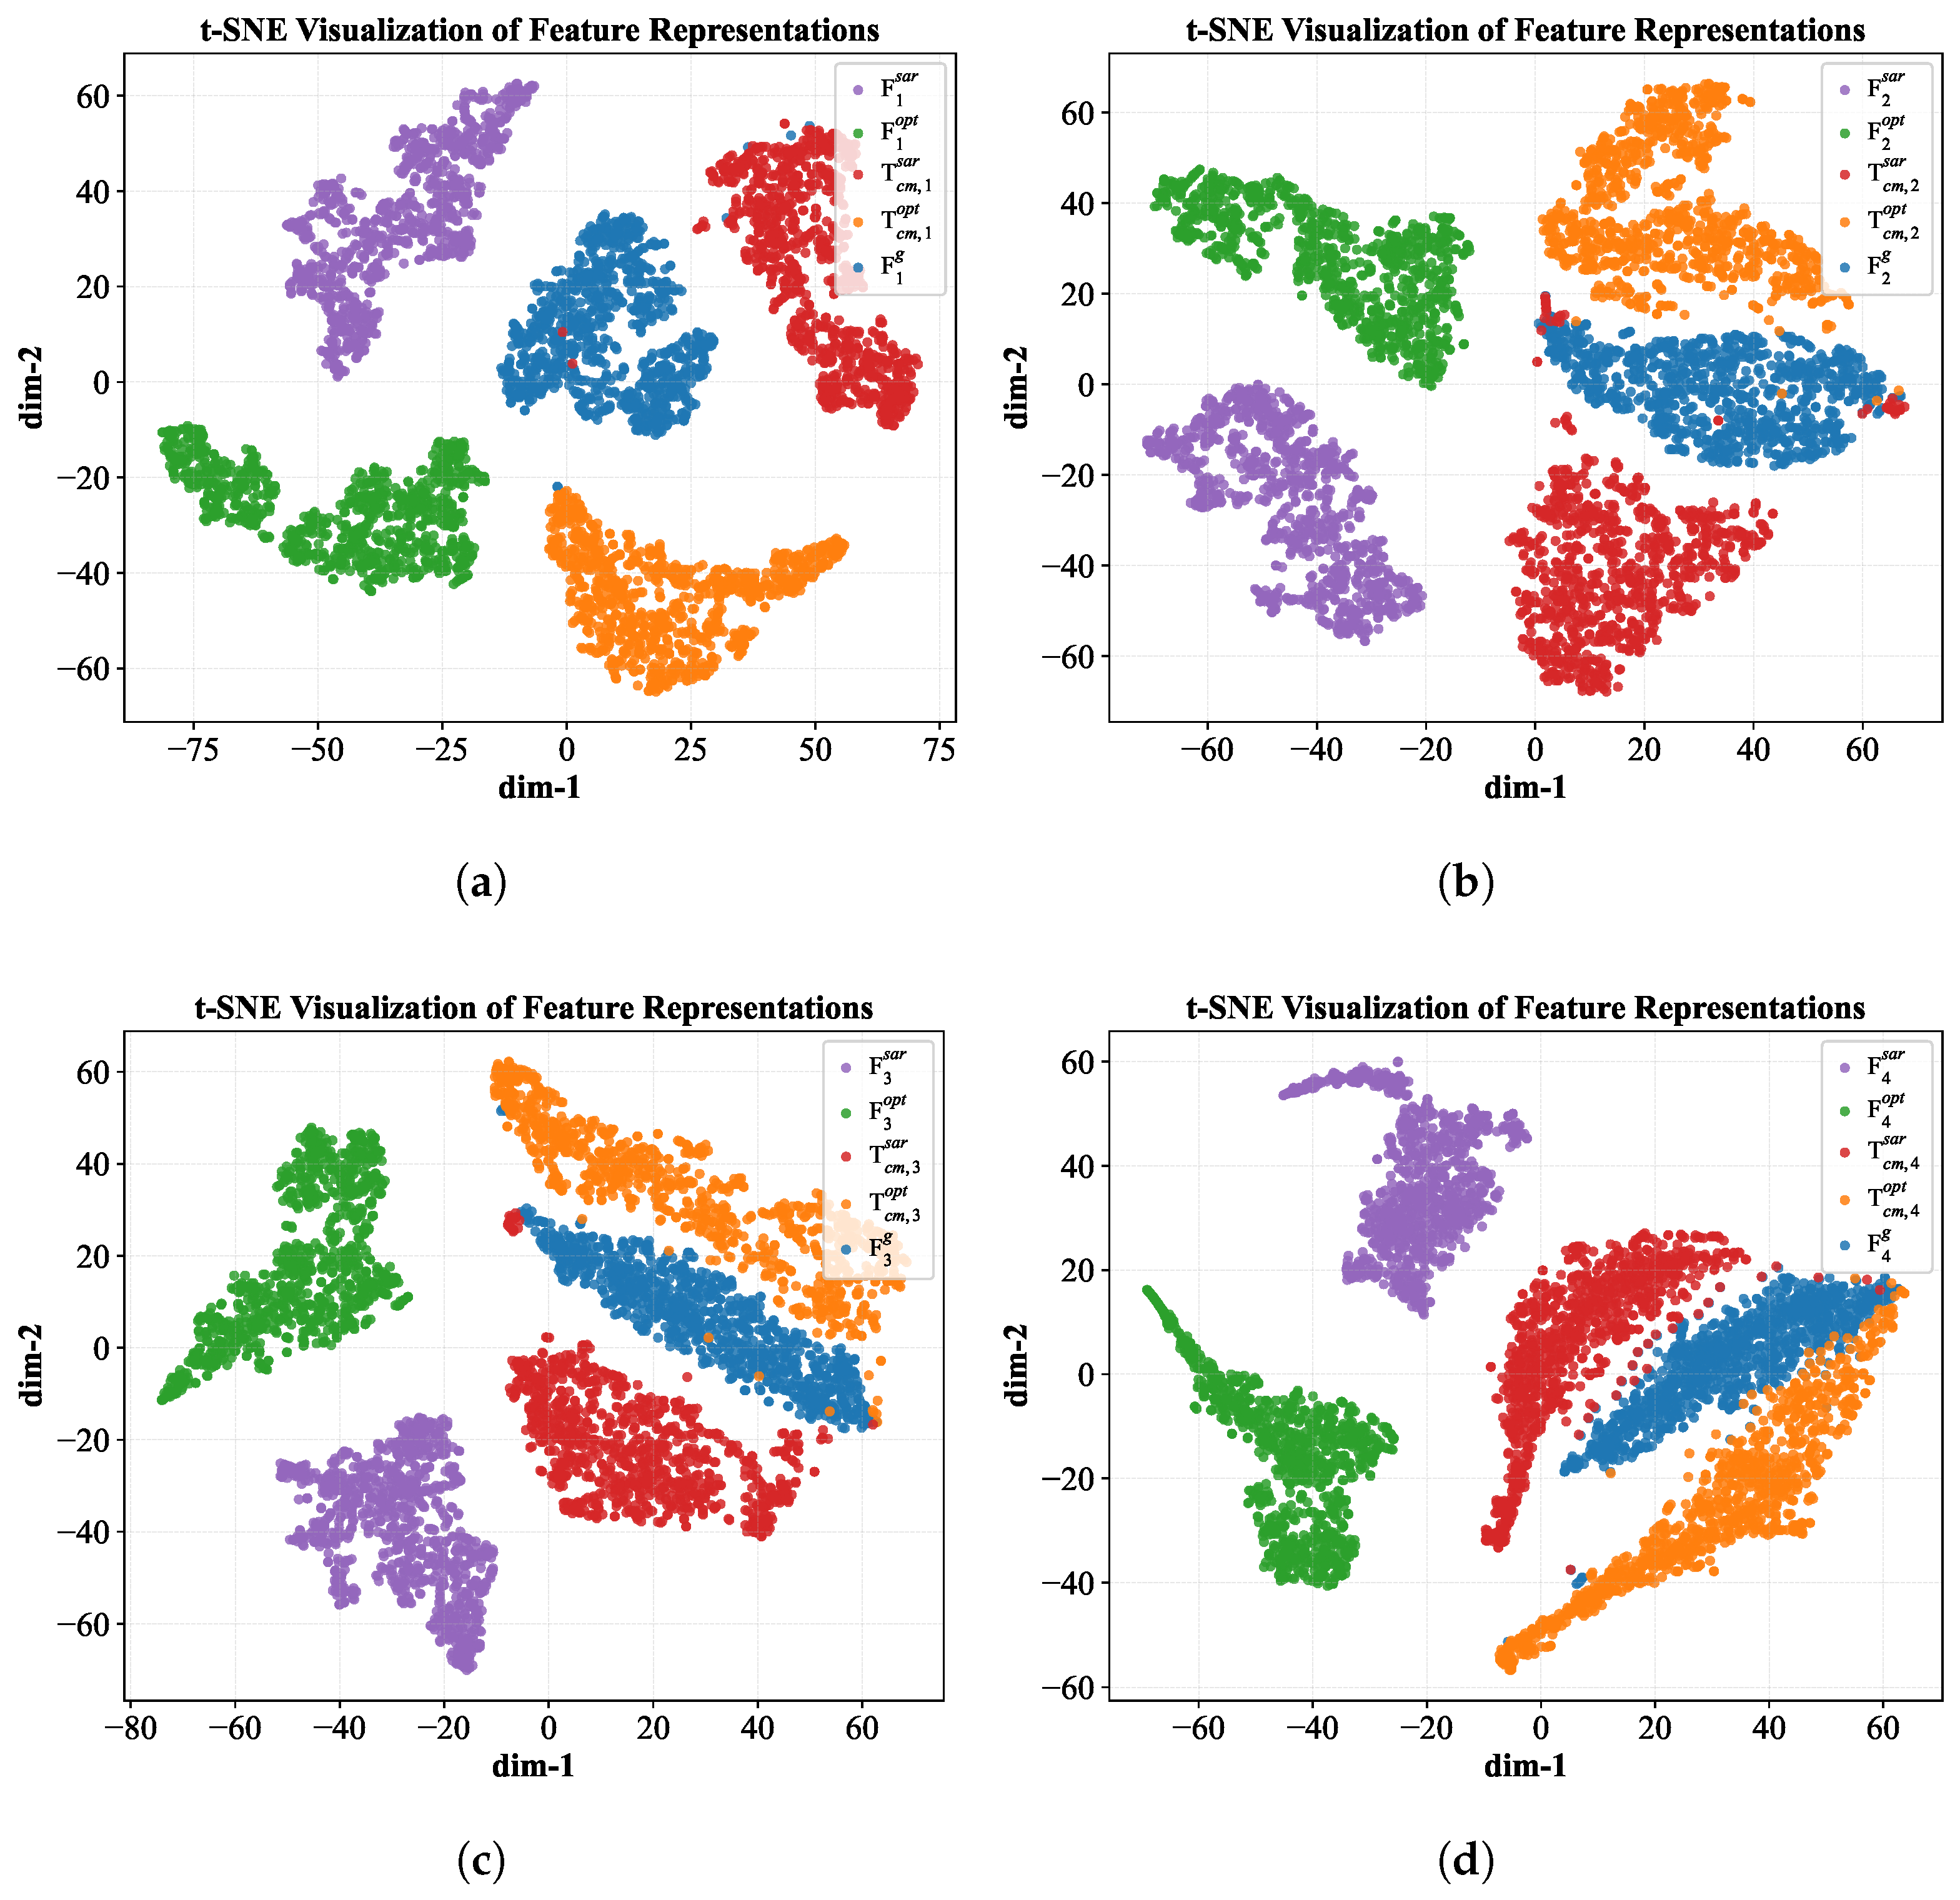
To investigate the efficacy of the proposed HSFM in facilitating high-level semantic alignment, 1000 SAR-OPT image pairs are randomly selected from the WOS test dataset. Subsequently, we conduct a t-SNE visualization analysis on the feature representations before and after the cross-modal Transformer and the GFU within the HSFM across different network stages. Specifically, Figure 6a–d illustrate the evolution of the t-SNE manifold distributions for the internal features within HSFM1 to HSFM4 of the CSP-MCIN. The experimental results demonstrate that at any given stage l, the HSFM first utilizes the cross-modal Transformer to effectively enhance the representation capabilities of the original input features F l s a r and F l o p t . This process causes their t-SNE distributions to deviate significantly from their initial states, implying a profound reconstruction of intra-modal features through cross-modal interaction. Subsequently, the enhanced cross-modal features, T c m , l s a r and T c m , l o p t , undergo further alignment and integration within the feature space via the GFU, ultimately generating the cross-modal fused feature F l g . In the t-SNE plots, F l g is positioned in close proximity to the distribution regions of both T c m , l s a r and T c m , l o p t , which indicates that the GFU effectively aligns cross-modal semantics and integrates complementary information from both modalities. Furthermore, we also observe a distinct centripetal convergence trend between the distributions of T c m , l s a r and T c m , l o p t as the network stage increases. This phenomenon suggests that the HSFM iteratively bridges the semantic gap between heterogeneous modalities through progressive interaction and fusion. Consequently, the t-SNE visualization of the internal feature evolution provides intuitive verification that the HSFM effectively facilitates interactive enhancement and semantic alignment-based fusion across multiple stages.

4.6. Model Complexity Analysis

In the field of deep learning, model complexity is a critical dimension for evaluating the comprehensive performance of an algorithm. Consequently, we conduct a complexity analysis for all deep learning-based image fusion methods, covering Parameters (Params), floating-point operations (GFLOPs), inference time (Time), and GPU Memory usage (Mem), with the results displayed in Table 3. Specifically, the Params and GFLOPs of each model are statistically measured using the open-source fvcore library (https://github.com/facebookresearch/fvcore, accessed on 1 January 2026). The Time is obtained by averaging the total duration of 1000 forward passes, preceded by 50 warm-up iterations to mitigate the impact of GPU cold-starting. Mem records the peak memory usage during model inference. Additionally, all evaluations are conducted at an input image resolution of 256 × 256 with a batch size of 1. As indicated in Table 3, although the proposed CSP-MCIN does not exhibit a significant advantage in Params and Mem, it achieves the highest computational efficiency, markedly outperforming compared methods in GFLOPs and Time. Specifically, CSP-MCIN reduces GFLOPs by 3.8 compared to the suboptimal TUFusion. Moreover, relative to U2Fusion and FusionGAN, its GFLOPs decrease substantially by 19.1 and 27.3, respectively, while the Time is shortened by 4.3 s and 4.6 s, respectively. These results demonstrate that CSP-MCIN achieves excellent fusion performance while maintaining high computational efficiency, highlighting its strong potential for practical applications.

4.7. Ablation Study

The design of the MID and the construction and optimization of the loss function are two core contributions of the proposed method. To thoroughly validate their effectiveness, systematic ablation experiments were conducted on the WOS dataset.

4.7.1. Effectiveness of the Multi-Scale Interaction Decoder

The MID aggregates semantic and detail features from different modalities through the HSFM and the LDFM. To assess the contributions of these two modules to fusion performance, CSP-MCIN models without HSFM (w/o HSFM) and without LDFM (w/o LDFM) are separately trained on the WOS dataset. Their quantitative results on the test dataset are summarized in Table 4. The results indicate that removing either HSFM or LDFM degrades the overall network performance. Specifically, removing LDFM slightly improves the SD and EN metrics, but all other metrics deteriorate. Removing HSFM leads to performance degradation across all metrics. These findings demonstrate that both HSFM and LDFM play indispensable roles in the decoder for generating high-quality fused images. Furthermore, to conduct a granular investigation into the performance contributions of the Cross-modal Transformer and GFU to the decoder, we conduct ablation studies by removing the attention mechanisms (w/o Atten) and replacing the GFU with a standard concatenation-based fusion. The corresponding experimental results are summarized in Table 4. It is observed that disabling the self-attention and cross-attention mechanisms leads to a decrease in EN, LIQE, and CLIP-IQA, while the CMMDF metric increases. While the CC metric remains stable, SD and VIFF show a marginal increase. Similarly, the removal of the GFU results in performance degradation across CC, EN, and the remaining three semantic-level metrics. Although the inclusion of the Transformer or GFU leads to a marginal reduction in SD and VIFF, the synergy between these two components overall enables CSP-MCIN to achieve superior fusion performance across the vast majority of evaluation metrics.

4.7.2. Effectiveness of Loss Formulations and Optimization Strategies

Loss Components and Optimization Strategies: The proposed loss function, integrated with a multi-objective optimization strategy, enables CSP-MCIN to strike a balance between learning cross-modal correlations and maintaining semantic consistency across SAR and OPT images. To evaluate the effects of individual loss components and the optimization strategy, CSP-MCIN models without the correlation loss L c o r (w/o L c o r ), without the semantic consistency loss L s e m (w/o L s e m ), and without PCGrad (w/o PCGrad) are separately trained on the WOS dataset. The corresponding results on the test dataset are presented in Table 4. It can be seen that removing any loss component or not employing the multi-objective optimization strategy reduces overall fusion performance. Specifically, removing either loss component decreases the CC, LIQE, and CLIP-IQA metrics while increasing the CMMD metric. Although SD and EN metrics show slight improvements without PCGrad, all other metrics deteriorate. These findings underscore that the synergy of L c o r , L s e m , and PCGrad facilitates the generation of superior fused images. Moreover, to further demonstrate the collective gain brought by these three mechanisms to the overall framework, we retrained and tested CSP-MCIN using a vanilla loss function. The results in Table 4 show a significant performance degradation across all metrics when the vanilla loss is applied, which substantiates the necessity of our proposed loss function for effective SAR-OPT image fusion.
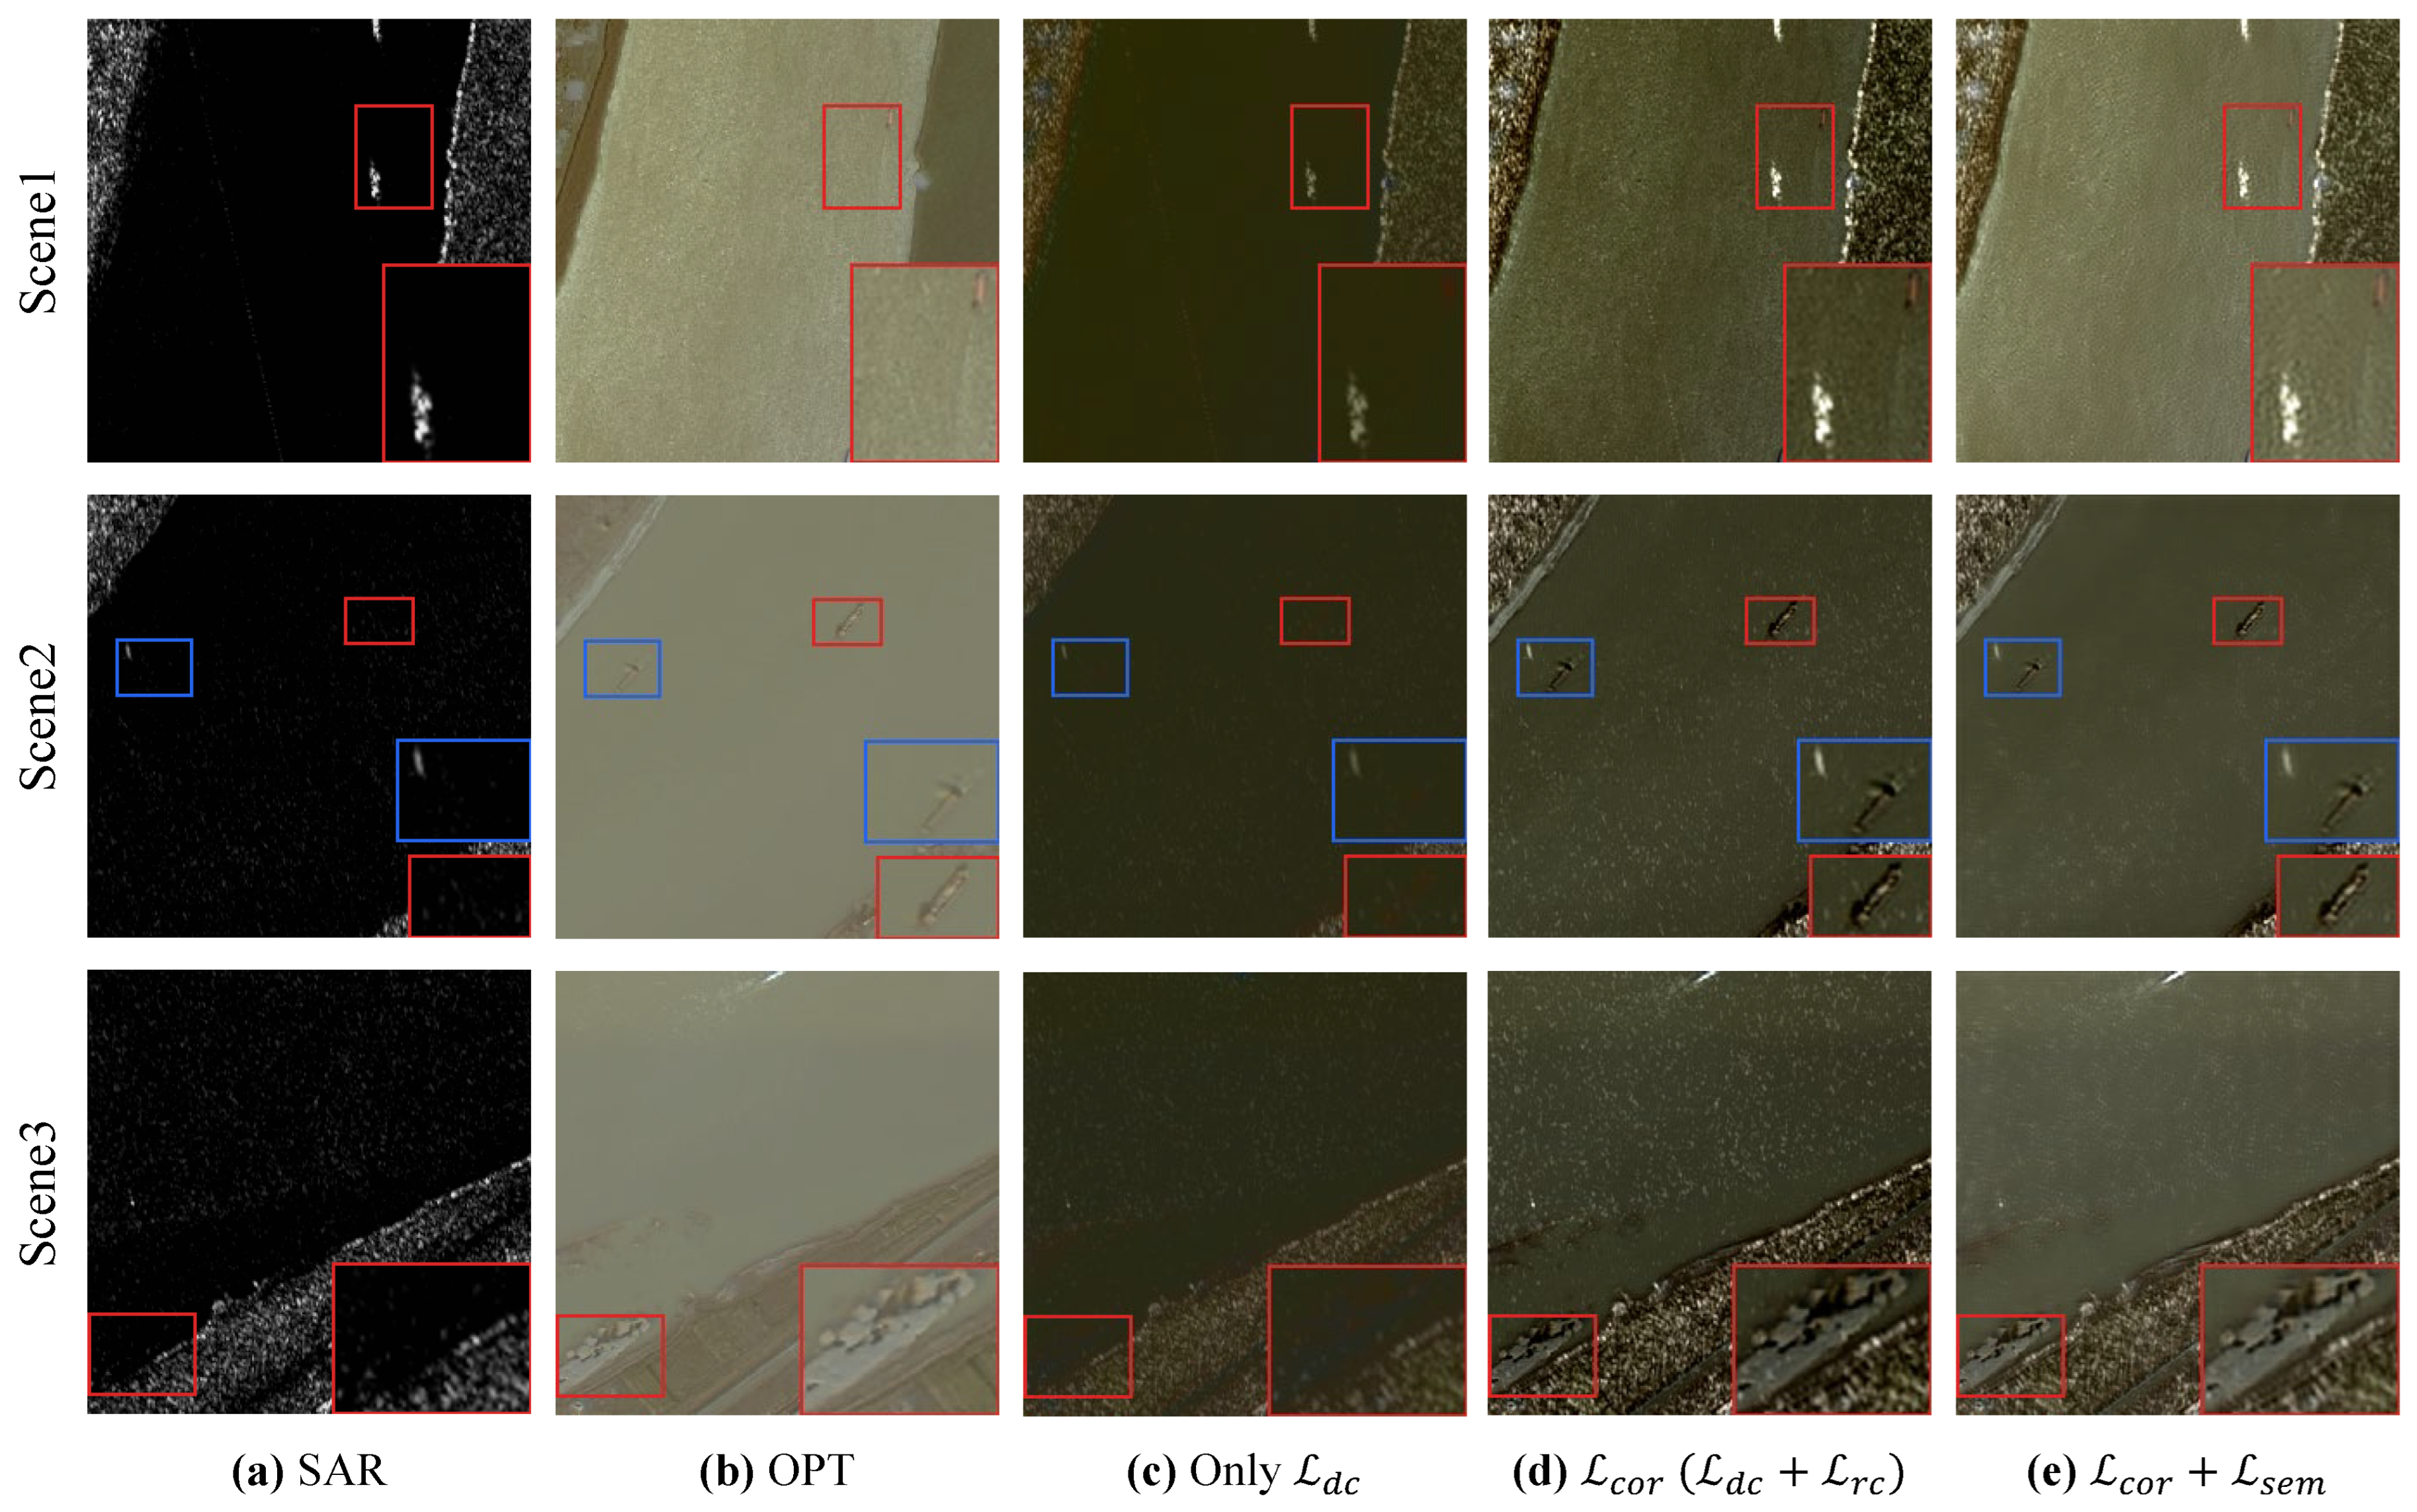
It is noteworthy that the proposed correlation loss L c o r features a dual-component architecture, consisting of the direct correlation loss L d c and the residual correlation loss L r c . To intuitively verify its efficacy in mitigating fusion conflicts between SAR and OPT imagery, Figure 7 presents a visual ablation study of CSP-MCIN under various loss configurations, including using only L d c , the complete correlation loss L c o r ( L d c + L r c ), and the full loss with semantic constraints ( L c o r + L s e m ). For a granular qualitative comparison, key local regions in each scene are highlighted and magnified. The results indicate that optimizing solely with L d c tends to enforce rigid pixel-level alignment, which leads to the mutual suppression of heterogeneous features. For instance, critical target information from the OPT images, such as the ships in Scenes 1 and 2 and the island in Scene3, exhibits significant loss or blurring in the fused outcomes. This confirms that in regions with low physical correlation, enforcing high correlation alone triggers severe modality bias. In contrast, the introduction of L r c substantially alleviates this issue. By leveraging a residual learning mechanism, it explicitly guides the network to preserve complementary features, thereby avoiding the semantic degradation caused by forcing divergent feature distributions together. Experimental results demonstrate that after incorporating L r c , the fused images successfully inherit both the structural textures from SAR and the rich details from OPT data, leading to a marked increase in overall information density. Furthermore, introducing the CLIP-based semantic loss L s e m provides high-level semantic supervision, which effectively suppresses artifacts and noise, yielding more refined results. In summary, L r c effectively mitigates the feature suppression inherent in single-correlation constraints, while L s e m further enhances the semantic consistency and visual quality of the fusion results.
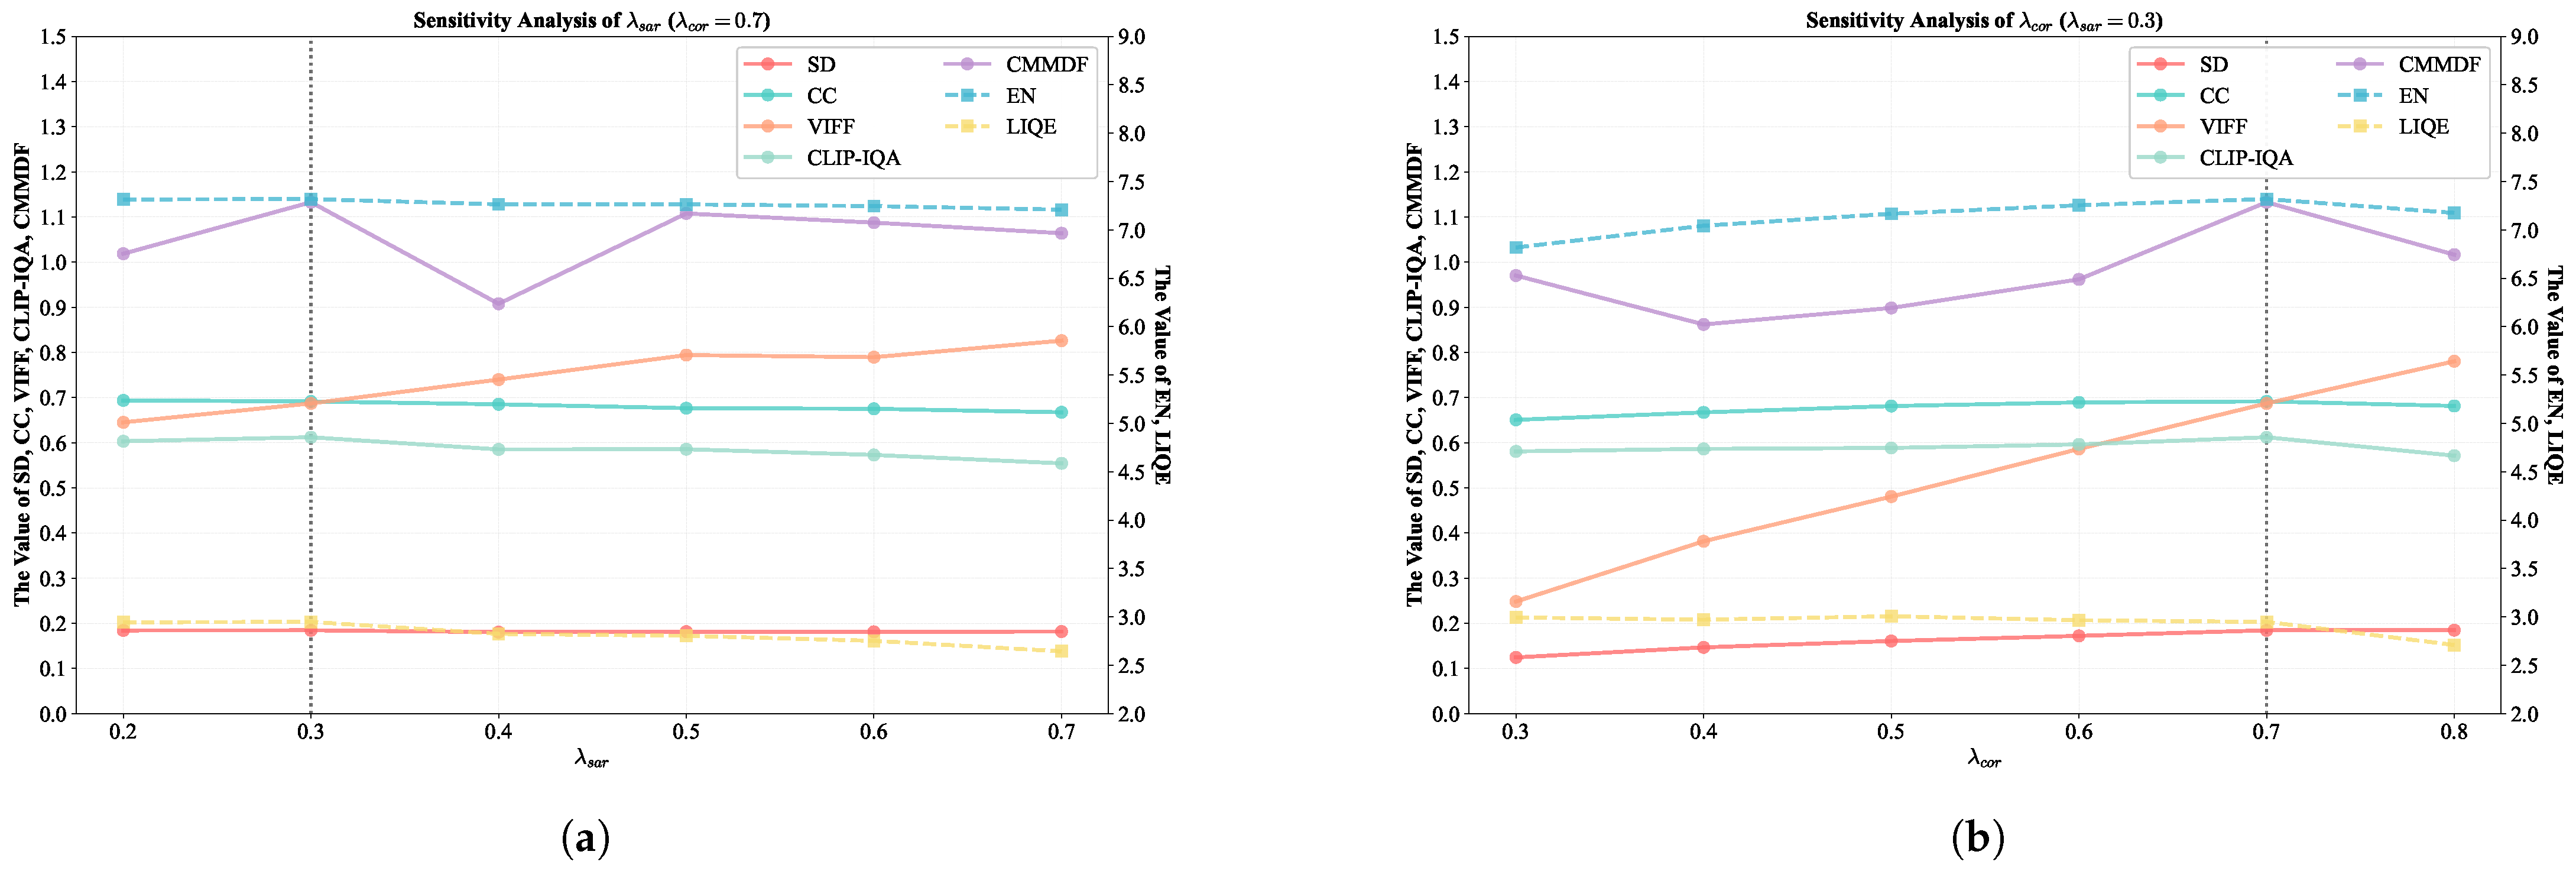
Sensitivity Analysis of Key Loss Weights: Since the developed loss function integrates multiple loss components, its performance may be influenced by the weight coefficient hyperparameters. To verify the robustness of the proposed loss function, we conduct a sensitivity analysis on the core weight parameters λ s a r and λ c o r . It should be clarified that due to the constraint relationships among certain parameters, namely λ o p t = 1 λ s a r and λ s e m = 1 λ c o r , the analysis of λ s a r and λ c o r is substantially equivalent to the analysis of λ o p t and λ s e m . The quantitative evaluation results for different weight configurations on the WOS dataset are presented in Table 5. To more intuitively reveal the impact of weight changes on fusion performance, we plot the corresponding performance trend line charts as shown in Figure 8. As illustrated in Figure 8a, when λ c o r is fixed at 0.7, all evaluation metrics exhibit favorable stability without drastic fluctuations as λ s a r gradually increases from 0.2 to 0.7. As shown in Figure 8b, when λ s a r is fixed at 0.3, all metrics remain within a relatively stable range as λ c o r increases from 0.3 to 0.8, with the exception of the VIFF metric, which shows a distinct upward trend. This phenomenon indicates that the VIFF metric is more sensitive to the correlation weight λ c o r . The underlying reason is that strengthening the correlation constraint enables the fused image to capture the structural features of the source modalities more closely in the pixel domain, thereby significantly enhancing visual information fidelity. In summary, CSP-MCIN demonstrates robust performance across most metrics under diverse weight configurations. Moreover, inspired by these findings, we will further explore adaptive weighting mechanisms for the loss function in the future to achieve collaborative optimization of sensitive metrics like VIFF alongside overall performance.

4.7.3. Effectiveness of Cross-Modal Interaction and Gated Fusion Mechanisms

To intuitively validate the superiority of the proposed Cross-modal Transformer and GFU in terms of feature interaction and computational efficiency, we conduct a comparative analysis by replacing these modules in CSP-MCIN with the CMFC and CADF from CFCFNet [43]. Table 6 summarizes the performance and complexity metrics of the resulting model variant. The experimental results demonstrate that CSP-MCIN consistently outperforms the modified variant across all performance indicators. This proves that the Cross-modal Transformer and GFU can more effectively capture and aggregate complementary cross-modal features from SAR and OPT images, thereby enhancing the quality of the fused images. Regarding computational complexity, CSP-MCIN exhibits distinct advantages in Params, Time, and Mem, despite a higher GFLOP count, suggesting that the synergistic use of the Cross-modal Transformer and GFU yields superior overall computational efficiency. The elevated GFLOPs are primarily attributed to the multiple self-attention and cross-attention operations executed during the feature fusion stage, which will be further optimized through lightweight designs in future work to better balance computational overhead and model performance.

4.7.4. Necessity of PCGrad

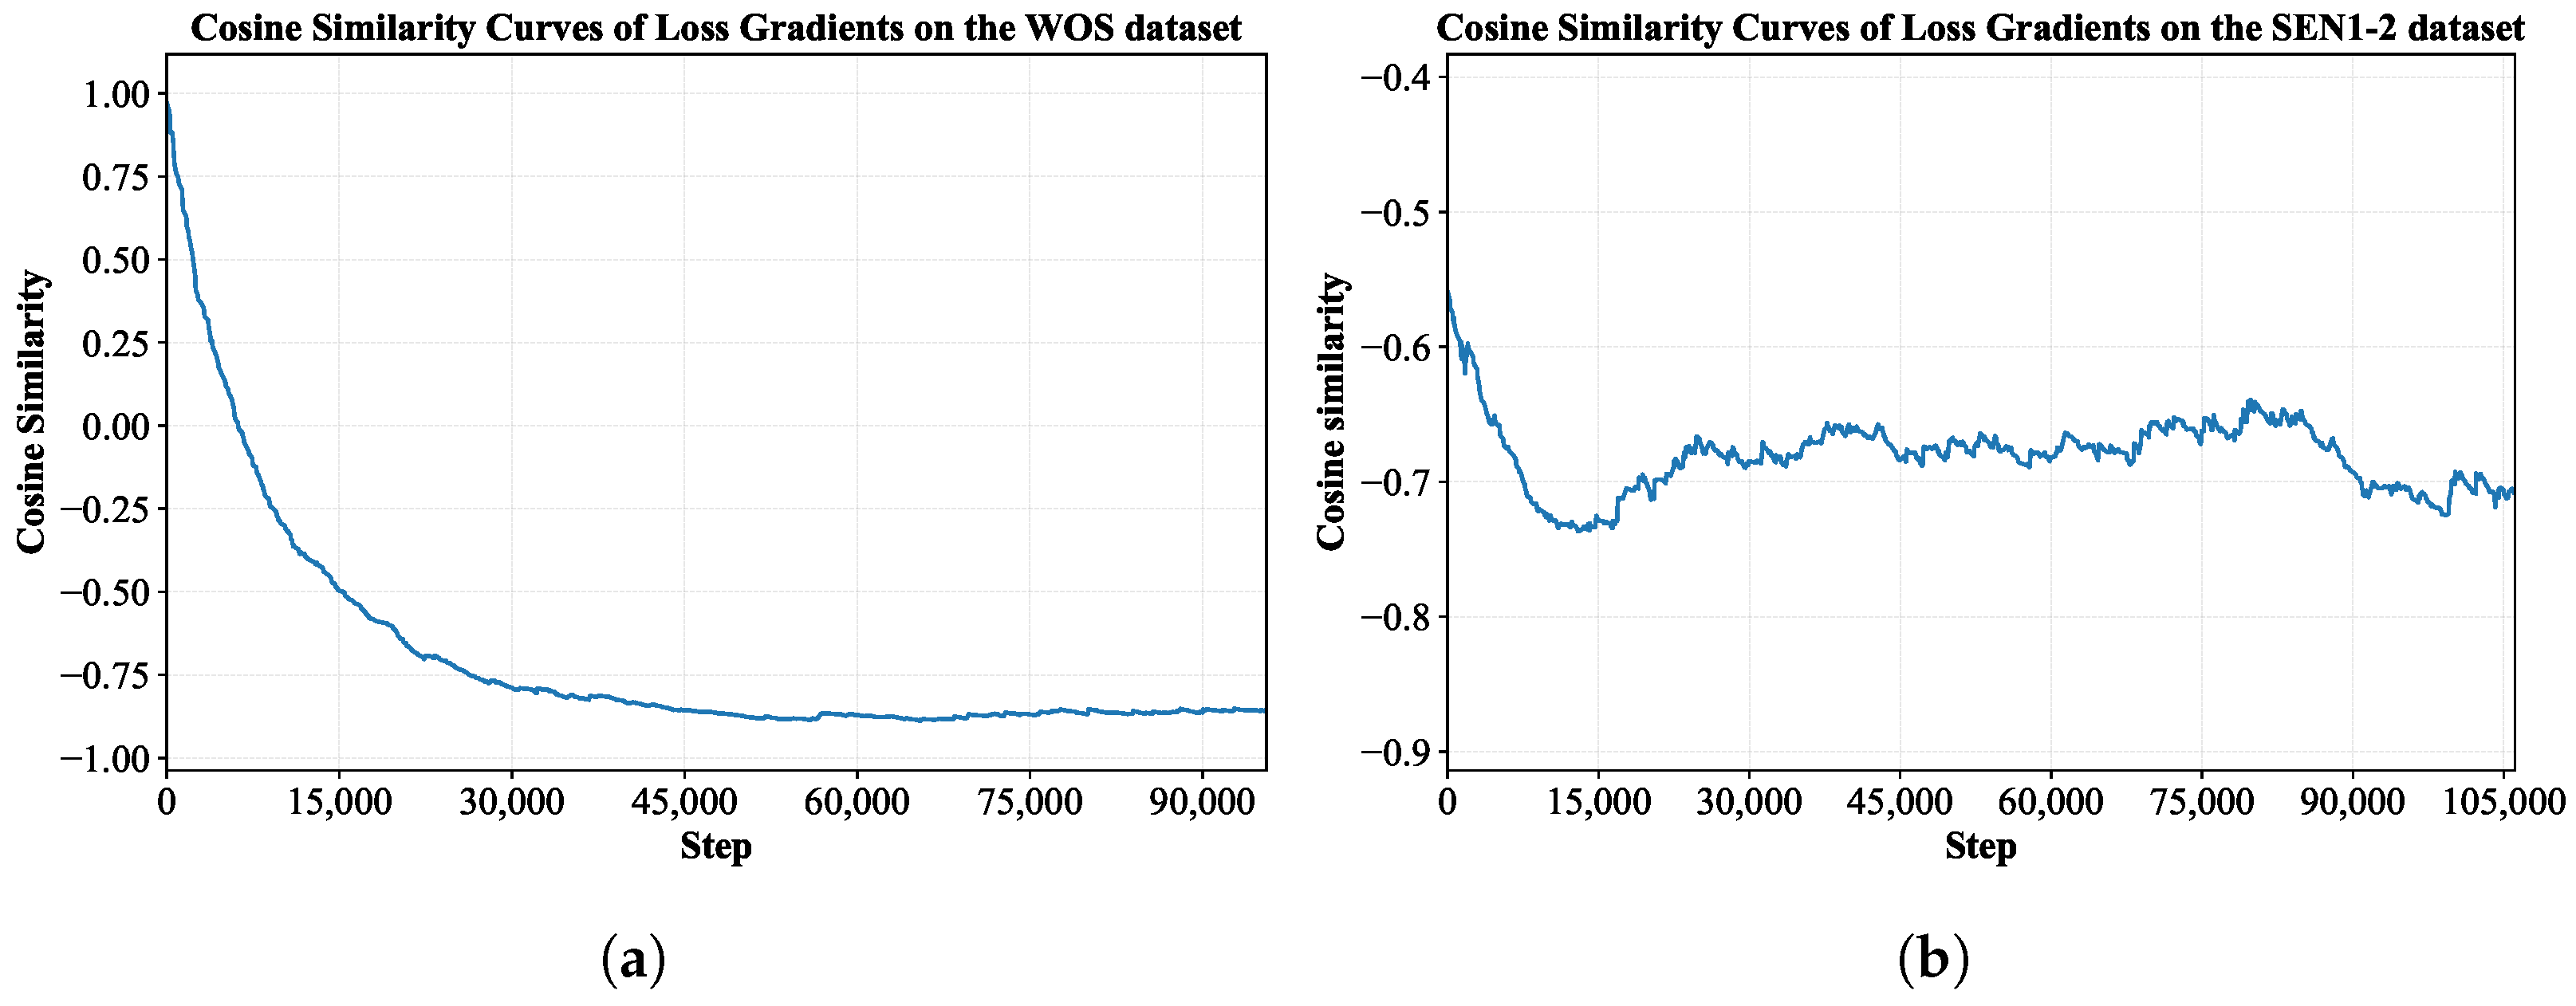
To verify the necessity of the PCGrad strategy in SAR-OPT image fusion, we monitor the evolutionary trend of the gradient cosine similarity between the L s a r and L o p t in CSP-MCIN during the entire training process, as illustrated in Figure 9. It can be found that with the increase in training steps, the gradient directions of the two modalities exhibit persistent and significant conflicts. Specifically, on the WOS dataset, the gradients of the two modalities maintain a certain degree of similarity in the early stages of training. However, as iterations proceed, the cosine similarity drops sharply and eventually converges to approximately −0.85, indicating a strong negative correlation. On the SEN1-2 dataset, the cosine similarity remains at a consistently low level throughout the training cycle. This empirical analysis clearly confirms the existence of severe gradient direction contradictions during the fusion optimization process of heterogeneous modalities. Consequently, the introduction of the PCGrad strategy to dynamically rectify conflicting gradients and seek an update direction that balances both modalities is crucial for enhancing model performance. This finding is highly consistent with the performance gains brought by PCGrad in the aforementioned ablation experiments, fully demonstrating its necessity within the CSP-MCIN framework.
To further evaluate the superiority of PCGrad, we conduct comparative training and testing of CSP-MCIN on the WOS dataset using a traditional weighted loss (WL) function. The loss weights are determined through grid search technology and satisfy the constraint that their sum equals 1. As illustrated in Table 7, after incorporating PCGrad, the network demonstrates an overall performance that surpasses the simple weighting scheme. Specifically, while the SD, CC, and EN metrics achieve the second-best results, all other key metrics rank first. This further confirms that the gradient correction function of PCGrad can effectively alleviate the optimization impasse in heterogeneous information fusion, guiding the network to generate fused images with higher quality and richer semantics.

4.8. Generalization and Transferability Analysis

To further verify the generalization performance of the proposed method, we first apply the CSP-MCIN approach to the QS dataset with high spatial resolution and the OGSOD dataset with low spatial resolution. Additionally, cross-validation experiments are conducted among the WOS, SEN1-2, and QS datasets, aiming to evaluate the performance of models pre-trained on a specific dataset when directly transferred to other unseen scenarios.

4.8.1. Generalization to Diverse SAR-OPT Datasets

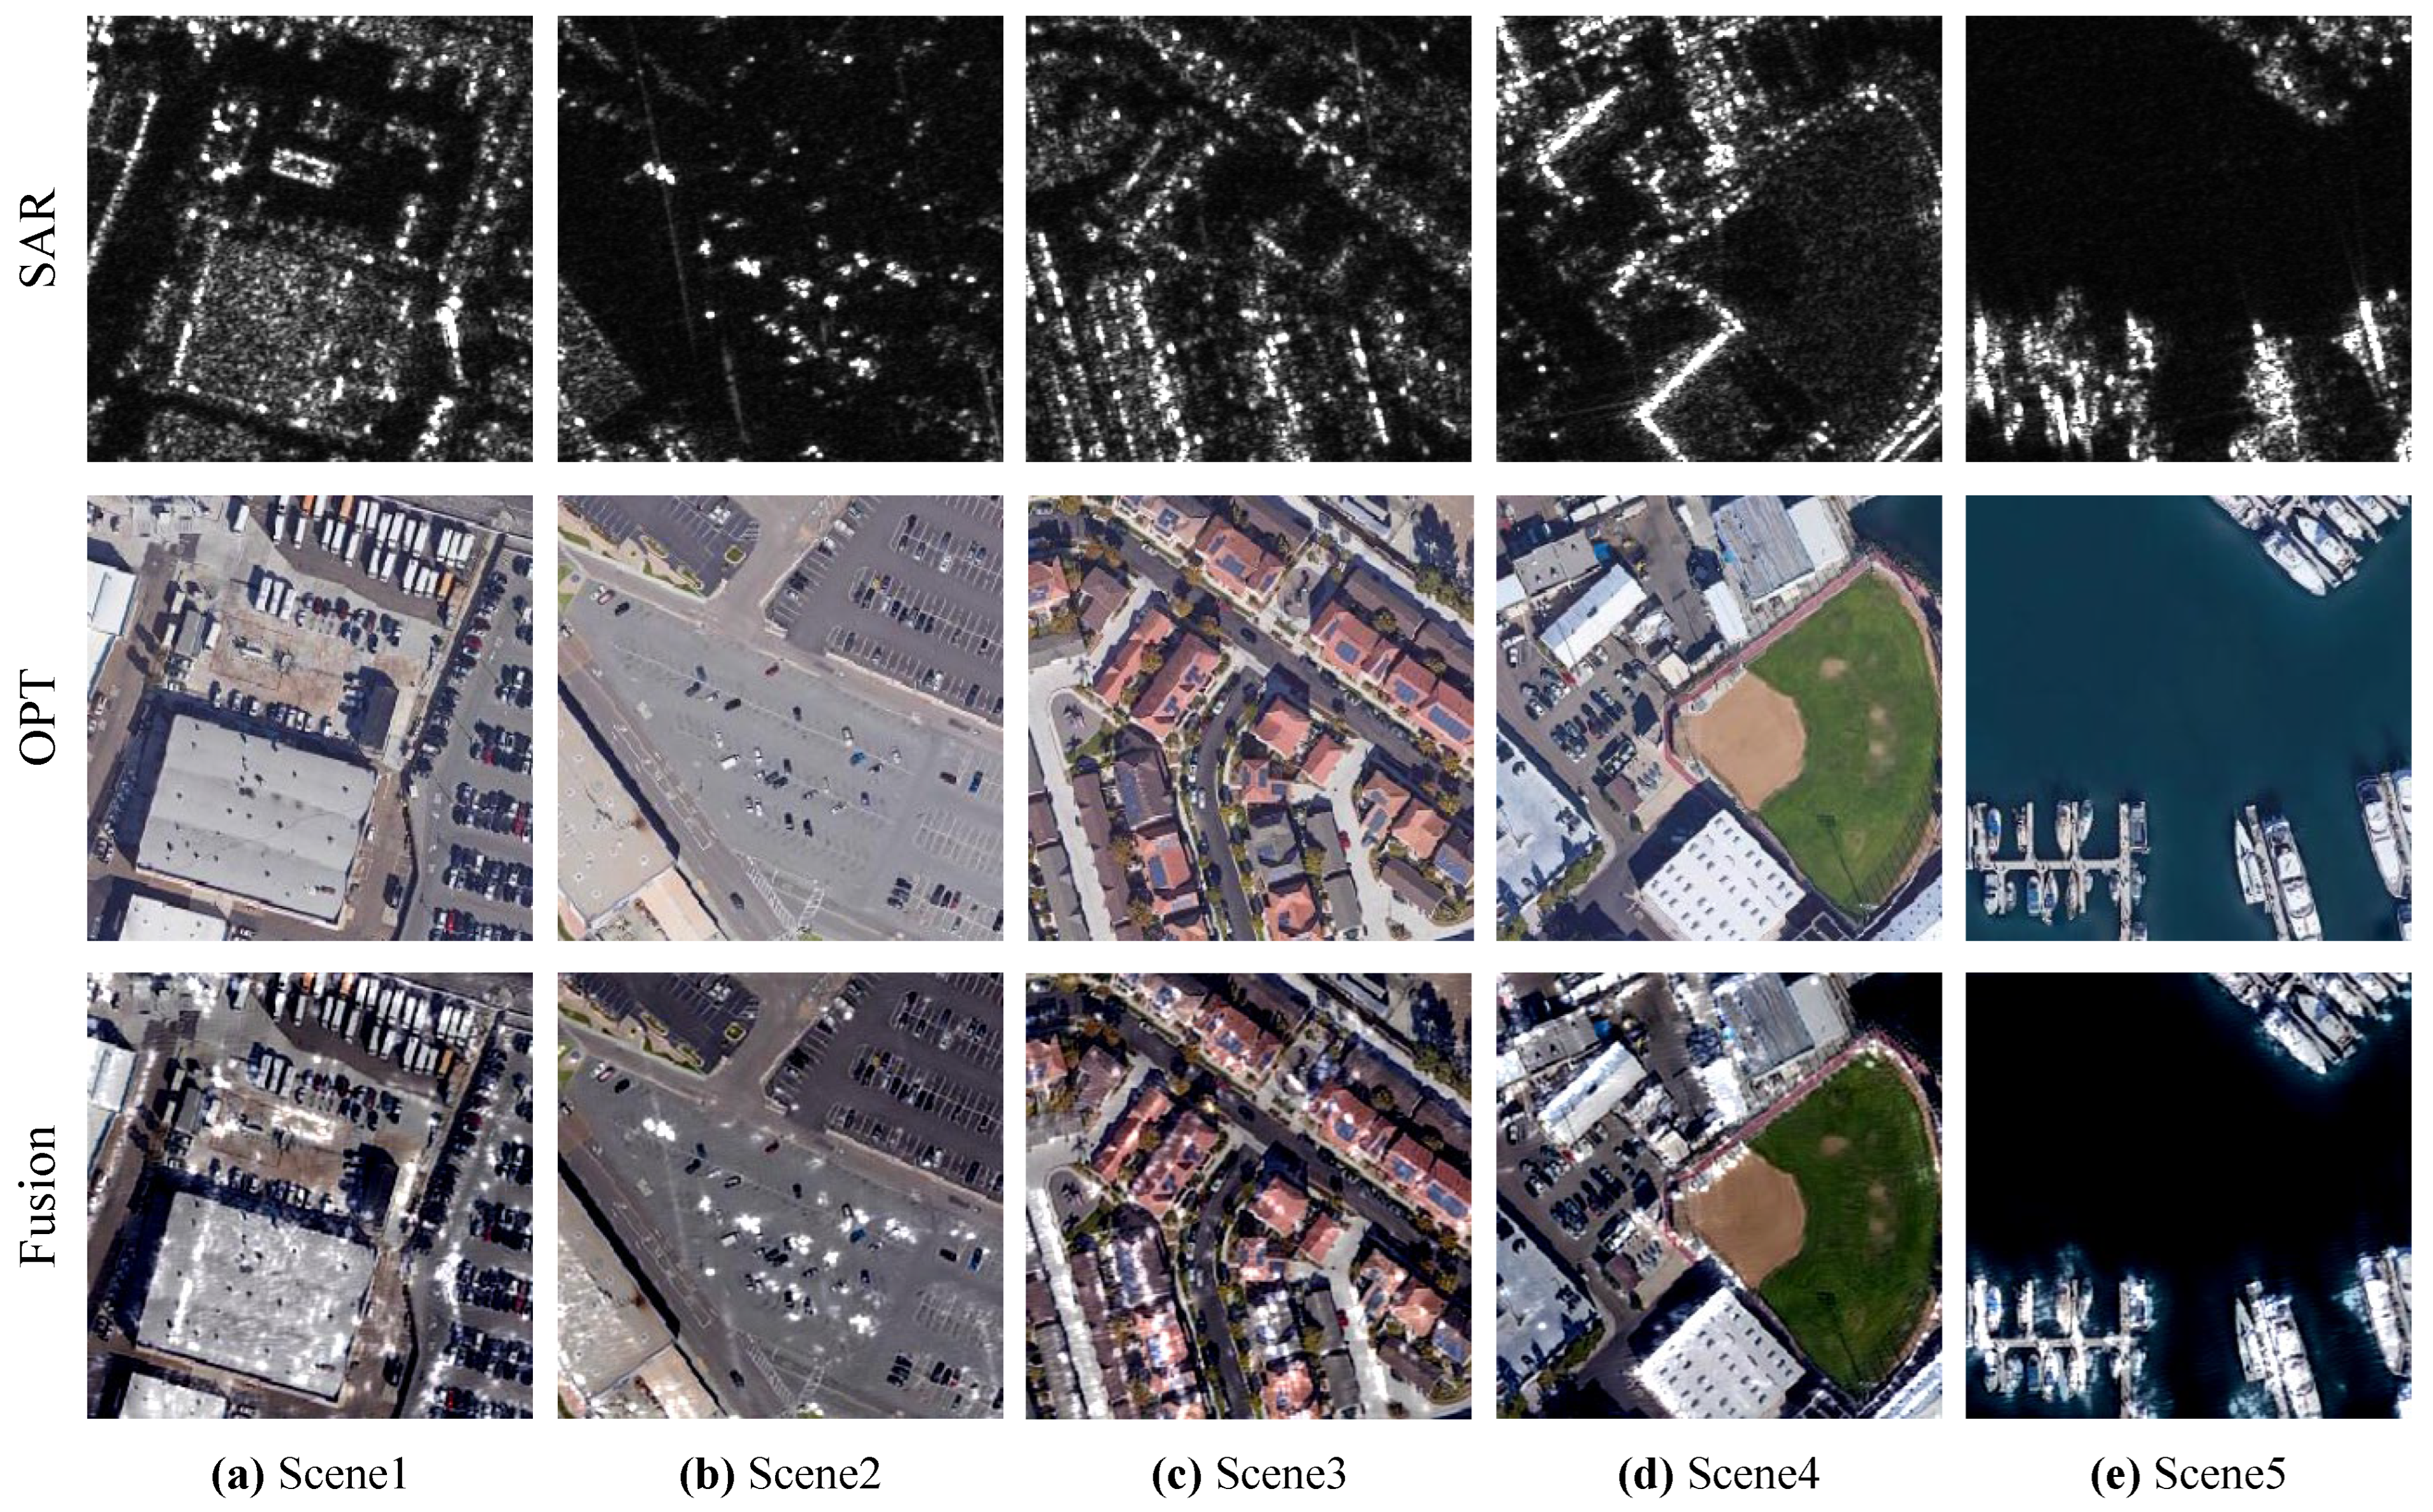
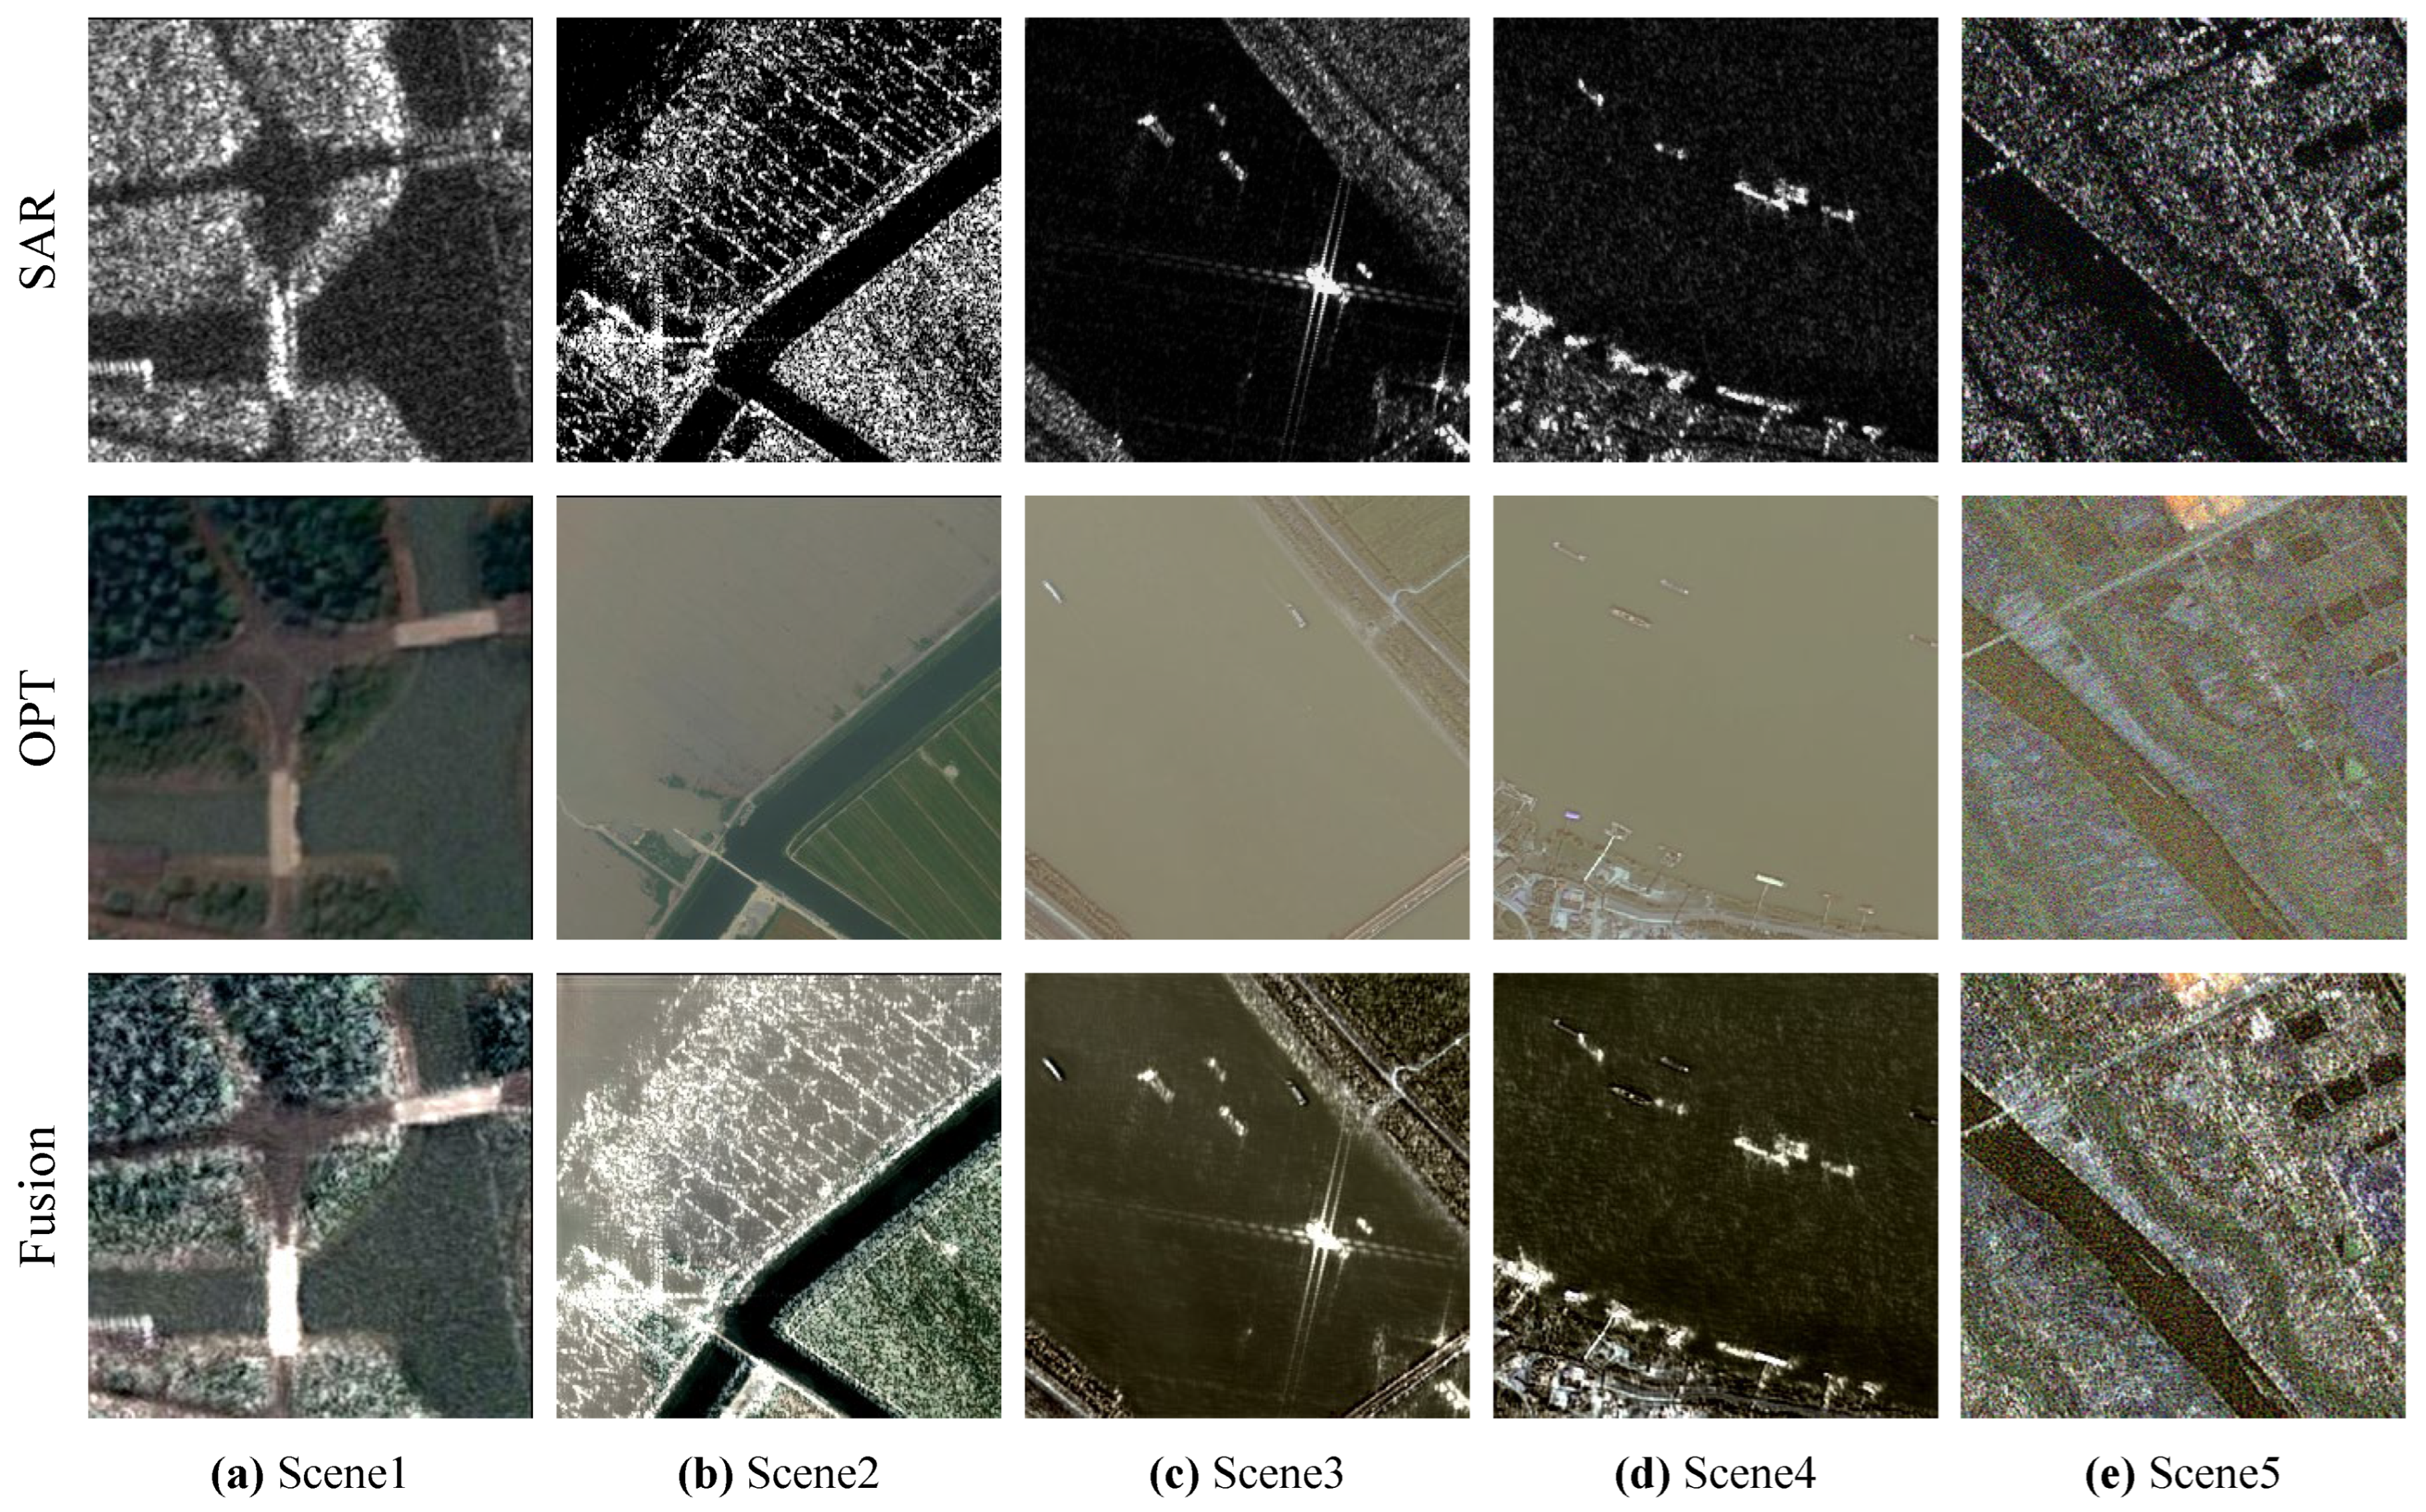
Figure 10 and Figure 11 present representative fusion results of the proposed CSP-MCIN on the QS and OGSOD datasets, respectively. As illustrated in Figure 10, for the QS dataset with a spatial resolution of 1m, CSP-MCIN effectively integrates the structural salient characteristics of OPT and SAR images. For instance, in Scenes 1 and 2, the fusion results capture the backscatter intensity of vehicles that is absent in the OPT modality. In Scenes 3 and 4, the fusion results inherit SAR intensity information, providing significant visual enhancement for rooftops and street areas. In Scene 5, the features of ships and port regions are more pronounced. However, for small-scale targets such as sedans, the fused images exhibit blurred edge details, hindering effective discrimination. This phenomenon can be attributed partly to the inherent low discriminability of small targets in source images and partly to the limited capability of the network in extracting fine-grained local features. Furthermore, the proposed model is applied to the OGSOD dataset, which is characterized by inferior source quality and a coarse spatial resolution of 20m. As shown in Figure 11, the fused image in Scene 1 emphasizes the visual characteristics of the bridges. Scene 2 injects SAR structural information into regions obscured in the OPT modality. Scenes 3 and 4 successfully integrate the visual structures of ships from both modalities. Nevertheless, due to the limited spatial resolution of the source images, the resulting land cover details, such as the roads in Scene 1 and the agricultural strips in Scene 2, remain indistinct and difficult to distinguish. Moreover, high noise levels in the source modalities lead to significant artifacts in the fusion results, particularly in the farmland of Scene 2 and the entirety of Scene 5. This suggests that the network lacks sufficient denoising robustness, allowing noise interference to exacerbate the blurring of local details. Motivated by these observations, future work will focus on developing fusion methods with stronger local detail extraction and denoising capabilities. Specifically, adopting more powerful feature extraction backbones could effectively capture the fine-grained local details of small-scale targets from OPT images. Furthermore, designing specialized denoisers to extract clean and effective structural features from SAR images for subsequent injection into the OPT modality is a promising direction. Finally, the introduction of appropriate super-resolution techniques could be employed to enhance the clarity of geographic targets, thereby making them more easily distinguishable.

4.8.2. Cross-Dataset Transferability Analysis

To verify whether a network trained on a specific dataset can be directly transferred to new data from different scenes without fine-tuning, we conduct cross-validation experiments among the WOS, SEN1-2, and QS datasets, with the results summarized in Table 8. The experimental results indicate that when CSP-MCIN is pre-trained on a heterogeneous dataset and directly transferred to a target test dataset, its performance does not exhibit significant degradation, and certain metrics even show improvement. Specifically, when WOS is used as the test dataset, the model pre-trained on SEN1-2 outperforms the model trained locally on WOS in terms of EN, LIQE, and CLIP-IQA metrics. Similarly, when using SEN1-2 as the test dataset, models pre-trained on WOS or QS demonstrate competitive advantages over the local model in terms of SD, EN, and CLIP-IQA. However, the locally trained models still maintain a stable advantage in the CC, VIFF, and CMMDF metrics. This is primarily attributed to the domain shift caused by differences in spatial resolution scales, sensor imaging parameters, and geographic scene distributions across different datasets. These factors limit the alignment precision of multi-scale fine-grained features when the model processes image data with substantial distributional discrepancies. In conclusion, the experimental results effectively demonstrate that CSP-MCIN possesses a favorable generalization performance. Under conditions where the distributions of training and testing data are relatively similar, the model can be effectively applied to new scenes with distinct land cover features and resolutions without the need for retraining or fine-tuning. This significantly enhances the universality and engineering value of the proposed method in practical remote sensing tasks. For scenarios with significant differences in spatial resolution or noise characteristics, appropriate retraining or the introduction of domain adaptation strategies [66] may further enhance model performance.

5. Discussion

Through extensive comparative experiments and ablation studies, we systematically validate the effectiveness of the proposed CSP-MCIN framework and its associated loss function for SAR-OPT image fusion. Building upon these results, we conduct a profound analysis of the experimental outcomes and discuss potential directions for future improvements. Evaluation results on the WOS and SEN1-2 datasets demonstrate that CSP-MCIN outperforms existing SOTA fusion methods in both overall performance and visual quality. Nevertheless, the experimental data also reveal that the fusion results generated by CSP-MCIN do not achieve the absolute best values across all evaluation metrics. We attribute this phenomenon to two primary factors. The first is the inherent trade-off between high-level semantic alignment and fine-grained spatial texture preservation. Specifically, the introduction of L s e m to enforce cross-modal semantic mapping between the fused image and source modalities may bring a subtle smoothing effect on certain pixel-level details. This consequently affects metrics that are sensitive to local intensity variations, such as SD, CC, and VIFF. The second factor involves the current architectural bottleneck in handling intense noise interference. Due to the absence of a dedicated denoising mechanism, the inherent speckle noise in SAR images partially penetrates into the fusion results, thereby compromising the stability of perception-oriented metrics like LIQE. To address these limitations, future research will prioritize the integration of a local gradient protection term into the loss function and the implementation of finer-grained adaptive weighting for L c o r and L s e m to achieve a dynamic equilibrium between semantic consistency and detail preservation. In addition, we plan to insert a specialized SAR structure extraction module to strip noise interference and inject cleaner structural priors before the fusion process, thereby suppressing noise propagation while enhancing detail recovery.
Further investigation through t-SNE visualization of feature embeddings at different HSFM stages indicates that this module effectively achieves complementary enhancement and alignment of multi-modal features in the high-level semantic space. Additionally, model complexity analysis shows that CSP-MCIN significantly outperforms compared methods in terms of GFLOPs and Time, proving its superior computational efficiency. Although it exhibits a slight disadvantage in Params and Mem, future incorporation of knowledge distillation or structural reparameterization techniques holds the potential to achieve lightweight deployment without sacrificing performance.
In the ablation study, we confirm the positive contributions of HSFM and LDFM to maintaining structural and semantic consistency while revealing the synergistic effects of L c o r , L s e m , and the PCGrad optimization strategy. In particular, the introduction of L r c within L c o r effectively mitigates the complementary information loss caused by L d c when forcibly pulling together heterogeneous feature distributions, which is especially significant for regions with low physical correlation. Moreover, sensitivity analysis regarding loss weights verifies the robustness of the model against hyperparameter settings. Inspired by this, future work will explore adaptive weighting mechanisms to collaboratively stabilize the optimization of sensitive metrics like VIFF. Furthermore, replacing the cross-modal Transformer and GFU with the corresponding modules from CFCFNet again confirms the advantages of our proposed architecture in cross-modal interaction and semantic fusion. Analysis of the gradient cosine similarity curves between L c o r and L s e m during training further substantiates the necessity of PCGrad in alleviating cross-modal conflicts and promoting collaborative parameter updates from a numerical optimization perspective.
Finally, the validation on the QS and OGSOD datasets with distinct ground resolutions, along with cross-dataset experiments, underscores the promising generalization potential of our CSP-MCIN. The results on the QS and OGSOD datasets motivate our future research to further enhance the denoising capabilities of the model and its ability to extract and reinforce fine-grained edge details for small targets. Cross-dataset experiments indicate that the model exhibits reliable generalization performance when the distribution of training and testing data is relatively similar. For scenarios with significant discrepancies in data distribution, incorporating domain adaptation strategies or performing targeted fine-tuning will be key pathways to further enhance model robustness.

6. Conclusions

In this paper, we propose a SAR-OPT image fusion method, termed CSP-MCIN, for generating fused images with enhanced cross-modal feature representations. Specifically, CSP-MCIN consists of two ResNet-18-based MEs and an MID. The MEs are responsible for extracting shallow details and deep semantic features from SAR and OPT images, respectively. The MID is composed of four HSFMs and one LDFM. The HSFMs aggregate high-level semantic features from different modalities across multiple scales, and the LDFM injects high-frequency detail features and original modal observations into the fused semantic representations to decode high-quality fused images. Comprehensive experimental results on various SAR-OPT image datasets demonstrate that the proposed method achieves significant advantages in both fusion performance and computational efficiency.
In future research, we aim to further extend and deepen this work from multiple dimensions. First, we will delve into the mathematical foundations of the loss functions to enhance their theoretical applicability in processing extreme heterogeneity or more complex fusion scenarios from an optimization perspective. Building upon this, we plan to construct a local gradient protection mechanism and introduce adaptive weight allocation strategies to achieve a dynamic equilibrium between semantic consistency and fine detail preservation. Subsequently, we intend to integrate specialized SAR structure extraction and enhancement modules into the existing network architecture to strip speckle noise and inject cleaner structural priors. Finally, we will explore techniques such as knowledge distillation or structural reparameterization to achieve lightweight model deployment while maintaining superior performance.

Author Contributions

Conceptualization, X.H., L.Z. and C.F.; Methodology, X.H., L.Z., C.F. and H.C.; Software, X.H., L.Z. and C.F.; Validation, L.Z., C.F., H.C. and Y.L.; Formal analysis, X.H. and C.F.; Resources, L.L. and H.L.; Data curation, H.C. and Y.L.; Writing—original draft preparation, X.H., L.Z. and C.F.; Writing—review and editing, H.C., L.L. and H.L.; Visualization, L.Z., C.F. and Y.L.; Supervision, L.L. and H.L. All authors have read and agreed to the published version of the manuscript.

Funding

This research was funded by the National Natural Science Foundation of China under Grant No. 62501626; funded by the Independent Research Project of the National Key Laboratory of Big Data and Decision.

Data Availability Statement

The WOS, SEN1-2, QS, and OGSOD datasets are all publicly available and can be accessed at https://github.com/AmberHen/WHU-OPT-SAR-dataset (accessed on 1 December 2025), https://mediatum.ub.tum.de/1436631 (accessed on 1 December 2025), https://github.com/yaoxu008/QXS-SAROPT (accessed on 1 December 2025), and https://github.com/wchao0601/GaLD (accessed on 1 December 2025), respectively. The source code of the proposed method will be released at https://github.com/hnu-VML/fcg (accessed on 19 January 2026).

Conflicts of Interest

The authors declare no conflicts of interest.

Appendix A

Table A1 reports the specific values of the hyperparameters involved in the proposed loss function, which are empirically determined. In particular, w 0 corresponds to the stem layer of the SARCLIP-RN50 and RemoteCLIP-RN50 image encoders, and { w l } l = 1 4 correspond to their i-th feature extraction stages, respectively.
Table A1. Specific hyperparameter settings of the proposed loss function.
λ sar λ opt λ cor λ sem λ cor 1 λ cor 2 λ feat λ nce w 0 w 1 w 2 w 3 w 4
0.30.70.70.30.40.60.70.30.50.20.10.10.1

References

  1. Wang, Z.; Zhao, L.; Zhang, J.; Song, R.; Song, H.; Meng, J.; Wang, S. Multi-text guidance is important: Multi-modality image fusion via large generative vision-language model. Int. J. Comput. Vis. 2025, 133, 4646–4668. [Google Scholar] [CrossRef]
  2. Wang, Y.; Zhang, W.; Chen, W.; Chen, C.; Liang, Z. MFFnet: Multimodal Feature Fusion Network for Synthetic Aperture Radar and Optical Image Land Cover Classification. Remote Sens. 2024, 16, 2459. [Google Scholar] [CrossRef]
  3. Gao, G.; Wang, M.; Zhang, X.; Li, G. DEN: A New Method for SAR and Optical Image Fusion and Intelligent Classification. IEEE Trans. Geosci. Remote Sens. 2025, 63, 5201118. [Google Scholar] [CrossRef]
  4. Wang, C.; Lu, W.; Li, X.; Yang, J.; Luo, L. M4-SAR: A Multi-Resolution, Multi-Polarization, Multi-Scene, Multi-Source Dataset and Benchmark for Optical-SAR Fusion Object Detection. arXiv 2025, arXiv:2505.10931. [Google Scholar]
  5. Li, J.; Zhang, J.; Yang, C.; Liu, H.; Zhao, Y.; Ye, Y. Comparative analysis of pixel-level fusion algorithms and a new high-resolution dataset for SAR and optical image fusion. Remote Sens. 2023, 15, 5514. [Google Scholar] [CrossRef]
  6. Kulkarni, S.C.; Rege, P.P. Pixel level fusion techniques for SAR and optical images: A review. Inf. Fusion 2020, 59, 13–29. [Google Scholar] [CrossRef]
  7. Sui, C.; Yang, G.; Hong, D.; Wang, H.; Yao, J.; Atkinson, P.M.; Ghamisi, P. IG-GAN: Interactive Guided Generative Adversarial Networks for Multimodal Image Fusion. IEEE Trans. Geosci. Remote Sens. 2024, 62, 5634719. [Google Scholar] [CrossRef]
  8. Ma, J.; Tang, L.; Fan, F.; Huang, J.; Mei, X.; Ma, Y. SwinFusion: Cross-domain long-range learning for general image fusion via swin transformer. IEEE/CAA J. Autom. Sin. 2022, 9, 1200–1217. [Google Scholar] [CrossRef]
  9. Zhao, Y.; Zheng, Q.; Zhu, P.; Zhang, X.; Ma, W. TUFusion: A transformer-based universal fusion algorithm for multimodal images. IEEE Trans. Circuits Syst. Video Technol. 2023, 34, 1712–1725. [Google Scholar] [CrossRef]
  10. Tang, L.; Deng, Y.; Yi, X.; Yan, Q.; Yuan, Y.; Ma, J. DRMF: Degradation-robust multi-modal image fusion via composable diffusion prior. In Proceedings of the ACM International Conference on Multimedia, Melbourne, Australia, 28 October–1 November 2024; pp. 8546–8555. [Google Scholar]
  11. Zhang, H.; Cao, L.; Zuo, X.; Shao, Z.; Ma, J. OmniFuse: Composite Degradation-Robust Image Fusion with Language-Driven Semantics. IEEE Trans. Pattern Anal. Mach. Intell. 2025, 47, 7577–7595. [Google Scholar] [CrossRef]
  12. Zhao, Z.; Deng, L.; Bai, H.; Cui, Y.; Zhang, Z.; Zhang, Y.; Qin, H.; Chen, D.; Zhang, J.; Wang, P.; et al. Image fusion via vision-language model. In Proceedings of the International Conference on Machine Learning, PMLR, Vienna, Austria, 21–27 July 2024. [Google Scholar]
  13. Singh, S.; Saber, E.; Markopoulos, P.P.; Heard, J. Regulating modality utilization within multimodal fusion networks. Sensors 2024, 24, 6054. [Google Scholar] [CrossRef]
  14. Pal, S.; Majumdar, T.; Bhattacharya, A.K. ERS-2 SAR and IRS-1C LISS III data fusion: A PCA approach to improve remote sensing based geological interpretation. ISPRS J. Photogramm. Remote Sens. 2007, 61, 281–297. [Google Scholar] [CrossRef]
  15. Chen, C.M.; Hepner, G.; Forster, R. Fusion of hyperspectral and radar data using the IHS transformation to enhance urban surface features. ISPRS J. Photogramm. Remote Sens. 2003, 58, 19–30. [Google Scholar] [CrossRef]
  16. Yang, J.; Ren, G.; Ma, Y.; Fan, Y. Coastal wetland classification based on high resolution SAR and optical image fusion. In Proceedings of the IEEE International Geoscience and Remote Sensing Symposium, Beijing, China, 10–15 July 2016; pp. 886–889. [Google Scholar]
  17. Burt, P.J.; Adelson, E.H. The Laplacian pyramid as a compact image code. In Readings in Computer Vision; Elsevier: Amsterdam, The Netherlands, 1987; pp. 671–679. [Google Scholar]
  18. Liu, Y.; Jin, J.; Wang, Q.; Shen, Y.; Dong, X. Region level based multi-focus image fusion using quaternion wavelet and normalized cut. Signal Process. 2014, 97, 9–30. [Google Scholar] [CrossRef]
  19. Kong, W.; Lei, Y.; Lei, Y.; Zhang, J. Technique for image fusion based on non-subsampled contourlet transform domain improved NMF. Sci. China Inf. Sci. 2010, 53, 2429–2440. [Google Scholar] [CrossRef]
  20. Kulkarni, S.C.; Rege, P.P.; Parishwad, O. Hybrid fusion approach for synthetic aperture radar and multispectral imagery for improvement in land use land cover classification. J. Appl. Remote Sens. 2019, 13, 034516. [Google Scholar] [CrossRef]
  21. Chong, X.J.; Xuejiao, C. Comparative analysis of different fusion rules for SAR and multi-spectral image fusion based on NSCT and IHS transform. In Proceedings of the International Conference on Computer and Computational Sciences, Porto, Portugal, 21–23 October 2015; IEEE: New York, NY, USA, 2015; pp. 271–274. [Google Scholar]
  22. Zhang, W.; Yu, L. SAR and Landsat ETM+ image fusion using variational model. In Proceedings of the International Conference on Computer and Communication Technologies in Agriculture Engineering, Chengdu, China, 12–13 June 2010; IEEE: New York, NY, USA, 2010; Volume 3, pp. 205–207. [Google Scholar]
  23. Ghahremani, M.; Ghassemian, H. A compressed-sensing-based pan-sharpening method for spectral distortion reduction. IEEE Trans. Geosci. Remote Sens. 2015, 54, 2194–2206. [Google Scholar] [CrossRef]
  24. Li, H.; Wu, X.J. DenseFuse: A fusion approach to infrared and visible images. IEEE Trans. Image Process. 2018, 28, 2614–2623. [Google Scholar] [CrossRef]
  25. Li, H.; Wu, X.J.; Durrani, T. NestFuse: An infrared and visible image fusion architecture based on nest connection and spatial/channel attention models. IEEE Trans. Instrum. Meas. 2020, 69, 9645–9656. [Google Scholar] [CrossRef]
  26. Li, H.; Wu, X.J.; Kittler, J. RFN-Nest: An end-to-end residual fusion network for infrared and visible images. Inf. Fusion 2021, 73, 72–86. [Google Scholar] [CrossRef]
  27. Xu, H.; Zhang, H.; Ma, J. Classification saliency-based rule for visible and infrared image fusion. IEEE Trans. Comput. Imaging 2021, 7, 824–836. [Google Scholar] [CrossRef]
  28. Ye, Y.; Liu, W.; Zhou, L.; Peng, T.; Xu, Q. An unsupervised SAR and optical image fusion network based on structure-texture decomposition. IEEE Geosci. Remote Sens. Lett. 2022, 19, 4028305. [Google Scholar] [CrossRef]
  29. Liu, J.; Fan, X.; Jiang, J.; Liu, R.; Luo, Z. Learning a deep multi-scale feature ensemble and an edge-attention guidance for image fusion. IEEE Trans. Circuits Syst. Video Technol. 2021, 32, 105–119. [Google Scholar] [CrossRef]
  30. Cheng, C.; Xu, T.; Wu, X.J.; Li, H.; Li, X.; Kittler, J. Fusionbooster: A unified image fusion boosting paradigm. Int. J. Comput. Vis. 2025, 133, 3041–3058. [Google Scholar] [CrossRef]
  31. Liu, Y.; Chen, X.; Cheng, J.; Peng, H. A medical image fusion method based on convolutional neural networks. In Proceedings of the International Conference on Information Fusion, Xi’an, China, 10–13 July 2017; IEEE: New York, NY, USA, 2017; pp. 1–7. [Google Scholar]
  32. Ma, H.; Liao, Q.; Zhang, J.; Liu, S.; Xue, J.H. An α-matte boundary defocus model-based cascaded network for multi-focus image fusion. IEEE Trans. Image Process. 2020, 29, 8668–8679. [Google Scholar] [CrossRef]
  33. Xu, H.; Ma, J.; Jiang, J.; Guo, X.; Ling, H. U2Fusion: A unified unsupervised image fusion network. IEEE Trans. Pattern Anal. Mach. Intell. 2020, 44, 502–518. [Google Scholar] [CrossRef]
  34. Tang, L.; Yuan, J.; Ma, J. Image fusion in the loop of high-level vision tasks: A semantic-aware real-time infrared and visible image fusion network. Inf. Fusion 2022, 82, 28–42. [Google Scholar] [CrossRef]
  35. Tang, L.; Yuan, J.; Zhang, H.; Jiang, X.; Ma, J. PIAFusion: A progressive infrared and visible image fusion network based on illumination aware. Inf. Fusion 2022, 83, 79–92. [Google Scholar] [CrossRef]
  36. Duan, C.; Belgiu, M.; Stein, A. Efficient cloud removal network for satellite images using sar-optical image fusion. IEEE Geosci. Remote Sens. Lett. 2024, 21, 1–5. [Google Scholar] [CrossRef]
  37. Zhao, W.; Cui, H.; Wang, H.; He, Y.; Lu, H. FreeFusion: Infrared and Visible Image Fusion via Cross Reconstruction Learning. IEEE Trans. Pattern Anal. Mach. Intell. 2025, 47, 8040–8056. [Google Scholar] [CrossRef]
  38. Ma, J.; Yu, W.; Liang, P.; Li, C.; Jiang, J. FusionGAN: A generative adversarial network for infrared and visible image fusion. Inf. Fusion 2019, 48, 11–26. [Google Scholar] [CrossRef]
  39. Ma, J.; Xu, H.; Jiang, J.; Mei, X.; Zhang, X.P. DDcGAN: A dual-discriminator conditional generative adversarial network for multi-resolution image fusion. IEEE Trans. Image Process. 2020, 29, 4980–4995. [Google Scholar] [CrossRef] [PubMed]
  40. Ma, J.; Zhang, H.; Shao, Z.; Liang, P.; Xu, H. GANMcC: A generative adversarial network with multiclassification constraints for infrared and visible image fusion. IEEE Trans. Instrum. Meas. 2020, 70, 5005014. [Google Scholar] [CrossRef]
  41. Le, Z.; Huang, J.; Xu, H.; Fan, F.; Ma, Y.; Mei, X.; Ma, J. UIFGAN: An unsupervised continual-learning generative adversarial network for unified image fusion. Inf. Fusion 2022, 88, 305–318. [Google Scholar] [CrossRef]
  42. Kong, Y.; Hong, F.; Leung, H.; Peng, X. A fusion method of optical image and SAR image based on dense-UGAN and Gram–Schmidt transformation. Remote Sens. 2021, 13, 4274. [Google Scholar] [CrossRef]
  43. Ding, Z.; Yang, Y.; Zhang, Y.; Luo, X.; Huang, M.; Xiang, X. Cross-Modal Feature Calibration and Fusion Network for Remote Sensing Optical-SAR Joint Object Detection under Cloud Occlusion. IEEE J. Sel. Top. Appl. Earth Obs. Remote Sens. 2025, 18, 27302–27319. [Google Scholar] [CrossRef]
  44. Geng, Z.; Liu, H.; Duan, P.; Wei, X.; Li, S. Feature-based multimodal remote sensing image matching: Benchmark and state-of-the-art. ISPRS J. Photogramm. Remote Sens. 2025, 229, 285–302. [Google Scholar] [CrossRef]
  45. Sommervold, O.; Gazzea, M.; Arghandeh, R. A survey on SAR and optical satellite image registration. Remote Sens. 2023, 15, 850. [Google Scholar] [CrossRef]
  46. Quan, Y.; Zhang, R.; Li, J.; Ji, S.; Guo, H.; Yu, A. Learning SAR-optical cross modal features for land cover classification. Remote Sens. 2024, 16, 431. [Google Scholar] [CrossRef]
  47. Aleissaee, A.A.; Kumar, A.; Anwer, R.M.; Khan, S.; Cholakkal, H.; Xia, G.S.; Khan, F.S. Transformers in remote sensing: A survey. Remote Sens. 2023, 15, 1860. [Google Scholar] [CrossRef]
  48. Wei, K.; Dai, J.; Hong, D.; Ye, Y. MGFNet: An MLP-dominated gated fusion network for semantic segmentation of high-resolution multi-modal remote sensing images. Int. J. Appl. Earth Obs. Geoinf. 2024, 135, 104241. [Google Scholar] [CrossRef]
  49. Wang, J.; Ma, L.; Zhao, B.; Gou, Z.; Yin, Y.; Sun, G. MRLF: Multi-Resolution Layered Fusion Network for Optical and SAR Images. Remote Sens. 2025, 17, 3740. [Google Scholar] [CrossRef]
  50. Wang, P.; Lu, Z.; Li, Y.; Ding, B.; Zhang, D. SARCLIP: The First Vision–Language Foundation Model for SAR Image. IEEE Trans. Geosci. Remote Sens. 2025, 63, 5223211. [Google Scholar] [CrossRef]
  51. Liu, F.; Chen, D.; Guan, Z.; Zhou, X.; Zhu, J.; Ye, Q.; Fu, L.; Zhou, J. Remoteclip: A vision language foundation model for remote sensing. IEEE Trans. Geosci. Remote Sens. 2024, 62, 5622216. [Google Scholar] [CrossRef]
  52. Radford, A.; Kim, J.W.; Hallacy, C.; Ramesh, A.; Goh, G.; Agarwal, S.; Sastry, G.; Askell, A.; Mishkin, P.; Clark, J.; et al. Learning transferable visual models from natural language supervision. In Proceedings of the International Conference on Machine Learning, PMLR, Virtual, 18–24 July 2021; pp. 8748–8763. [Google Scholar]
  53. Yu, T.; Kumar, S.; Gupta, A.; Levine, S.; Hausman, K.; Finn, C. Gradient surgery for multi-task learning. Adv. Neural Inf. Process. Syst. 2020, 33, 5824–5836. [Google Scholar]
  54. Aslantas, V.; Bendes, E. A new image quality metric for image fusion: The sum of the correlations of differences. Aeu-Int. J. Electron. Commun. 2015, 69, 1890–1896. [Google Scholar] [CrossRef]
  55. Li, X.; Zhang, G.; Cui, H.; Hou, S.; Wang, S.; Li, X.; Chen, Y.; Li, Z.; Zhang, L. MCANet: A joint semantic segmentation framework of optical and SAR images for land use classification. Int. J. Appl. Earth Obs. Geoinf. 2022, 106, 102638. [Google Scholar] [CrossRef]
  56. Schmitt, M.; Hughes, L.H.; Zhu, X.X. The SEN1-2 dataset for deep learning in SAR-optical data fusion. arXiv 2018, arXiv:1807.01569. [Google Scholar] [CrossRef]
  57. Huang, M.; Xu, Y.; Qian, L.; Shi, W.; Zhang, Y.; Bao, W.; Wang, N.; Liu, X.; Xiang, X. The QXS-SAROPT dataset for deep learning in SAR-optical data fusion. arXiv 2021, arXiv:2103.08259. [Google Scholar]
  58. Wang, C.; Luo, L.; Fang, W.; Yang, J. Cross-modal Gaussian Localization Distillation for Optical Information guided SAR Object Detection. In Proceedings of the IEEE International Conference on Acoustics, Speech and Signal Processing, Hyderabad, India, 6–11 April 2025; IEEE: New York, NY, USA, 2025; pp. 1–5. [Google Scholar]
  59. Ye, Y.; Zhang, J.; Zhou, L.; Li, J.; Ren, X.; Fan, J. Optical and SAR image fusion based on complementary feature decomposition and visual saliency features. IEEE Trans. Geosci. Remote Sens. 2024, 62, 5205315. [Google Scholar] [CrossRef]
  60. Roberts, J.W.; Van Aardt, J.A.; Ahmed, F.B. Assessment of image fusion procedures using entropy, image quality, and multispectral classification. J. Appl. Remote Sens. 2008, 2, 023522. [Google Scholar]
  61. Han, Y.; Cai, Y.; Cao, Y.; Xu, X. A new image fusion performance metric based on visual information fidelity. Inf. Fusion 2013, 14, 127–135. [Google Scholar] [CrossRef]
  62. Zhang, W.; Zhai, G.; Wei, Y.; Yang, X.; Ma, K. Blind image quality assessment via vision-language correspondence: A multitask learning perspective. In Proceedings of the IEEE/CVF Conference on Computer Vision and Pattern Recognition, Vancouver, BC, Canada, 17–24 June 2023; pp. 14071–14081. [Google Scholar]
  63. Wang, J.; Chan, K.C.; Loy, C.C. Exploring clip for assessing the look and feel of images. In Proceedings of the AAAI Conference on Artificial Intelligence, Washington, DC, USA, 7–14 February 2023; Volume 37, pp. 2555–2563. [Google Scholar]
  64. Jayasumana, S.; Ramalingam, S.; Veit, A.; Glasner, D.; Chakrabarti, A.; Kumar, S. Rethinking fid: Towards a better evaluation metric for image generation. In Proceedings of the IEEE/CVF Conference on Computer Vision and Pattern Recognition, Seattle, WA, USA, 16–22 June 2024; pp. 9307–9315. [Google Scholar]
  65. Sheikh, H.R.; Bovik, A.C. Image information and visual quality. IEEE Trans. Image Process. 2006, 15, 430–444. [Google Scholar] [CrossRef]
  66. Wang, M.; Deng, W. Deep visual domain adaptation: A survey. Neurocomputing 2018, 312, 135–153. [Google Scholar] [CrossRef]
Figure 1. Overall architecture of the proposed correlation and semantic prior-guided multi-scale cross-modal interaction network (CSP-MCIN), illustrating the detailed network components and the corresponding loss function strategies. OPT ME and SAR ME denote the optical and synthetic aperture radar modality-specific encoders, respectively. MID represents the multi-scale interaction decoder, while HSFM and LDFM refer to the high-level semantic fusion and low-level detail fusion modules, respectively. GFU signifies the gated fusion unit. Notably, the dashed arrows represent the paths dedicated to feature extraction and loss calculation, while the solid arrows denote the paths involving gradient backpropagation. Additionally, RemoteCLIP is employed exclusively to extract semantic features from the OPT and fused images. Similarly, SARCLIP is utilized solely for extracting semantic features from the SAR and fused images, respectively.
Remotesensing 18 00975 g001
Figure 2. Structures of different key modules. (a) Detailed structure of HSFM. It comprises an intra-modal attention block for internal feature enhancement and an inter-modal attention block for mutual feature compensation between two modalities. (b) Structure of the multilayer perceptron (MLP). (c) Schematic of the intra-modal self-attention (IMSA) and intra-modal cross-attention (IMCA) mechanisms. They share an identical computational architecture, whereas the inputs Q, K, and V for IMSA are derived from a single modality, while those for IMCA are sourced from distinct modalities. (d) Detailed structure of the GFU. It employs a shared feed-forward network (FFN) to process the input feature set { X i } i = 1 n and then generates the weight set { α i } i = 1 n via a softmax activation. Finally, the multi-modal fused feature F g is obtained by performing a weighted summation of all features in { X i } i = 1 n based on the calculated weights. To maintain conciseness in the illustration, ellipses are used to denote the remaining elements in different feature sets.
Remotesensing 18 00975 g002
Figure 3. Training and testing loss curves of the proposed CSP-MCIN on different datasets. (a) Loss curves of the WHU-OPT-SAR (WOS) dataset. (b) Loss curves of the SEN1-2 dataset.
Remotesensing 18 00975 g003
Figure 4. SAR images, OPT images, and the fused images produced by different compared methods for two representative scenes in the WOS dataset. For each method, the first and second rows correspond to the above two scenes, respectively. Red rectangles denote selected key regions in different fusion results, which are magnified to provide a clearer comparison of details.
Remotesensing 18 00975 g004
Figure 5. SAR images, OPT images, and the fused images produced by different compared methods for two representative scenes in the SEN1-2 dataset. For each method, the first and second rows correspond to the above two scenes, respectively. Red rectangles denote selected key regions in different fusion results, which are magnified to provide a clearer comparison of details.
Remotesensing 18 00975 g005
Figure 6. Visualization of t-SNE feature representations for 1000 samples across different HSFM stages. (a) t-SNE visualization of features from HSFM1. (b) t-SNE visualization of features from HSFM2. (c) t-SNE visualization of features from HSFM3. (d) t-SNE visualization of features from HSFM4.
Remotesensing 18 00975 g006
Figure 7. SAR images, OPT images, and the fused images generated with different loss functions for three representative scenes in the WOS dataset. Each row sequentially corresponds to one of the three scenes. Blue and red rectangles denote the two selected key regions in different fusion results, which are enlarged to provide a clearer comparison of details, respectively.
Remotesensing 18 00975 g007
Figure 8. Impact of λ s a r and λ c o r variations on fusion metrics. (a) Impact of λ s a r variation on fusion metrics ( λ c o r = 0.7 ). (b) Impact of λ c o r variation on fusion metrics ( λ s a r = 0.3 ).
Remotesensing 18 00975 g008
Figure 9. Gradient cosine similarity curves between L s a r and L o p t during the training of CSP-MCIN on different datasets. (a) Gradient cosine similarity curve of the WOS dataset. (b) Gradient cosine similarity curve of the SEN1-2 dataset.
Remotesensing 18 00975 g009
Figure 10. SAR images, OPT images, and the fused images produced by the proposed CSP-MCIN for five representative scenes in the QS dataset. Each column sequentially corresponds to one of the five scenes.
Remotesensing 18 00975 g010
Figure 11. SAR images, OPT images, and the fused images produced by the proposed CSP-MCIN for five representative scenes in the OGSOD dataset. Each column sequentially corresponds to one of the five scenes.
Remotesensing 18 00975 g011
Table 1. Quantitative evaluation results of different compared methods on the WOS dataset.
MethodSD↑CC↑EN↑VIFF↑LIQE↑CLIP-IQA↑CMMDF↓
LP0.0770.3665.9260.0331.4430.4862.467
VSFF0.0720.6315.8700.0832.8090.5192.274
FusionGAN0.1120.2546.4840.2041.5480.3541.600
DDcGAN0.0620.3695.8160.0672.7030.5951.947
GANMcC0.1040.6066.3950.4122.1560.4171.329
U2Fusion0.0950.5906.2350.3212.1540.3611.519
SwinFusion0.1660.5376.9100.6172.1340.3421.674
TUFusion0.1060.6236.4310.4162.2840.3821.544
FreeFusion0.1930.6427.2330.7542.5300.4901.409
CSP-MCIN0.1840.6917.3190.6872.9480.6121.133
Note: ↑ (↓) indicates that a higher (lower) value is better. The best and second-best results for each evaluation metric are highlighted in red bold and blue bold, respectively.
Table 2. Quantitative evaluation results of different compared methods on the SEN1-2 dataset.
MethodSD↑CC↑EN↑VIFF↑LIQE↑CLIP-IQA↑CMMDF↓
LP0.0790.4075.6020.0321.3250.3912.308
VSFF0.1410.5066.8700.2102.1130.4640.899
FusionGAN0.1200.4786.8240.1951.9040.4400.780
DDcGAN0.1030.4196.2990.0902.2770.5271.543
GANMcC0.1110.6296.7390.2671.5680.3590.743
U2Fusion0.1090.6566.6970.2801.6710.3650.745
SwinFusion0.1560.6037.2550.3581.6500.4140.606
TUFusion0.1190.6536.8310.3221.5780.3580.643
FreeFusion0.1440.5396.0800.3761.2050.2941.630
CSP-MCIN0.1940.6417.3640.4402.1110.5190.574
Note: ↑ (↓) indicates that a higher (lower) value is better. The best and second-best results for each evaluation metric are highlighted in red bold and blue bold, respectively.
Table 3. Model complexity analysis of different deep learning-based approaches.
Metric    Method    
FusionGANDDcGANGANMcCU2FusionSwinFusionTUFusionFreeFusionCSP-MCIN
Params↓0.91.11.90.71.019.15.737.7
GFLOPs↓51.4211.628.643.276.027.996.824.1
Time↓17.516.427.217.2194.9139.225.312.9
Mem↓205.61231.7241.2260.6706.61339.3341.5306.7
Note: ↓ indicates that a lower value is better. The best and second-best results for each evaluation metric are highlighted in red bold and blue bold, respectively.
Table 4. Ablation results on the MID and loss function.
MethodSD↑CC↑EN↑VIFF↑LIQE↑CLIP-IQA↑CMMDF↓
w/o HSFM0.1770.6737.1520.6512.7440.6011.139
w/o LDFM0.1980.6017.3540.6291.3650.4011.688
w/o Atten0.1870.6917.3120.7032.8810.5991.135
w/o GFU0.1860.6887.3010.7092.8080.5971.165
w/o L c o r 0.1960.6817.3300.8692.4930.5651.787
w/o L s e m 0.1910.6667.2820.8902.4190.5401.807
w/o PCGrad0.1960.5957.3750.5731.3190.3721.670
vanilla loss0.1570.5576.9540.6002.2950.4682.184
CSP-MCIN0.1840.6917.3190.6872.9480.6121.133
Note: ↑ (↓) indicates that a higher (lower) value is better. The best and second-best results for each evaluation metric are highlighted in red bold and blue bold, respectively.
Table 5. Sensitivity analysis of λ s a r and λ c o r .
λ sar λ cor SD↑CC↑EN↑VIFF↑LIQE↑CLIP-IQA↑CMMDF↓
0.20.70.1840.6947.3150.6452.9440.6031.019
0.30.1840.6917.3190.6872.9480.6121.133
0.40.1810.6857.2640.7402.8240.5850.908
0.50.1810.6767.2630.7942.8040.5861.108
0.60.1810.6757.2460.7892.7520.5731.087
0.70.1820.6677.2090.8262.6440.5541.064
0.30.30.1240.6516.8180.2482.9930.5810.970
0.40.1470.6677.0430.3822.9700.5860.862
0.50.1610.6817.1660.4813.0060.5880.898
0.60.1720.6897.2540.5862.9650.5960.962
0.80.1850.6817.1750.7802.7090.5711.017
Note: ↑ (↓) indicates that a higher (lower) value is better.
Table 6. Ablation results on cross-modal interaction and gated fusion mechanisms.
MethodCC↑EN↑VIFF↑CLIP-IQA↑Params↓GFLOPs↓Time↓Mem↓
CFCFNet0.6677.1140.6410.58741.018.420.8317.6
CSP-MCIN0.6917.3190.6870.61237.724.112.9306.7
Note: ↑ (↓) indicates that a higher (lower) value is better. The best result for each evaluation metric is highlighted in red bold.
Table 7. Ablation results on the weighted loss (WL) function and PCGrad.
Method λ sar λ opt SD↑CC↑EN↑VIFF↑LIQE↑CLIP-IQA↑CMMDF↓
w/WL0.20.80.1840.6877.3200.5292.9220.6101.242
0.30.70.1880.5957.3180.5731.3190.3721.670
0.40.60.1820.6927.3120.6822.9060.6031.133
0.50.50.1840.6827.3070.6832.7910.5941.311
0.60.40.1800.6697.2310.6692.6890.5571.236
0.70.30.1800.6517.2120.6142.5630.5291.369
w/PCGrad0.30.70.1840.6917.3190.6872.9480.6121.133
Note: ↑ (↓) indicates that a higher (lower) value is better. The best and second-best results for each evaluation metric are highlighted in red bold and blue bold, respectively.
Table 8. Cross-dataset transfer experiments on the WOS, SEN1-2, and QXS-SAROPT (QS) datasets.
TrainTestSD↑CC↑EN↑VIFF↑LIQE↑CLIP-IQA↑CMMDF↓
SEN1-2WOS0.1790.6897.3210.5793.1560.6682.136
QS0.1660.6857.2100.6242.7870.6102.114
WOS0.1840.6917.3190.6872.9480.6121.133
WOSSEN1-20.2030.6287.4070.4401.8560.5040.946
QS0.2000.6317.4380.4311.8840.5271.249
SEN1-20.1940.6417.3640.4402.1110.5190.574
Note: ↑ (↓) indicates that a higher (lower) value is better. The best and second-best results for each evaluation metric are highlighted in red bold and blue bold, respectively.
Disclaimer/Publisher’s Note: The statements, opinions and data contained in all publications are solely those of the individual author(s) and contributor(s) and not of MDPI and/or the editor(s). MDPI and/or the editor(s) disclaim responsibility for any injury to people or property resulting from any ideas, methods, instructions or products referred to in the content.