


Highlights
What are the main findings?
- A learnable feature preprocessing front-end is proposed to adaptively integrate scattering and texture features from dual-polarization SAR images into an end-to-end trainable framework.
- A bidirectional cross-attention mechanism is designed to deeply fuse SAR visual features with AIS geometric information, enabling effective cross-modal guidance and complementarity.
- An improved texture feature extraction method is introduced, which models local pixel differences and similarities to capture more discriminative texture representations.
What is the implication of the main finding?
- The method achieves state-of-the-art classification accuracy on the OpenSARShip 2.0 dataset (89.03% for three-class and 71.43% for six-class), demonstrating its superiority over existing approaches.
- The learnable preprocessing front-end reduces reliance on handcrafted feature engineering and improves adaptability to different data distributions, while the enhanced texture extraction further enriches fine-grained details, collectively offering a more generalizable solution for SAR ship classification.
Abstract
Ship classification in synthetic aperture radar (SAR) imagery is essential for maritime surveillance but remains challenging due to limited resolution, insufficient textural details, and difficulties in effectively fusing multimodal information. Existing methods either rely on handcrafted features with limited adaptability or employ simplistic fusion strategies that fail to fully exploit the complementary guidance across modalities. To address these issues, we propose a multimodal fusion network based on a learnable feature preprocessing front-end (LFPF-MFN), which integrates polarimetric, textural, and geometric information in an end-to-end learnable manner. Specifically, LFPF-MFN introduces a learnable preprocessing front-end to embed scattering and enhanced textural features. Meanwhile, geometric information from the Automatic Identification System (AIS) is incorporated through textual embedding, and effective multimodal fusion is achieved via a bidirectional cross-attention mechanism. Extensive experiments on the OpenSARShip 2.0 dataset demonstrate that the proposed method achieves state-of-the-art performance in both three-class and six-class classification tasks, validating the effectiveness of each designed module and the superiority of the multimodal fusion strategy.
1. Introduction
Synthetic Aperture Radar (SAR) is a mature and powerful remote sensing technique capable of imaging the Earth’s surface day and night under all weather conditions, granting it an indispensable role in maritime surveillance [1]. SAR transmits broadband pulses, receives ground backscattered echoes, and synthesizes an equivalent large aperture through platform motion to form images. To further improve azimuth resolution, researchers sometimes adopt enhanced imaging modes, such as spaceborne spotlight/sliding spotlight SAR imaging [2]. SAR is now widely used in maritime vessel monitoring and environmental management for applications such as ship classification and identification, marine traffic control, oil spill detection, and sea ice classification [3]. As a key technology for maritime surveillance, SAR image classification has remained an active research topic.
Early methods for SAR image classification primarily relied on handcrafted feature extraction, focusing on specific features such as geometric characteristics, scattering intensities, and histograms of oriented gradients [4]. These extracted features were then fed into classifiers such as support vector machines or random forests. However, manual feature extraction is not only time-consuming but also struggles to capture high-dimensional information, limiting its ability to handle complex SAR data.
The development of deep learning has led to the widespread adoption of complex neural networks for SAR image classification. This approach automatically extracts multi-level deep features from images, circumventing the limitations of manual feature extraction and enabling an end-to-end classification pipeline. Early efforts primarily employed simple convolutional neural networks (CNNs) for SAR image recognition. For instance, J. Ding et al. [5] demonstrated significant accuracy improvements over conventional methods by applying CNNs to SAR image classification. With the advancement of neural networks, increasingly sophisticated models have been proposed, substantially enhancing feature extraction from SAR images. Ai et al. [6] designed a convolutional method with a multi-channel parallel topology that uses convolution kernels of varying sizes to extract multi-scale deep features of SAR targets, thereby improving the completeness of target feature representation. Shang et al. [7] employed a spherical space classifier that projects features onto a spherical manifold, effectively increasing inter-class distances while compressing intra-class distributions. Wang et al. [8] enhanced a residual network with a squeeze-and-excitation mechanism, enabling the network to focus more on informative feature channels. Sun et al. [9] addressed the insufficient fusion of multi-scale ship target features in SAR images by introducing learnable weights for bidirectional feature pyramid fusion, replacing the conventional equal-weight aggregation and enabling differentiated representation of targets at different scales during the fusion process. Aiming at the large size variation among ship targets in SAR images, Sun et al. [10] employed small kernels in shallow layers and large kernels in deep layers during feature extraction and introduced dynamic spatial and channel attention weighting in feature fusion so that targets of different sizes obtain matched receptive fields.
Despite significant performance gains, several challenges remain. SAR image datasets often suffer from pronounced class imbalance and limited data source diversity, which constrains model generalization [11]. In contrast, traditional handcrafted features focus on extracting characteristics based on the physical properties of SAR images, such as geometric, scattering, and structural features [12,13,14,15], an advantage not inherently possessed by neural networks. Consequently, researchers have begun exploring methods that integrate handcrafted features with neural networks. Yang et al. [16] incorporated histogram of oriented gradients (HOG) features into the network training process, allowing the network to learn salient shape and edge characteristics of SAR targets, which significantly improved classification accuracy and generalization. He et al. [17] leveraged first-order and second-order statistical information from feature maps to fully exploit complementary information between dual-polarization SAR images, thereby boosting classification performance. Sun et al. [18] designed a learning module specifically for strong scattering points in SAR images by capitalizing on the characteristic strong scatterers of ships; their network architecture automatically learns and generates scattering point distribution features for recognition. Pan et al. [19] constructed a topological graph of strong scattering regions and employed a graph convolutional network to automatically learn structural relationships between these regions, integrating scattering feature extraction into the network itself and facilitating automatic learning of scattering context.
While these methods combine handcrafted features with neural network learning, they generally neglect the polarimetric characteristics of SAR images. The scattering properties vary across different polarization modes, which has motivated research into integrating polarimetric handcrafted features with neural networks. Jiang et al. [20] employed Poisson encoding to transform dual-polarization SAR images into spike trains, which are then classified using a spiking neural network (SNN) for ship recognition. To better capture the physical properties of SAR images, existing approaches often apply well-established theories to preprocess SAR data before feeding it into a network. For instance, Xie et al. [21] constructed two types of pseudo-RGB images from dual-polarization data using polarimetric entropy, polarimetric degree, and local binary pattern (LBP) features, forming inputs composed of polarimetric and texture characteristics; this strategy significantly improves classification accuracy. Similarly, Chen et al. [22] utilized theories such as Pauli decomposition to build two pseudo-RGB images from different polarimetric features on dual-polarization data as model input, achieving better performance compared to using raw images directly.
A single SAR image offers limited representation of ship characteristics. Multimodal learning allows one modality to guide the training of another, leveraging complementary cross-modal information to help the model capture more comprehensive ship features [23]. Golubovic et al. [24,25] utilized the vessel information provided by AIS trajectory data to assist target confirmation. Sun et al. [26] encoded SAR domain priors as knowledge tokens and injected them into the classification branch via cross-attention and FiLM modulation, enabling the network to explicitly exploit SAR physical priors instead of relying purely on data-driven learning. Zhang et al. [27] first embedded geometric features into a long short-term memory network to obtain a classification vector, achieving decision-level fusion with SAR images. The Automatic Identification System (AIS), which records essential ship information, contains precise data on ship length and width [28]. Lang et al. [29] projected SAR images and AIS geometric features into a common subspace and concatenated them with the original features to form an augmented vector, accomplishing feature-level fusion between SAR and AIS. Similarly, Chen et al. [22] concatenated AIS features with SAR image features and fed them into a large language model to complete the classification task.
Although existing methods have demonstrated improved performance, they are often constrained by specific data distributions and exhibit limited generalization to images of different resolutions or from varied data sources. However, in such approaches, radar feature extraction and AIS verification remain two relatively independent stages, lacking deep interaction and mutual guidance between the two modalities. In leveraging AIS-derived geometric information, current approaches predominantly rely on simple feature concatenation, which fails to fully exploit the interactive and guiding potential between multimodal data streams. Consequently, there is a clear need for a model that can more effectively mine the inherent physical characteristics of SAR imagery and facilitate deep, synergistic interaction across multiple information sources to advance classification accuracy.
In summary, this paper presents the following core contributions:
- Learnable Polarimetric and Texture Feature Preprocessing Front-End: This front-end preprocesses the scattering and texture features of SAR images while incorporating learnable parameters to integrate preprocessing into the network’s learning process. It is also designed to accommodate the three-channel input required by most models.
- Improved Texture Feature Extraction: A deep texture feature modeling method is proposed. This method uses actual pixel values to compute the differences between the central pixel and its surrounding pixels. Furthermore, it calculates the similarity among pixels within the neighborhood window, constructing more detailed texture features from two perspectives: the differences between the central pixel and its neighbors, and the mutual similarities among neighboring pixels.
- Modality-Complementarity-Guided Multimodal Fusion Strategy: A fusion module based on a cross-attention mechanism is designed to enable deep interaction and mutual guidance between AIS text features and SAR visual features during the fusion process, effectively exploiting the complementarity of information from different modalities.
2. Materials and Methods
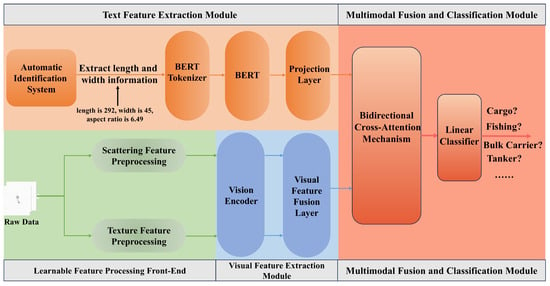
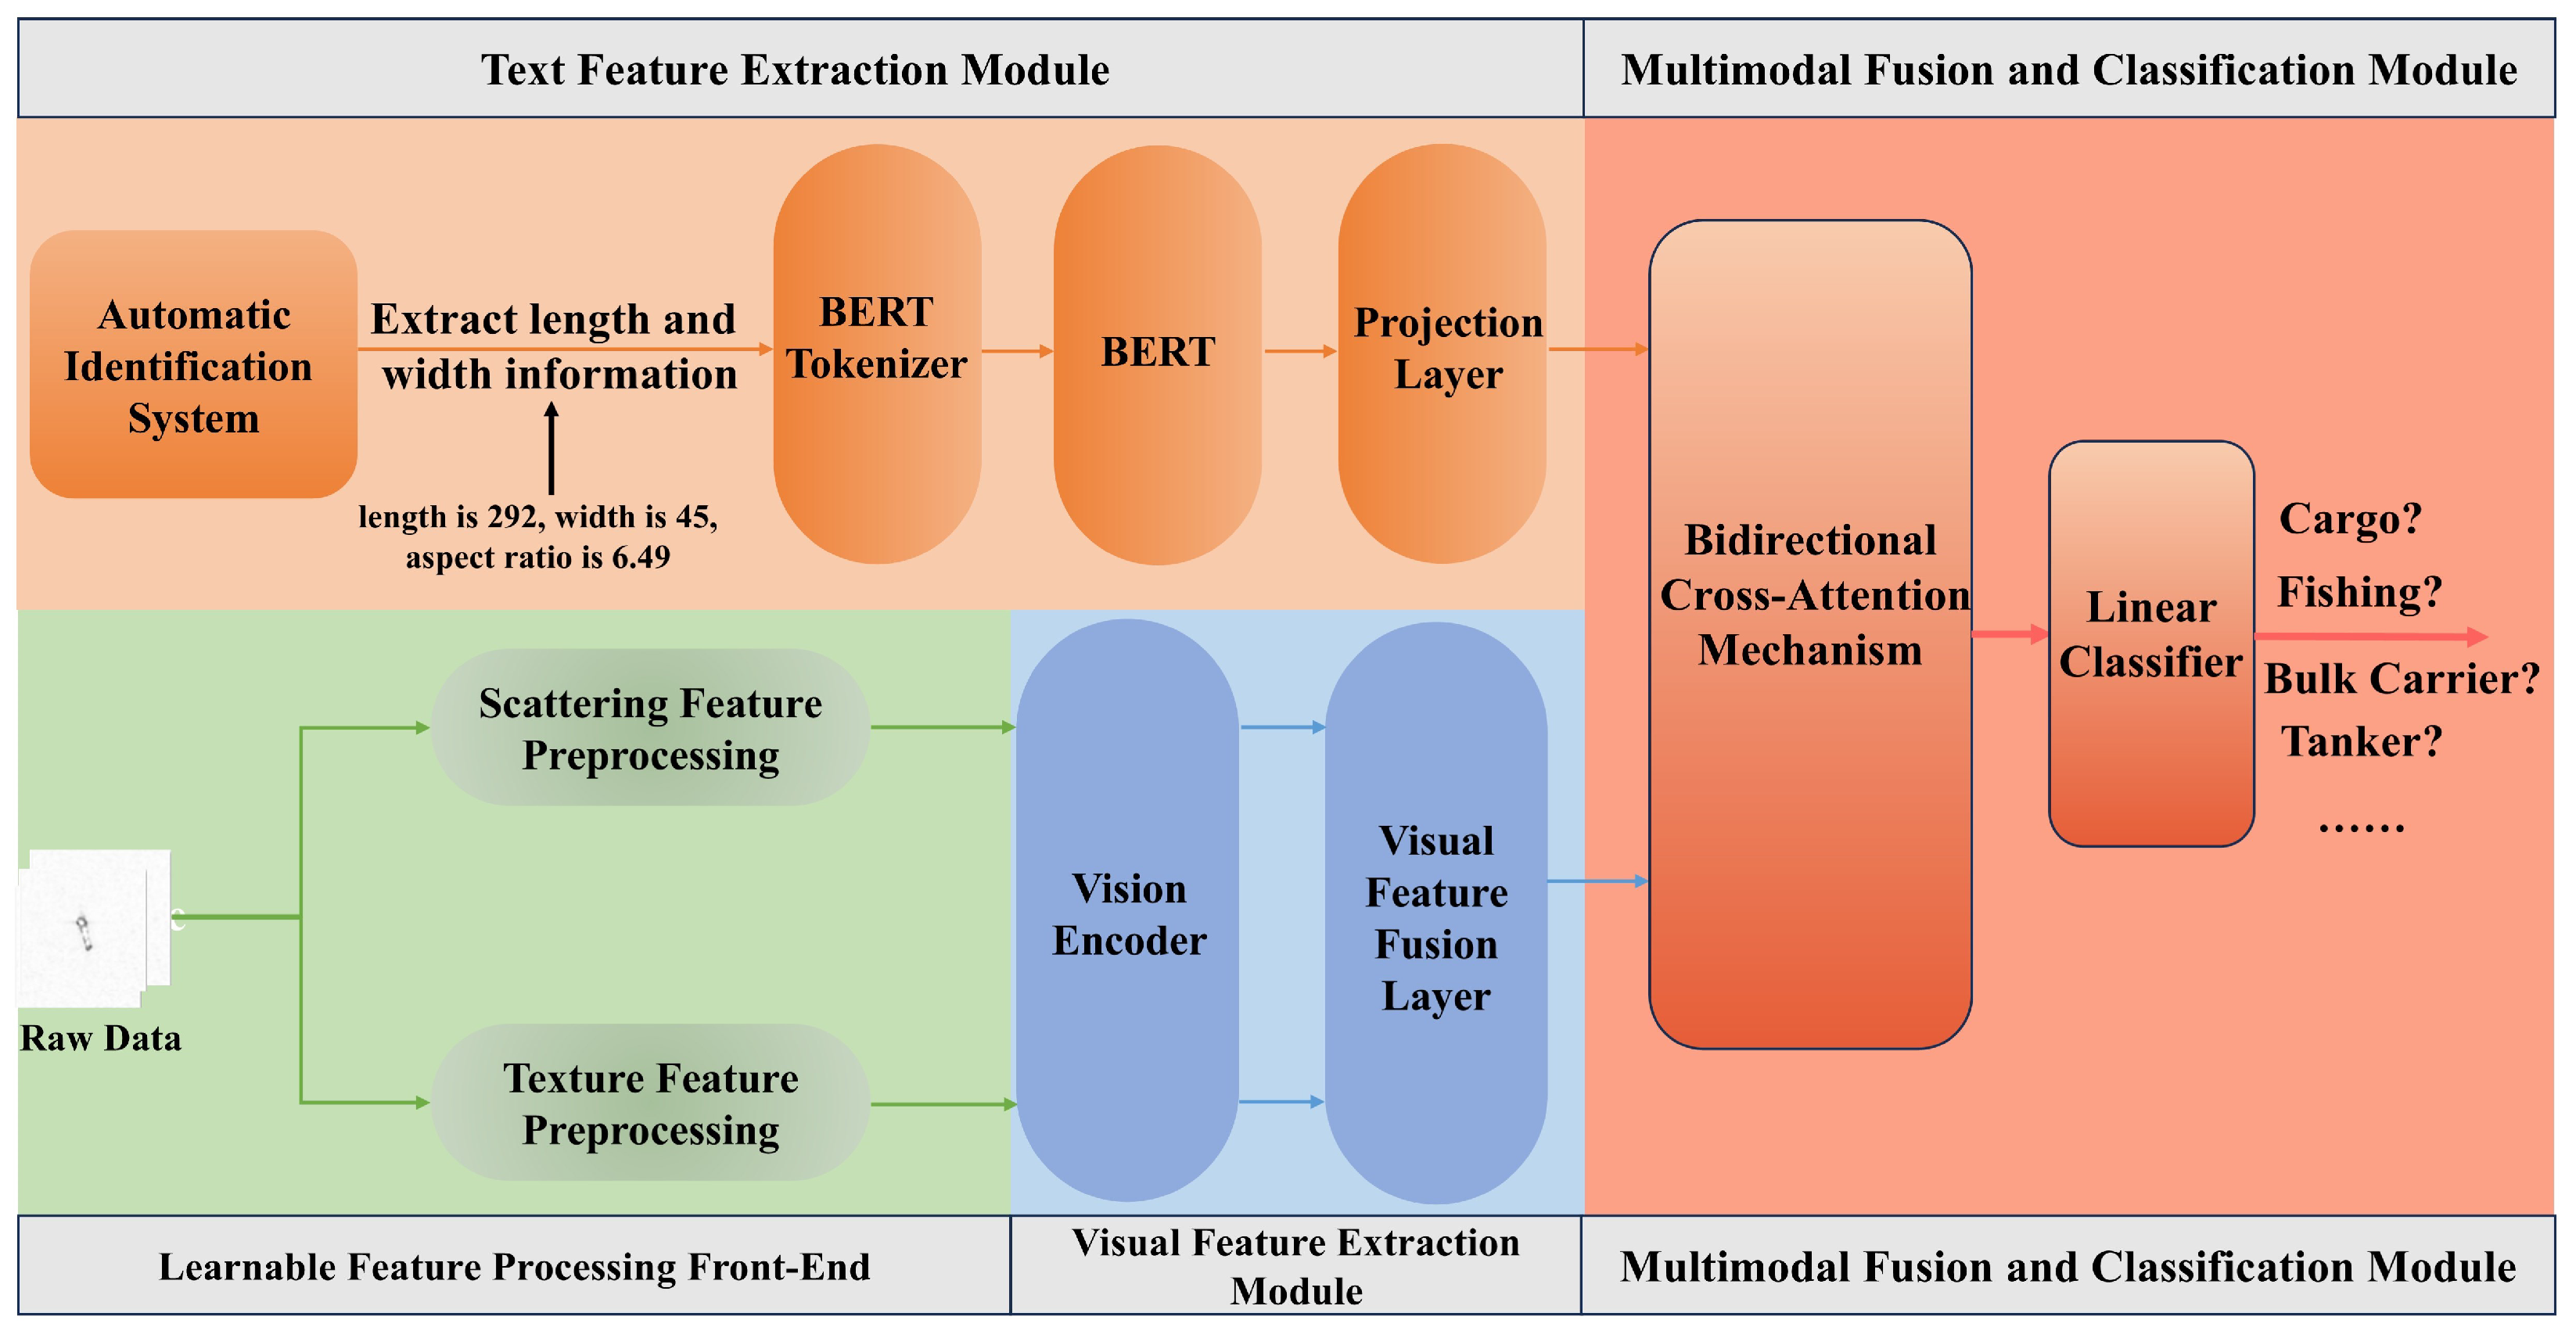
The LFPF-MFN framework improves SAR ship classification accuracy by learning adaptive representations of polarization and texture features from SAR images and fusing them with AIS information. Its main architecture is illustrated in Figure 1. It comprises four key modules: a Learnable Feature Preprocessing Front-End (LFPF), a Visual Feature Extraction Module (VFEM), a Textual Feature Extraction Module (TFEM), and a Multimodal Fusion and Classification Module (MFCM). This section details the architecture of each module and the overall training procedure.
Figure 1.
Overview of the proposed LFPF-MFN framework. The framework consists of three main modules: (1) Learnable Feature Processing Front-End, which preprocesses scattering and texture features from SAR images; (2) Text Feature Extraction Module, which encodes AIS information (length, width) via BERT; (3) Visual Feature Extraction Module, which extracts deep visual features from the preprocessed scattering and texture maps; (4) Multimodal Fusion and Classification Module, which integrates visual and text features through a bidirectional cross-attention mechanism and projects them to a linear classifier for ship type classification.
2.1. Learnable Feature Preprocessing Front-End
2.1.1. Scattering Feature Preprocessing Front-End
Polarimetric information has seen preliminary application in ship classification. For dual-polarization data, such as that in the OpenSARShip 2.0 dataset [30], the prevailing approach involves preprocessing the images into pseudo-RGB representations [21,22]. Compared to simply utilizing the amplitude information from different polarizations, this method more effectively aids models in achieving better performance. However, its failure to incorporate polarimetric information into the learning process results in suboptimal efficiency. Furthermore, the construction of pseudo-RGB images relies on a fixed, handcrafted formula, which possesses limited generalization capability and cannot adapt to different datasets. To address these limitations, this paper designs a learnable polarimetric feature processing front-end that can be integrated into network training, allowing adaptive adjustment of the parameters used for polarimetric feature computation.
Following the approach of Reference [22], this paper introduces a learnable adaptation of the Pauli decomposition for dual-polarization amplitude data. The three Pauli components are computed as follows:
where and denote the VV and VH channels of the dual-polarization data, respectively. These components correspond to the total scattering, double-bounce scattering, and surface scattering characteristics of a ship target. They effectively capture structural variations in ships, thereby enabling the model to distinguish different target types more accurately based on structural features.
The standard Pauli decomposition employs fixed coefficients for its linear combination. To parameterize this process, we transform the three fixed basis vectors into learnable parameters. Specifically, we define three learnable two-dimensional basis vectors (for ) and initialize them with physically meaningful values: , , and . These vectors correspond respectively to the fixed coefficient combinations for , and in the original Pauli decomposition, serving as initial values for network training. During training, the parameters are updated through optimization within a reasonable range around their initializations. This design transforms the extraction of scattering features from a fixed preprocessing step into a component that can be embedded within the network for end-to-end optimization, thereby retaining the physical interpretability of the original Pauli decomposition while enhancing its adaptability to complex data and specific tasks through parameter learning.
To enable adaptive learning while maintaining physical interpretability, we introduce soft constraints on the parameters. After each update, every component of a basis vector parameter is constrained to lie within a neighborhood of its initial value . This constraint ensures that the learning process does not deviate excessively from the physically well-defined Pauli decomposition, balancing the model’s flexibility and feature interpretability.
For a dual-polarization input image of size , the VV and VH intensity values at each pixel location are combined into a two-dimensional vector . This module generates three scattering feature responses by computing the dot products between this vector and each learnable basis vector:
Processing all pixel locations yields three two-dimensional response maps . Stacking these maps along the channel dimension produces the final three-channel scattering feature map . The module is computationally efficient, involving only simple dot product operations, and all its parameters are optimized via gradient backpropagation.
2.1.2. Texture Feature Preprocessing Front-End
Compared with optical images, SAR images lack rich textural information of ships, presenting a significant challenge for recognition tasks [18]. Texture features capture fine-grained details and local patterns within an image. Incorporating these physical characteristics can assist a model in identifying key discriminative features across different classes. For instance, Xie et al. [21] achieved substantial performance gains by constructing pseudo-RGB images using the LBP operator [31]. Liu et al. [32] improved the generalization capability and classification accuracy of their model by extracting target contour features. Similarly, Ai et al. [33] demonstrated that fusing low-level texture features with high-level deep features yields better performance than using deep features alone.
Common methods for extracting texture features include LBP and its variants [34,35]. These techniques typically operate by comparing neighboring pixels to a central pixel and assigning binary values based on simple thresholding. However, this approach often maps perceptually distinct texture variations to the same binary representation, which fails to accurately reflect actual differences. Moreover, it neglects the local differential relationships among neighboring pixels. To address these limitations, we directly model texture features using actual pixel value differences. For dual-polarization data, our method processes dual-polarization SAR images into dual-channel texture feature maps by computing the difference between the central pixel and its neighbors. This approach is based on an improved TA module originally designed for fully polarimetric data [36]. Furthermore, we model and weight the local texture differences within neighborhoods across different polarimetric SAR images, incorporating this information as a third input channel to the visual encoder.
Specifically, the proposed learnable texture feature preprocessing front-end accepts a dual-polarization SAR image of size as input and outputs three texture feature maps, each of size , denoted as , , and .
To generate the texture feature maps and , following the approach of Reference [21], the module first extracts a neighborhood window for each pixel location. For a location , let denote the vector formed by all pixel values within its neighborhood window, where the subscript indicates the polarization channel. The fifth element of each vector corresponds to the central pixel value of the respective channel, i.e., and . Let represent the vector constructed by repeating the central pixel value.
For each channel, we first compute the absolute difference vector between the neighborhood pixels and the central pixel:
This difference vector is then adaptively modulated using a learnable, channel-specific scaling factor :
To fuse the dual-polarization information and enhance salient texture discrepancies, the two modulated difference vectors are summed. A weight mask is subsequently generated by applying a learnable global parameter and the hyperbolic tangent function:
The mask defined in Equation (5) is applied to reweight the original neighborhood pixel vectors as follows:
In Equation (6), ⊙ denotes element-wise multiplication.These reweighted features are then linearly combined via two independent learnable weight vectors , yielding the texture feature value at position :
Processing every location in the image produces the texture feature maps and .
To obtain the third texture feature map , the module additionally models the structural relationships between all pixel pairs within the same neighborhood. For each local window centered at , similarity matrices are computed separately for the VV and VH channels. For a channel , the similarity matrix is defined, where the element represents the similarity between the k-th and l-th pixels in the neighborhood:
In Equation (8), and denote the intensity values of the k-th and l-th pixels in channel c, respectively. The term represents the fixed Euclidean distance between pixels k and l within a grid. The parameter controls the sensitivity of channel c to intensity differences, while serves as a shared penalty coefficient for spatial distance.
The similarity matrices from the two channels are then combined to yield the integrated similarity matrix :
In Equation (9), and are learnable fusion parameters that balance the contributions from different polarization channels and promote consistency between the dual-polarization signals. After obtaining , it is partitioned into three levels according to the distance between pixel pairs: adjacent (), diagonal (), and long-range (). The average similarity for all pixel pairs within each level is computed as:
In Equation (10), denotes the set of pixel pairs belonging to the n-th level, and is its cardinality. Finally, the local texture feature at position is obtained via a weighted sum of the features from these three levels:
In Equation (11), the weights are derived from a learnable parameter vector normalized by the softmax function, i.e., , ensuring that the weights sum to one.
In summary, this texture feature preprocessing front-end transforms the input dual-polarization SAR images into a three-channel texture feature map, denoted as , via a set of learnable parameters. These parameters are optimized via gradient backpropagation during end-to-end training, allowing the texture extraction process to adapt to specific tasks and data distributions. This design preserves the continuous information of actual pixel differences while enhancing texture representation through the modeling of local pixel-pair relationships. Furthermore, its lightweight parameterization introduces no additional computational burden to the subsequent network.
2.2. Visual Feature Extraction Module
Traditional convolutional neural networks primarily employ single-scale convolution kernels. This approach leads to the loss of partial feature information from targets and insufficient focus on crucial characteristics. Furthermore, they typically assign only fine-grained labels to SAR targets, thereby neglecting the high-level semantic information shared among similar categories. This oversight reduces inter-class feature distinctions and diminishes the model’s generalization capability [37]. In contrast, attention mechanisms can effectively capture such important features. Among them, the Swin Transformer [38] addresses the shortcomings of the traditional Transformer, which struggles to generate multi-scale features for visual tasks and suffers from high computational complexity. By introducing a hierarchical feature map structure and a shifted window-based self-attention mechanism, the Swin Transformer achieves effective multi-scale modeling of images while significantly reducing computational complexity.
Given the limited size of SAR image datasets, an efficient training strategy is to employ transfer learning. This work incorporates transfer learning into the proposed method. Specifically, we adopt a Swin Transformer model pre-trained on ImageNet as the network backbone. To avoid an excessive number of parameters, we utilize only the first three stages of the Swin Transformer architecture.
The visual feature extraction module comprises two parallel branches. These branches share an identical architecture but maintain separate weight sets during training. Their inputs are the two outputs of the LFPF, denoted as , . The scattering feature map and the texture feature map are processed by distinct image encoder branches . The outputs from these two encoders are summed, followed by global pooling and flattening operations to obtain the final visual feature :
Here, represents the global pooling and flattening operations. The resulting feature is a one-dimensional feature vector, where B denotes the batch size and C indicates the feature dimensionality (e.g., 512).
2.3. Text Feature Extraction Module
In AIS data, vessel length and width constitute the most fundamental geometric attributes, which directly reflect a ship’s size and type. For instance, cargo vessels typically exhibit a high aspect ratio, whereas tugboats tend to be shorter and wider. These geometric features are complementary to visual characteristics in SAR imagery, such as scattering patterns and structural contours. They assist the model in making accurate judgments even when visual cues are blurred or corrupted by noise. However, the length and width information in AIS data is usually represented as numerical values, making it difficult to fuse directly with high-dimensional visual features. To address this, we design a textual feature extraction module that embeds geometric information from AIS into the same semantic space as visual features.
Following the approach in Reference [22], for each sample, we concatenate the corresponding vessel length and width into a textual description string: “length is 292, width is 45, aspect ratio is 6.49”.
To extract features from the textual description, we employ a BERT model [39] pre-trained on a large-scale corpus as the text encoder. Given a textual description text of a sample, the BERT model encodes its context through a multi-layer Transformer architecture and outputs a hidden state vector for each token. In the pre-training design of BERT, a special classification token [CLS] is inserted at the beginning of the input sequence. The output vector corresponding to this token is designed to aggregate semantic information from the entire input sequence and is commonly used as a sentence-level global representation. Based on this property, we take the output vector corresponding to the [CLS] token as the global semantic representation of the whole text sequence, denoted as:
where denotes the forward computation of the pre-trained BERT model, and indicates taking the output at the position of the [CLS] token.
Since the output dimension of the BERT model (768) does not match that of the visual feature module (512), we introduce a learnable projection layer to map text features into the visual feature space. This projection consists of a linear transformation followed by a ReLU activation function, which is formulated as:
where is the weight matrix and is the bias vector, both of which are learnable parameters.
2.4. Multimodal Fusion and Classification Module
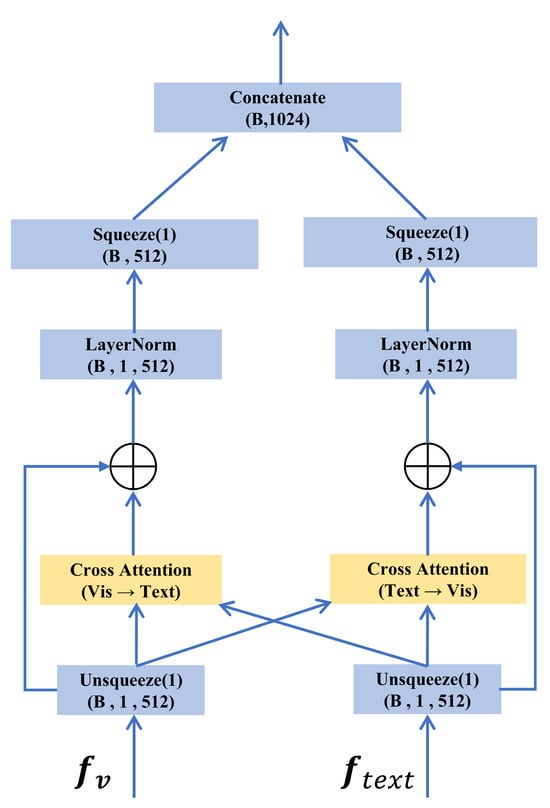
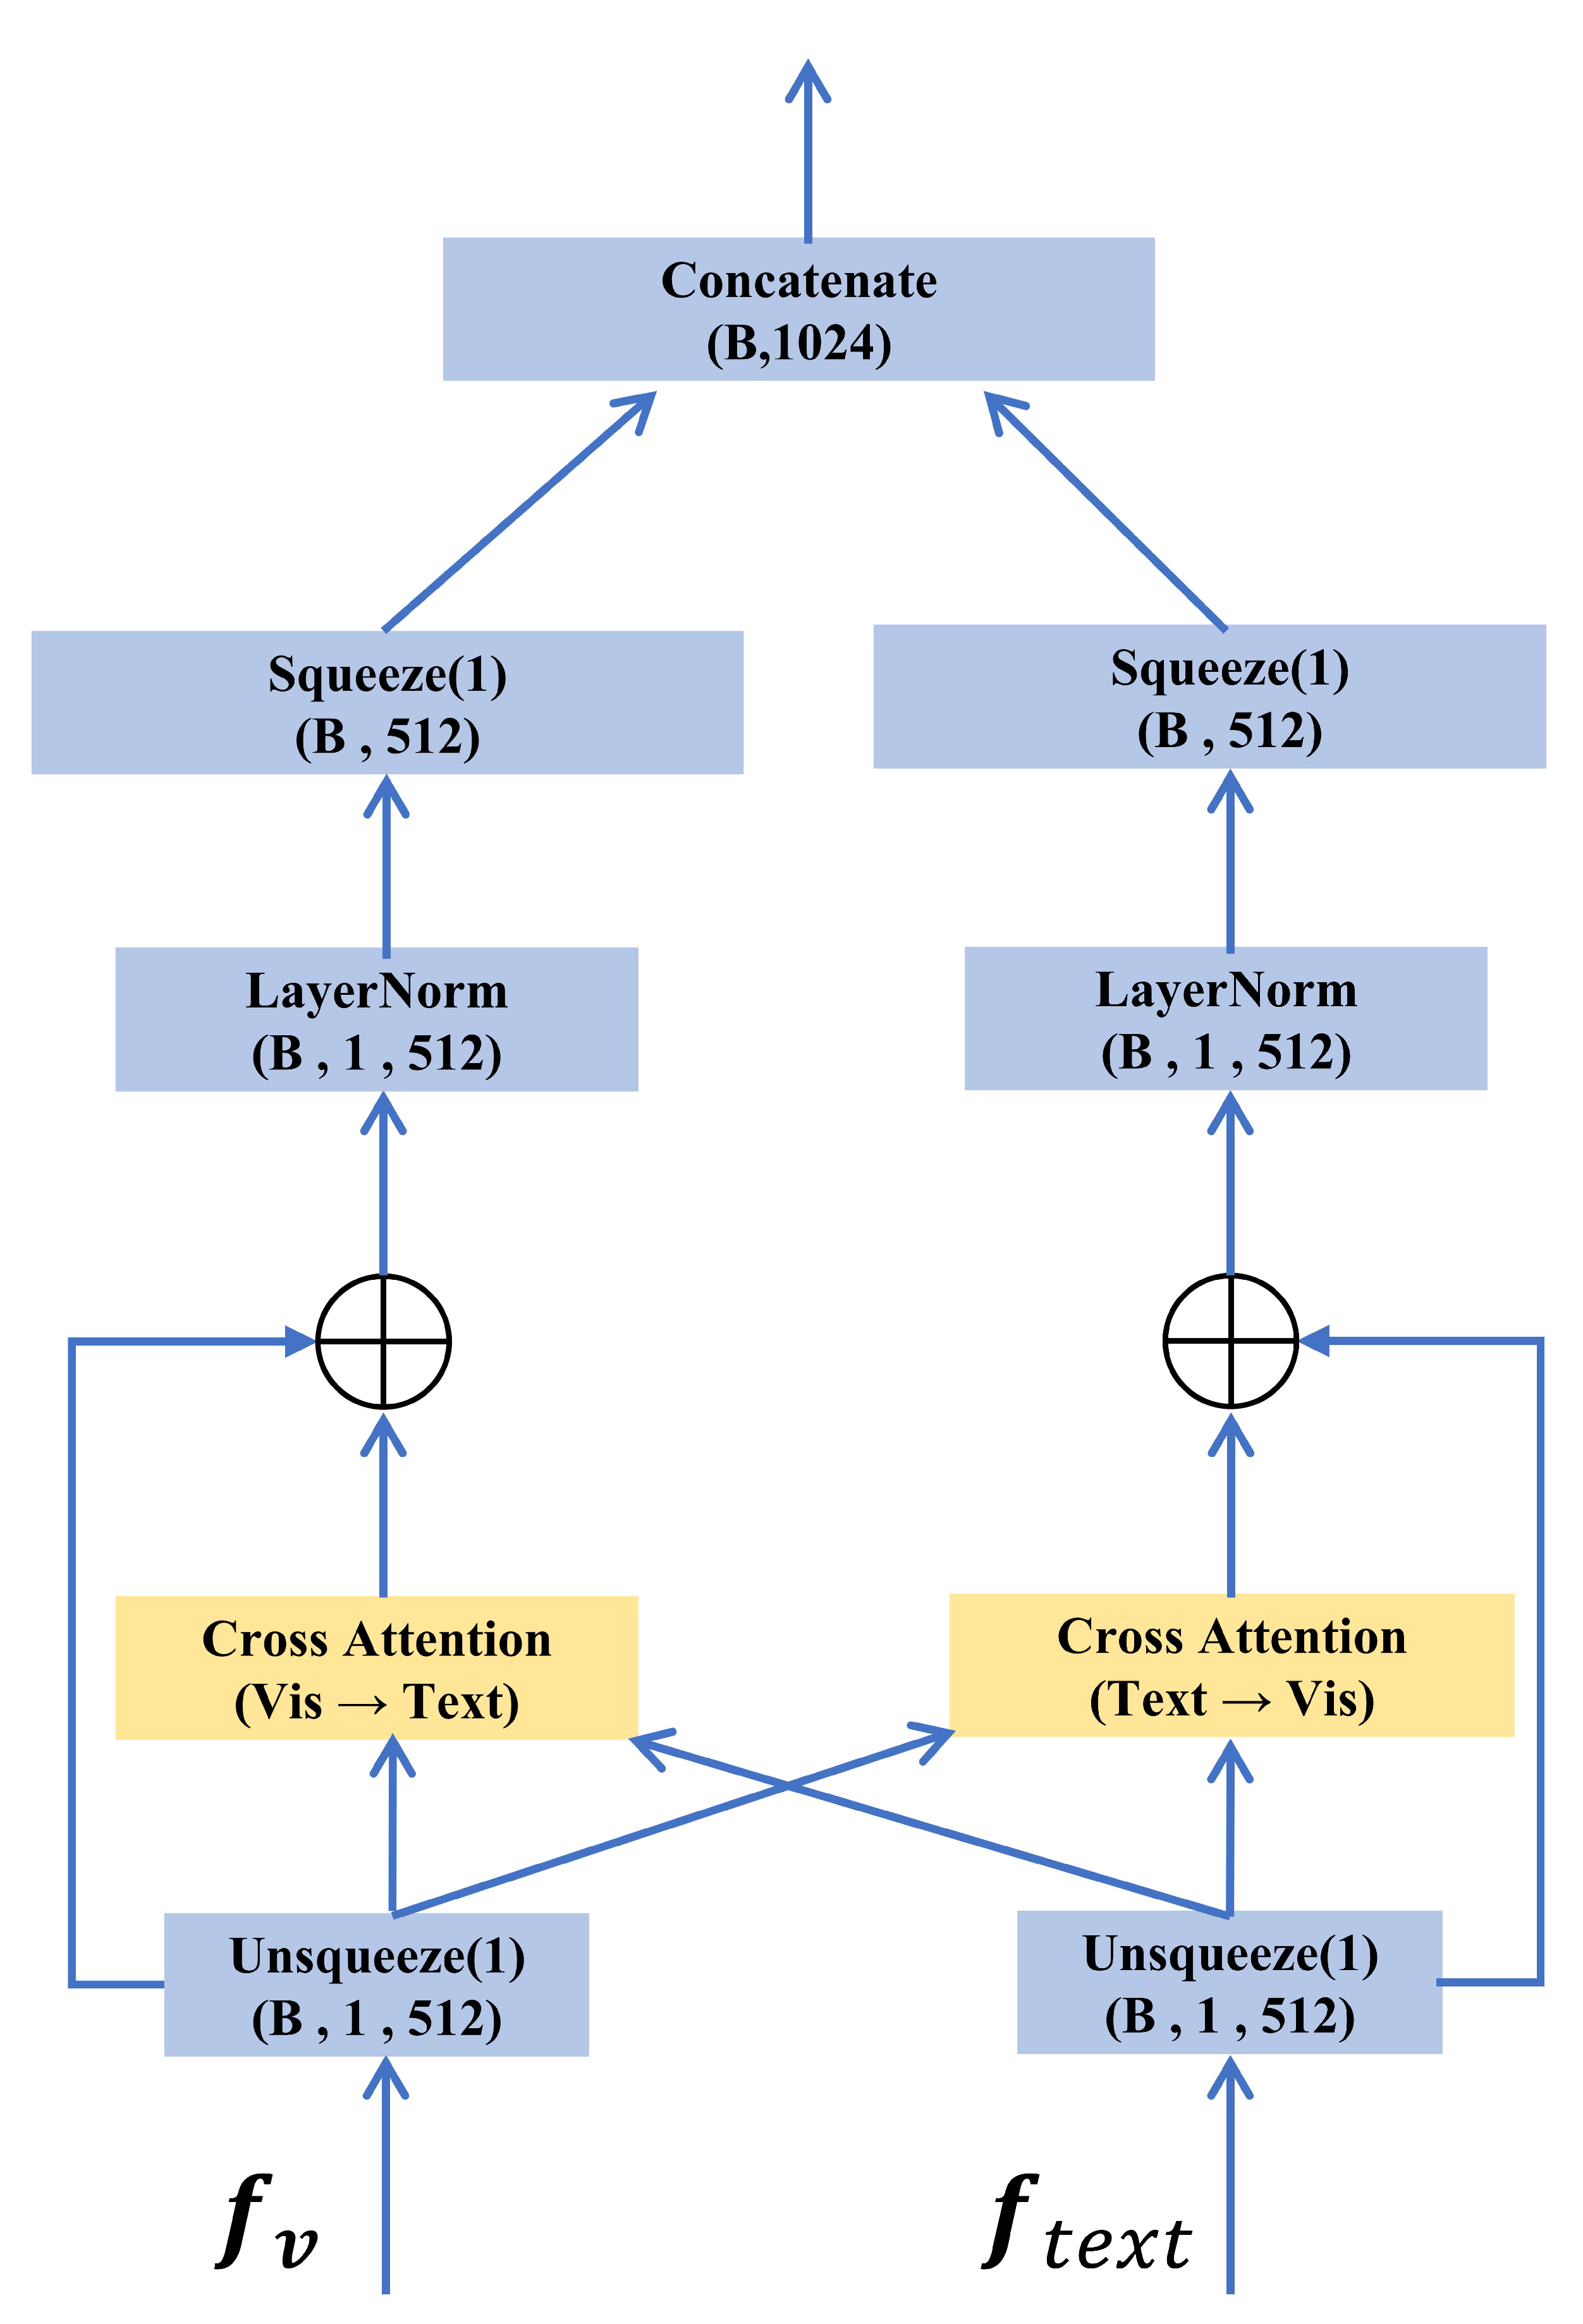
To achieve efficient fusion of SAR images and AIS information, we adopt a bidirectional cross-attention mechanism [40,41] to integrate the two modalities. Existing fusion approaches for SAR and AIS often rely on simple operations such as addition or concatenation, or employ large language models for integration. The former fails to effectively combine information, while the latter suffers from high computational cost and inefficiency. In contrast, the cross-attention mechanism effectively addresses both issues. It introduces a relatively small number of parameters compared to existing backbone networks, which prevents the model from overfitting due to the added structure. Moreover, cross-attention can discover common features between visual and textual representations at a deeper level. Extending this to a bidirectional design further allows the two modalities to mutually guide the fusion process, which proves more effective than using a single modality to steer the other. The specific implementation is illustrated in Figure 2.
Figure 2.
Illustration of the bidirectional cross-attention fusion module.
This module processes the outputs from the visual and textual branches, transforming the features and into sequential forms and , respectively. The bidirectional cross-attention mechanism is computed as follows:
where denotes the text-enhanced visual features and represents the vision-enhanced textual features, each incorporating information from the other modality. Here denotes the multi-head attention function. Following the description in [39], multi-head attention employs multiple parallel attention heads to capture information from different subspaces, computed as:
The model utilizes attention heads with a scaling factor of ; each represents a learnable parameter matrix. These parameter settings follow the standard practice of Transformer [38]. In Equations (15) and (16), the parameters of the attention function are not shared between the two directions. This design enables visual features to acquire geometric priors from the text, while textual features are augmented with scattering and texture information from the visual modality. The resulting enhanced sequence features are subsequently collapsed back to two dimensions, producing and . These features are then concatenated along the channel dimension:
where denotes the concatenation operation. The concatenated feature is first projected into a 512-dimensional space via a fully connected layer and then passed to a linear classifier for final prediction. The entire module is trained in an end-to-end manner. Through this bidirectional cross-attention mechanism, the two modalities guide each other during the fusion process, effectively leveraging the complementary characteristics of AIS-derived geometric information and SAR image physical properties to enhance classification performance.
3. Results
3.1. Dataset and Experimental Setup
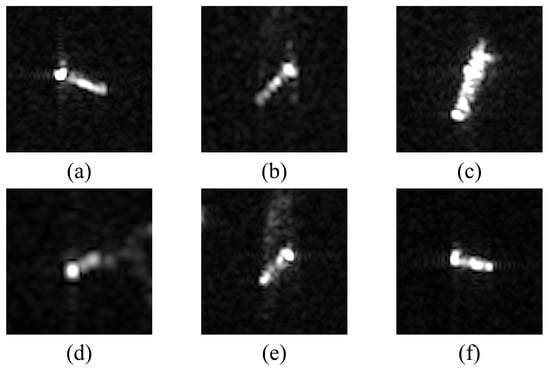
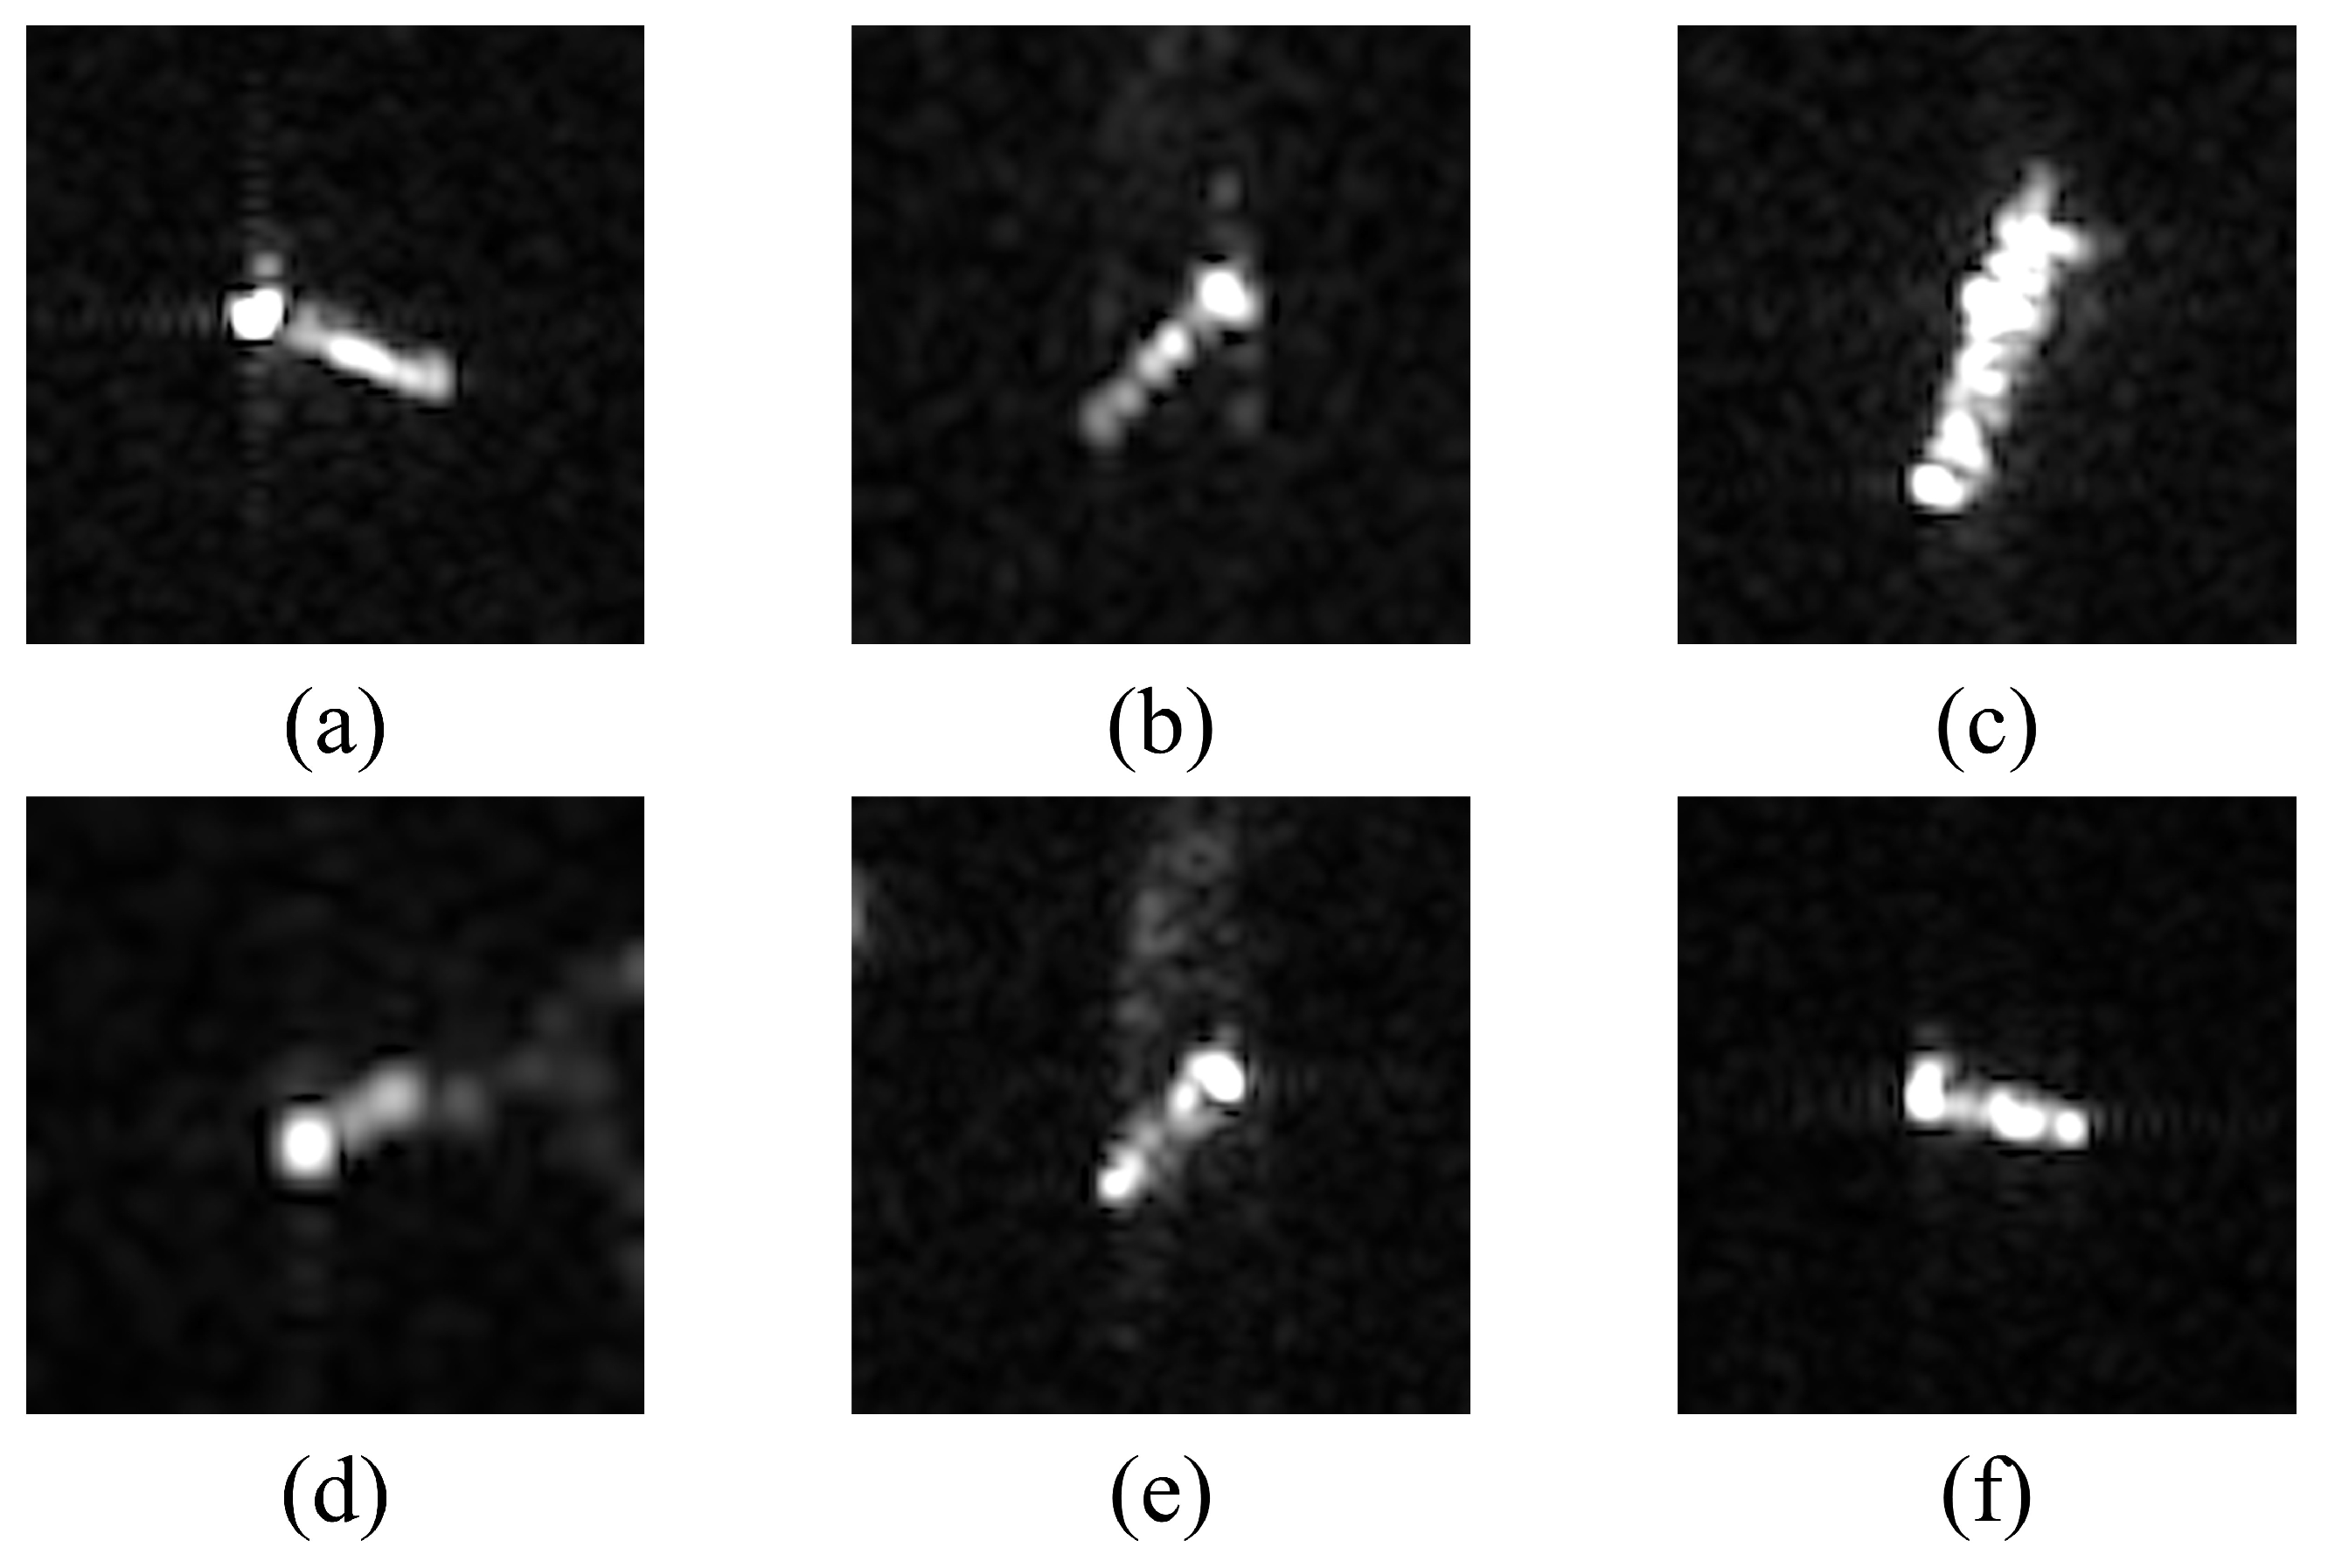
OpenSARShip 2.0 [30] is a dual-polarization SAR ship dataset constructed from Sentinel-1 satellite imagery. It comprises 34,528 ship image chips, covering ten of the world’s busiest ports, including the Port of Shanghai, the Port of Singapore, the Port of Yokohama, and the Port of Thames. Each chip is provided in both VV and VH polarizations and contains a single ship target. Precise class labels for these targets are obtained via spatiotemporal matching with AIS information. The spatial resolution is approximately 20 m in range and 22 m in azimuth. For comparative analysis and following the dataset configuration methods described in [21,42,43], we selected 2718 chips from the Bulk carrier, Container ship, and Tanker categories to form a three-class dataset. Furthermore, 4488 chips were selected from the Bulk carrier, Cargo, Container ship, Fishing, General cargo, and Tanker categories to form a six-class dataset. Both datasets were split into training and test sets using a 7:3 ratio. ratio. The number of samples for each ship category is detailed in Table 1. Sample images from the OpenSARShip 2.0 dataset are shown in Figure 3.
Table 1.
Number of samples per ship type.
Figure 3.
Samples from the OpenSARShip2.0 dataset. (a) Bulk carrier. (b) Cargo. (c) Container ship. (d) Fishing. (e) General cargo. (f) Tanker.
Our experiments were conducted using the PyTorch framework (version 2.1.2) on NVIDIA RTX 4090D GPUs with CUDA 11.8. The learning rate was set to . For the six-class classification task, the weight decay was , while for the three-class classification task, it was . The models were trained for 20 epochs with a batch size of 16. For image preprocessing, the images were first resized or cropped to a uniform size of pixels, then upsampled to pixels via interpolation, and finally standardized. In the Pauli decomposition, the constraint parameter is set to 15%.
3.2. Evaluation Metrics
We employ several standard classification metrics for evaluation: accuracy, precision, recall, and the F1 score. Their mathematical definitions are given below.
In these formulas, denotes true positives, denotes true negatives, denotes false negatives, and denotes false positives.
3.3. Experimental Results
This section presents the performance of the proposed method on the OpenSARShip 2.0 dataset for two classification tasks.
Table 2 shows the results for the three-category ship recognition task. All three ship classes possess distinctive features, which leads to high values along the diagonal of the confusion matrix. The overall classification accuracy reaches 89.03%, demonstrating the model’s reliable classification capability. Among the classes, the oil tanker category achieves the highest recognition accuracy.
Table 2.
Three-class classification confusion matrix of OpenSARShip 2.0.
Table 3 presents the performance of the proposed method on the OpenSARShip dataset for the six-class ship recognition task. The classification metrics show a decrease compared to the three-class task, with an overall accuracy of 71.43%. This decline is primarily attributed to the introduction of three new vessel types: Cargo, Fishing, and General cargo. Overall, for the six-class task, the Fishing, Container Ship, and Cargo categories achieve relatively high performance scores, indicating that their visual features are more distinctive and readily distinguishable. In contrast, the General cargo category yields the lowest performance metrics, suggesting that it lacks sufficiently distinctive features in low-resolution scenarios.
Table 3.
Six-class classification confusion matrix of OpenSARShip 2.0.
3.4. Comparative Analysis
To evaluate the effectiveness and performance improvement of the proposed LFPF-MFN for SAR ship classification, we select several state-of-the-art models for comparison, including those by VGG-11 [44], ResNet-18 [45], Swin Transformer [38], Swin TransformerV2 [46], Wang et al. [42], DSN [47], HOG-ShipCLSNet [48], HDSSNet [7], SE-LPN-DPFF [49], and DBDN [21]. All experiments are conducted on the OpenSARShip dataset, covering both three-class and six-class classification tasks. The corresponding results are presented in Table 4.
Table 4.
Comparison with state-of-the-art methods on OpenSARShip dataset.
The experimental results demonstrate the superior performance of our method on both the three-class and six-class tasks. On the six-class task, our approach achieves the best accuracy of 71.43%, outperforming other methods such as DSN (60.19%) and DBDN (64.26%). This improvement indicates that our method is more effective for multi-class classification under low-resolution conditions. For the three-class task, our method also attains a higher accuracy of 89.03% compared to existing approaches, further validating its effectiveness. Moreover, our method consistently yields the highest scores in Recall, Precision, and F1 on both tasks.
In summary, the proposed LFPF-MFN delivers strong performance on the OpenSARShip 2.0 dataset for both three-class and six-class classification. Compared to existing methods, it shows advantages across all four key metrics: accuracy, precision, recall, and F1 score, with particularly notable gains in the more challenging six-class task. These results suggest that the designed learnable feature preprocessing front-end, the improved texture feature extraction, and the bidirectional cross-attention fusion mechanism collectively enable the model to better exploit the physical properties of SAR images and the geometric AIS information, thereby extracting more discriminative features in complex classification scenarios.
3.5. Analysis of Model Efficiency and Generalization
To verify the lightweight nature of the parameters introduced during preprocessing and the bidirectional cross-attention mechanism, we compute the total number of parameters and the computational efficiency for each module. The results are presented in Table 5. Experimental results demonstrate that the computational complexity of the entire model primarily stems from the encoder of the visual branch. The learnable preprocessing module we design contributes minimal additional parameters, and its FLOPs are nearly negligible compared to other components. Furthermore, both the total parameter count and FLOPs of the projection layer in the text branch and the bidirectional cross-attention mechanism are negligible relative to those of the visual encoder. We also set up a baseline to compare the model performance. The baseline model uses the full Base version of Swin Transformer [38]. Our model adopts two Swin-Base encoders. Comparing with the baseline, it can be seen that most of the computational cost of our model is consumed by the visual encoders, rather than by our designed lightweight preprocessing module.
Table 5.
Computational complexity and FLOPs of each module. (The metrics associated with the classification head are integrated into the bidirectional cross-attention.)
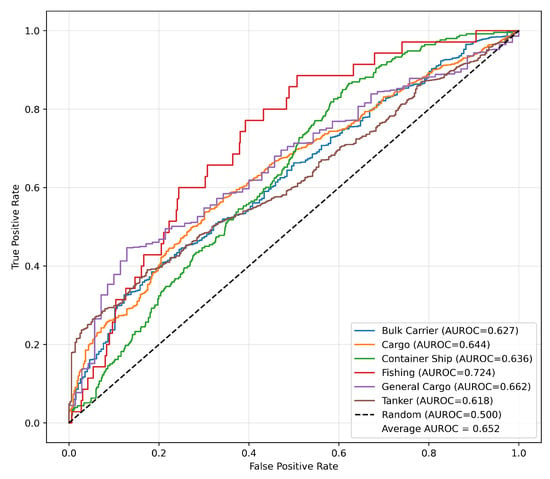
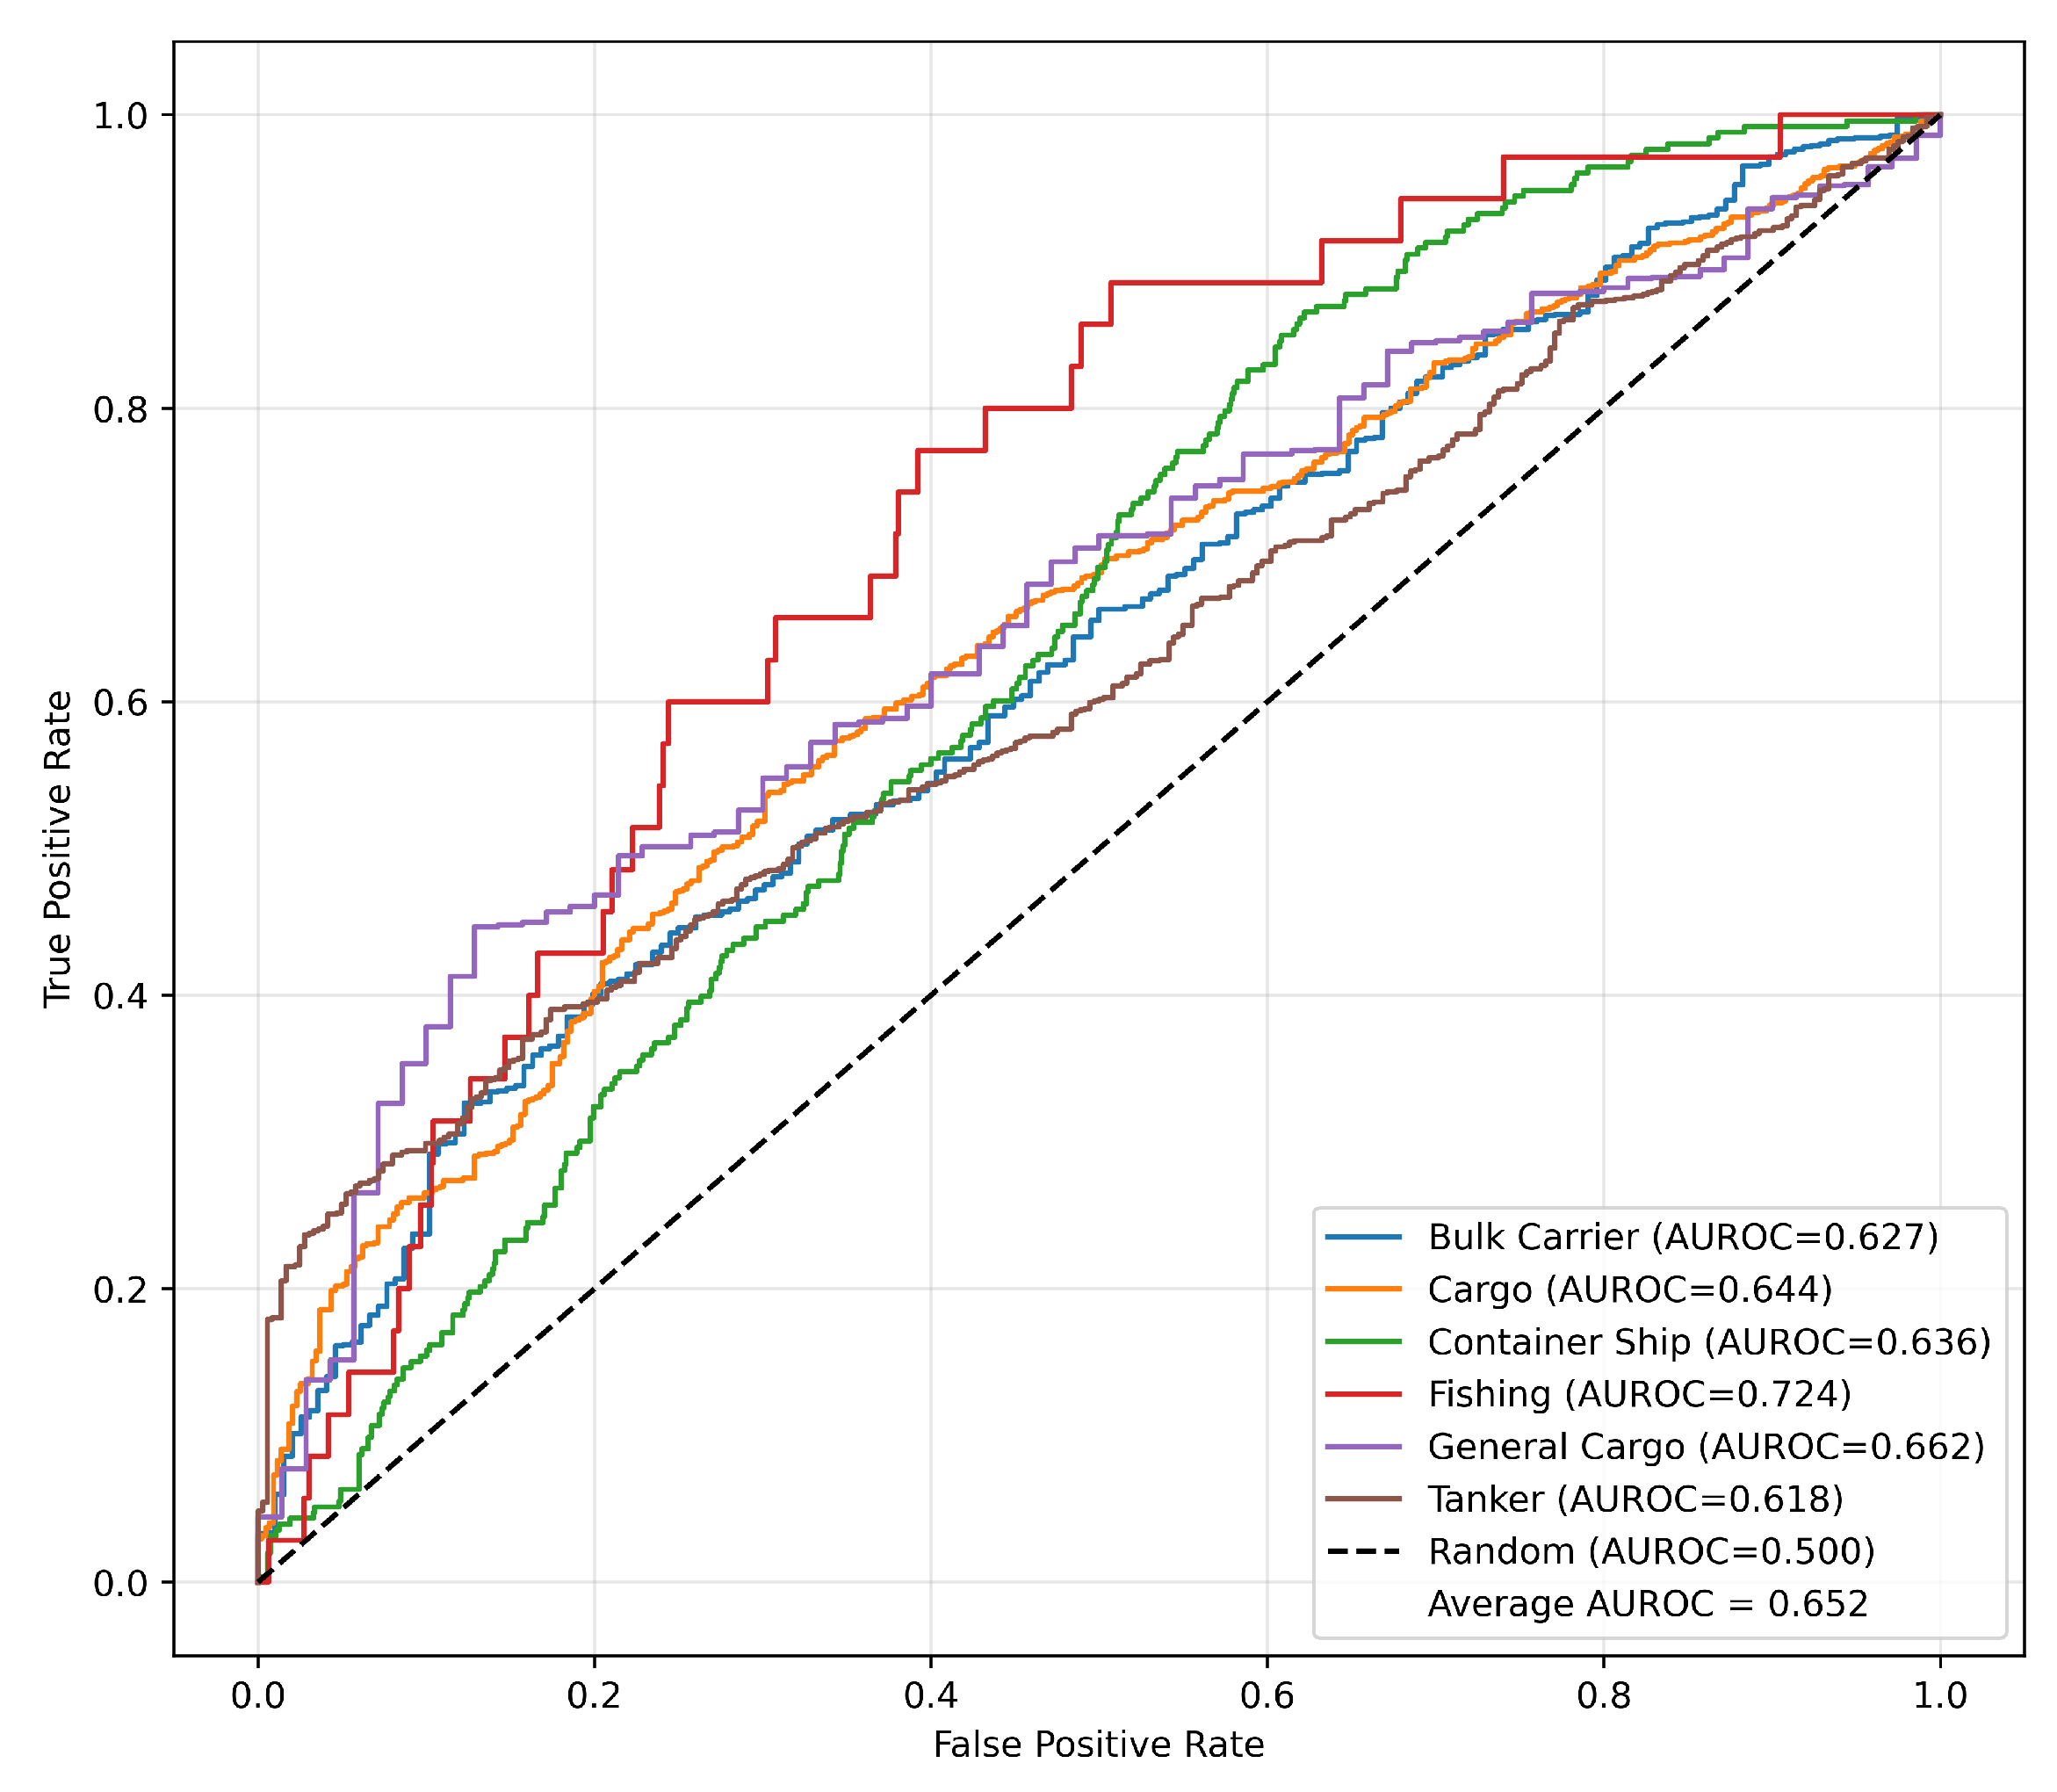
To evaluate generalization, we conduct open-set classification experiments on the OpenSARship 2.0 dataset. In each of the six experimental groups, the model is trained on five categories while one category is withheld for open-set recognition. We train all six groups using the same hyperparameters originally configured for the six-class classification task, obtaining a distinct set of weights for each group. Although this approach does not yield the optimal performance achievable in a dedicated five-class setting for each group, it better reflects real-world deployment scenarios where one cannot fine-tune hyperparameters for each unknown category in advance. Consequently, this protocol provides a more realistic assessment of the model’s generalization capability under standard configurations. The open-set detection performance is measured by the Area Under the Receiver Operating Characteristic Curve (AUROC). This metric ranges from 0 to 1, with higher values indicating a stronger ability to discriminate between known and unknown classes, and 0.5 corresponding to the random guess baseline. As shown in Figure 4, the model achieves an average AUROC of 0.652, with the AUROC exceeding 0.60 in every experimental group. This result indicates that the model possesses a certain degree of generalization capability even without fine-tuning its training parameters.
Figure 4.
ROC Curves for Leave-One-Out Open-Set Detection.
4. Discussion
To evaluate the contributions of individual modules, this section conducts an ablation study. We assess the impact of the AIS text information embedding, the multimodal fusion module, and the learnable feature preprocessing front-end. The experiments are based on the six-class OpenSARShip classification benchmark, with a focus on four metrics: recall, precision, F1-score, and accuracy.
4.1. Impact of AIS Text Information Embedding
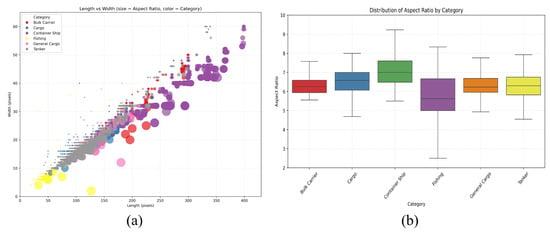
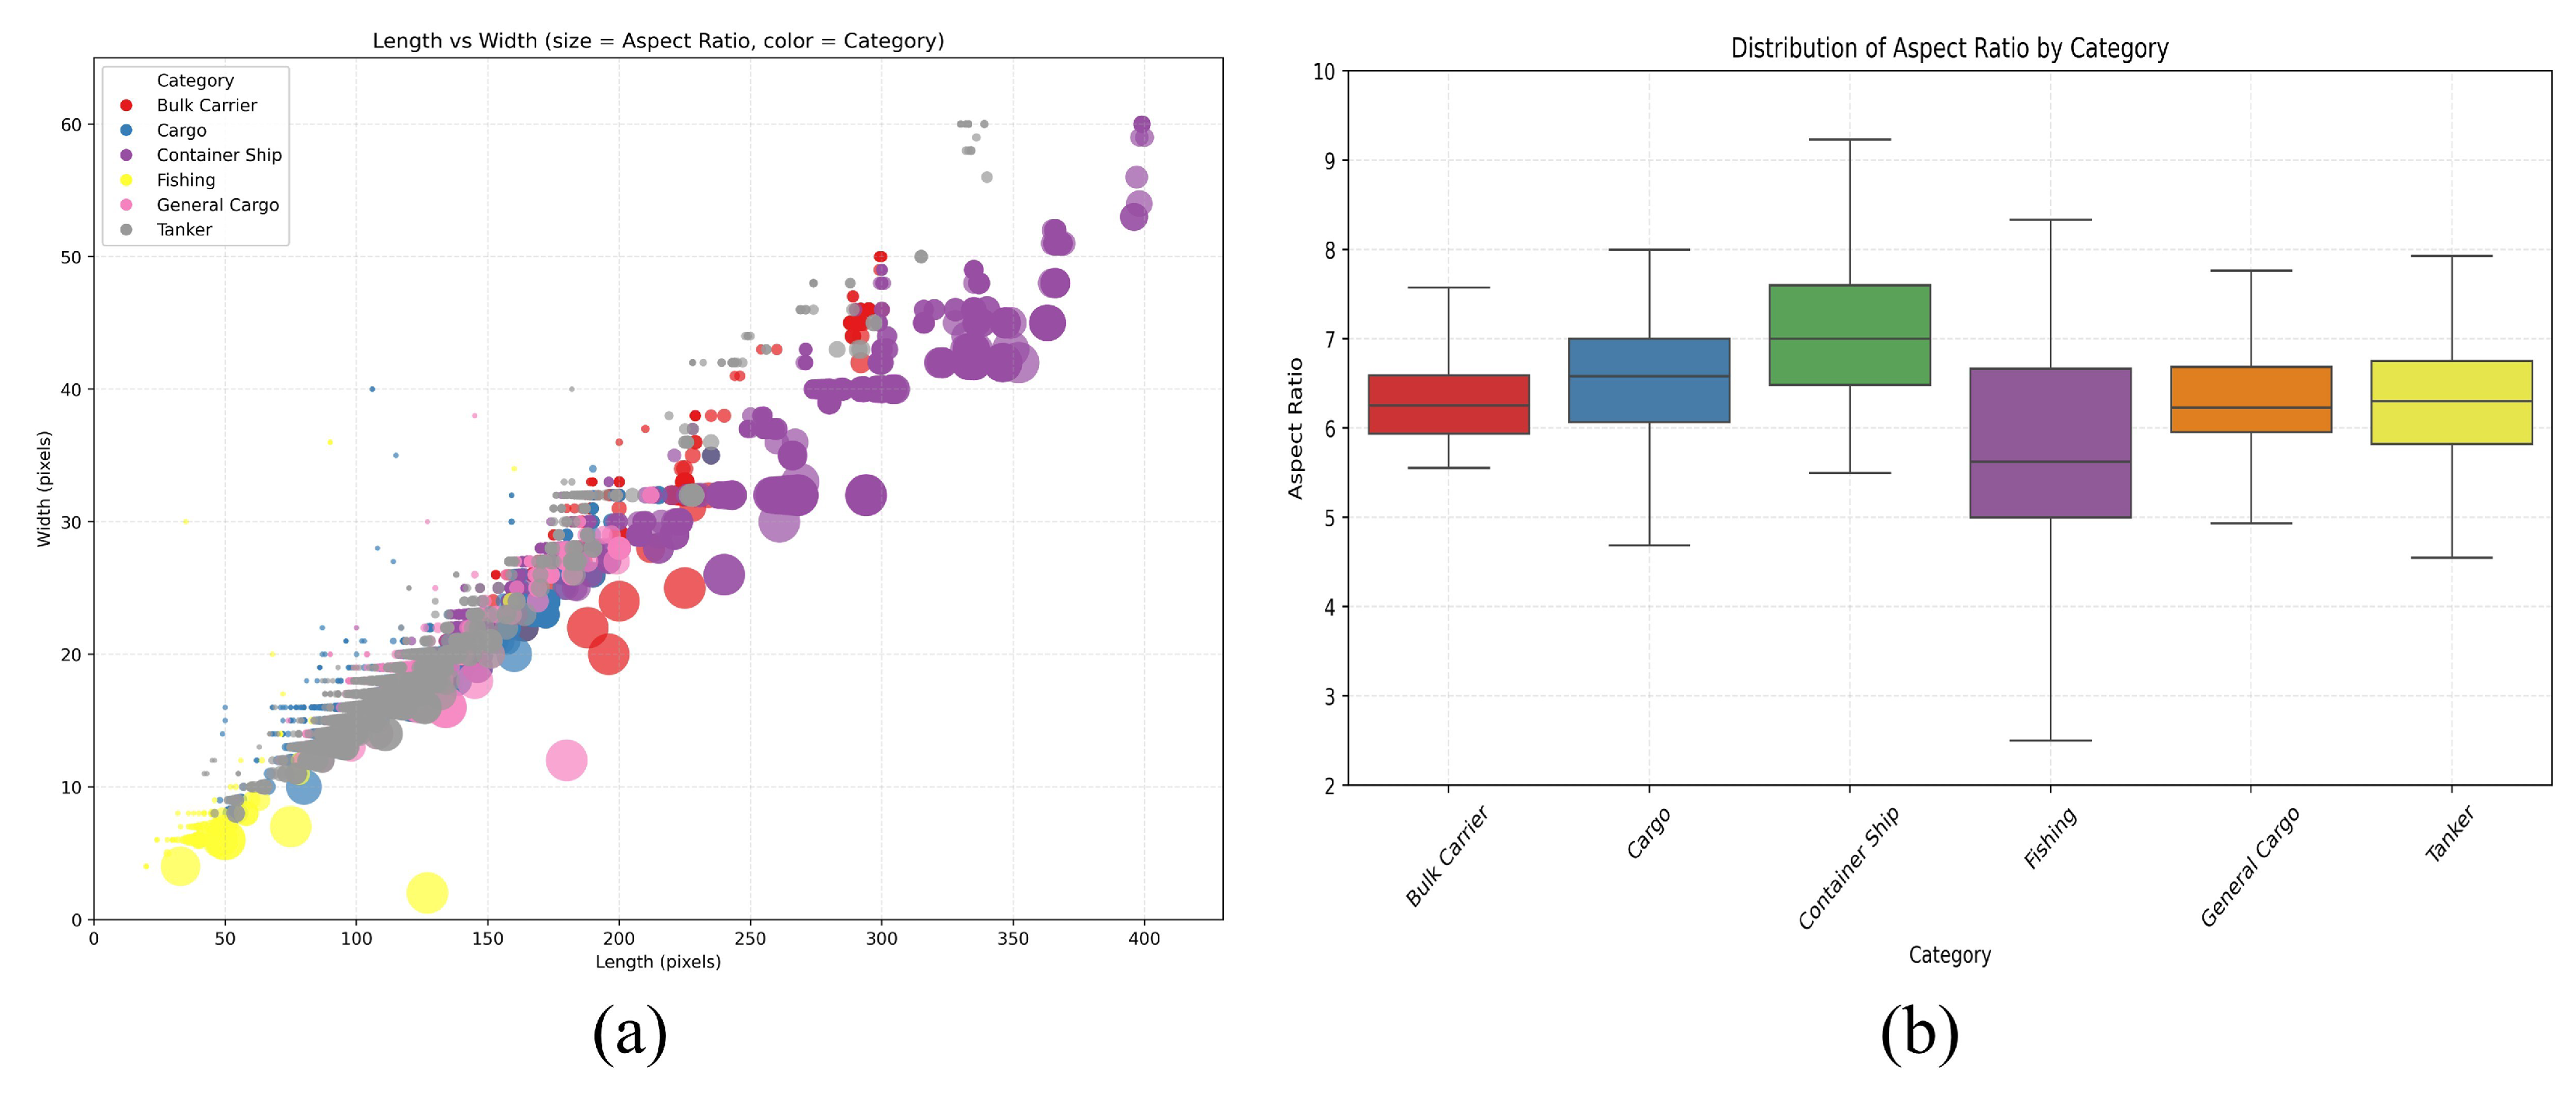
As textual vessel reports, AIS messages provide information that inherently supports target classification. The length-to-width ratio, one of the static attributes in AIS data, varies across different vessel types. We collect the length and width from AIS records corresponding to the 4488 vessel slices in our experiment and compute their length-to-width ratios, as illustrated in Figure 5. Figure 5a shows considerable variation in both dimensions and length-to-width ratios among the six vessel categories. A detailed comparison via box plots in Figure 5b further reveals distinct differences in these ratios across categories. However, General Cargo shares similar dimensions and length-to-width ratios with several other categories, such as Tanker and Cargo. This overlap likely contributes to its relatively poor classification performance reported in Table 3, since its key characteristics are not sufficiently distinctive. In contrast, categories like Fishing and Container Cargo exhibit dimensions that differ markedly from the remaining four classes, which explains their significantly higher classification metrics. Overall, vessel dimensions serve as discriminative features for category separation, justifying their inclusion in a multimodal fusion framework. To investigate the impact of embedding dimensional information, we conduct an ablation study; the results are presented in Table 6.
Figure 5.
Distribution of AIS geometric features for different ship categories. (a) Scatter plot of ship length vs. width. The x-axis represents length, the y-axis represents width, and the bubble size indicates the aspect ratio. (b) Box plot of aspect ratios. The x-axis represents ship categories, and the y-axis represents aspect ratio.
Table 6.
Ablation study on AIS information.
From the first row of Table 6, we observe that when AIS information is not integrated, the accuracy metric drops to 67.73%, and other metrics also exhibit a significant decline. This result indicates that in low-resolution scenarios, visual features alone are insufficient to distinguish between different vessels. The introduction of AIS textual information assists the model in identifying more discriminative features for the targets, thereby improving classification performance.
To evaluate the improvement contributed by the AIS embedding to each category, we conduct a classification experiment using only the SAR modality by removing the text branch. The confusion matrix of this experiment is presented in Table 7.
Table 7.
Six-class classification confusion matrix of OpenSARShip 2.0 under a single SAR modality.
While the results from a single modality remain reasonably strong across most metrics, the performance for the General cargo class is notably lower. This likely stems from our training protocol, which assigns equal loss weights to all classes, thereby failing to direct sufficient learning focus to categories that are inherently difficult to distinguish. As illustrated in Figure 5, the length and width attributes of General cargo vessels exhibit significant overlap with most other classes, except for Fishing. This situation is also evident in the corresponding confusion matrix. Consequently, even after integrating AIS data, the performance for this class shows limited improvement. For the Tanker class, metrics were also relatively low prior to AIS embedding, with a substantial number of vessels being misclassified as Cargo. The incorporation of AIS information, which provides prior knowledge of dimensional attributes, helps the model better discriminate between these two classes, reducing the number of Tanker instances erroneously assigned to Cargo. Regarding the Cargo class, the introduction of AIS data yields an improvement in the F1 score, although it comes with a trade-off of an approximately 4% decrease in precision. Given the overall performance gain for the model, this marginal precision loss is acceptable. For the remaining categories, embedding AIS information similarly aids discrimination. These observations collectively underscore the significant role of AIS data in enhancing the classification performance for SAR imagery.
In practical applications, AIS data may contain a certain level of noise or errors. To emulate this realistic scenario, we synthetically corrupt the AIS data by randomly modifying 10% and 20% of the records. We then evaluate whether the remaining AIS information still contributes to performance gains under such conditions. The results are presented in Table 8.
Table 8.
Model performance under different AIS scenarios.
Table 5 shows that despite its large parameter count, the BERT text encoder requires less than one-tenth the FLOPs of a single visual encoder. This efficiency arises because BERT processes short text sequences, which entail minimal computational overhead; thus, integrating BERT does not substantially increase the model’s complexity. To verify the benefits of BERT in terms of efficiency and performance, we compare it with an MLP-based approach that directly embeds AIS text into numerical values. The results are presented in Table 9.
Table 9.
Ablation Results with Different Text Encoders.
4.2. Impact of the Multimodal Fusion Module
To evaluate the performance improvement brought by the bidirectional cross-attention mechanism, we conduct an ablation study on the six-class classification task using the OpenSARShip 2.0 dataset. Table 10 shows that when the model employs simple element-wise addition for feature fusion, the accuracy drops to 68.99%. When concatenation is used instead, the accuracy decreases to 69.73%. The other three evaluation metrics also exhibit a certain degree of degradation. These results indicate that fusing AIS textual features and SAR image visual features via the bidirectional cross-attention mechanism yields superior performance. Moreover, the bidirectional cross-attention module itself introduces a very small number of parameters compared to the visual and textual encoders, thus adding negligible computational overhead to the model.
Table 10.
Ablation Study Results of Different Fusion Methods.
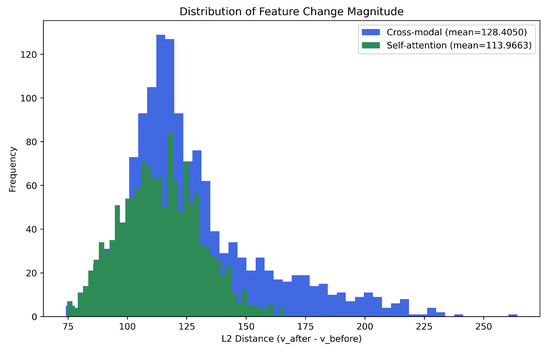
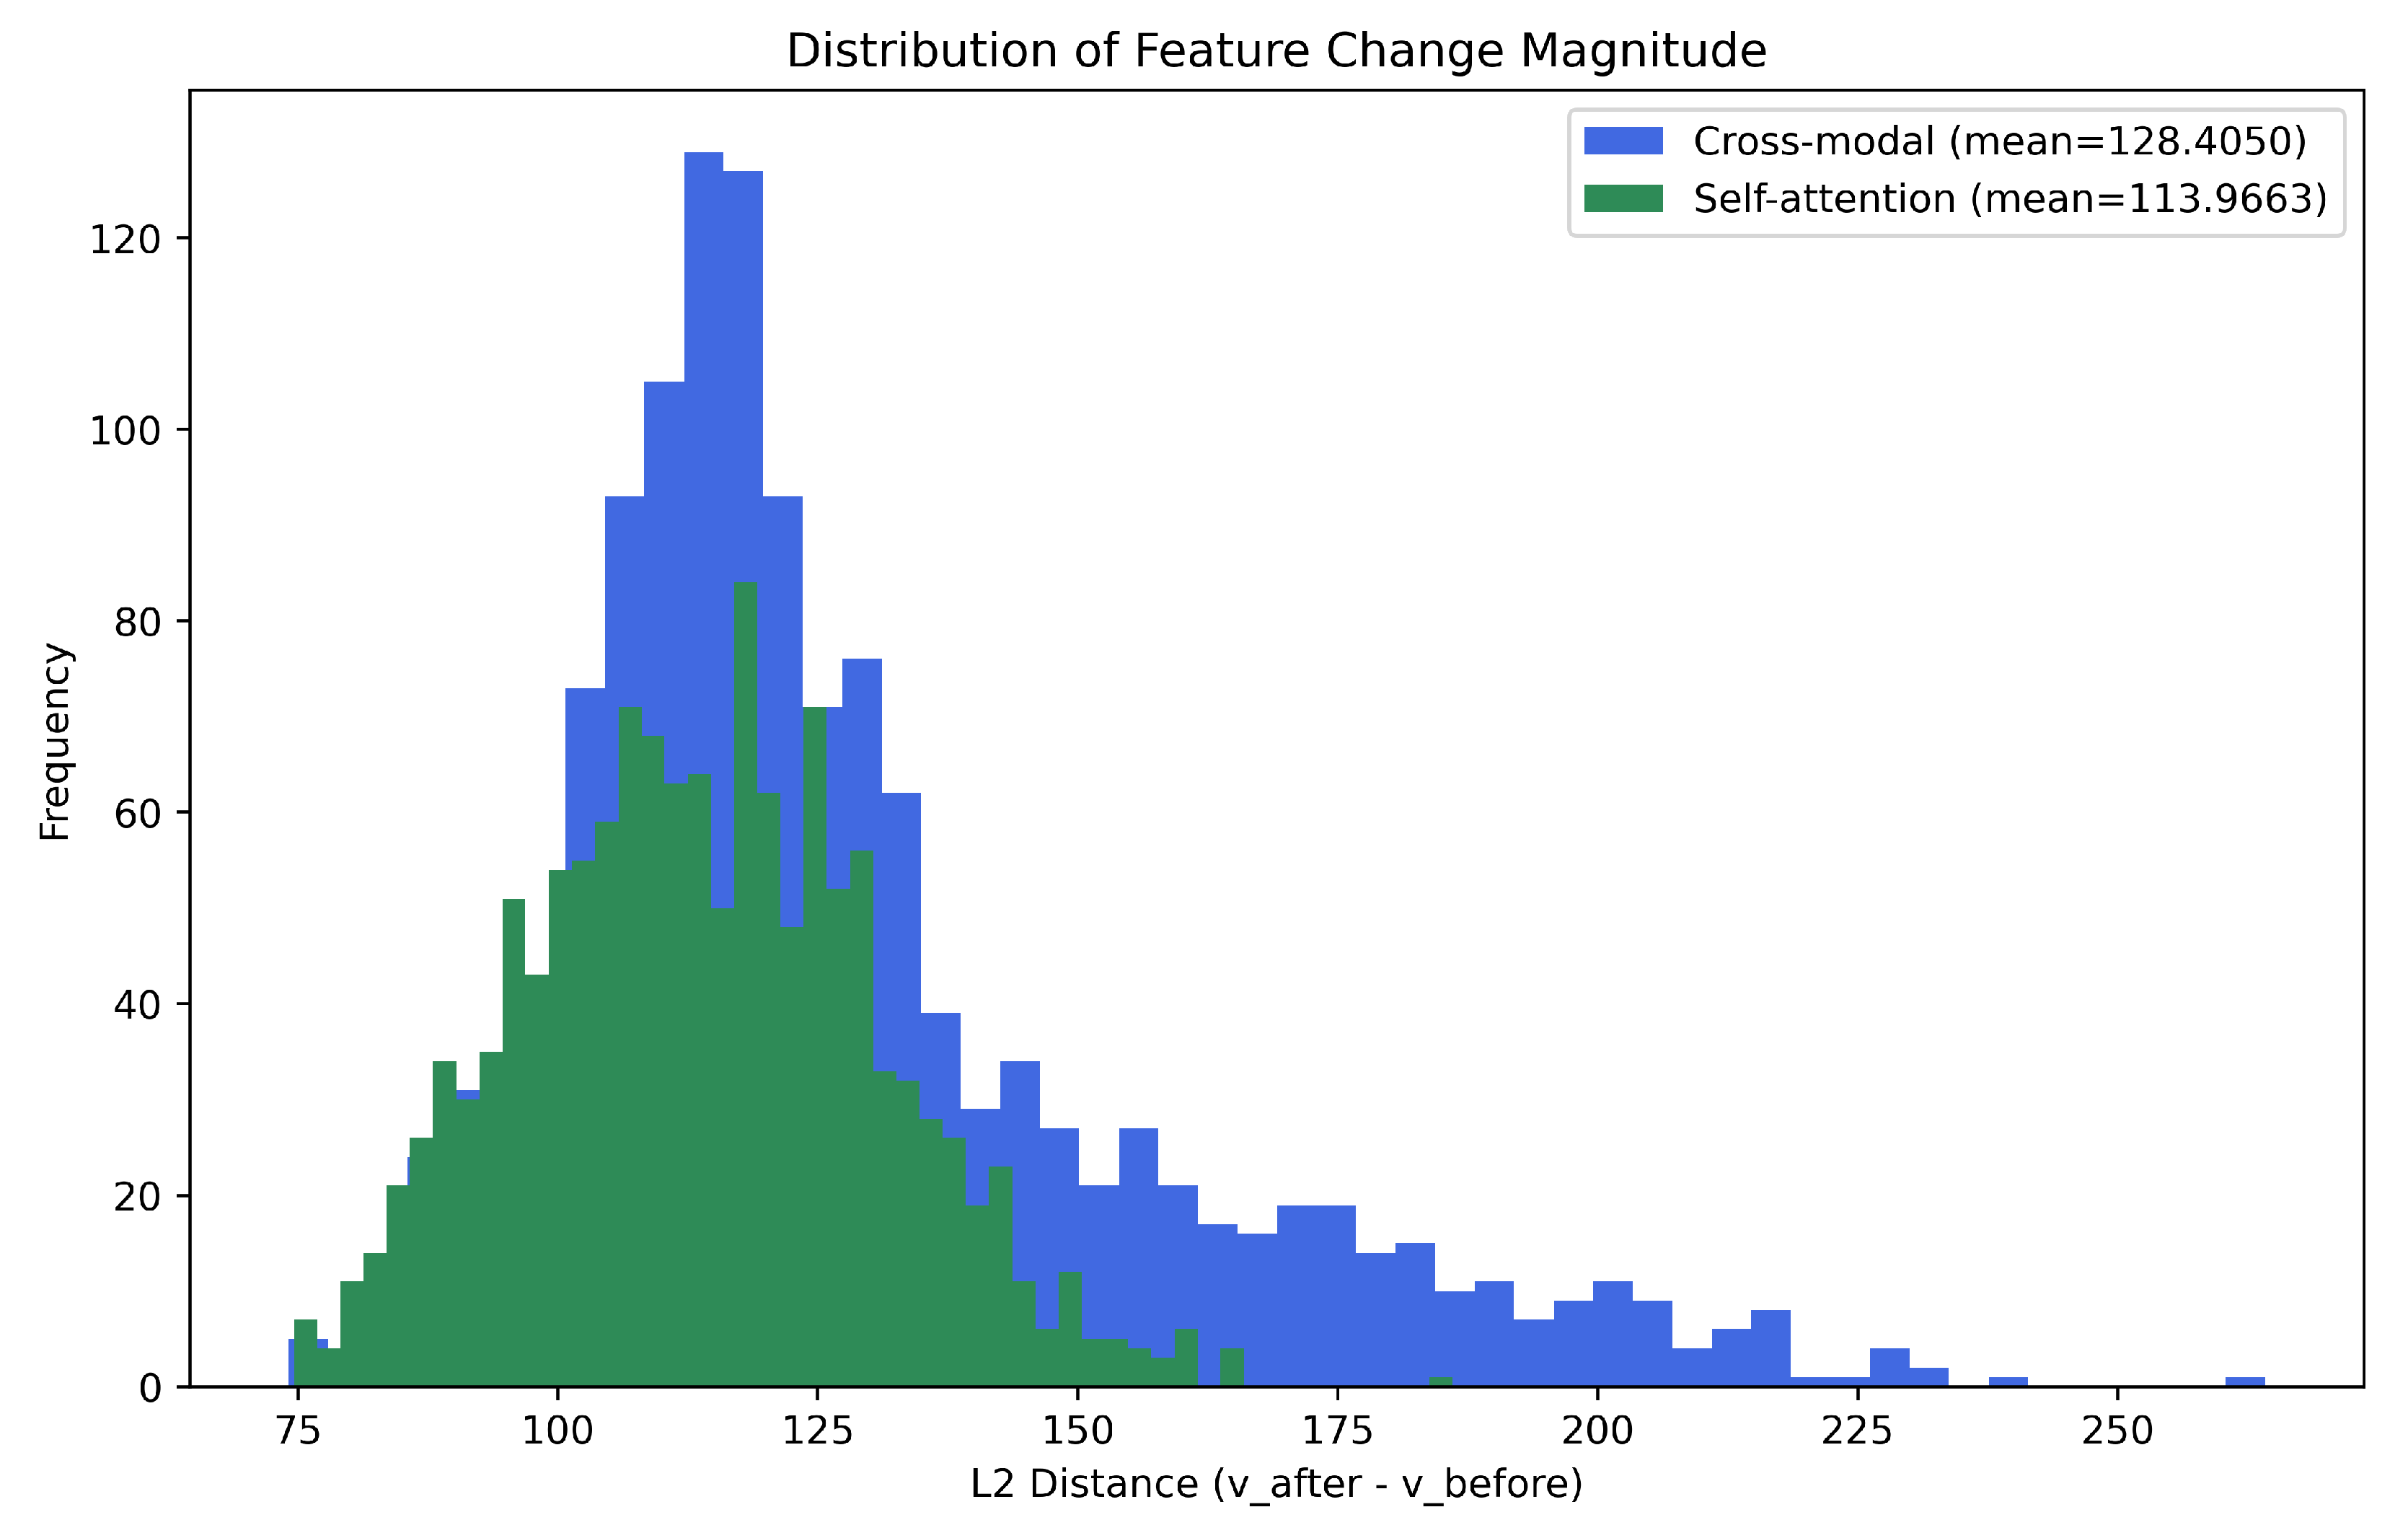
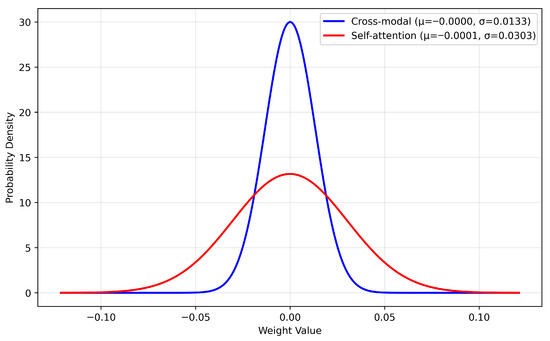
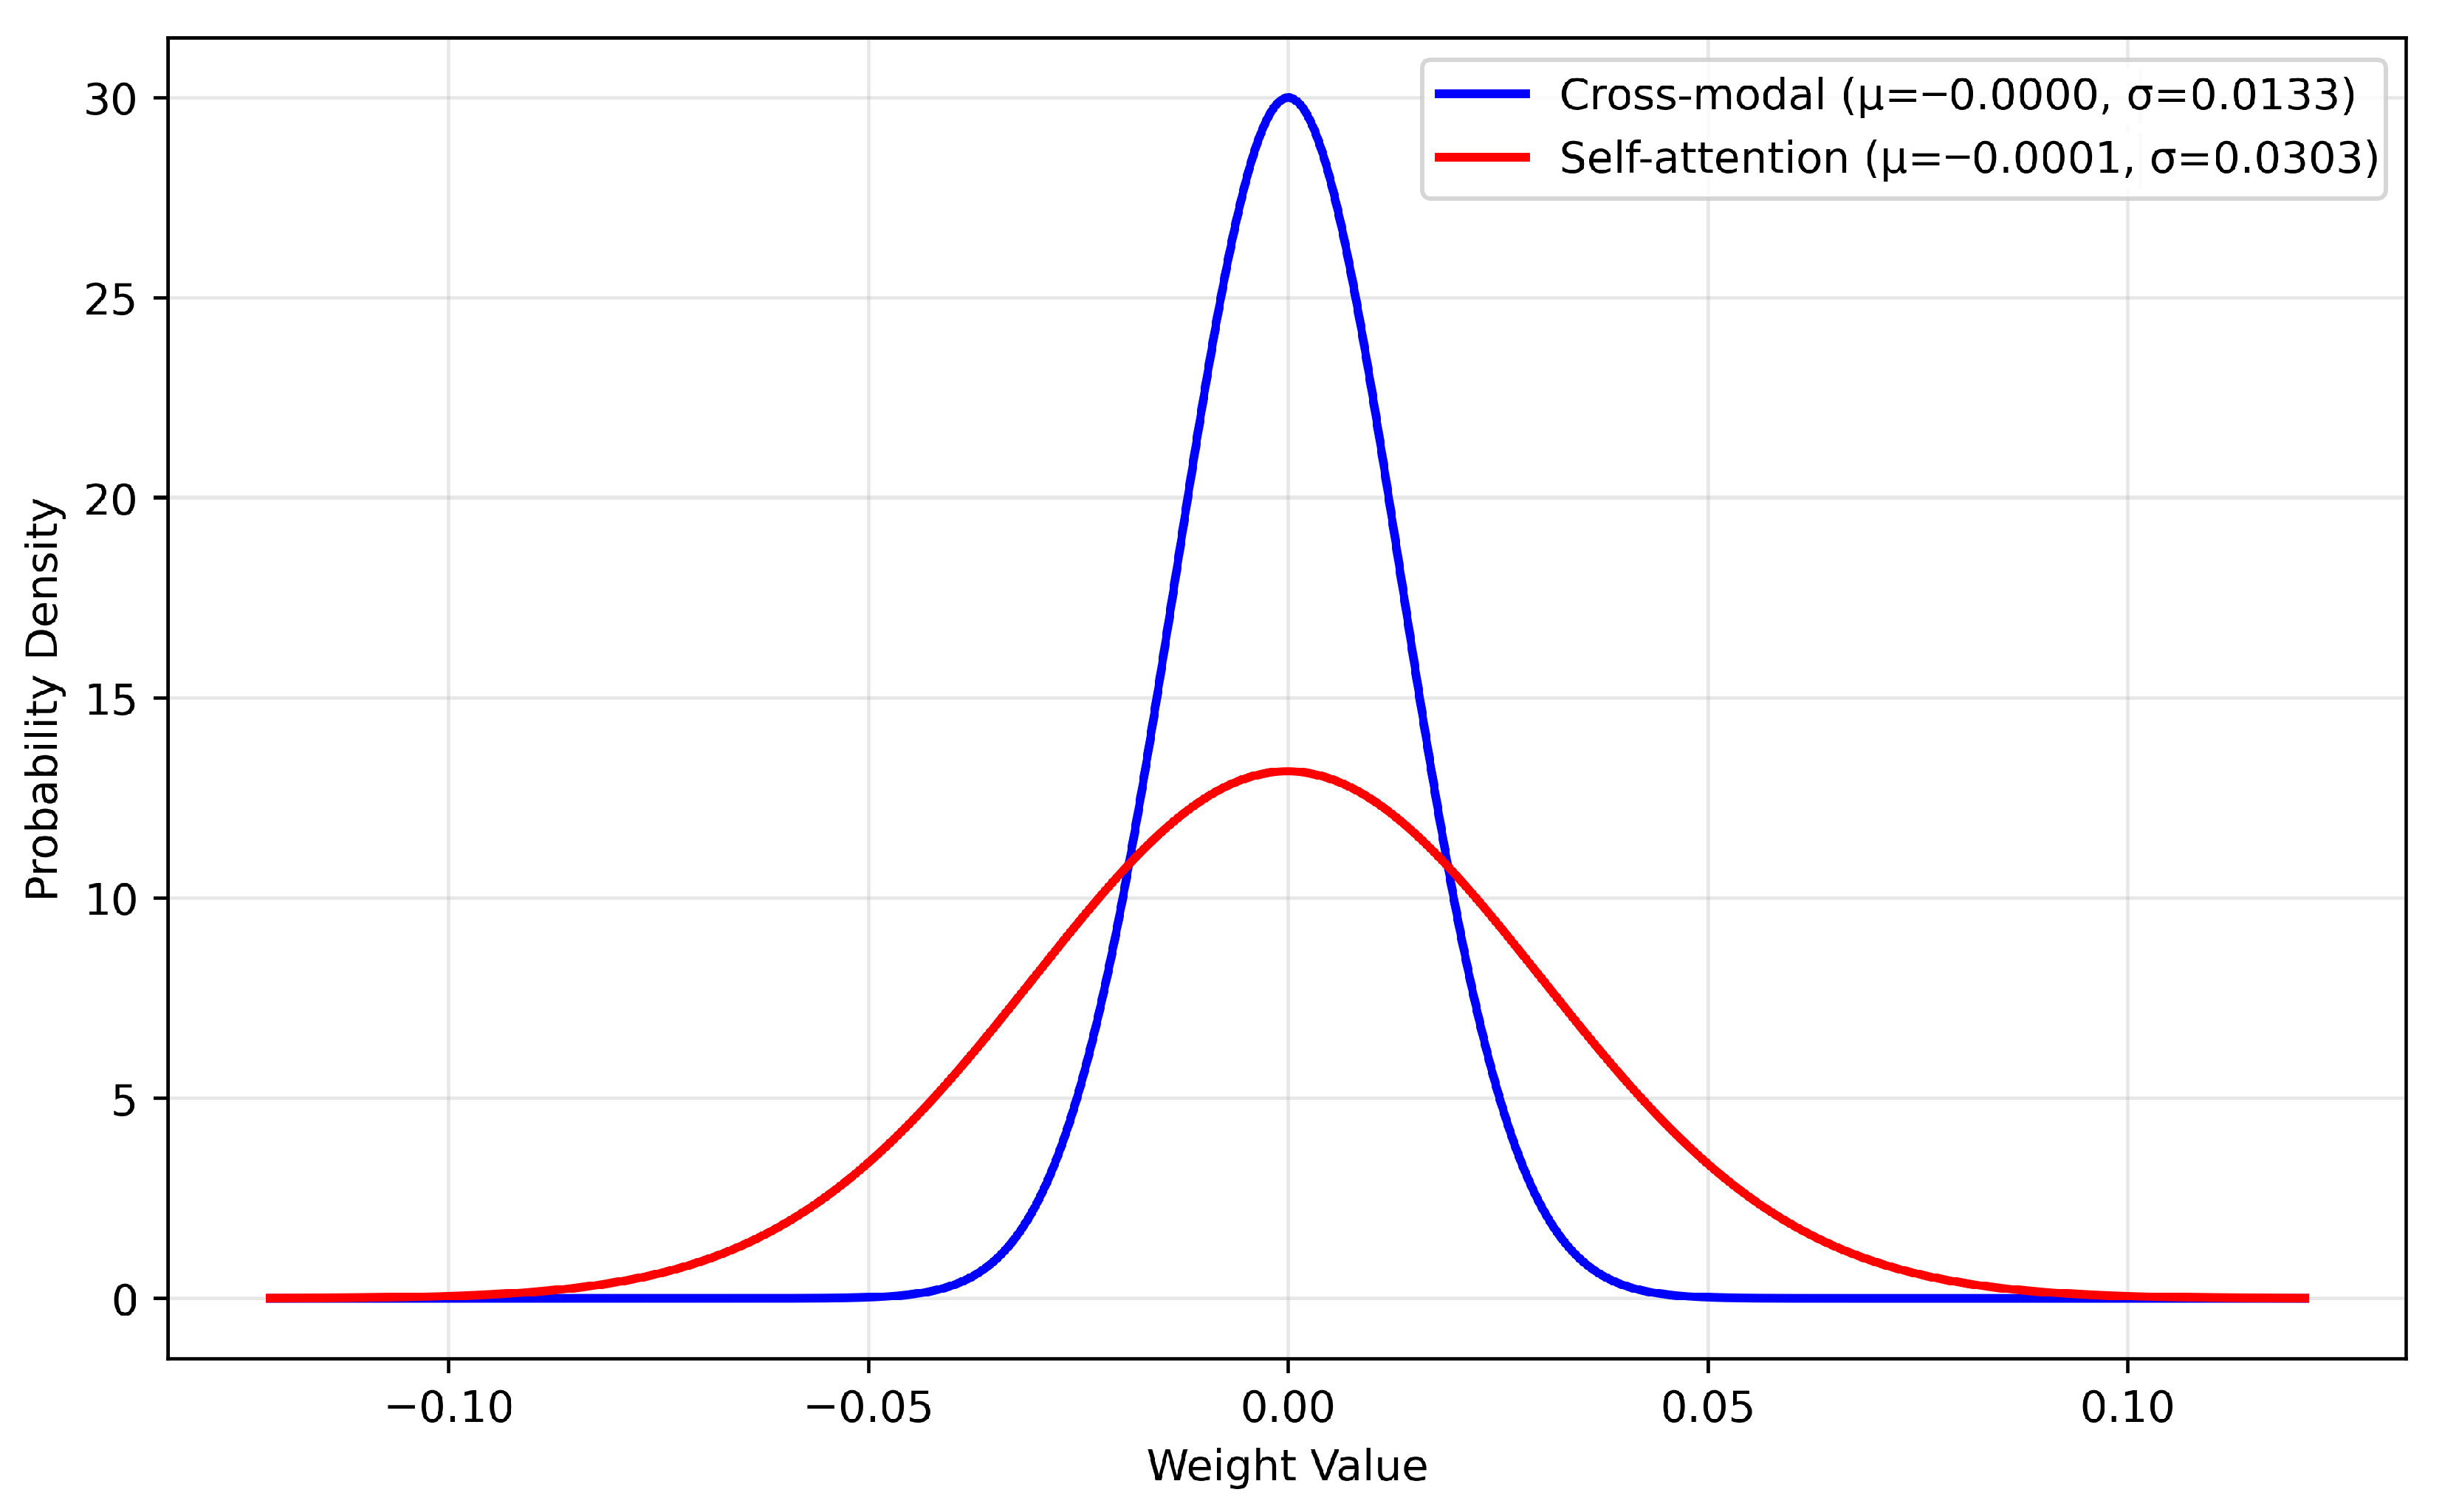
Since global pooling is adopted, the attention weights are difficult to visualize. To verify the interaction between textual and visual features, we replace the inputs to the cross-attention mechanism with inputs from the same modality, thereby degenerating it into a self-attention mechanism (the accuracy achieved by training with self-attention is 69.21%). We then extract the feature distributions before and after the attention mechanism to examine whether interaction occurs, and the results are shown in Figure 6. By computing the L2 distance between features before and after the attention mechanism, we measure the magnitude of feature shift under interactive and non-interactive conditions. It is observed that the feature shift is larger when cross-attention interaction is employed, and the classification accuracy is also higher than that without interaction. This indicates that the cross-attention mechanism enables a deeper fusion of the two modalities, leading to improved performance. In addition, we also provide the changes in the module’s weights before and after modal interaction to facilitate an intuitive understanding of the weight variations. The results are shown in Figure 7.
Figure 6.
Distribution of Feature Change Magnitude.
Figure 7.
Weight distribution of the module before and after modal interaction.
4.3. Impact of the Learnable Feature Preprocessing Front-End
Preprocessing SAR images provides ample prior knowledge to the model, which enables the model to concentrate more on the relevant scattering and texture features. To assess the impact of integrating these features along with learnable parameters, we conduct an ablation study on the visual features in the absence of AIS integration, as shown in Table 11.
Table 11.
Ablation Study Results of SAR Image Preprocessing.
When the VV and VH amplitude images are used as input, duplicated into three channels, the accuracy drops to 55.22% and 56.40%, respectively. In contrast, the use of scattering and texture pre-processing elevates the accuracy to 64.77% and 65.36%. This demonstrates that the pre-processing step indeed enhances classification performance. Moreover, when scattering and texture features are combined, classification performance improves further, reaching an accuracy of 66.17%. These results indicate that texture and scattering features provide complementary information, which jointly helps the model identify discriminative features for separating different classes.
In the preprocessing of scattering features, we introduce a constraint parameter . Here we discuss the necessity of this constraint. As shown in Table 12, setting leads to a slight performance drop. This is because the initial parameters of the scattering feature preprocessing already possess strong scattering representational capacity; making them learnable allows the model to adapt to the current dataset through fine-tuning. Relaxing the constraint makes it harder to reach the optimal performance.
Table 12.
Ablation experiment using different constraint parameters.
To validate the impact of introducing learnable parameters into the preprocessing stage, we initialize all learnable components in the preprocessing modules with fixed values and keep them frozen during training. For instance, the scattering feature preprocessing directly employs the Pauli decomposition, while the convolutional kernels for texture features are initialized to one. The ablation results are summarized in Table 13. Specifically, removing the learnable parameters from the preprocessing causes a drop of approximately 2% across all evaluation metrics. Although the default fixed parameters yield reasonably good performance, incorporating the preprocessing into the end-to-end learning allows the model to discover more suitable parameters for processing SAR images, thereby finding a feature extraction strategy better aligned with the characteristics of the current dataset.
Table 13.
Ablation Study Results of Learnable Parameters.
Finally, we present the variations in all learnable parameters in Table 14. We record the initial and post-training values of each learnable parameter and compute their relative shifts. For and , which are matrices, we report the average deviation across their nine elements. This analysis reveals the extent of parameter adjustments, indicating which features play more significant roles during training.
Table 14.
Comparison of initial and learned parameters in the preprocessing front-end.
5. Conclusions
This paper proposes a text-augmented multimodal fusion network with a learnable feature preprocessing front-end (LFPF-MFN) for ship classification in synthetic aperture radar (SAR) images. The method designs a learnable feature preprocessing front-end (LFPF) that integrates the extraction of scattering and textural features into end-to-end network learning. This approach overcomes the limitations of traditional handcrafted feature preprocessing, which exhibits limited generalization and fails to adapt to shifts in data distribution. Furthermore, the method refines textural feature extraction by modeling neighborhood relations using actual pixel differences, thereby enhancing the subtlety and discriminative power of the texture representation. Additionally, geometric information on ship length and width from the Automatic Identification System (AIS) is incorporated into the model in textual form. A bidirectional cross-attention mechanism facilitates deep fusion with visual features, effectively improving the complementary utilization of multimodal information.
Experimental results on the OpenSARShip 2.0 dataset demonstrate that the proposed method achieves superior classification performance compared to existing approaches in both three-class and six-class tasks, with accuracies of 89.03% and 71.43%, respectively. Ablation studies further validate the effectiveness of the learnable preprocessing front-end, the refined texture feature module, the AIS text information embedding, and the bidirectional cross-attention fusion mechanism, confirming the synergistic contribution of each component to enhancing the model’s discriminative capability.
Future work will extend the LFPF-MFN framework to dual-polarization complex-valued data and fully polarimetric SAR imagery, where richer phase and polarimetric signatures can be exploited, and will explore more fine-grained multimodal fusion mechanisms to enable more complete information exchange between visual and geometric modalities.
Author Contributions
Conceptualization, B.W. and Q.Z.; methodology, B.W.; software, B.W.; validation, B.W.; formal analysis, B.W.; investigation, B.W.; resources, B.W., L.L. and Q.Z.; data curation, B.W.; writing—original draft preparation, B.W.; writing—review and editing, L.L. and Q.Z.; visualization, B.W.; supervision, L.L. and Q.Z.; project administration, L.L. and Q.Z.; funding acquisition, L.L. and Q.Z. All authors have read and agreed to the published version of the manuscript.
Funding
This work is supported by the National Natural Science Foundation of China under Grant No. 62501626 and the Independent Research Project of the National Key Laboratory of Big Data and Decision under Grant No. DSJ-ZZKY-2025-28.
Data Availability Statement
The OpenSARShip 2.0 dataset is publicly accessible at https://opensar.sjtu.edu.cn/ (accessed on 20 March 2026). No new data were created in this study.
Acknowledgments
During the preparation of this manuscript, the authors used AI-assisted tools for language polishing and data processing. The authors have reviewed and edited the output and take full responsibility for the content of this publication.
Conflicts of Interest
The authors declare no conflicts of interest.
References
- Bovenga, F. Special Issue “Synthetic Aperture Radar (SAR) Techniques and Applications”. Sensors 2020, 20, 1851. [Google Scholar] [CrossRef] [Scilit]
- Wu, B.; Liu, C.; Chen, J. A review of spaceborne high-resolution spotlight/sliding spotlight mode SAR imaging. Remote Sens. 2024, 17, 38. [Google Scholar] [CrossRef] [Scilit]
- Yan, Z.; Song, X.; Yang, L.; Wang, Y. Ship Classification in Synthetic Aperture Radar Images Based on Multiple Classifiers Ensemble Learning and Automatic Identification System Data Transfer Learning. Remote Sens. 2022, 14, 5288. [Google Scholar] [CrossRef] [Scilit]
- Song, S.; Xu, B.; Yang, J. SAR Target Recognition via Supervised Discriminative Dictionary Learning and Sparse Representation of the SAR-HOG Feature. Remote Sens. 2016, 8, 683. [Google Scholar] [CrossRef] [Scilit]
- Ding, J.; Chen, B.; Liu, H.; Huang, M. Convolutional Neural Network With Data Augmentation for SAR Target Recognition. IEEE Geosci. Remote Sens. Lett. 2016, 13, 364–368. [Google Scholar] [CrossRef] [Scilit]
- Ai, J.; Mao, Y.; Luo, Q.; Jia, L.; Xing, M. SAR Target Classification Using the Multikernel-Size Feature Fusion-Based Convolutional Neural Network. IEEE Trans. Geosci. Remote Sens. 2022, 60, 5214313. [Google Scholar] [CrossRef] [Scilit]
- Shang, Y.; Pu, W.; Wu, C.; Liao, D.; Xu, X.; Wang, C.; Huang, Y.; Zhang, Y.; Wu, J.; Yang, J.; et al. HDSS-Net: A Novel Hierarchically Designed Network With Spherical Space Classifier for Ship Recognition in SAR Images. IEEE Trans. Geosci. Remote Sens. 2023, 61, 5222420. [Google Scholar] [CrossRef] [Scilit]
- Wang, X.; Yang, B.; Chen, S.; Liu, X. SEDRNet: Enhanced residual networks with SE and dilated convolutions for synthetic aperture radar ship recognition. J. Appl. Remote Sens. 2025, 19, 028501. [Google Scholar] [CrossRef] [Scilit]
- Sun, Z.; Leng, X.; Lei, Y.; Xiong, B.; Ji, K.; Kuang, G. BiFA-YOLO: A Novel YOLO-Based Method for Arbitrary-Oriented Ship Detection in High-Resolution SAR Images. Remote Sens. 2021, 13, 4209. [Google Scholar] [CrossRef] [Scilit]
- Sun, Z.; Leng, X.; Zhang, X.; Zhou, Z.; Xiong, B.; Ji, K.; Kuang, G. Arbitrary-Direction SAR Ship Detection Method for Multiscale Imbalance. IEEE Trans. Geosci. Remote Sens. 2025, 63, 5208921. [Google Scholar] [CrossRef] [Scilit]
- Zhang, C.; Zhang, X.; Gao, G.; Lang, H.; Liu, G.; Cao, C.; Song, Y.; Guan, Y.; Dai, Y. Development and Application of Ship Detection and Classification Datasets: A review. IEEE Geosci. Remote Sens. Mag. 2024, 12, 12–45. [Google Scholar] [CrossRef] [Scilit]
- Margarit, G.; Mallorqui, J. Operational approach for ship detection and classification. In 2009 IEEE International Geoscience and Remote Sensing Symposium; IEEE: New York, NY, USA, 2009; Volume 4, pp. IV-975–IV-978. [Google Scholar]
- Margarit, G.; Mallorqui, J.J.; Fortuny-Guasch, J.; Lopez-Martinez, C. Exploitation of Ship Scattering in Polarimetric SAR for an Improved Classification Under High Clutter Conditions. IEEE Trans. Geosci. Remote Sens. 2009, 47, 1224–1235. [Google Scholar] [CrossRef] [Scilit]
- Xing, X.; Ji, K.; Zou, H.; Chen, W.; Sun, J. Ship Classification in TerraSAR-X Images with Feature Space Based Sparse Representation. IEEE Geosci. Remote Sens. Lett. 2013, 10, 1562–1566. [Google Scholar] [CrossRef] [Scilit]
- Margarit, G.; Tabasco, A. Ship Classification in Single-Pol SAR Images Based on Fuzzy Logic. IEEE Trans. Geosci. Remote Sens. 2011, 49, 3129–3138. [Google Scholar] [CrossRef] [Scilit]
- Yang, S.; Zhang, X.; An, W.; Li, G.; Li, Z.; Zhang, S.; Wu, T.; Li, F.; Qi, W.; Yu, Q.; et al. MBLKNet: A large kernel convolution-driven network with multi-task self-supervised learning for SAR maritime target classification. Geo-Spat. Inf. Sci. 2025, 1–20. [Google Scholar] [CrossRef] [Scilit]
- He, J.; Sun, R.; Kong, Y.; Chang, W.; Sun, C.; Chen, G.; Li, Y.; Meng, Z.; Wang, F. CPINet: Towards a novel cross-polarimetric interaction network for dual-polarized SAR ship classification. Remote Sens. 2024, 16, 3479. [Google Scholar] [CrossRef] [Scilit]
- Sun, Y.; Wang, Z.; Sun, X.; Fu, K. SPAN: Strong Scattering Point Aware Network for Ship Detection and Classification in Large-Scale SAR Imagery. IEEE J. Sel. Top. Appl. Earth Obs. Remote Sens. 2022, 15, 1188–1204. [Google Scholar] [CrossRef] [Scilit]
- Pan, D.; Gao, X.; Dai, W.; Fu, J.; Wang, Z.; Sun, X.; Wu, Y. SRT-Net: Scattering Region Topology Network for Oriented Ship Detection in Large-Scale SAR Images. IEEE Trans. Geosci. Remote Sens. 2024, 62, 5202318. [Google Scholar] [CrossRef] [Scilit]
- Jiang, X.; Xie, H.; Lu, Z.; Hu, J. Energy-efficient and high-performance ship classification strategy based on Siamese spiking neural network in dual-polarized SAR images. Remote Sens. 2023, 15, 4966. [Google Scholar] [CrossRef] [Scilit]
- Xie, N.; Zhang, T.; Guo, W.; Zhang, Z.; Yu, W. Dual Branch Deep Network for Ship Classification of Dual-Polarized SAR Images. IEEE Trans. Geosci. Remote Sens. 2024, 62, 5207415. [Google Scholar] [CrossRef] [Scilit]
- Chen, J.; Wu, Y.; Dai, W.; Diao, W.; Li, Y.; Gao, X.; Sun, X. Text-Enhanced Multimodal Method for SAR Ship Classification with Geometry and Polarization Information. IEEE J. Sel. Top. Appl. Earth Obs. Remote Sens. 2025, 18, 8659–8671. [Google Scholar] [CrossRef] [Scilit]
- Guo, M.H.; Xu, T.X.; Liu, J.J.; Liu, Z.N.; Jiang, P.T.; Mu, T.J.; Zhang, S.H.; Martin, R.R.; Cheng, M.M.; Hu, S.M. Attention mechanisms in computer vision: A survey. Comput. Vis. Media 2022, 8, 331–368. [Google Scholar] [CrossRef] [Scilit]
- Golubović, D.; Marjanović, D. Ship Detection Software Based on High-Resolution Algorithms for Primary Signal Processing: From Idea to Implementation in HFSWRs. In 2025 24th International Symposium INFOTEH-JAHORINA (INFOTEH); IEEE: New York, NY, USA, 2025; pp. 1–6. [Google Scholar] [CrossRef] [Scilit]
- Golubović, D.; Erić, M.; Vukmirović, N.; Vukmirović, N. Improved Detection of Targets on the High-Resolution Range-Doppler Map in HFSWRs. In 2024 23rd International Symposium INFOTEH-JAHORINA (INFOTEH); IEEE: New York, NY, USA, 2024; pp. 1–6. [Google Scholar] [CrossRef] [Scilit]
- Sun, Z.; Zhang, X.; Leng, X.; Wu, X.; Xiong, B.; Ji, K.; Kuang, G. KFIA-Net: A knowledge fusion and imbalance-aware network for multi-category SAR ship detection. Int. J. Appl. Earth Obs. Geoinf. 2026, 146, 105127. [Google Scholar] [CrossRef] [Scilit]
- Zhang, T.; Zhang, X. Injection of traditional hand-crafted features into modern CNN-based models for SAR ship classification: What, why, where, and how. Remote Sens. 2021, 13, 2091. [Google Scholar] [CrossRef] [Scilit]
- Harati-Mokhtari, A.; Wall, A.; Brooks, P.; Wang, J. Automatic Identification System (AIS): Data Reliability and Human Error Implications. J. Navig. 2007, 60, 373–389. [Google Scholar] [CrossRef] [Scilit]
- Lang, H.; Yang, G.; Li, C.; Xu, J. Multisource Heterogeneous Transfer Learning via Feature Augmentation for Ship Classification in SAR Imagery. IEEE Trans. Geosci. Remote Sens. 2022, 60, 5228814. [Google Scholar] [CrossRef] [Scilit]
- Li, B.; Liu, B.; Huang, L.; Guo, W.; Zhang, Z.; Yu, W. OpenSARShip 2.0: A large-volume dataset for deeper interpretation of ship targets in Sentinel-1 imagery. In 2017 SAR in Big Data Era: Models, Methods and Applications (BIGSARDATA); IEEE: New York, NY, USA, 2017; pp. 1–5. [Google Scholar] [CrossRef] [Scilit]
- Ojala, T.; Pietikäinen, M.; Harwood, D. A comparative study of texture measures with classification based on featured distributions. Pattern Recognit. 1996, 29, 51–59. [Google Scholar] [CrossRef] [Scilit]
- Liu, Y.; Li, T.; Yuan, K.; Li, S. Classifying Ships in SAR Images by Using Contour Bias Features and Transfer Learning. IEEE Access 2022, 10, 129949–129957. [Google Scholar] [CrossRef] [Scilit]
- Ai, J.; Tian, R.; Luo, Q.; Jin, J.; Tang, B. Multi-Scale Rotation-Invariant Haar-Like Feature Integrated CNN-Based Ship Detection Algorithm of Multiple-Target Environment in SAR Imagery. IEEE Trans. Geosci. Remote Sens. 2019, 57, 10070–10087. [Google Scholar] [CrossRef] [Scilit]
- Ojala, T.; Pietikainen, M.; Maenpaa, T. Multiresolution gray-scale and rotation invariant texture classification with local binary patterns. IEEE Trans. Pattern Anal. Mach. Intell. 2002, 24, 971–987. [Google Scholar] [CrossRef] [Scilit]
- Zhu, C.; Wang, R. Local multiple patterns based multiresolution gray-scale and rotation invariant texture classification. Inf. Sci. 2012, 187, 93–108. [Google Scholar] [CrossRef] [Scilit]
- Zhang, Q.; He, C.; He, B.; Tong, M. Learning Scattering Similarity and Texture-Based Attention with Convolutional Neural Networks for PolSAR Image Classification. IEEE Trans. Geosci. Remote Sens. 2023, 61, 5207419. [Google Scholar] [CrossRef] [Scilit]
- Wang, D.; Song, Y.; Huang, J.; An, D.; Chen, L. SAR Target Classification Based on Multiscale Attention Super-Class Network. IEEE J. Sel. Top. Appl. Earth Obs. Remote Sens. 2022, 15, 9004–9019. [Google Scholar] [CrossRef] [Scilit]
- Liu, Z.; Lin, Y.; Cao, Y.; Hu, H.; Wei, Y.; Zhang, Z.; Lin, S.; Guo, B. Swin Transformer: Hierarchical Vision Transformer using Shifted Windows. In 2021 IEEE/CVF International Conference on Computer Vision (ICCV); IEEE: New York, NY, USA, 2021; pp. 9992–10002. [Google Scholar] [CrossRef] [Scilit]
- Vaswani, A.; Shazeer, N.; Parmar, N.; Uszkoreit, J.; Jones, L.; Gomez, A.N.; Kaiser, Ł.; Polosukhin, I. Attention is all you need. Adv. Neural Inf. Process. Syst. 2017, 30, 6000–6010. [Google Scholar]
- Huang, Z.; Wang, X.; Wei, Y.; Huang, L.; Shi, H.; Liu, W.; Huang, T.S. CCNet: Criss-Cross Attention for Semantic Segmentation. IEEE Trans. Pattern Anal. Mach. Intell. 2023, 45, 6896–6908. [Google Scholar] [CrossRef] [Scilit]
- Zhu, H.; Ke, W.; Li, D.; Liu, J.; Tian, L.; Shan, Y. Dual Cross-Attention Learning for Fine-Grained Visual Categorization and Object Re-Identification. In 2022 IEEE/CVF Conference on Computer Vision and Pattern Recognition (CVPR); IEEE: New York, NY, USA, 2022; pp. 4682–4692. [Google Scholar] [CrossRef] [Scilit]
- Wang, C.; Pei, J.; Luo, S.; Huo, W.; Huang, Y.; Zhang, Y.; Yang, J. SAR Ship Target Recognition via Multiscale Feature Attention and Adaptive-Weighed Classifier. IEEE Geosci. Remote Sens. Lett. 2023, 20, 4003905. [Google Scholar] [CrossRef] [Scilit]
- Shao, Z.; Zhang, T.; Ke, X. A Dual-Polarization Information-Guided Network for SAR Ship Classification. Remote Sens. 2023, 15, 2138. [Google Scholar] [CrossRef] [Scilit]
- Simonyan, K.; Zisserman, A. Very deep convolutional networks for large-scale image recognition. arXiv 2014, arXiv:1409.1556. [Google Scholar]
- He, K.; Zhang, X.; Ren, S.; Sun, J. Deep residual learning for image recognition. In IEEE Conference on Computer Vision and Pattern Recognition; IEEE: New York, NY, USA, 2016; pp. 770–778. [Google Scholar]
- Liu, Z.; Hu, H.; Lin, Y.; Yao, Z.; Xie, Z.; Wei, Y.; Ning, J.; Cao, Y.; Zhang, Z.; Dong, L.; et al. Swin transformer v2: Scaling up capacity and resolution. In IEEE/CVF Conference on Computer Vision and Pattern Recognition; IEEE: New York, NY, USA, 2022; pp. 12009–12019. [Google Scholar]
- Huang, Z.; Datcu, M.; Pan, Z.; Lei, B. Deep SAR-Net: Learning objects from signals. ISPRS J. Photogramm. Remote Sens. 2020, 161, 179–193. [Google Scholar] [CrossRef] [Scilit]
- Zhang, T.; Zhang, X.; Ke, X.; Liu, C.; Xu, X.; Zhan, X.; Wang, C.; Ahmad, I.; Zhou, Y.; Pan, D.; et al. HOG-ShipCLSNet: A Novel Deep Learning Network with HOG Feature Fusion for SAR Ship Classification. IEEE Trans. Geosci. Remote Sens. 2022, 60, 5210322. [Google Scholar] [CrossRef] [Scilit]
- Zhang, T.; Zhang, X. Squeeze-and-Excitation Laplacian Pyramid Network with Dual-Polarization Feature Fusion for Ship Classification in SAR Images. IEEE Geosci. Remote Sens. Lett. 2022, 19, 4019905. [Google Scholar] [CrossRef] [Scilit]

Disclaimer/Publisher’s Note: The statements, opinions and data contained in all publications are solely those of the individual author(s) and contributor(s) and not of MDPI and/or the editor(s). MDPI and/or the editor(s) disclaim responsibility for any injury to people or property resulting from any ideas, methods, instructions or products referred to in the content. |
© 2026 by the authors. Licensee MDPI, Basel, Switzerland. This article is an open access article distributed under the terms and conditions of the Creative Commons Attribution (CC BY) license.