1. Introduction
Mount Etna (Italy) is the tallest and most active basaltic volcano in Europe, characterized by near-constant summit activity and frequent paroxysmal episodes. Due to its complex eruptive behavior and its proximity to densely populated areas, the volcano is monitored by extensive multi-parametric networks, including seismic, geodetic, infrasonic, and optical sensors. However, a significant challenge remains: providing reliable, real-time detection of eruptive activity when visibility is obscured by clouds, thick ash plumes, or during nighttime hours without relying solely on infrared (IR) sensors, which are often blinded by heavy rainfall or dense volcanic clouds.
Thermal monitoring of volcanic activity is a fundamental component of modern volcanology, providing critical insights into magma dynamics, eruption precursors, and the evolution of lava flows. The accurate measurement of surface thermal emissivity allows for the quantification of radiant heat flux, which is directly correlated to the effusion rate and the morphological development of volcanic phenomena. Traditionally, the proximal and distal monitoring of volcanic thermal anomalies relies heavily on Thermal Infrared (TIR) sensors and thermography using uncooled thermal cameras. While ground-based and satellite-borne TIR systems offer excellent spatial resolution and are considered the standard for mapping active lava bodies, their effectiveness is intrinsically limited by atmospheric conditions. TIR wavelengths are severely attenuated by meteorological clouds, dense volcanic plumes, and degassing, which frequently obscure the volcanic edifice and prevent continuous observation during eruptive crises.
To overcome the optical limitations of TIR imaging, passive microwave radiometry has emerged as a complementary remote sensing tool, building on decades of success in ground-based atmospheric profiling, trace gas measurement, and weather forecasting [
1]. Operating at longer wavelengths (ranging from millimeters to centimeters), microwave radiation can penetrate thick meteorological cloud cover, dense volcanic ash, and gas plumes with minimal attenuation. While ground-based microwave radiometers have been utilized alongside radar systems to observe the microphysical properties and atmospheric dispersion of volcanic ash clouds [
2], their use for the direct, proximal thermal mapping of volcanic surfaces is pioneering. In the satellite domain, passive microwave sensors have successfully demonstrated the ability to detect deep volcanic thermal anomalies [
3] and have recently been applied to characterize explosive volcanic eruptions by isolating the ash plume signal from background meteorological processes [
4]. Satellite-borne passive microwave sensors, such as those aboard the SMAP (Soil Moisture Active Passive) mission, have successfully demonstrated the ability to detect deep volcanic thermal anomalies and characterize surface emissivity from space, providing an all-weather monitoring capability [
3]. However, despite these advantages in satellite remote sensing and atmospheric ash characterization, the deployment of ground-based passive microwave sensors for the continuous, fixed-point thermal surveillance of active craters remains largely unexplored. Actually, severe weather such as heavy precipitation, wind, and hail can cause substantial absorption, creating additional noise that can sharply increase the observed brightness temperature; we also analyze the effects of one case of extreme weather conditions to better characterize the signal. The discrimination of weather conditions is made using INGV visible and thermal cameras, the visible camera and weather station at the observation point, a weather station in the line of view and satellite images.
However, despite the advantages of microwave radiometry in satellite remote sensing, the deployment of ground-based passive microwave sensors for a more proximal thermal mapping of volcanic surfaces remains unexplored. This limitation is fundamentally dictated by the physical constraints of angular resolution, defined by the Rayleigh criterion:
where θ represents the angular resolution, λ is the operating wavelength, and D is the diameter of the antenna [
5,
6]. Due to the macroscopic wavelengths of microwave radiation, achieving a spatial resolution comparable to TIR systems—which is necessary to map highly heterogeneous targets like lava flows from a terrestrial vantage point—would require an antenna of impractically large dimensions. Consequently, while ground-based passive microwave radiometers are widely utilized in radio astronomy and atmospheric profiling [
7,
8,
9,
10,
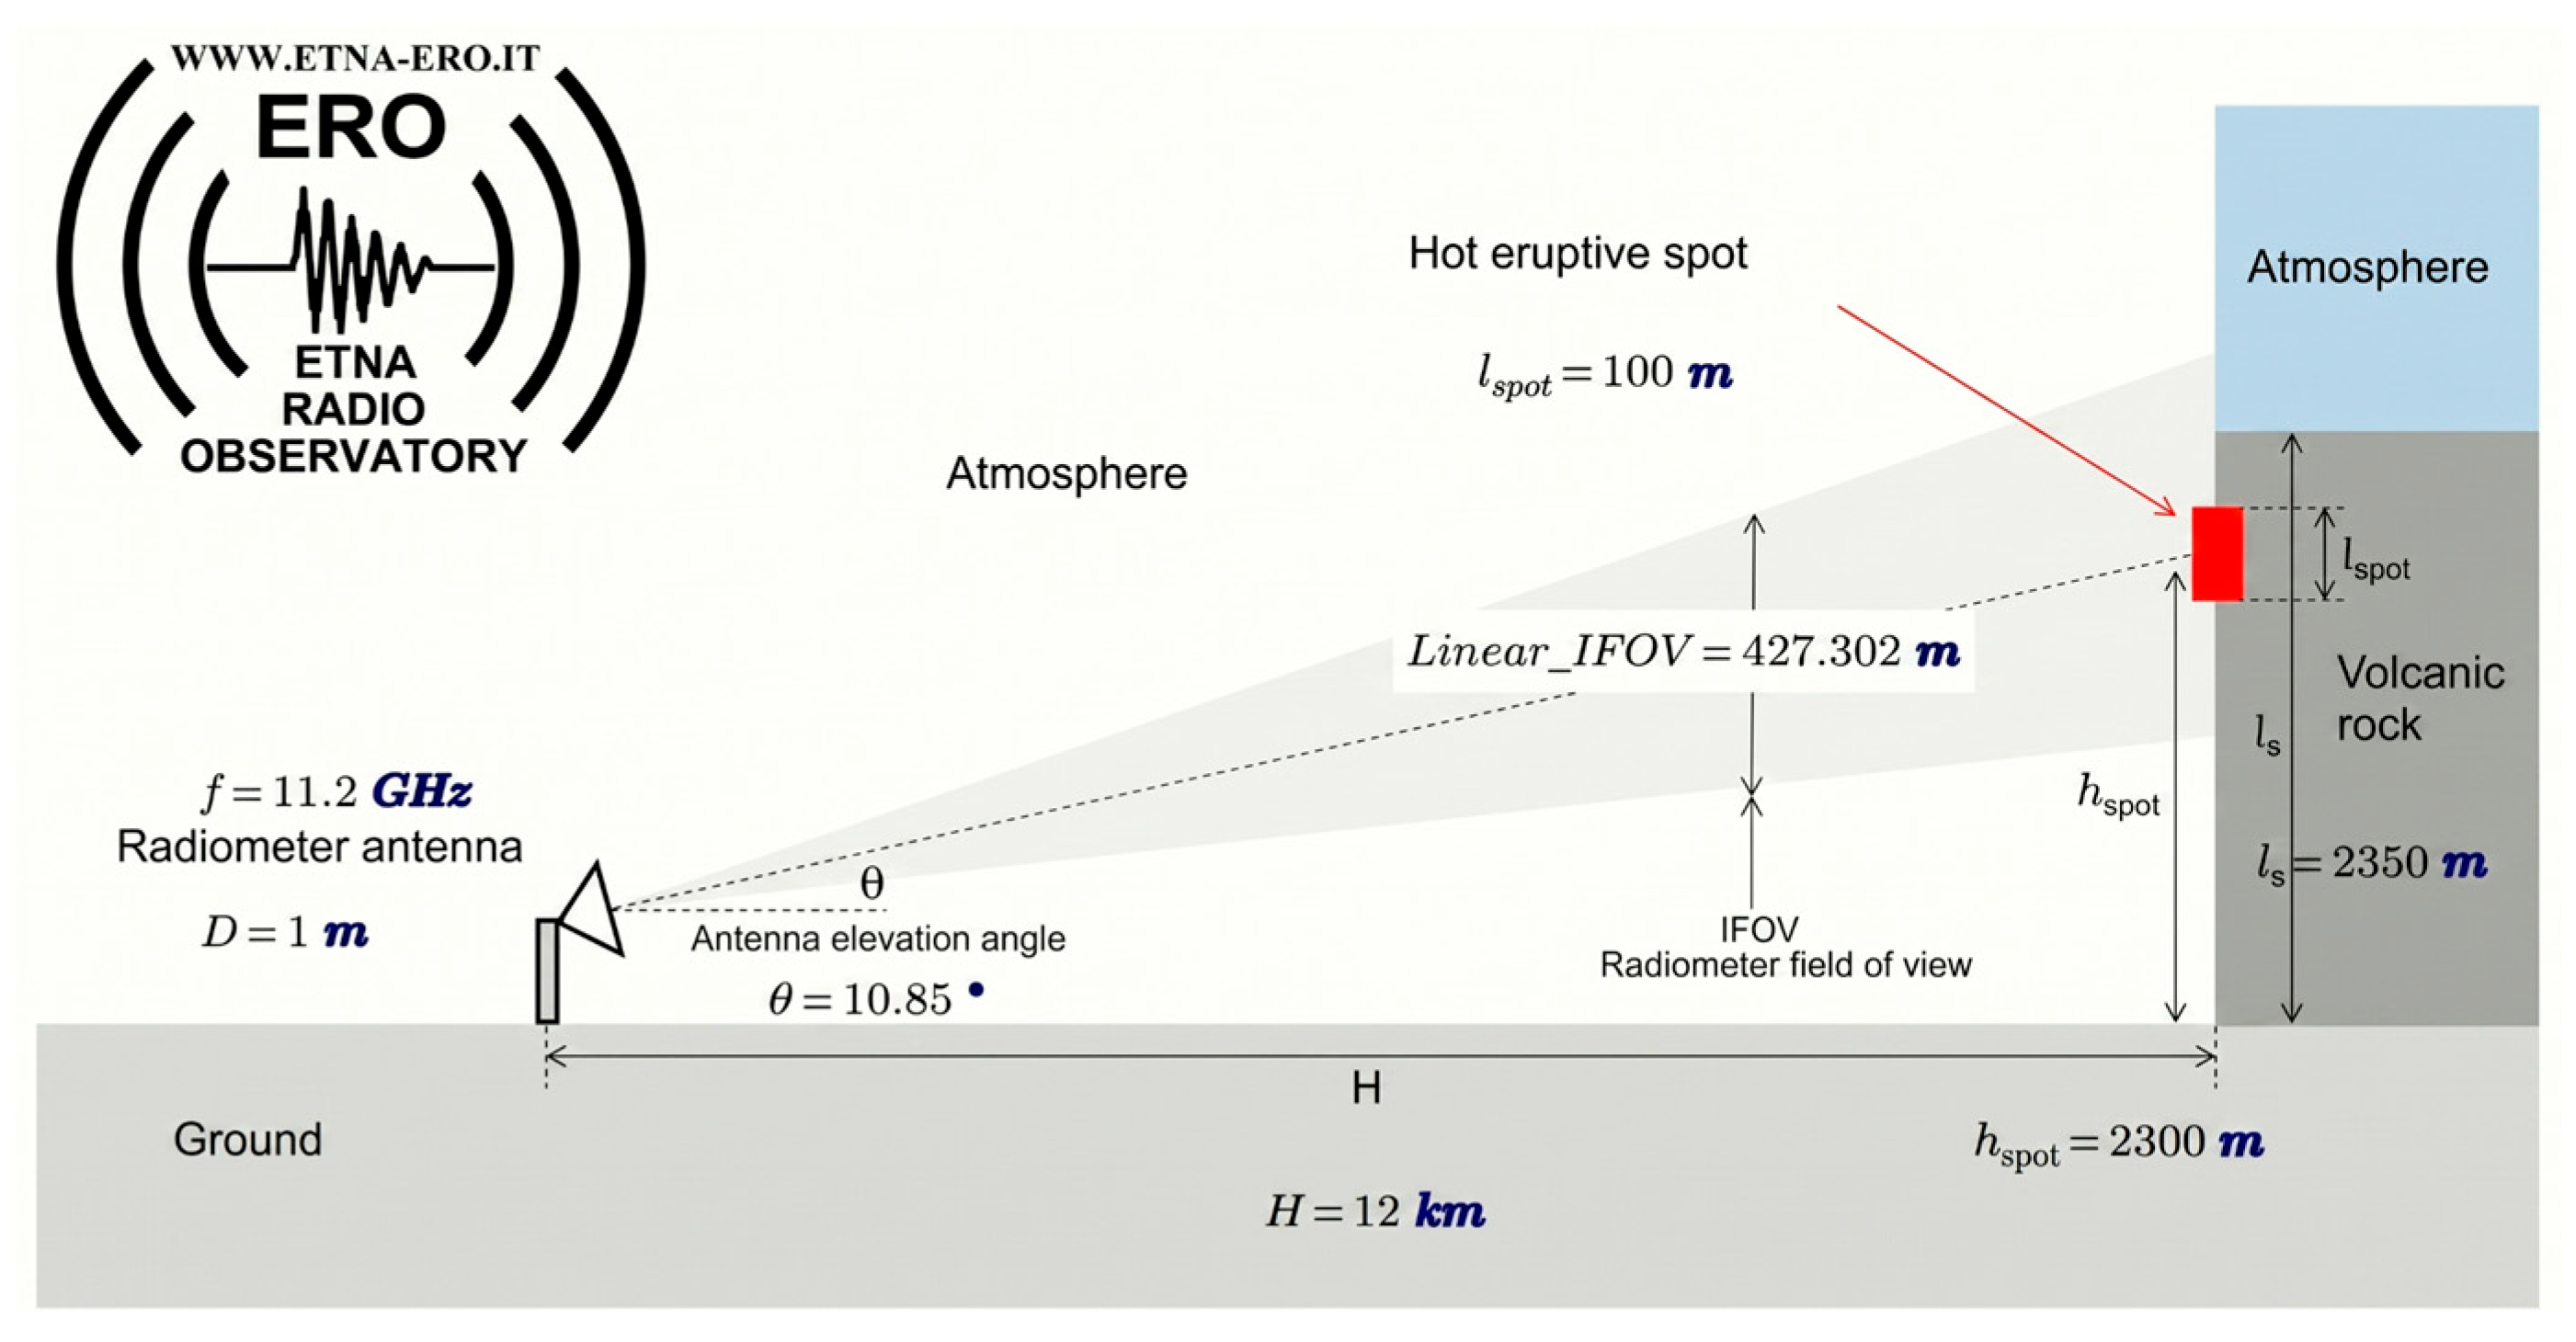
11], their application in volcanology is pioneering and, until now, employed in volcanic settings only for atmospheric profiling and ash plume characterization by looking upward. To overcome this inherent limitation in spatial resolution, our approach fundamentally shifts from spatial mapping to targeted, fixed-point observation. By leveraging prior knowledge of the volcano’s most active sector, we continuously point the radiometer’s antenna toward a specific, pre-determined area (
Figure 1). This strategy bypasses the need for high-resolution imaging, focusing instead on detecting temporal variations in the integrated thermal emission of a fixed volume relative to a “rest” background scenario. In this paper, we describe the implementation and results of an MW monitoring system located at the “Paolo Lanza” station (about 1000 m a.s.l.), situated on the southern slope of Mt. Etna.
The Mt. Etna volcano hosts four active craters on its summit. Around the central crater, called “Voragine”, there are three other sub-terminal craters: the North-East Crater (NEC), formed in 1911 on the northeastern slope of the summit cone; the “Bocca Nuova” (BN) crater, formed in 1968 on the western slope of the summit cone and currently the widest crater; and the South-East Crater (SEC), which is the primary target of our observations. Since its formation in 1971 on the southeastern slope of the summit cone, and particularly after 2011, this area has become the most active sector of the volcano. The very lively activity of this crater caused an extremely rapid growth of the cone, with a quick accumulation of partially molten scorias during the paroxysms, sometimes triggering pyroclastic currents generated by collapses along the steep flanks of the cone. The SEC’s prominent activity is intrinsically linked to the volcano’s structural dynamics; its position at the intersection of major structural discontinuities facilitates the rapid ascent of magma as well as lateral intrusions along the southeastern and eastern flanks of the volcano [
12]. Recent studies have highlighted how the SEC’s eruptive cycles are often preceded by changes in volcanic tremor and flank deformation, suggesting a deep-seated interaction between magmatic pressure and the unstable eastern flank observed in recent decades [
13,
14,
15].
During the investigation period (2023–2025), Mt. Etna exhibited significant variability, ranging from Strombolian activity to intense paroxysms characterized by high lava fountains and the formation of eruptive columns several kilometers high. In particular, the activity of July 2024 was selected because it provided a perfect example of impulsive, Strombolian volcanic activity under clear skies and the activity of June 2025 was chosen because it offered an unobstructed, perfect transit of a high-temperature volcanic cloud.
The monitoring system employs a Total Power Microwave Receiver (10–12 GHz) with a 1 m parabolic antenna. Positioned 12 km from the summit, the instrument’s Field of View (FOV) covers approximately 427 m of the volcanic slope near the SEC. This geometry allows for the detection of “hot spots”—regions where the thermal emission significantly exceeds the background “rest” scenario of the volcano. By “listening” to the natural electromagnetic radiation emitted by the soil and the atmosphere, the system provides a continuous, passive stream of data, offering a unique perspective on the volcano’s energetic state.
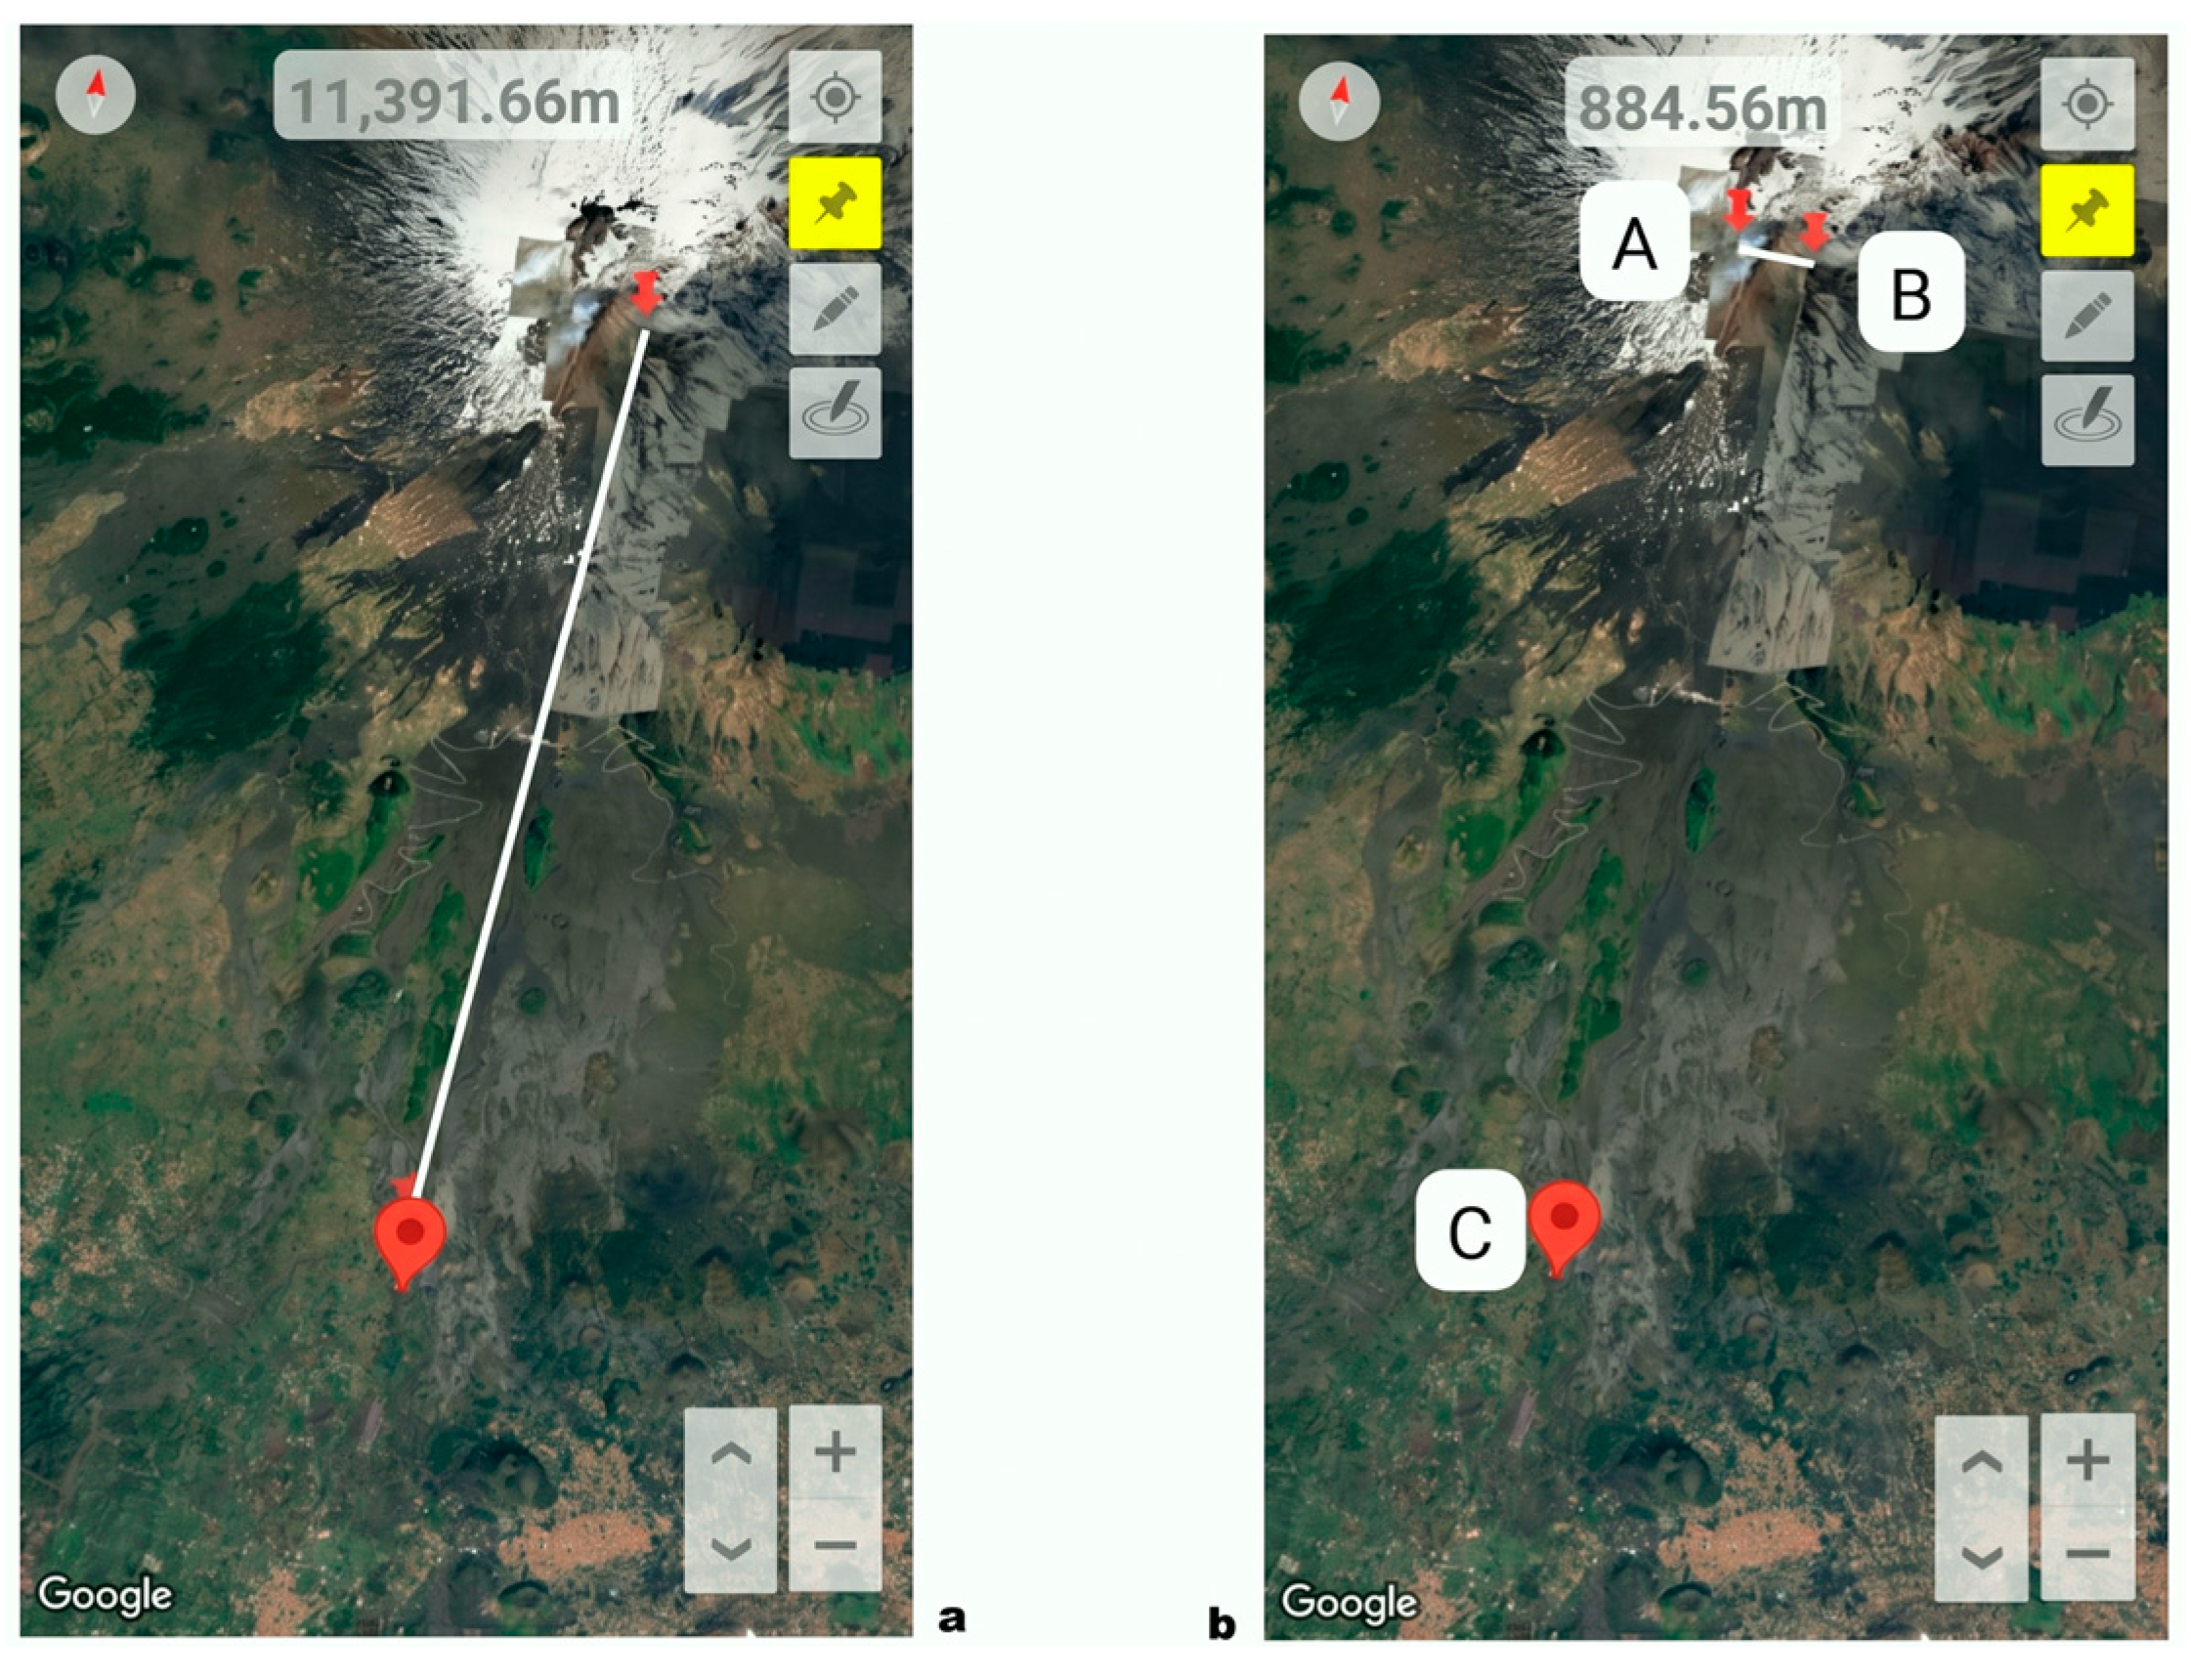
The monitoring station is located at point C on the map (
Figure 2), while the scene observed by the microwave radiometer (volcanic slope) is point A. Point B indicates the side of the SEC cone where a collapse occurred on 2 June 2025, which is not visible by the instrument. The hot cloud rose into the sky and, for at least 3–5 min, affected scene A. Distance AC measures approximately 11 km (
Figure 2a), while section AB is approximately 900 m (
Figure 2b).
2. Materials and Methods
2.1. Sensors
The system consists of a RAL10TS total-power receiver manufactured by RadioAstroLab (RAL10TS, RadioAstroLab & FASAR Elettronica, Senigallia, Italy) and a RAL10_LNB (Low Noise Block) illuminator (RadioAstroLab & FASAR Elettronica, Senigallia, Italy).
The RAL10_LNB, the external unit positioned at the antenna’s focal point, is made of insulated aluminum, thermally stabilized by an internal 12-volt regulator that can be controlled by the user. The user can choose whether to use it, achieving high stability at the cost of increased power consumption.
The technical specifications of the RAL10TS radiometer are as follows:
Offset parabolic antenna diameter: 1 m;
Central reception frequency: 11.2 GHz;
Receiver bandwidth: 250 MHz;
System noise: approximately 0.5 dB;
Post-detection analog-to-digital converter resolution: 14 bit;
Post-detection integrator time constant: approximately 1 s;
Measurement sampling period: approximately 10 s.
The RAL10TS is a microwave radiometer characterized by high sensitivity and measurement stability, designed for radio astronomy observations. Operating as a Total-Power receiver, it allows for the configuration and monitoring of multiple operating parameters. The instrument’s electronics are enclosed in a metal housing and are remotely operated via a USB interface connected to a workstation running the ARIES (V. 3.0) control software. Receiver sensitivity is achieved through a wide bandwidth (250 MHz) and high gain in the pre-detection section. Furthermore, measurement stability and repeatability are maintained by an active internal temperature control system. This mechanism mitigates variations in the amplification factor and other operating parameters caused by external thermal fluctuations (
Figure S1 in Supplementary Materials).
The sensitivity ΔT of the radiometer (minimum measurable change in brightness temperature) can be estimated using the well-known equation [
7,
8]:
where
is the receiving system noise temperature, B = 250 MHz is the bandwidth, τ = 1 s is the post-detection integration constant, and N = 10 is the number of statistically independent samples averaged at each sampling period. Given the receiver noise figure, the corresponding noise temperature
is calculated; hence,
, assuming an antenna noise temperature
when the radiometer observes the reference scenario. The calculations indicate a theoretical sensitivity of the order of
. Taking into account instrumental instabilities, the
noise contribution of the post-detection stages and possible thermal drifts, we can reasonably estimate an effective sensitivity equal to
.
In the context of the RAL10TS microwave radiometer used for volcanic monitoring, the parameter τ (tau) represents the post-detection integrator time constant. Expressed in seconds, it is a crucial variable used to calculate the radiometer’s sensitivity (ΔT), which defines the minimum measurable change in brightness temperature.
The specific value of τ can be estimated using the following formula:
In this equation, Tcost is the primary integration constant, INT is the secondary integration constant, and 0.104 (in seconds) represents the radio signal acquisition period.
Depending on the chosen parameters, the resulting time constant τ can vary significantly, ranging from approximately 0.1 s to about 113 min. However, for standard theoretical calculations of the instrument’s system noise and sensitivity, a baseline value of τ = 1 s is typically assumed.
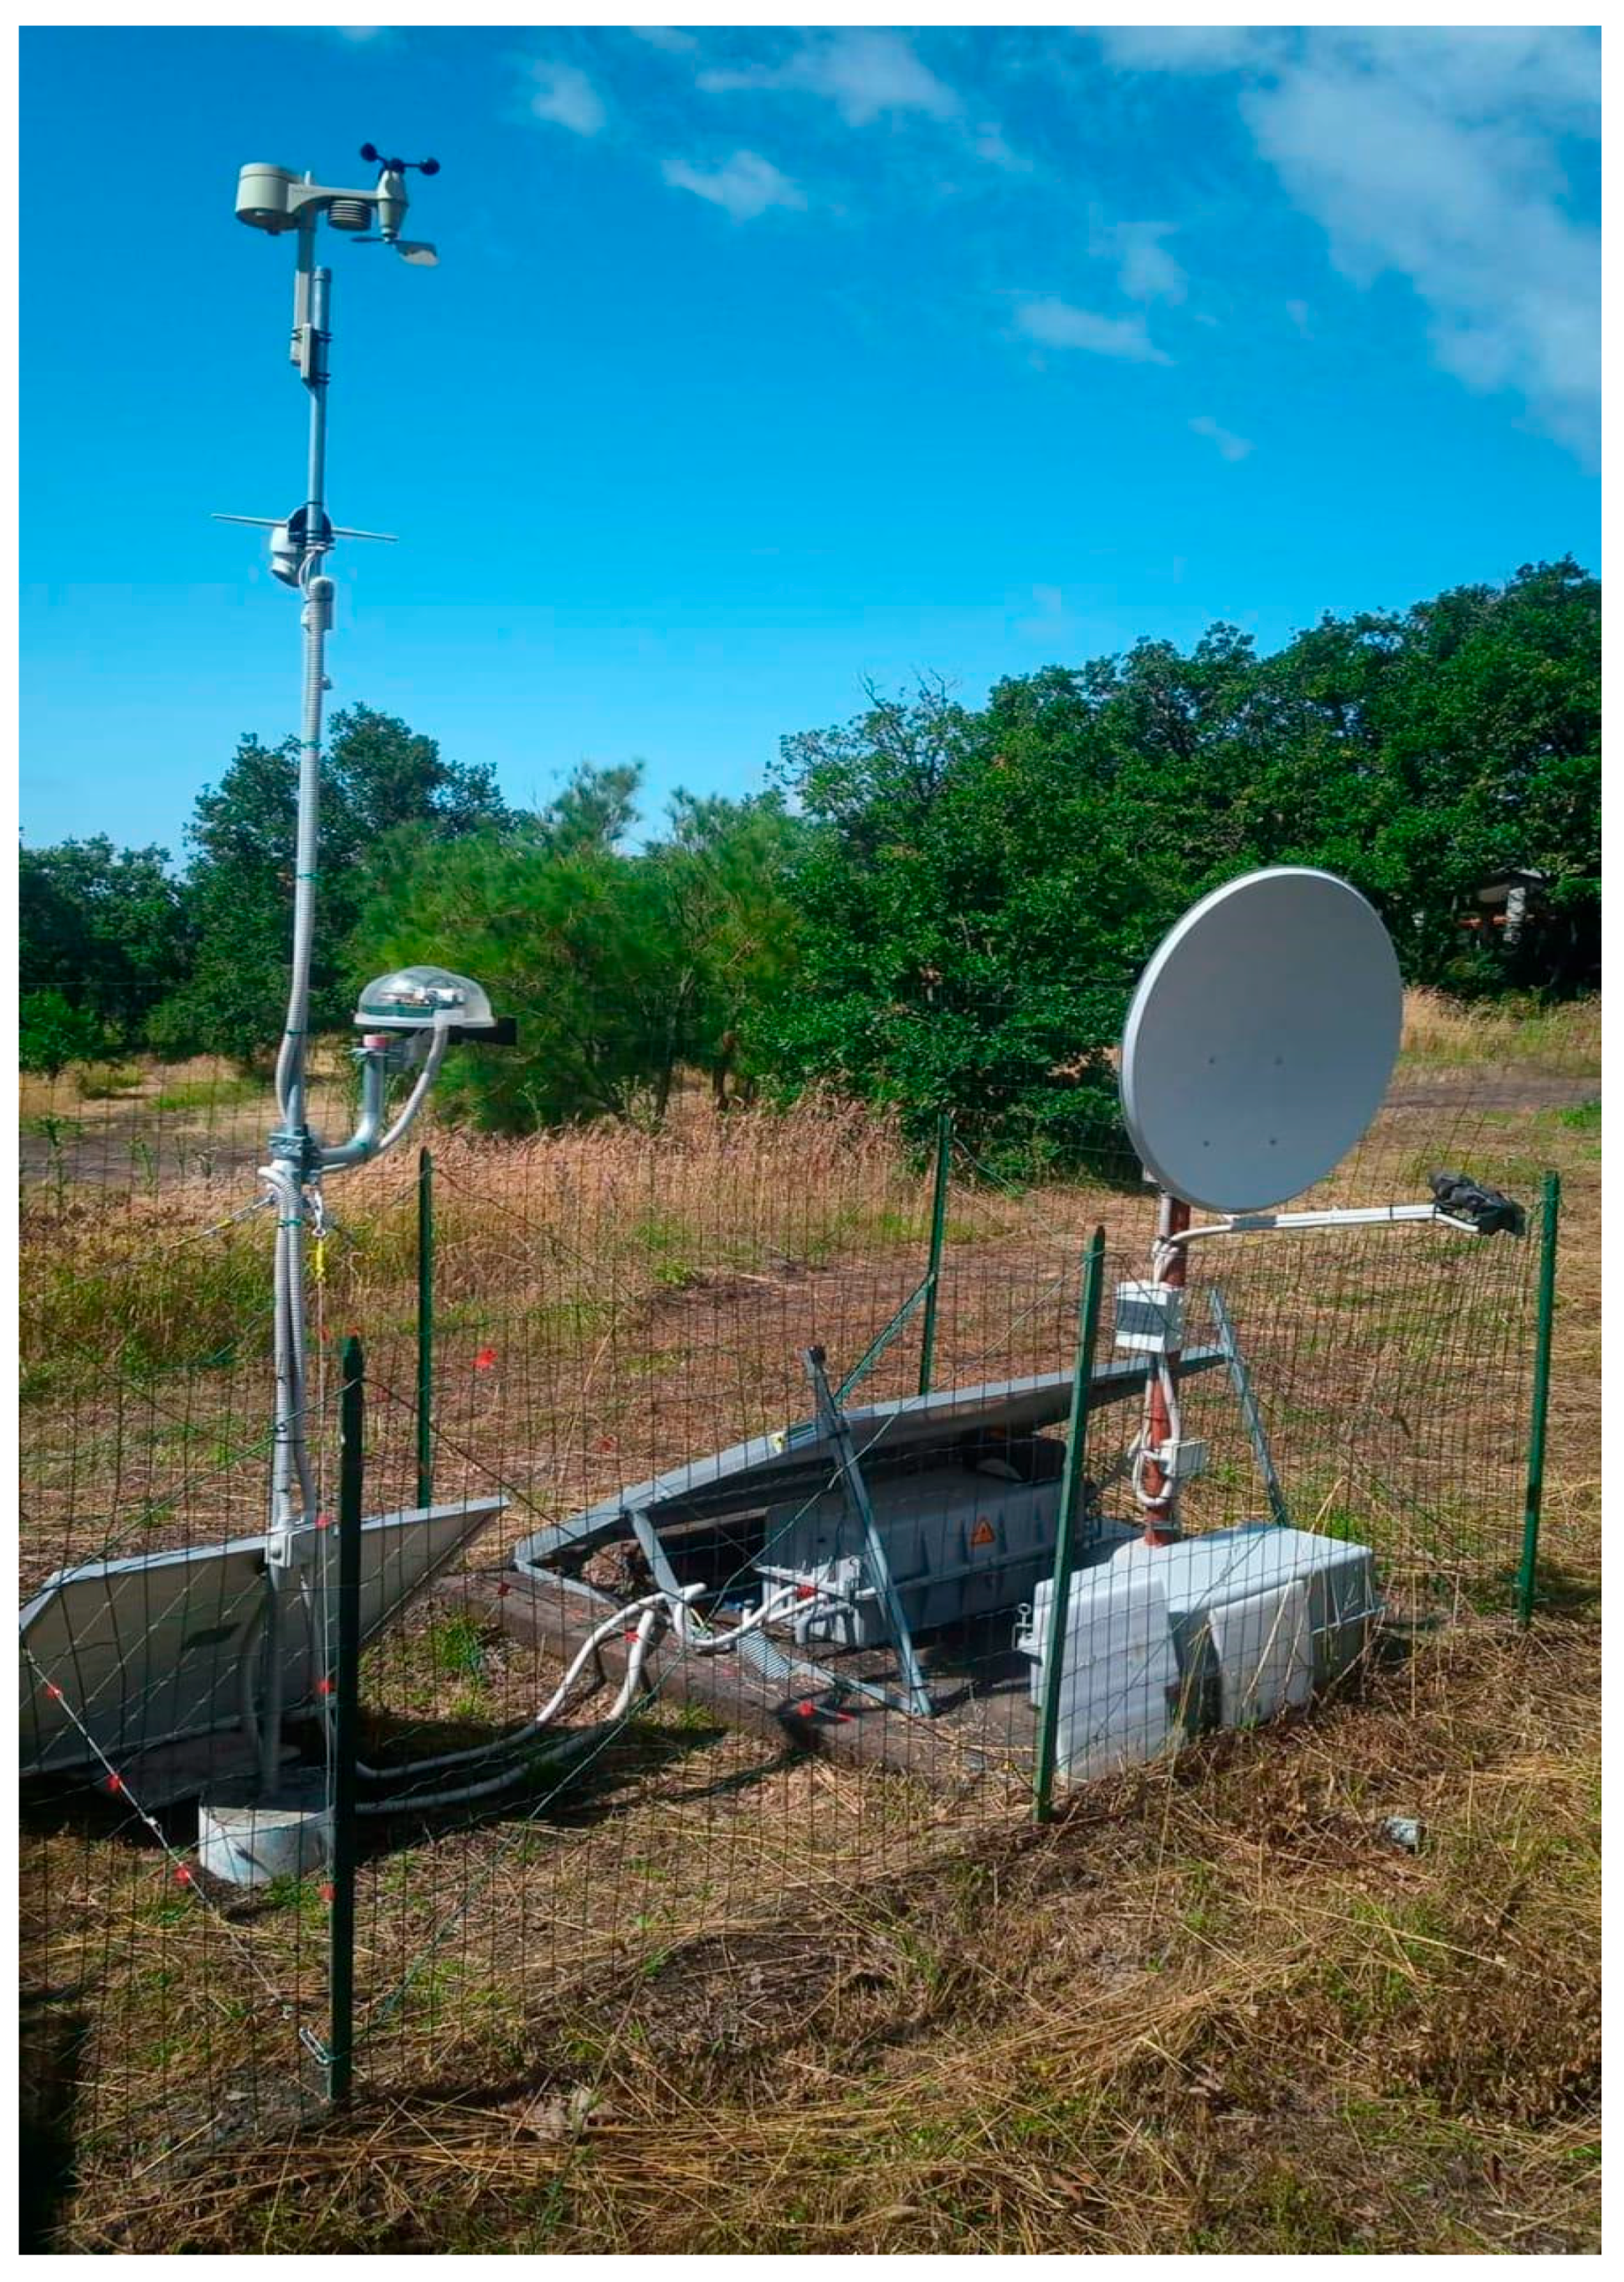
The station is continuously recording, fully automated, and powered by a solar energy storage system consisting of four 150 W polycrystalline silicon solar panels, 12 V and connected in parallel, with two 100 Ah/12 V deep cycle batteries and one 45 Ah/12 V deep cycle battery, also connected in parallel. The total power is then 600 W/12 V with a total energy storage of 245 Ah/12 V. The solar controller is of the MPPT (Maximum Power Point Tracking) type. The power supply downstream of the solar panels is sectioned by a 60 A DC bipolar magnetothermal switch, and on the load with 6 A fuses (car type) on each +12 V line; the connection cables are 6 mm
2 for the panels, 2.5 mm
2 for each load section. All exposed metal parts are connected to an earth leakage rod, in a special well, with a 16 mm
2 yellow-green cable (
Figure 3).
2.2. Software
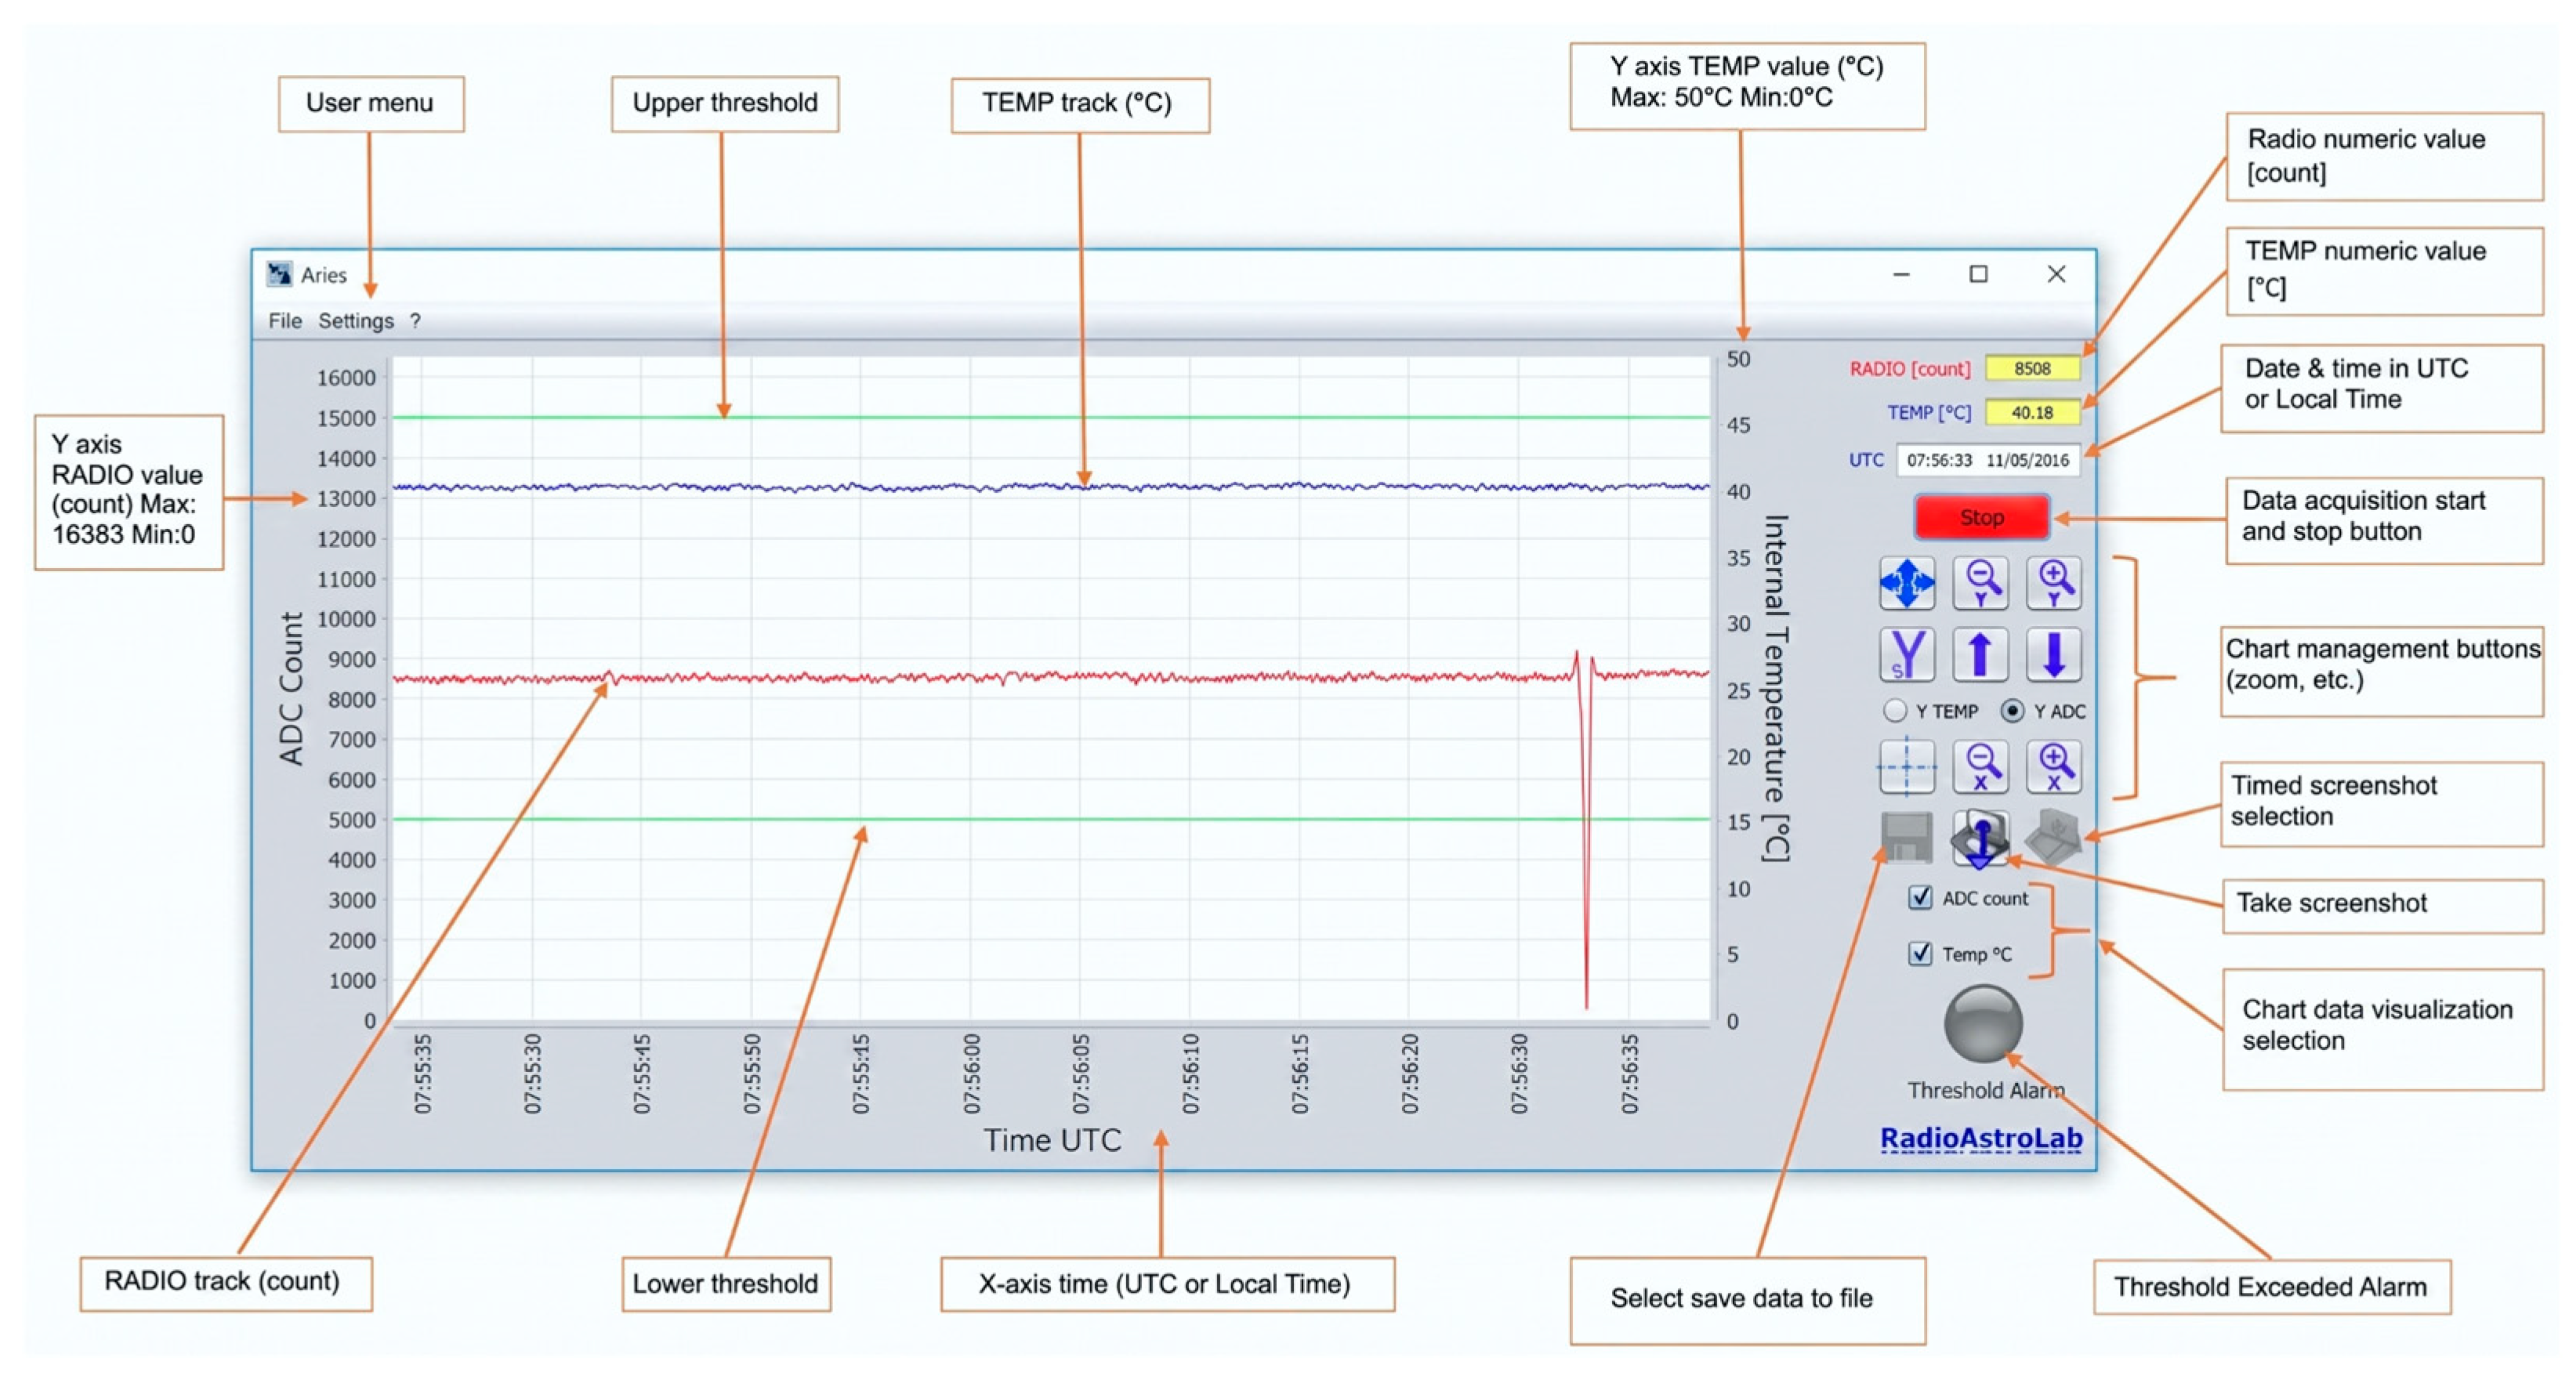
Designed to take full advantage of the reliability and flexibility of serial communication of the RAL instruments, the advanced and easy-to-use ARIES software controls all operating parameters for the specific model used. Like a graphical recorder (
Figure 4), the software interface displays measurement trends over time and archives the acquired information in various modes and formats. It is possible to easily set the parameters of a single receiver or manage different and simultaneous measurement sessions with multiple devices (even of the same type) connected to a single PC: the communication protocol implemented in the instruments, combined with the software interface, allows for highly reliable communication management, perfect even for applications requiring continuous measurements over long periods of time and in remote, unattended locations. It is possible to manage and display measurement sessions, with extensive options for setting graphic scales and programming operating parameters. The data recording is automatic, and it is possible to set appropriate alarm thresholds when events occur in the measured signal.
2.3. How It Works
Theory explains that any body with a temperature above absolute zero emits electromagnetic energy (Planck’s Law of Radiation) across the entire spectrum, peaking at a frequency that is directly proportional to its temperature. For most natural bodies, the peak emission occurs in the infrared region. A black body represents the ideal condition for the transformation of all thermal energy into electromagnetic radiation, but this condition is rarely achieved in natural environments (except for the stationary Sun and the Moon). For microwaves, Planck’s Law simplifies the correspondence between the emission energy of a body reaching the antenna (radiometer) and the measured antenna temperature. If we point our antenna toward the volcano and if there is a radio source there, it will stand out from the background, allowing us to measure an increase in the received signal proportional to the temperature increase in that source. This measurement capability can provide an estimate of the physical temperature of the body we are measuring, with the brightness temperature being lower than the environmental temperature, as seen by the antenna with a coefficient called emissivity. An (ideal) black body has an emissivity of 1 (the brightness temperature and physical temperature coincide), while a (real) gray body has an emissivity between 0 and 1, with the brightness temperature lower than the physical temperature. The ground brightness temperature, for example, is quite high, around 240–300 K, while a clear, dry sky is cold, with a brightness temperature of a few Kelvins if the antenna is oriented toward the zenith. A radiometer measures the antenna’s noise temperature, a convolution between the function describing its reception pattern and the brightness distribution of the observed scene. When the instrument observes the environment at low elevation angles, the measurement is strongly influenced by rain and the presence of compact, low-level cloud formations entering the field of view: increases and fluctuations in the brightness temperature are recorded that can vary from a few Kelvins to hundreds of Kelvins, depending on the intensity of the precipitation. These disturbances represent the most significant disturbance to our measurement, masking the radiation coming from the target. We therefore expect the signal received by an X-band radiometer observing a natural environment such as the one shown in
Figure 1 to be a combination of:
Thermal emission from volcanic rock and surrounding terrain;
Emission and absorption from the atmosphere (clear skies, clouds, rain, etc.);
Thermal emission from active hot volcanic regions (incandescent lava);
Emission and absorption from ash and ejected volcanic material;
Any variations due to water vapor;
Interference of artificial or natural origin.
The objective of this work is to verify the potential applications of microwave radiometry in monitoring volcanic activity, using a fixed instrument that continuously observes the same scenario, recording the variations in response compared to a reference condition (baseline). This condition corresponds to points 1 and 2 in the previous list, when the sky is clear. For more technical information about calibration, see
Supplemental Materials.
3. Results
The experimental campaign conducted at the “Paolo Lanza” station between 2023 and 2025 allowed for the identification of three distinct signal typologies recorded by the RAL10TS radiometer at 11.2 GHz.
3.1. Case Study #1. Analysis of Radiometric Signals During an Extreme Weather Event
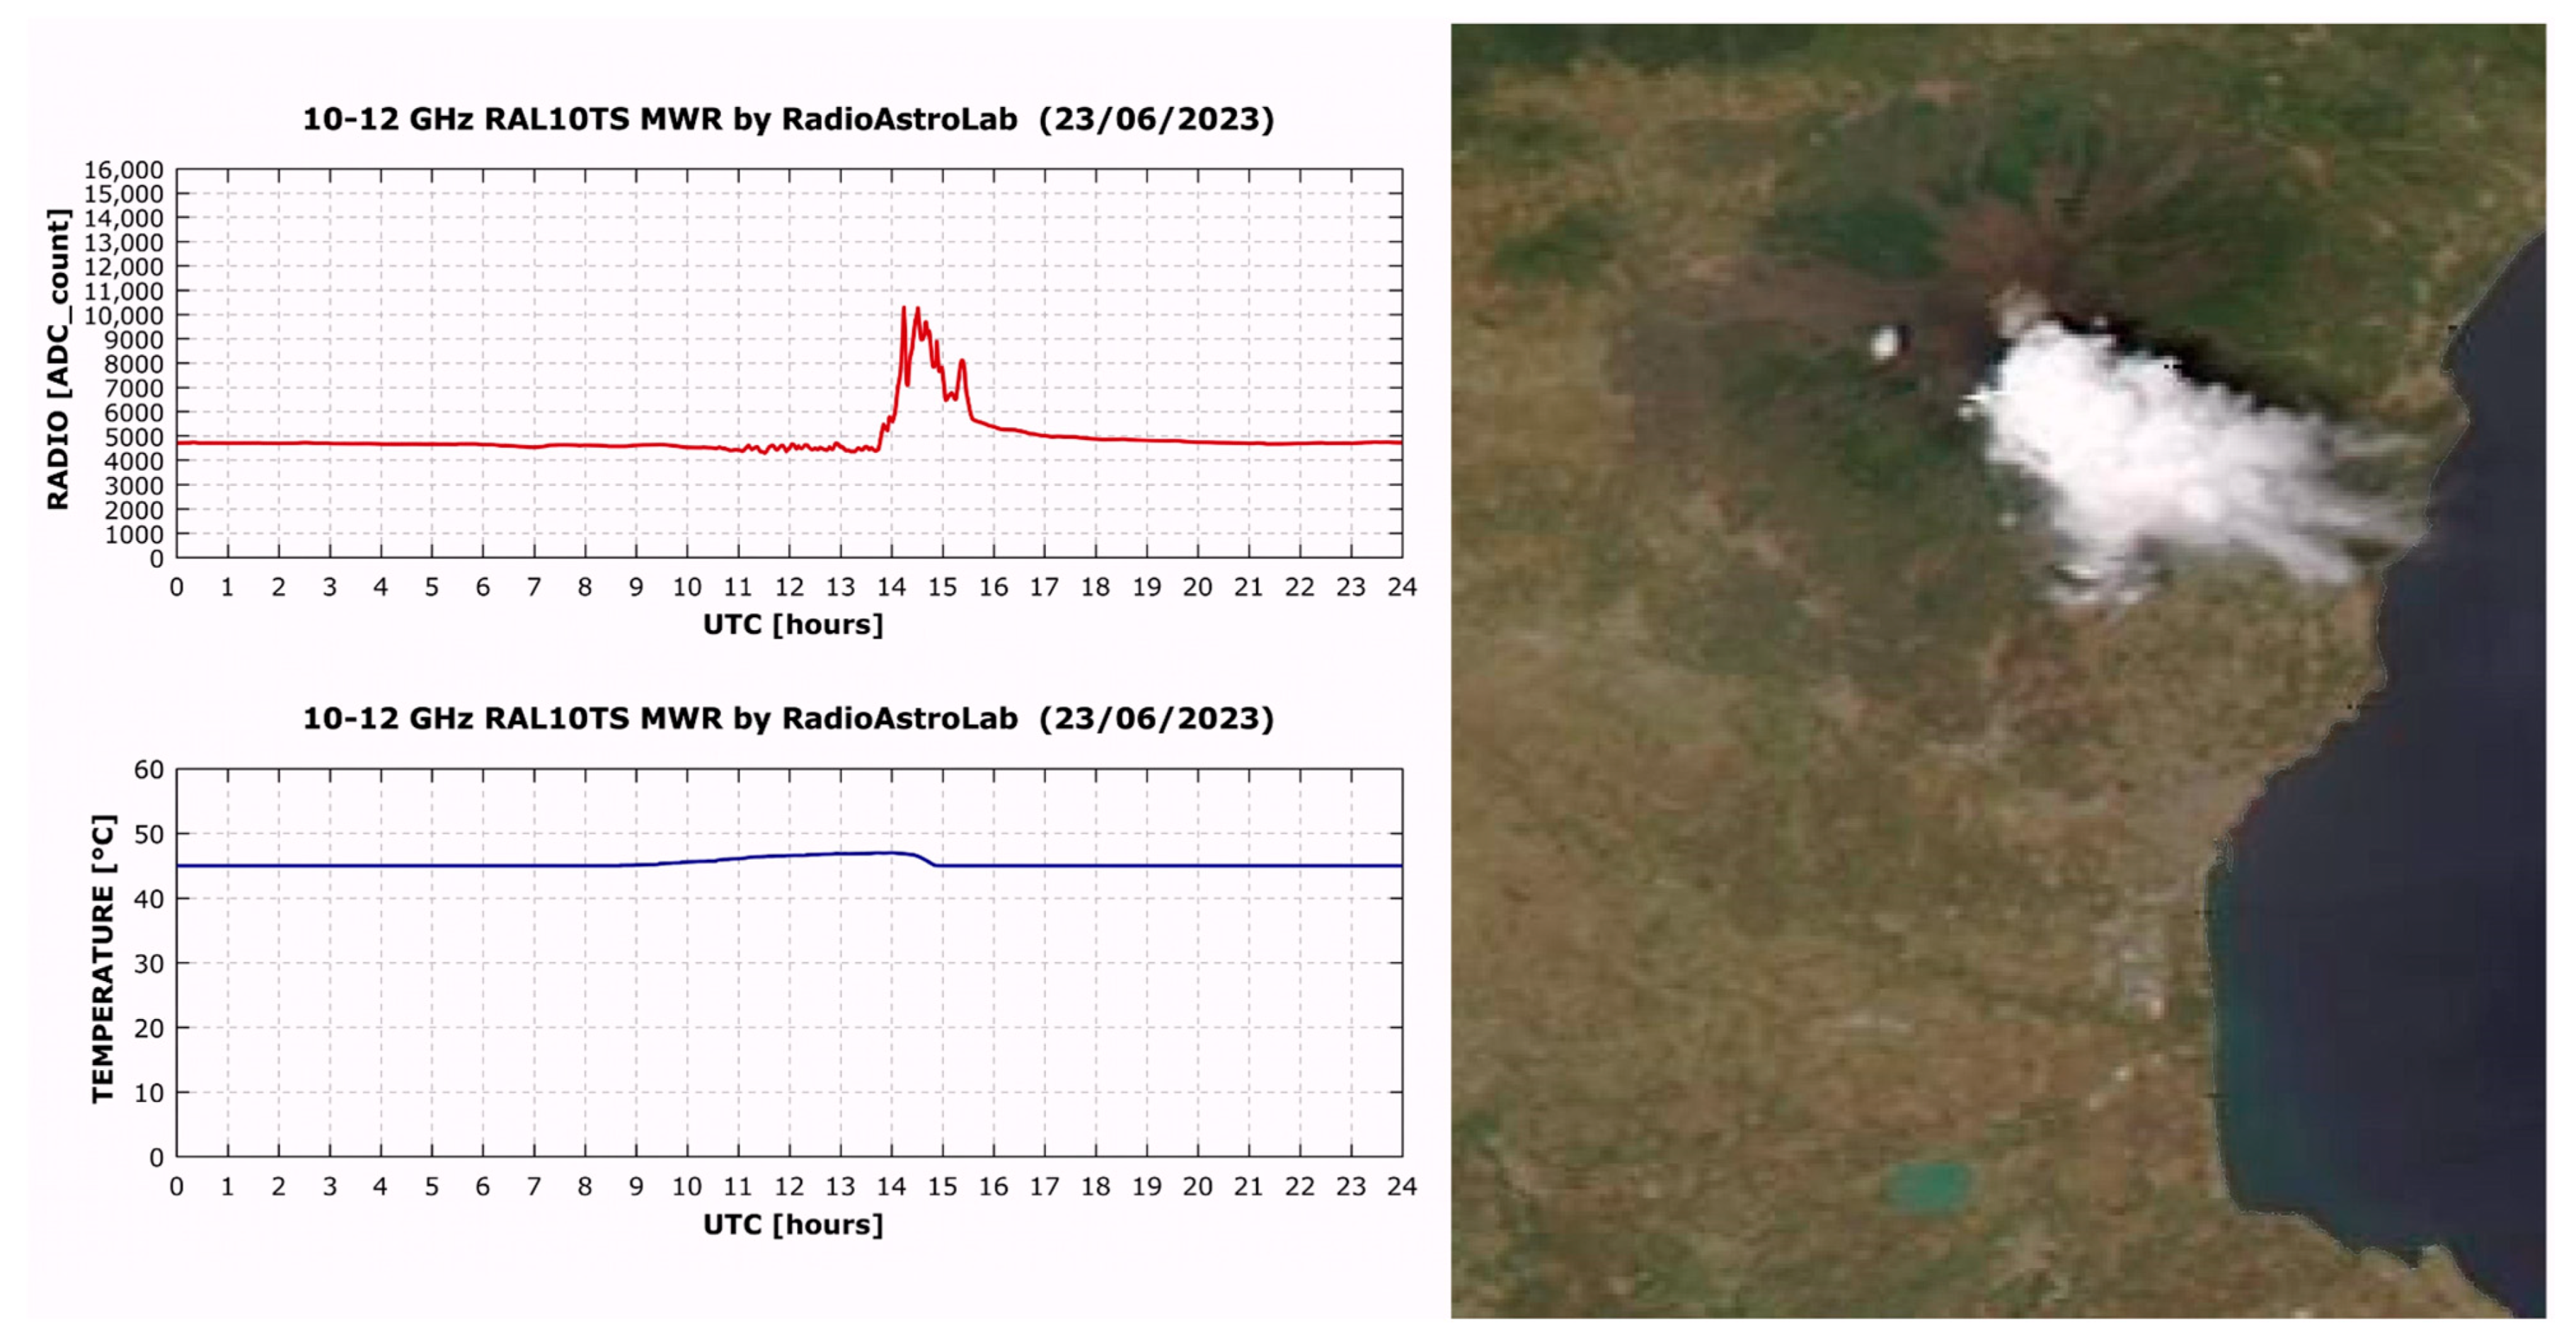
Between 14:00 and 16:00 (UTC) on 23 June 2023, an increase with respect to the previous clear-sky condition in the radiometric signal was recorded by the radiometer (
Figure 5). Considering that no volcanic activity was recorded but very bad weather conditions affected the upper part of the volcano at the time, it was concluded that the anomaly in the radiometric curve was related to meteorological phenomena (with cloud formation associated with precipitation and wind, with a drop in external temperature accompanied by hail as confirmed by video and meteorological observation).
Radio propagation at microwave frequencies in a relatively short horizontal beam (such as the RAL10TS-Etna beam) is mainly influenced by the contribution (increasing with frequency) due to rain. We can imagine the air volume between the instrument and the observed scenario (target) as an attenuator characterized by a temperature and an attenuation factor that includes all possible causes of signal extinction and dispersion. Since the radiometer observes the ground at a short distance, the attenuation of the air layer is negligible in the absence of rain, while in the presence of precipitation, an absorption contribution is added depending on local meteorological conditions and the observing angle. This contribution generates additional noise that significantly increases the observed brightness temperature, masking the radiation coming from the target. On the other hand, in this frequency band, for a short, nearly horizontal path, the noise contribution due to clouds is much lower, and that due to fog is negligible. For these reasons, it is important to analyze the signals, taking into account local weather conditions that can influence the measurement, by considering a longer time window in order to also include reference clear-sky conditions.
Observing the internal temperature stabilization of the radiometer, which is itself thermo-controlled, on 23 June 2023, a progressive increase (with respect to the minimum internal temperature of 45 °C) was noted starting at 10:00 UTC, corresponding to progressive solar warming (
Figure 5). Around 14:30 UTC (corresponding to the radiometric peak), a sharp drop in temperature was recorded, indicating a sudden cooling of the area due to thick clouds (which obscure solar thermal radiation), wind, and rain. The days before and after 23 June showed radiometric measurements at standard values, as shown in the plots in
Figure 5. Inspecting the frames from INGV surveillance cameras at the station, between 14:00 and 16:00 UTC on 23 June 2023, a plume of vapor rose and thickened over Mount Etna due to the lack of high-altitude winds, combined with a dense layer of humidity that affected the area. This combination, along with the plume’s extension, likely obscured solar radiation to such an extent that it triggered a sharp drop in temperature. This drop in the radiometric signal was recorded by the antenna, particularly for the scenario observed in front of the radiometer. This is therefore an important first recorded anomaly to be archived.
3.2. Case Study #2. Analysis of Radiometric Signals During Volcanic Activity, July 2024
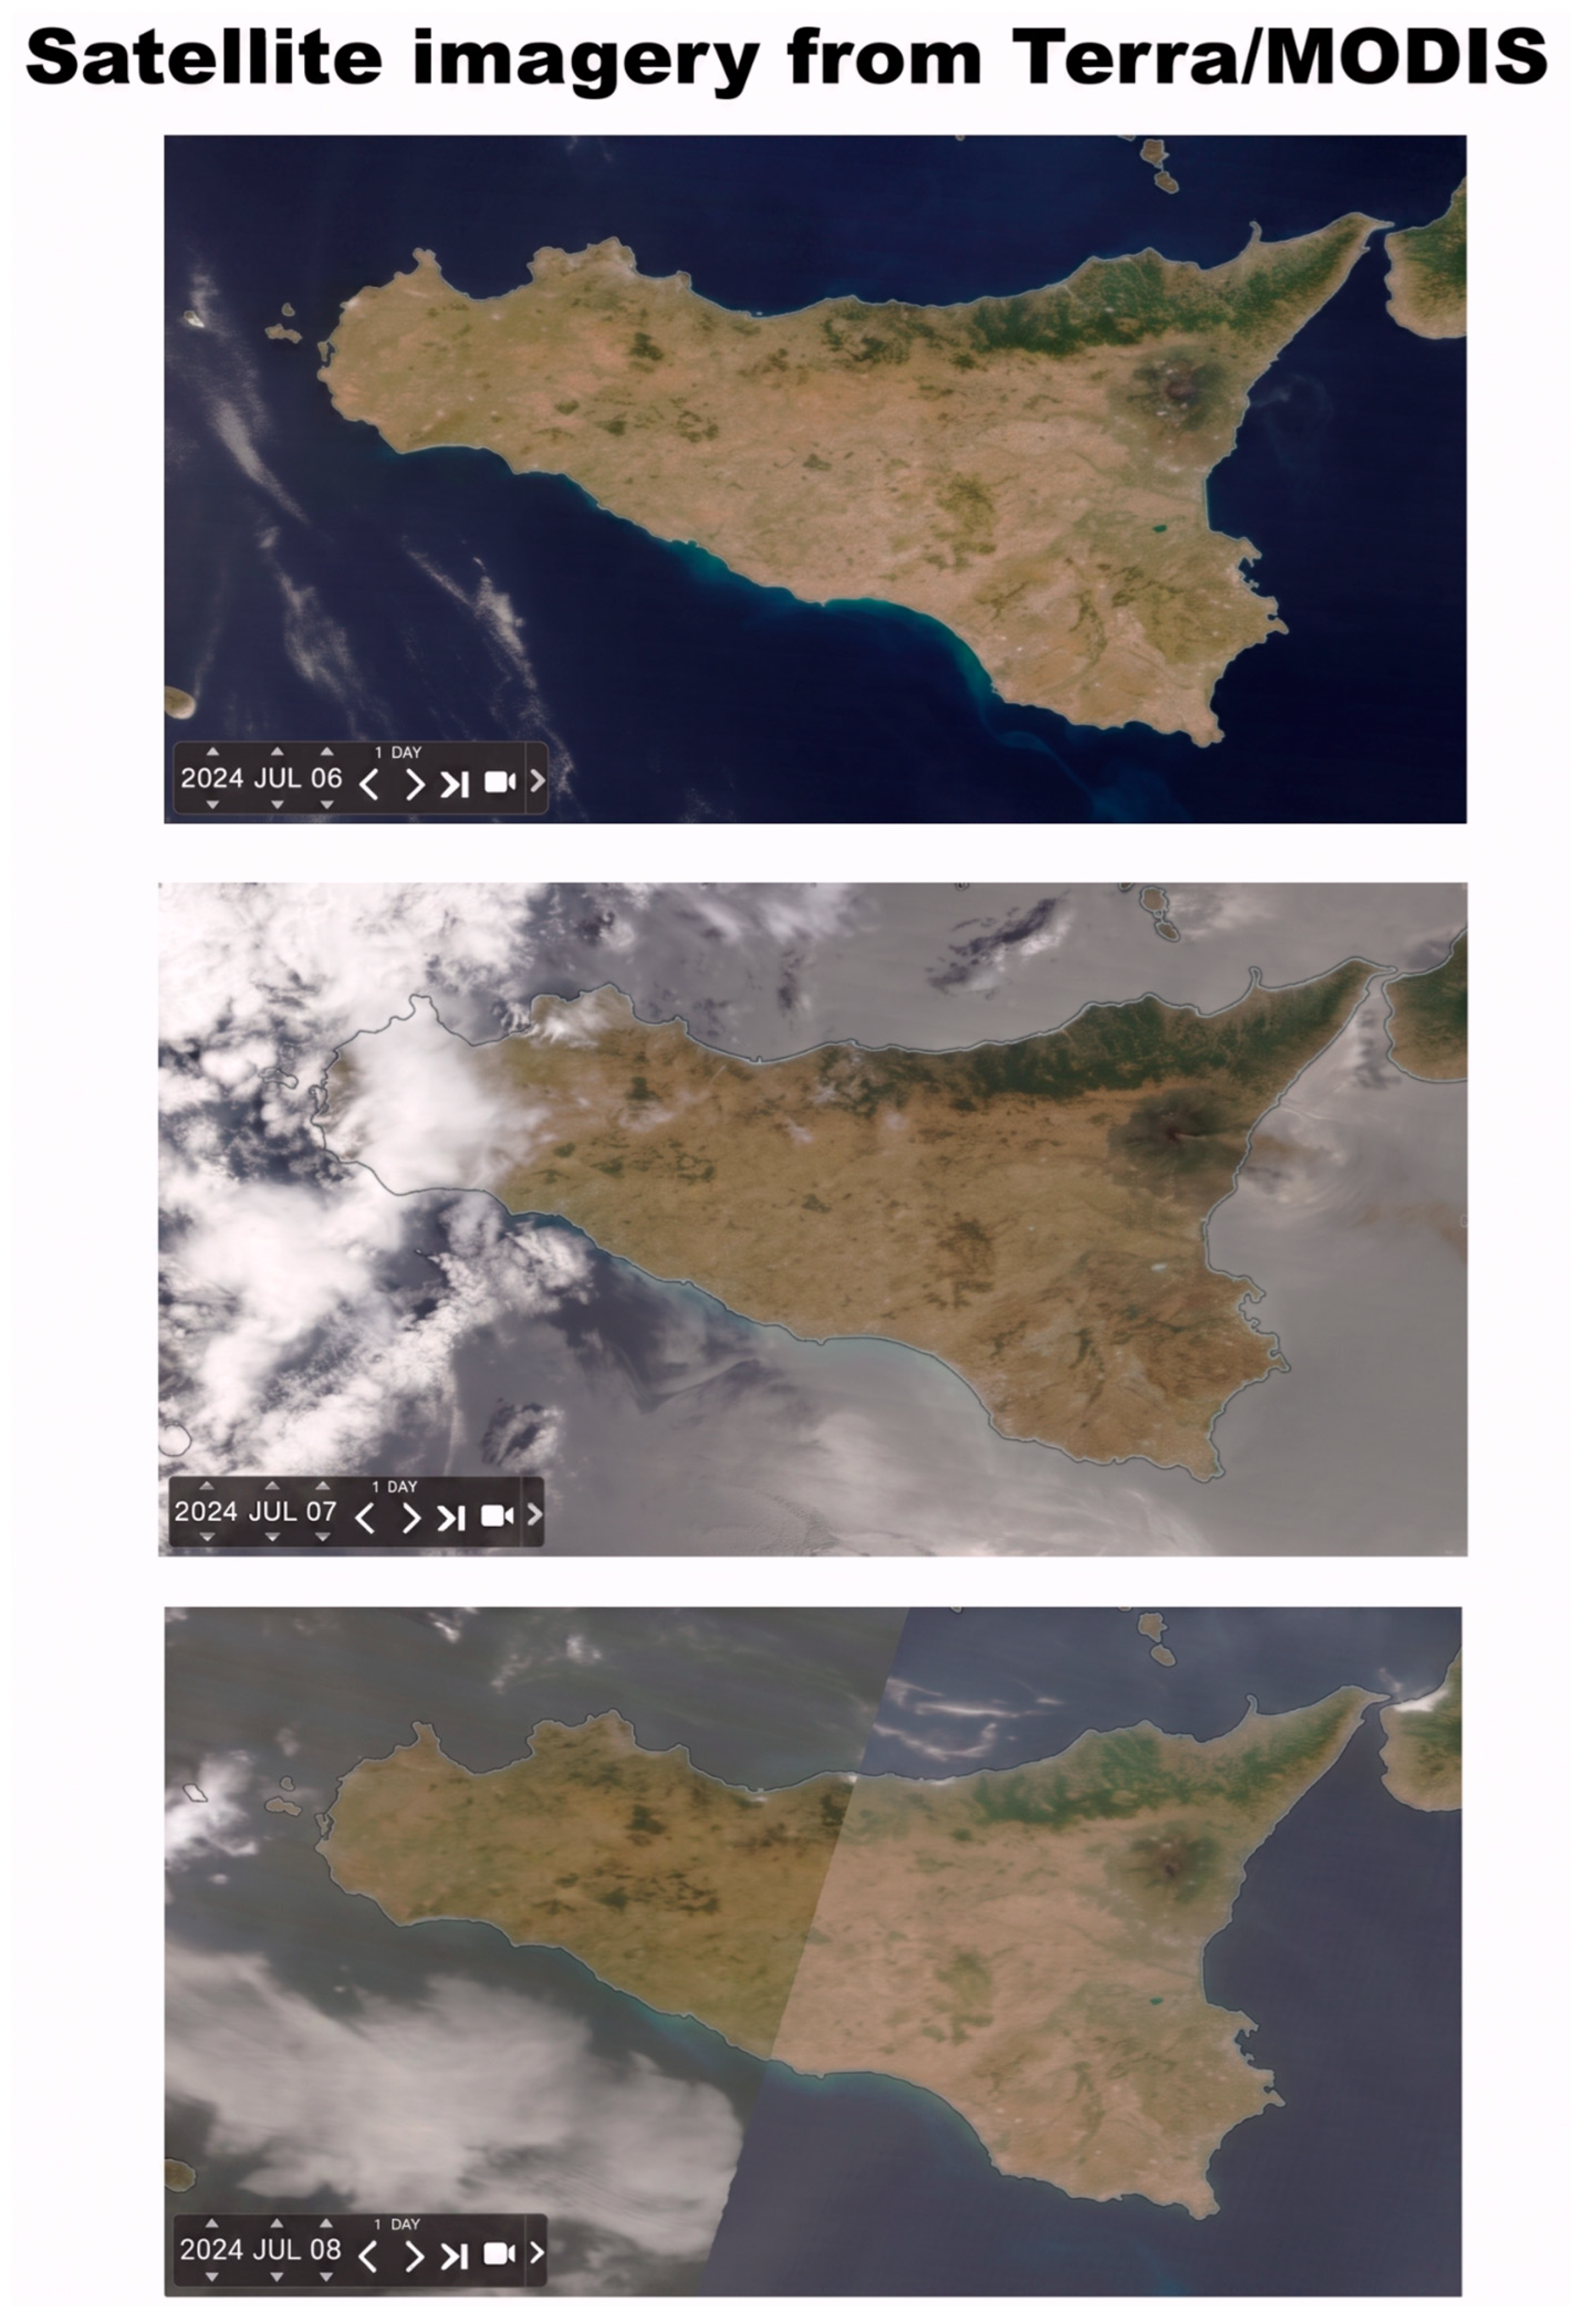
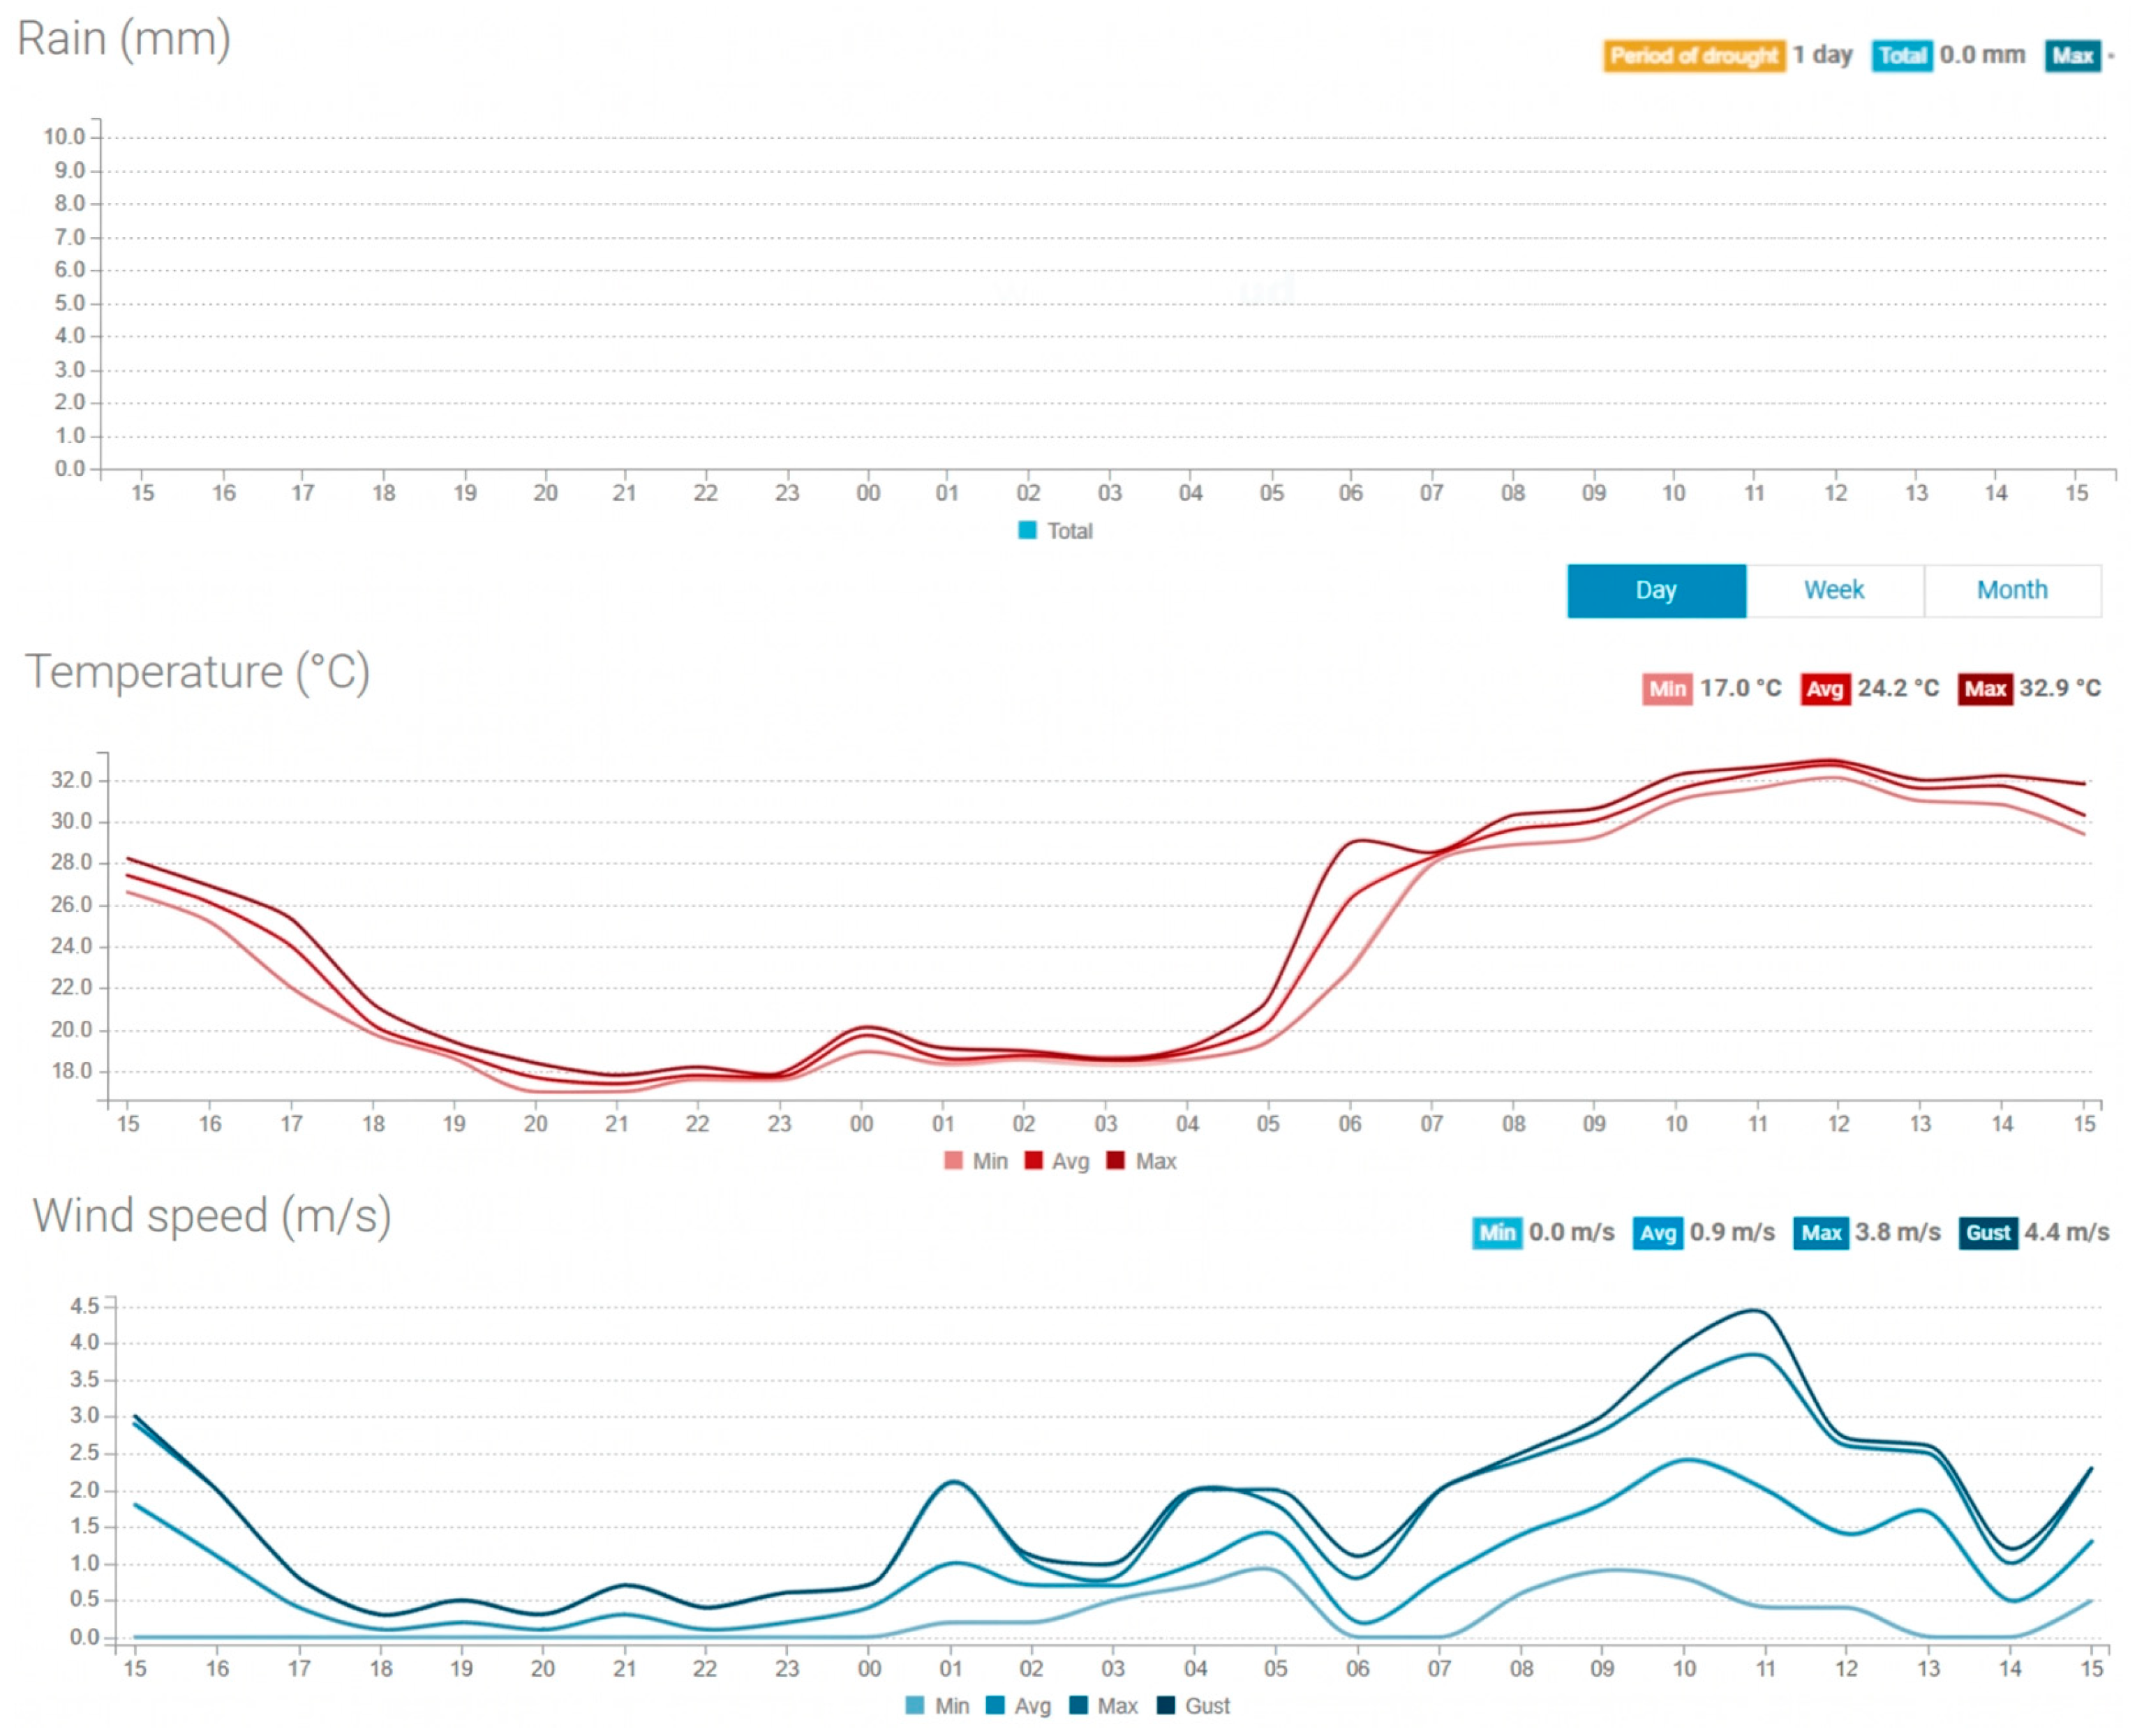
This case reports the signal performance of the RAL10TS radiometer in relation to the volcanic activity of Mt. Etna that occurred on 6–8 July 2024. As can be seen from the following EOSDIS satellite images, on 6–8 July 2024, the sky was generally clear, and the general weather conditions, as documented in the following plots, exclude interference in the measurement due to atmospheric noise. During this season (summer), the intense solar heating that occurs during the central hours of the day causes an excess temperature inside the instrument and in the external receiving unit (LNB positioned at the antenna focus) despite the intervention of the automatic control that tends to keep the instrument temperature stable at 45 °C. This produces a negative drift in the response, which was minimized by processing the acquired data according to an empirical correction procedure for temperature excesses.
To compensate for the negative instrumental drift caused by excess internal heating during peak summer hours, an empirical linear correction factor was applied to the raw radiometric measurements. Assuming the instrument should yield a constant response when observing a thermally stable scenario (such as an inactive volcanic wall on a clear day), this multiplicative compensation is calculated using the continuously monitored internal temperature (t_int) and raw radiometric signal (radio) as follows:
where
T_ref = 45 °C (Reference internal temperature set for the radiometer).
k = 4.0 (Empirical coefficient, typically ranging between 3 and 5).
kk = Compensation factor for the excess internal temperature (t_int).
r_c = Temperature-compensated radiometric response, which replaces the original radio variable.
The parameter k is empirically chosen to ensure that the compensated measurement r_c remains steady throughout the periods when the internal temperature t_int exceeds the T_ref threshold maintained by the automatic control.
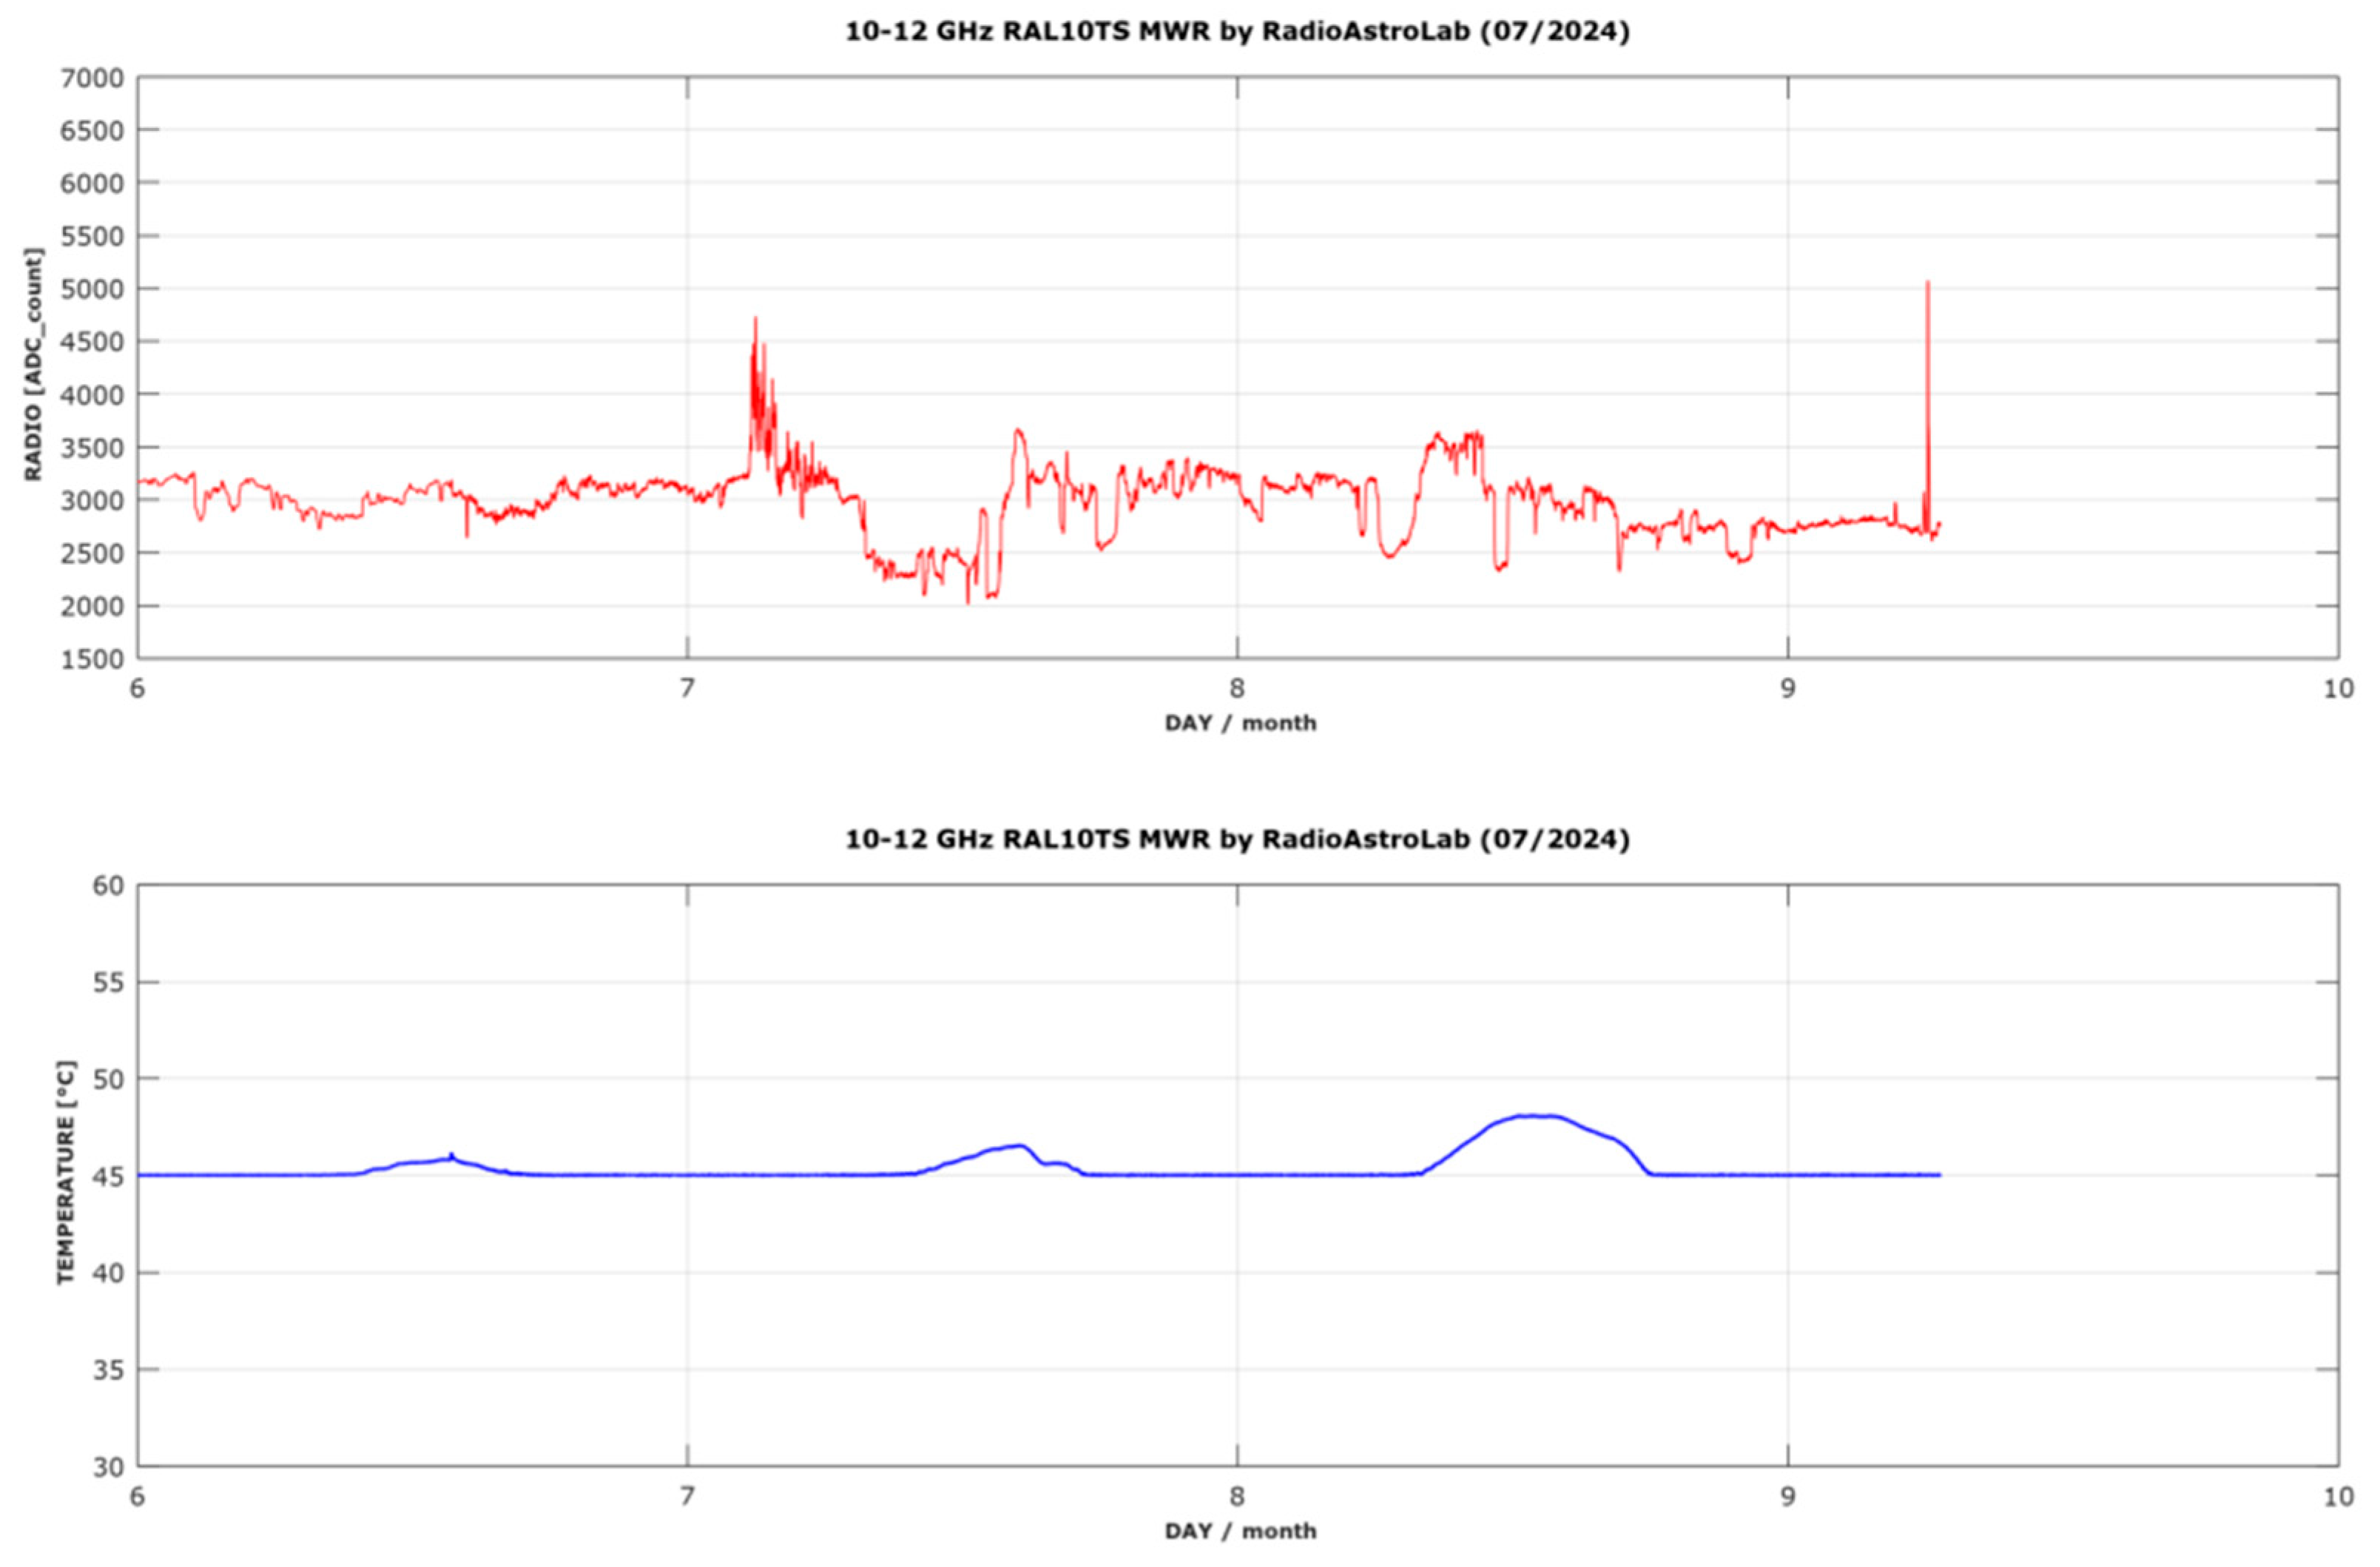
The plots in
Figure 6 show the radiometer’s response from 6 to 9 July (red line) and the instrument’s internal temperature trend (blue line).
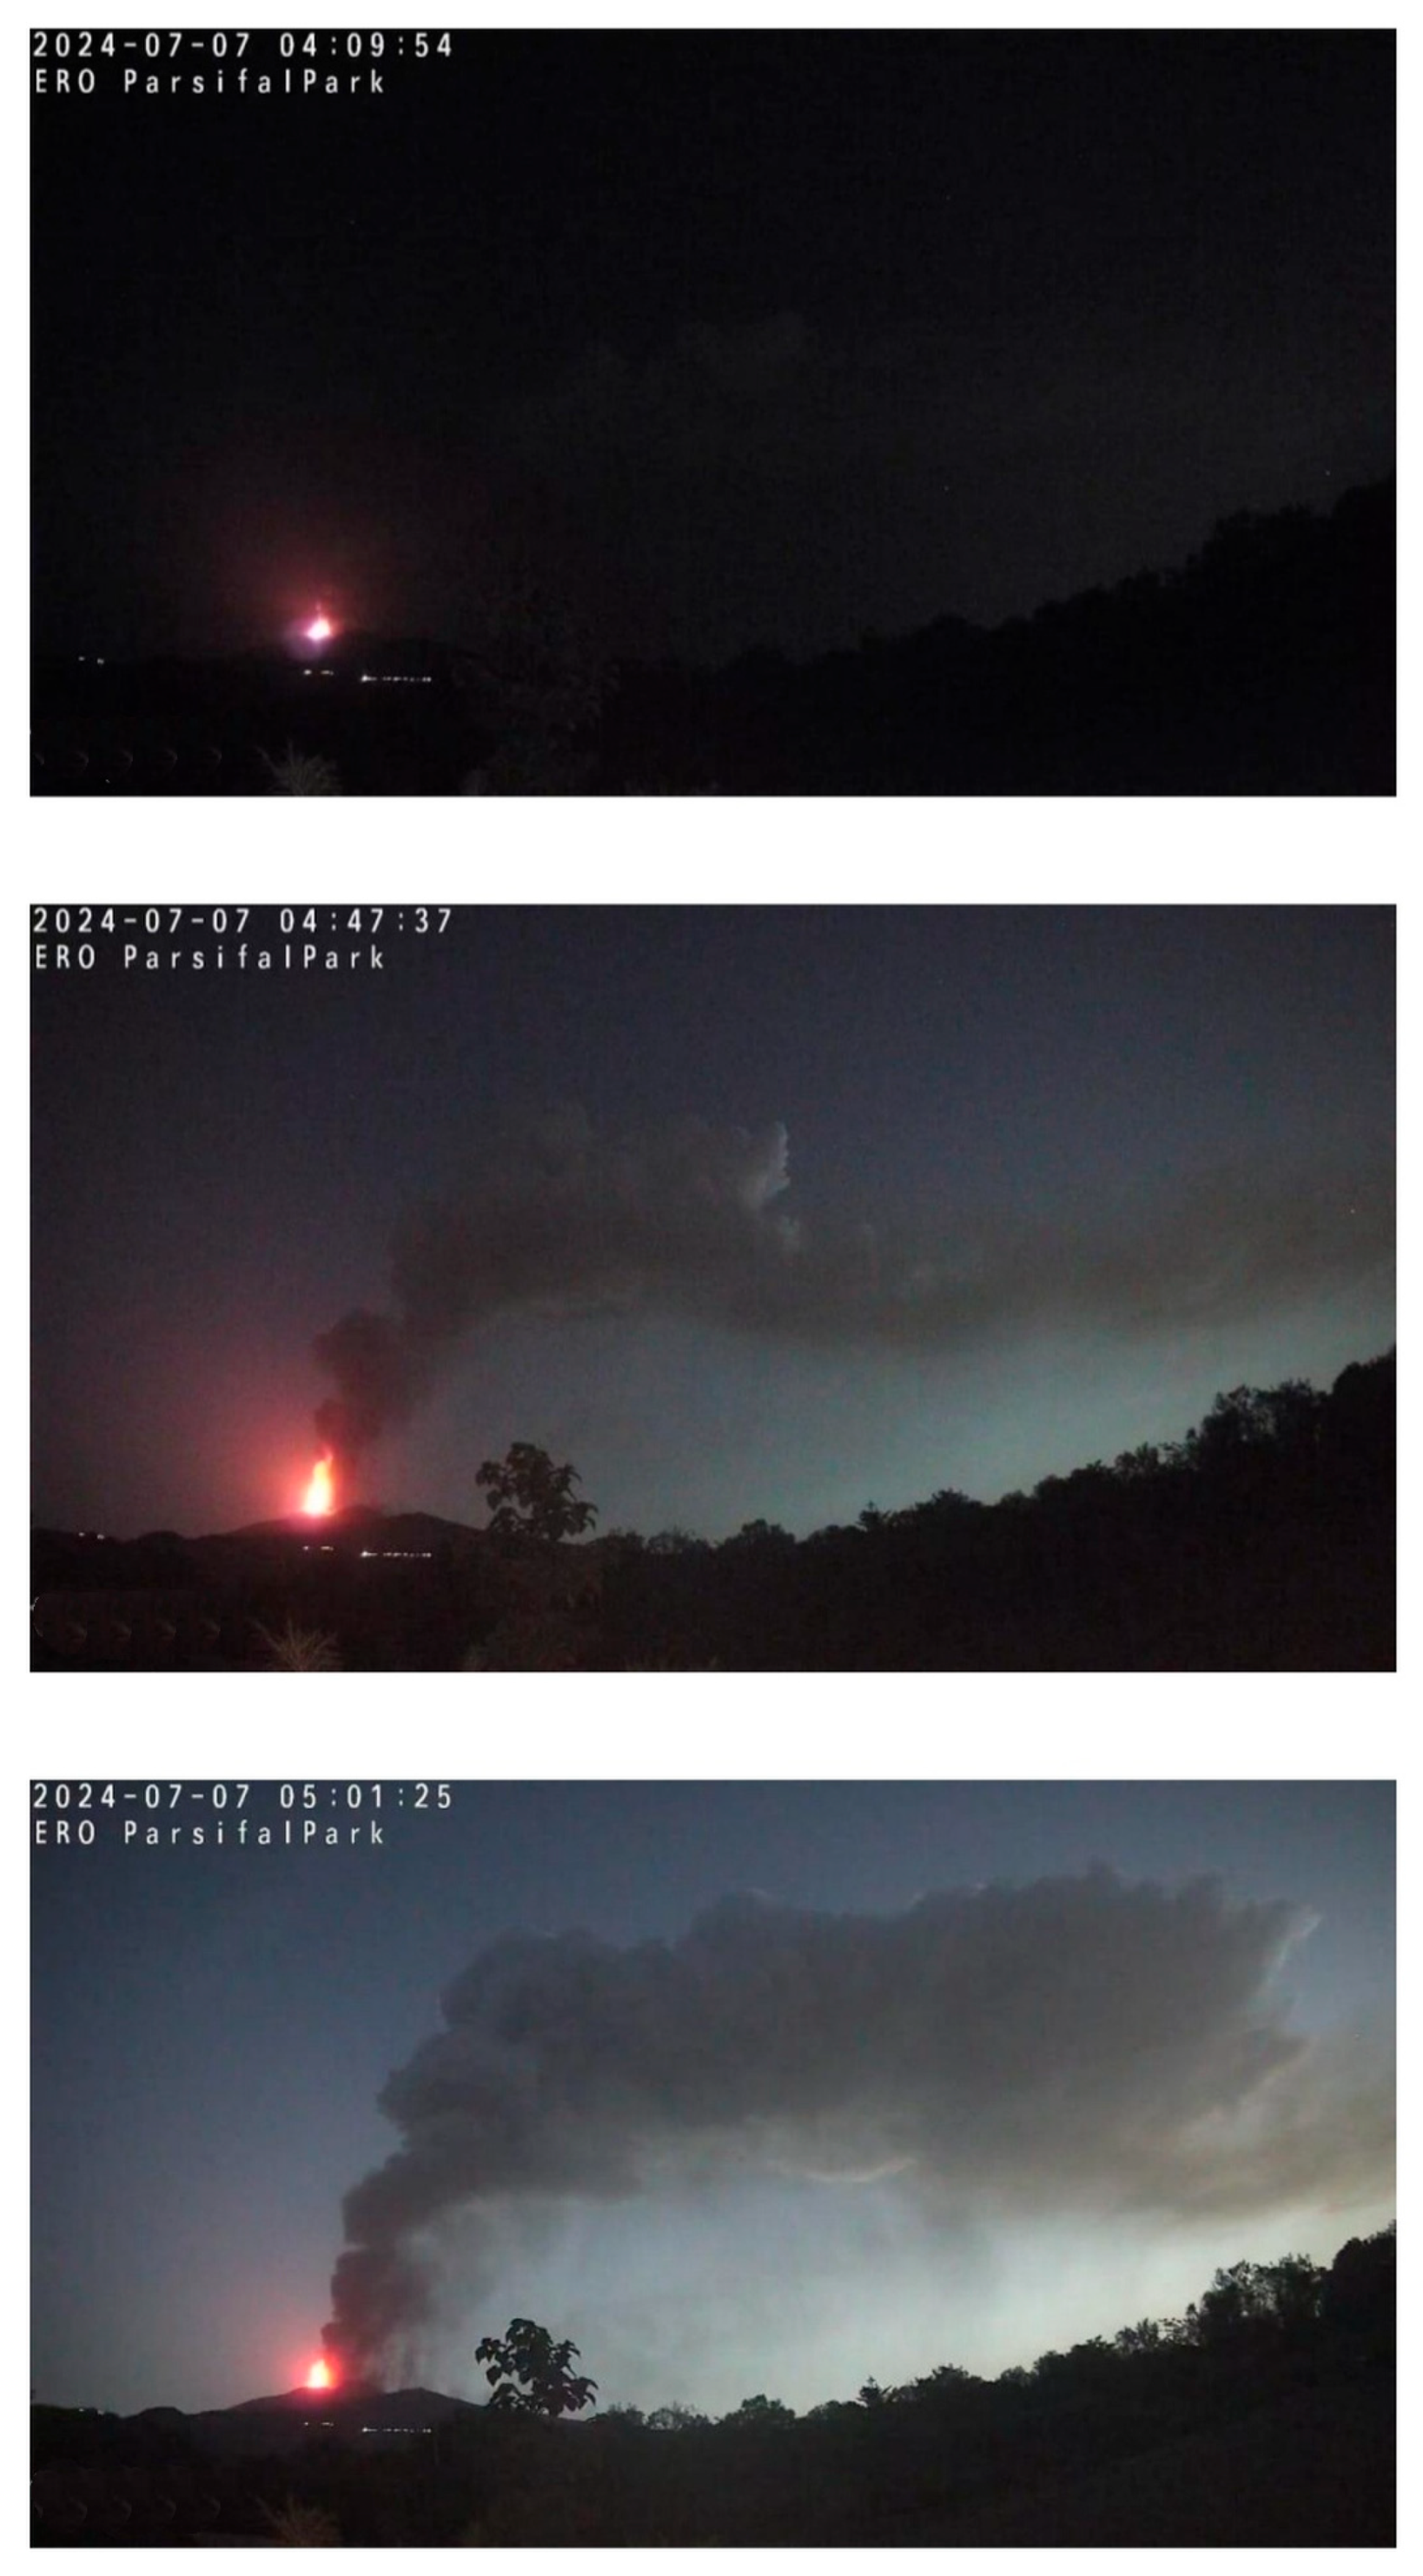
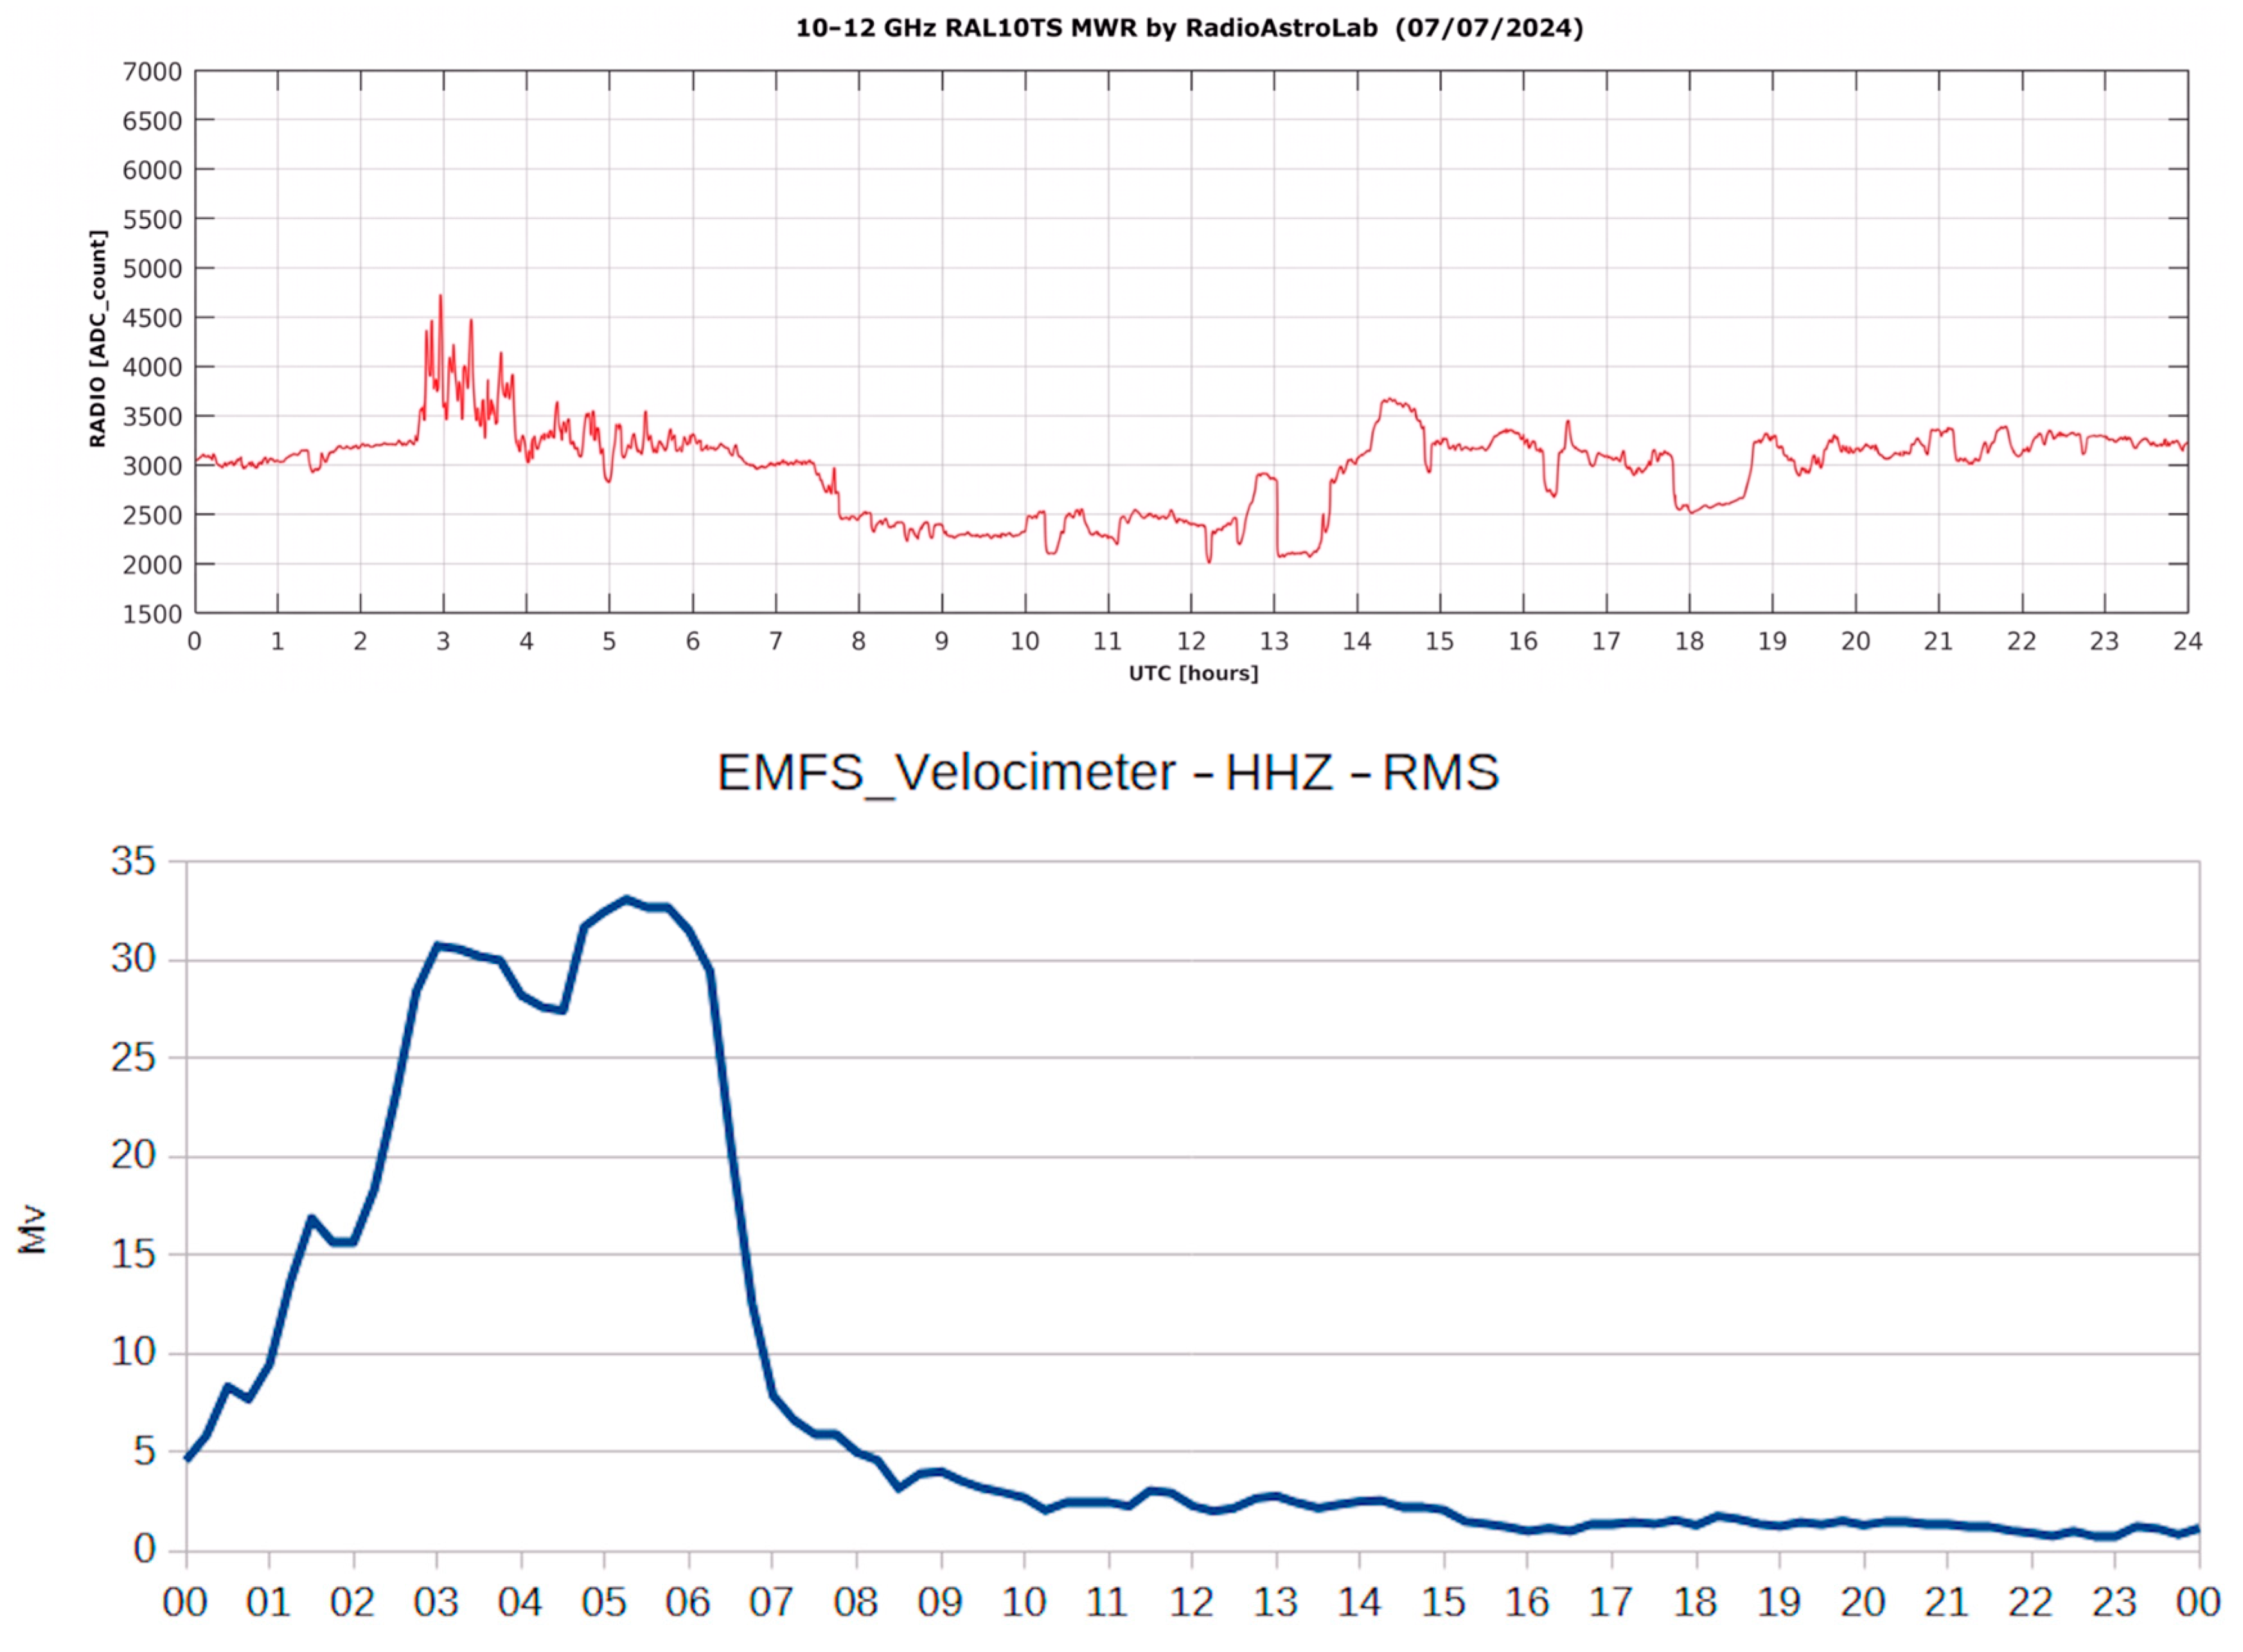
To facilitate the recording of thermal variations due to volcanic activity, especially those of an impulsive and eruptive state, some receiver parameters were modified from the previously set standard values, significantly reducing the measurement integration constant and the sampling period. Comparing the radiometric recordings from the early hours of 7 July with the photographic footage from volcanic video recording (
Figure 7) and with the volcanic tremor recorded at EMFS seismic station managed by INGV-OE (
Figure 8), a correspondence can be noted between the volcanic activity and the increases in microwave signal intensity associated with the baseline and impulsive noise (highlighted by the reduced integration constant of the measurement). Increases in the baseline trend could indicate corresponding increases in the microwave brightness temperature of the scenario observed by the antenna, while the rapidly variable component of the signal could be linked to impulsive volcanic eruptive activity (explosions and expulsions of incandescent solid and/or gaseous material).
For completeness, some satellite images (
Figure 9) and data acquired by the Paolo Lanza Station documenting the meteorological conditions during the period of the event (
Figure 10) are also reported.
3.3. Case Study #3. Analysis of Radiometric Signals During Volcanic Activity, June 2025
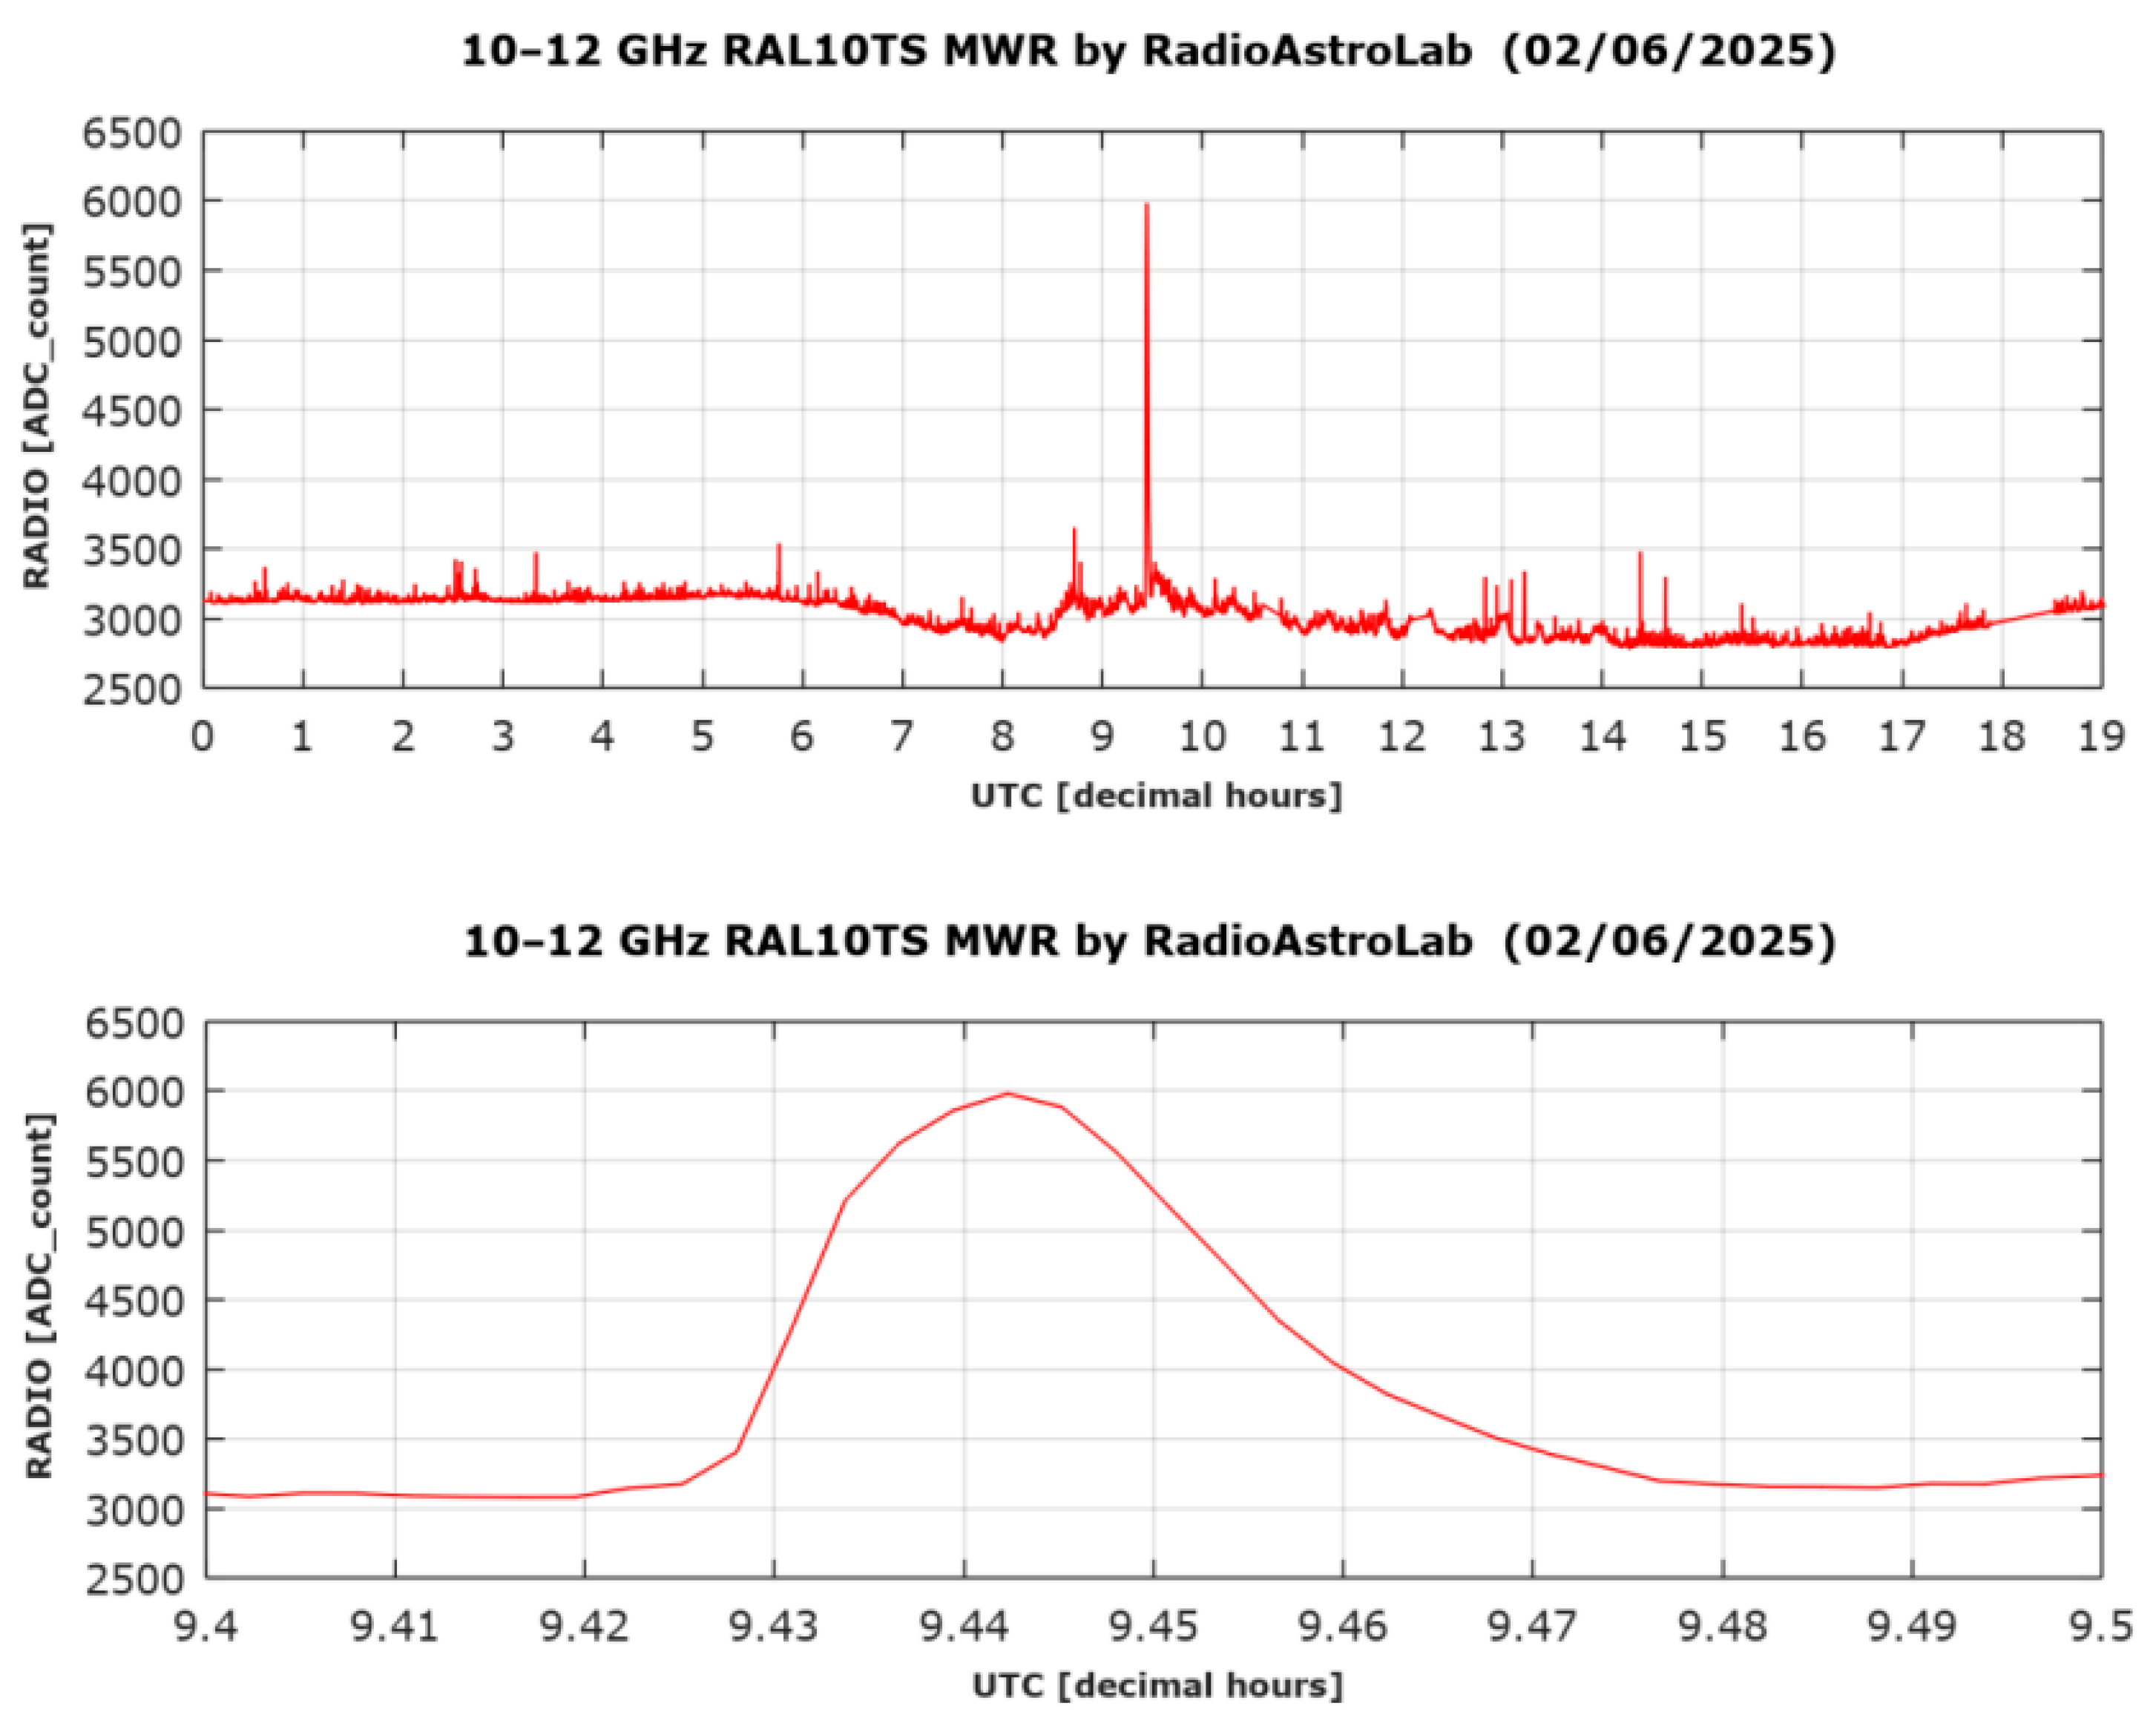
Assuming a temporal coincidence between the peak observed in the 11.2 GHz radiometric measurement on 2 June 2025 and the hot cloud generated by Etna’s explosive activity, we attempted to validate this hypothesis. The plots reported in
Figure 11 show, in arbitrary, uncalibrated units, the trend of the brightness temperature (power associated with the radiation captured by the radiometer) relevant to the scenario “seen” by the antenna of the “Paolo Lanza” monitoring station.
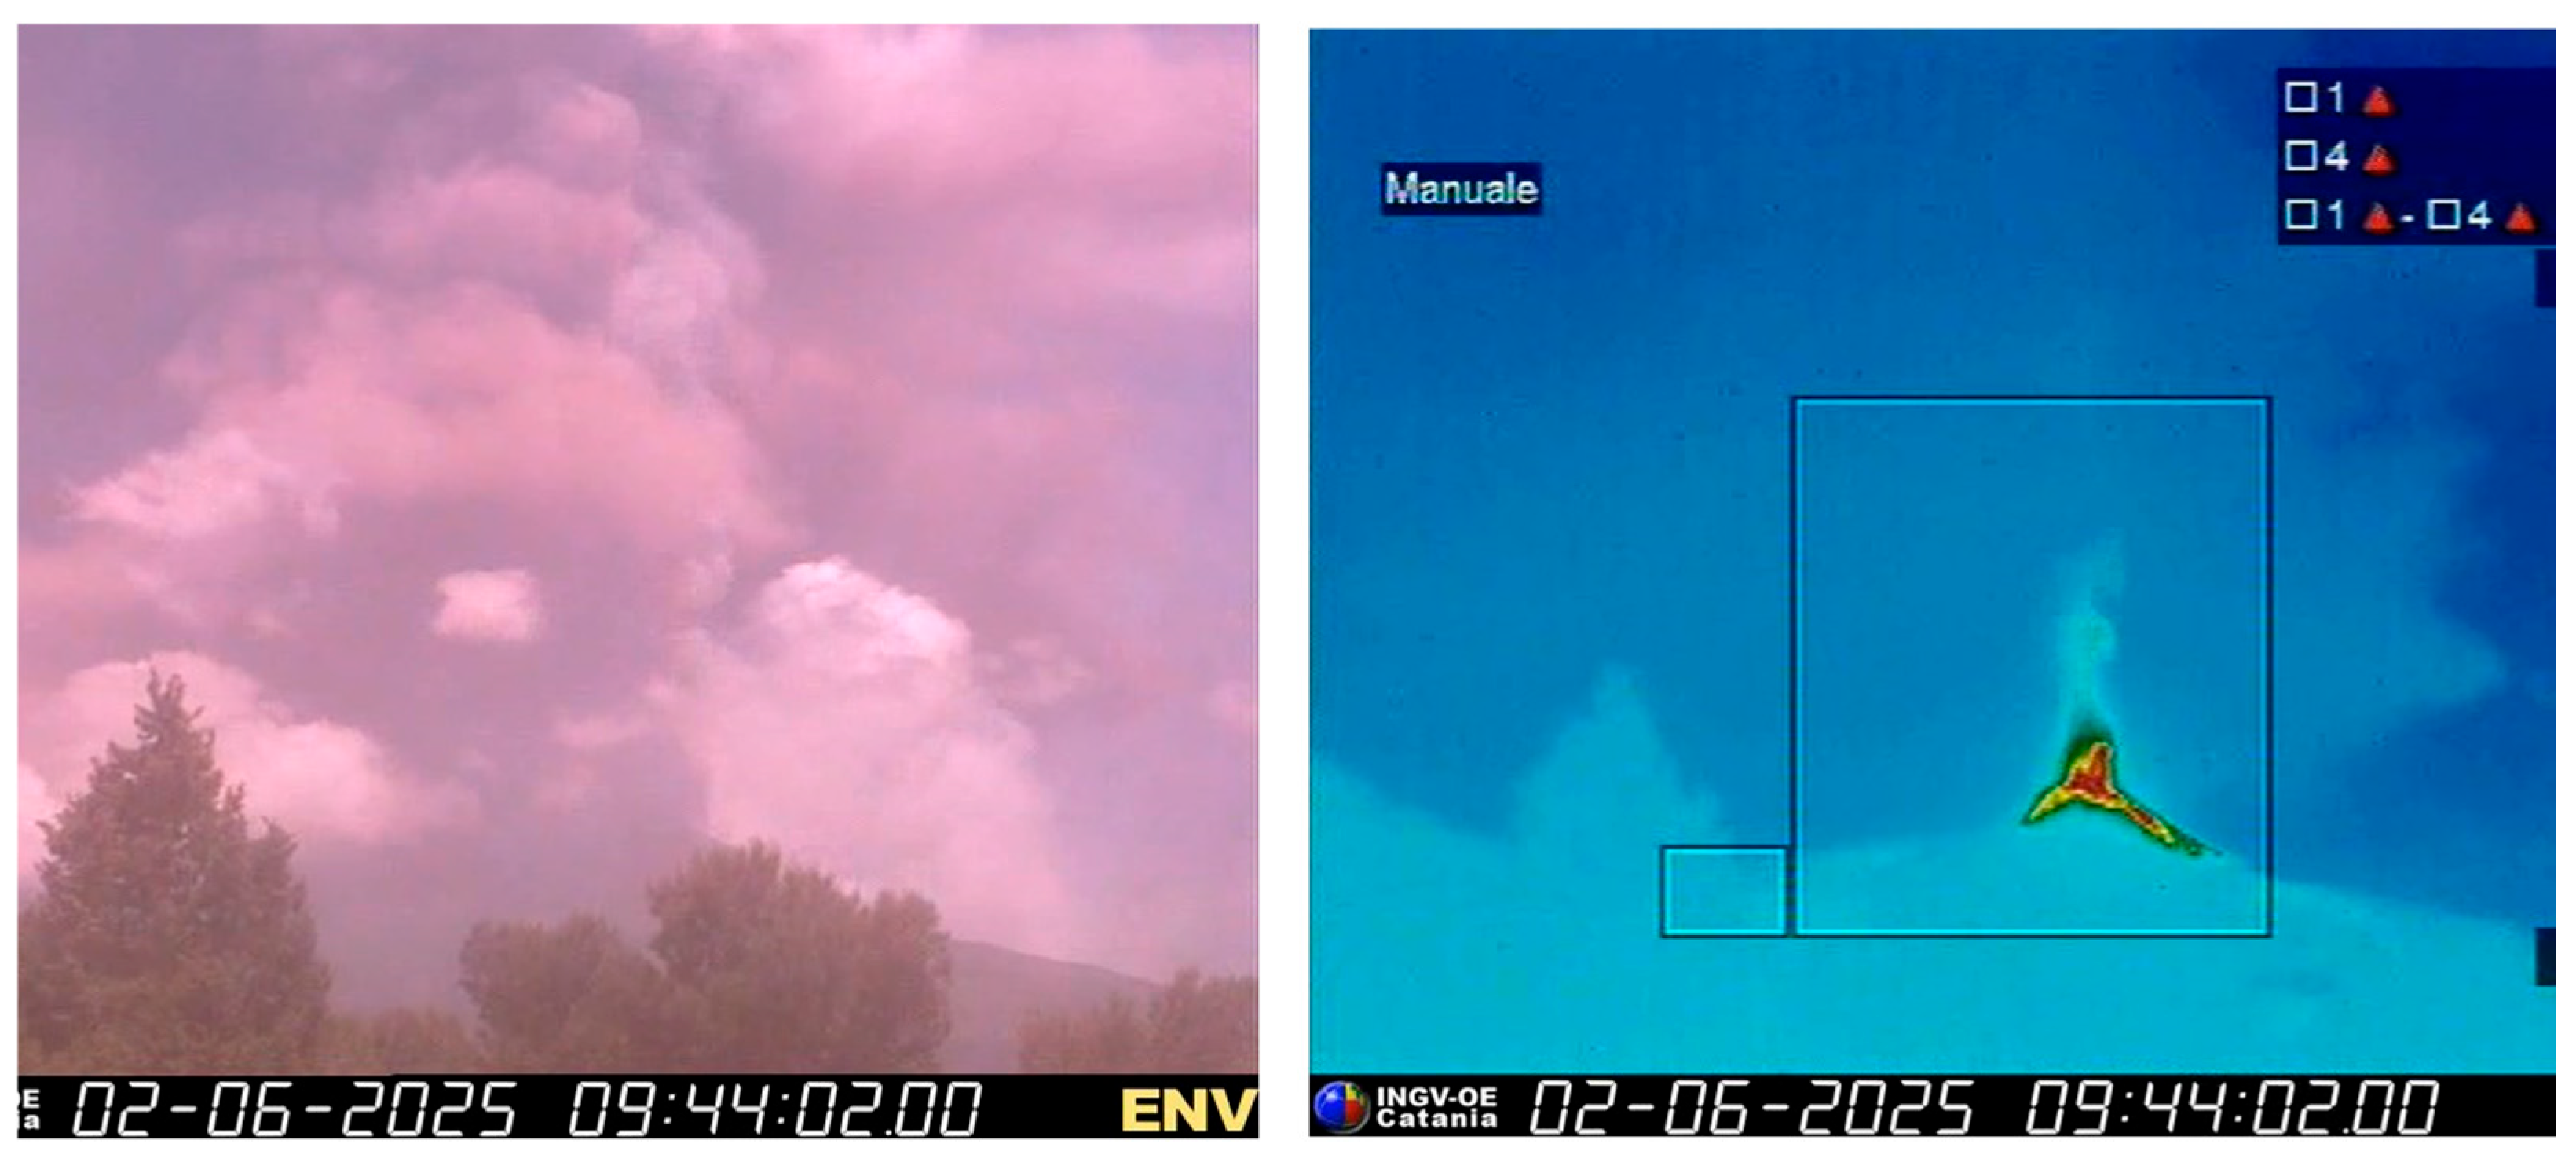
As can be seen from the first graph, the only significant event on 2 June is the peak that occurred between 9:00 and 10:00 UTC. This signal, with a total duration of approximately 3.5 min, does not appear to be caused by meteorological events (clear weather in the area) or artificial disturbances (non-negligible duration): taking into account the various coincidences, there is a high probability that it could be the emission of the hot cloud generated by the volcanic explosion, detected by the radiometer (
Figure 12 and
Figure 13).
Using a number of simplifications, an attempt was made to estimate the characteristics of the imaged object: these are approximate estimates, which can be improved using more accurate initial data. In
Figure 11, the plot on the top shows the daily trend (top) of the brightness temperature recorded by the RAL10TS microwave radiometer. The graph below shows the detail of the captured signal, apparently coinciding with the transit of the hot cloud generated by the volcanic explosion. This should be clearly visible to the instrument because it contrasts with the background scenario, consisting of the relatively warm ground and the clear (cold) sky. The recording suggests a correlation between these events. Considering the characteristics of the RAL10TS radiometer, it is assumed that the antenna’s reception pattern is divided into two parts: the beam region (main lobe), usually well approximated with a Gaussian function, and the remaining part (secondary lobes). Here, we are interested in studying only the radiation coming from the area intercepted by the main lobe, imagining that radiation coming from directions other than the pointing direction is null. In fact, even in the case of a significantly different reception pattern of the antenna, other areas eventually affecting the measurement would be much more stable than the active summit zone, and the noise coming from those areas would be negligible. It is therefore assumed that the antenna’s power pattern is described by a Gaussian function where only the main lobe is present, and the secondary lobes are absent. For simplicity, it is also assumed that the brightness distribution of the hot cloud observed by the radiometer is a Gaussian function. In this case, the antenna temperature measured by the instrument (convolution between the antenna’s power pattern and the source’s brightness distribution) is also a Gaussian function.
However, it is important to note that this idealized theoretical model introduces some simplifications that could lead to estimation errors. First, modeling the source as a Gaussian distribution assumes a homogeneous, symmetrical fade from the center. In reality, a thick volcanic cloud is an intrinsically non-homogeneous mix of basaltic ashes, moisture, and hot gases, which could generate an asymmetrical radiometric signal rather than a perfect Gaussian curve. Second, if the volcanic cloud is significantly larger than the width of the main beam, the antenna beam is completely “filled” by the source, and the received signal is an excellent representative of the source characteristics. But this calculation assumes zero radiation coming from outside the main pointing direction, explicitly excluding the antenna’s side lobes. If the volcanic cloud is significantly larger than the main beam width, the side lobes would intercept additional radiation, potentially causing an overestimation of the temperature or an artificial widening of the signal’s base. Therefore, these rough estimations aim to provide a baseline for detection capabilities and will require refined spatial data for more accurate modeling.
Given the characteristics of the antenna and the radio source (brightness temperature and apparent diameter), it is not difficult to estimate the shape of the instrumental response. Using the data recorded by the station and information deduced from visual and photographic observations, we calculated the antenna temperature variation profile due only to the warm cloud passing in front of the instrumental field of view, excluding the contribution of background noise and compensating for the distortion caused by receiver drift. As regards the characteristics of the thick and hot volcanic cloud composed of basaltic ash, humidity and volcanic gases (SO
2, CO
2), the data from
Section 2.3 were used.
Furthermore, assuming that, due to the dynamics of the eruptive event and the high-altitude winds, the cloud moves in front of the antenna’s field of view at a speed of approximately 0.025 °/s (estimated from INGV videos and reports [
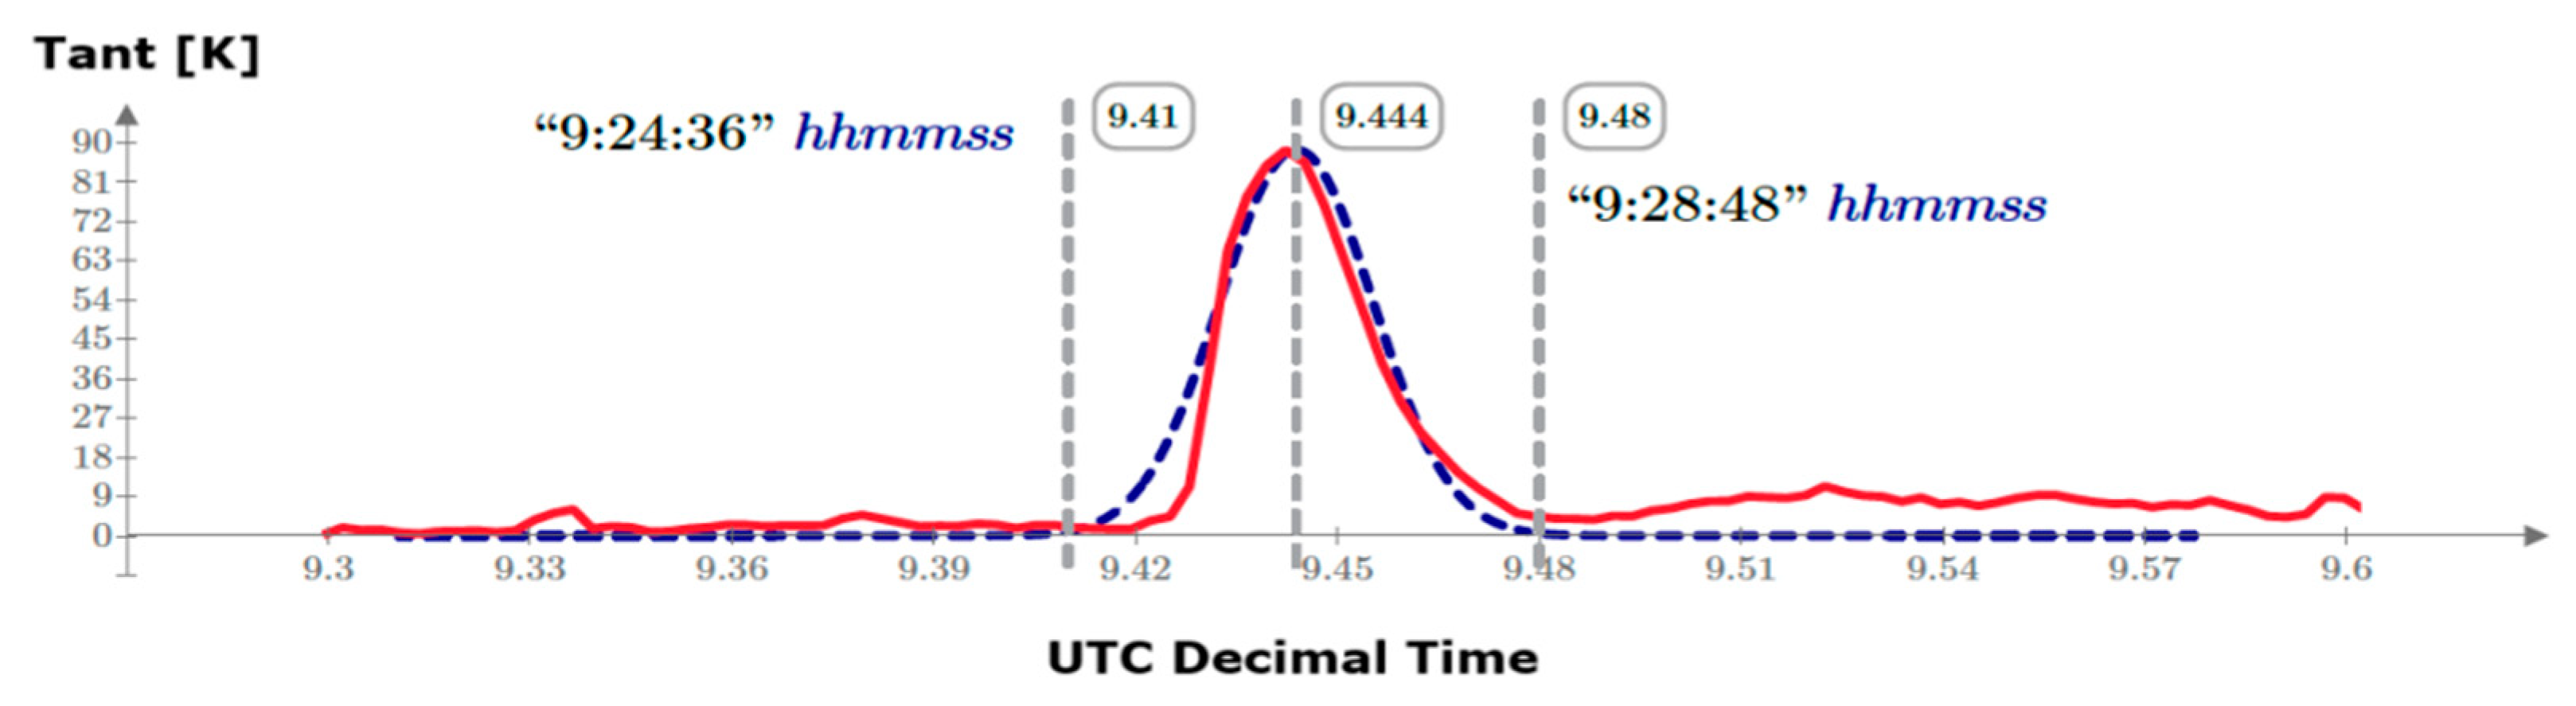
17]), it will take approximately 1.4 min to cross the reception beam. These hypotheses are an idealization and should be taken with caution, used to attempt a reasonable first-order rough assessment of the phenomenon. The plot in
Figure 14 shows the possible correspondence between the signal recorded by the radiometer and the simulation of the transit of the hot volcanic cloud, according to the hypotheses made. The red trace represents the instrument recording after eliminating the contribution of background noise; the blue dashed line represents the expected response of the system to the transit of a hot cloud with the hypothesized characteristics. Since the instrument response is in arbitrary units (counting units of the analog-to-digital converter), to estimate the antenna temperature (vertical axis in K), the scale was calibrated by comparison with similar reference radiometers, obtaining a variation in the order of 0.03 K for each counting unit, ADC_count. These data can be improved by providing a periodic calibration procedure for the “Paolo Lanza” radio station. In addition, by collecting and applying some data about the characteristics and dynamics of the volcanic cloud generated by the explosion of 2 June 2025, better results can be obtained. The aim of this work is to provide an idea of the instrument’s actual capture capabilities.
Figure 14 shows a simulation comparing the antenna temperature variation measured by the RAL10TS radiometer at 11.2 GHz at the “Paolo Lanza” monitoring station (red trace) with the ideal measurement we expect to record when a hot volcanic ash cloud with the characteristics hypothesized above passes in front of the instrument’s field of view. This is a largely approximate estimate which, starting from some simplifications associated with the measurement system and the source, attempts to verify the correspondence between the events.
4. Discussion
The findings of this study demonstrate that passive microwave radiometry provides a “thermal signature” of volcanic activity that is fundamentally different from, and highly complementary to, infrared (IR) or optical observations. The most critical advantage of this methodology is the atmospheric transparency within the 10–12 GHz band. Unlike TIR sensors, which are frequently blinded by thin meteorological clouds, dense degassing, or ash plumes, the microwave radiometer consistently penetrates these barriers. By thoroughly analyzing three distinct operational scenarios, we can better understand both the capabilities and the interpretative nuances of this remote sensing tool.
4.1. Discriminating Weather Effects from Thermal Anomalies
The extreme weather event recorded in June 2023 (Case Study #1) highlights the primary environmental limitation of the system, while simultaneously confirming its overall robustness. During this event, heavy precipitation, wind, and hail introduced a substantial absorption contribution, creating additional noise that sharply increased the observed brightness temperature. This effectively masked the target radiation. However, this confirms a crucial theoretical premise: for a relatively short, nearly horizontal path, only significant liquid precipitation or dense hail alters the signal. The noise contribution from standard meteorological clouds is markedly lower, and attenuation from fog is entirely negligible. Therefore, unless experiencing severe thunderstorms, the system remains a reliable sentinel for volcanic activity, unaffected by the typical atmospheric obscurations that hinder optical networks.
4.2. Deciphering Volcanic Signal Dynamics
The data acquired during the July 2024 paroxysms (Case Study #2) demonstrate the instrument’s capacity to resolve different scales of volcanic energy. By optimizing the receiver parameters—specifically by significantly reducing the measurement integration constant and sampling period—we successfully decoupled the signal into two distinct diagnostic components. Broad, sustained increases in the baseline trend serve as a proxy for the generalized heating of the observed scenario, indicating a rise in the overall microwave brightness temperature of the volcanic flank. Conversely, the superimposed, rapidly varying high-frequency spikes correlate perfectly with impulsive eruptive activity, such as Strombolian explosions and the forceful ejection of incandescent material. The temporal alignment of these radiometric pulses with spikes in the seismic tremor network confirms that the radiometer is directly capturing the thermal expression of the volcano’s internal mechanical dynamics.
4.3. Morphological Analysis and Parameter Estimation
The June 2025 event (Case Study #3) represents a milestone in moving from qualitative detection to quantitative parameter estimation. The 3.5 min radiometric peak, occurring in completely clear weather, provided an unobstructed signature of a high-temperature volcanic cloud. The recorded signal’s distinct Gaussian morphology is particularly diagnostic. Since the antenna’s main reception lobe is well-approximated by a Gaussian function, the fact that the recorded signal mirrors this shape implies the passing hot ash cloud maintains high spatial coherence across the beam’s field of view. This geometric alignment allows us to model the event. By applying these theoretical simplifications, we could estimate critical physical parameters that are extremely difficult to constrain optically: a physical cloud temperature of approximately 500 K, an estimated emissivity of 0.8 (derived from the microphysical characterization and optical thickness of volcanic ash clouds at microwave frequencies [
18,
19]), an apparent diameter of ~1.2°, and a transit speed across the beam of 0.025 degrees/s. While these are first-order approximations, they prove that fixed-point microwave radiometry can yield actionable, quantitative data regarding eruption column dynamics.
4.4. Operational Constraints and Mitigations
Finally, achieving these results requires careful management of instrumental constraints. As observed during the summer months, intense solar radiation causes a negative drift in the LNB response, despite the internal thermo-control system striving to maintain a stable 45 °C. However, the implementation of a rigorous empirical correction procedure during data processing proved highly effective. By compensating for these thermal drifts, we can reliably stabilize the baseline over long periods, ensuring that the isolated anomalies are genuinely volcanic in origin.
5. Conclusions
This research represents a pivotal milestone in volcanic surveillance, successfully demonstrating the first ground-based application of a low-cost, passive microwave radiometer for monitoring eruptive phenomena at Mt. Etna. By utilizing the RAL10TS radiometer, we have proven that microwave technology is not merely a theoretical alternative, but a robust, active tool capable of directly detecting impulsive volcanic events. Strikingly, during the 2 June 2025 eruption, the instrument recorded a massive 3000-count surge in the radiometric signal, providing an unmistakable and immediate thermal signature of a hot volcanic cloud.
The reliability of this “invisible eye” is strongly validated by temporal and spatial correlations with independent observational networks. Both the July 2024 and June 2025 eruptive events exhibited precise alignments between our radiometric data, video surveillance, and seismic tremor records. Crucially, the radiometer penetrates where traditional optics fail: it successfully detects thermal anomalies even when visual lines of sight are completely obscured by volcanic plumes, provided the events cross the instrument’s skyward field of view.
Furthermore, we have successfully isolated the genuine volcanic signal from environmental noise. While heavy rain remains a masking factor, the distinct, perfect Gaussian signature of a passing hot cloud is easily distinguishable from the irregular radiometric curves generated by meteorological disturbances. Beyond mere detection, this continuous stream of radiometric data unlocks deeper physical insights. By refining our initial approximations, we can use these signals to estimate critical parameters such as the emissivity, physical temperature, apparent diameter, and transit speed of volcanic clouds. By tracking baseline shifts versus rapid signal variations, we can effectively differentiate between a generalized heating of the volcanic slope and explosive, impulsive ejections.
This pioneering approach comes with inherent operational challenges. Approximations in beam and cloud modeling are necessary compromises, and absolute temperature calculations currently require periodic calibration against reference radiometers. Additionally, solar-induced sensor drift and intense rainfall require careful empirical corrections and filtering to unmask the true volcanic signal. Yet, these operational hurdles are vastly outweighed by the technology’s potential.
The ultimate promise of this study extends far beyond the slopes of Mount Etna. Globally, many high-risk volcanoes threaten vulnerable populations in regions where maintaining expensive radar or high-end thermal imaging is financially unfeasible. Our radiometric approach—built entirely on affordable radio astronomy components—offers a highly accessible, cost-effectiveness blueprint for deploying “radiometric arrays” worldwide. Completely passive and requiring no emission licenses, it is the perfect candidate for 24/7 early warning systems in high-risk volcanic arcs like the Andes and Indonesia.
Looking ahead, we will focus on developing automated, real-time alert algorithms capable of instantly distinguishing eruptive signatures from weather noise. By eventually integrating multi-frequency channels (such as 24 GHz or 35 GHz), we foresee a future where microwave radiometry delivers a complete 4D reconstruction of eruptive dynamics, fundamentally advancing aviation safety and civil protection. The microwave radiometer has proven its worth; it is fully ready to take its place in the next generation of global volcano monitoring networks.




 ,
,