Article

Integrating Ascending–Descending SBAS and PS-InSAR to Monitor Landslide Deformation in the Jinsha River Batang Reach, China

1
College of Earth and Planetary Sciences, Chengdu University of Technology, Chengdu 610059, China
2
Key Laboratory of Earth Exploration and Information Technology of Ministry of Education, Chengdu University of Technology, Chengdu 610059, China
3
Sichuan Sumhope Spatial Technology Co., Ltd., Chengdu 610094, China
*
Author to whom correspondence should be addressed.
Remote Sens. 2026, 18(16), 2786; https://doi.org/10.3390/rs18162786
Submission received: 23 June 2026 / Revised: 13 August 2026 / Accepted: 14 August 2026 / Published: 18 August 2026
(This article belongs to the Section Engineering Remote Sensing)

Highlights

What are the main findings?
  • Combined ascending–descending PS-InSAR and SBAS-InSAR are verified to adapt to the alpine canyon terrain of the Batang reach.
  • Long-term downslope deformation data reveal that active faults, river incision and topographic relief jointly control the distribution of high-position landslides in the study area.
What are the implications of the main findings?
  • The dual-orbit InSAR scheme can serve as a feasible technical option for landslide identification in tectonically active rugged mountain valleys.
  • The correlation analysis between slope deformation and geologic–geomorphic features offers basic data for landslide early warning along hydropower facilities and transport corridors of the upper Jinsha River.

Abstract

The Jinsha River Basin on the eastern margin of the Qinghai–Xizang (Tibetan) Plateau is one of the most landslide-prone regions globally. The Batang reach (from Suwalong Township to Changbo Township) lies in the core of the Jinsha River Suture Zone, characterized by complex geological conditions and frequent landslide disasters. To address the limitations of traditional monitoring methods—including difficulty in full-area coverage, high costs, and low efficiency in mountainous canyon terrain—a systematic study of landslide monitoring was conducted using Sentinel-1A SAR data and Interferometric Synthetic Aperture Radar (InSAR) technology. The results demonstrate that SBAS-InSAR, via short-baseline combinations, achieves a monitoring point density of 697 points/km2 (6.28 times that of PS-InSAR), offering significant advantages in mountainous canyon areas with dense vegetation and fragmented rock masses. Using this technical framework, a total of 38 active landslides were identified in the study area, including 5 newly detected rapidly deforming hazards, 17 with river blockage risk, and 10 with the potential to bury buildings. The maximum downslope deformation rate reaches −89.56 mm/yr for the landslide near Suwalong Hydropower Station. Landslides are concentrated within 500 m of faults, in weak rock zones, on steep slopes with gradients greater than 30°, and near road-cutting projects. Temporally, landslide deformation shows an evident correlation with rainfall; approximately 70% of annual cumulative deformation occurs within the rainy season. Engineering activities including hydropower station impoundment appear to be associated with elevated deformation rates of local landslides. This study provides a scientific basis for the safety of major infrastructure corridors (e.g., the Sichuan–Tibet Railway) and regional disaster prevention and mitigation.

1. Introduction

The Jinsha River Basin on the eastern margin of the Qinghai–Tibetan Plateau features deeply incised valley landforms along the plate tectonic suture zone. The complex geological evolution and geomorphic transformation process has made it one of the most densely developed areas of landslides in the world [1,2,3,4,5,6]. Among them, the Batang reach of the Jinsha River Valley (from Suwalong Township to Changbo Township) lies in the core of the Jinsha River Suture Zone. It is not only affected by active tectonic structures including the Jinsha River Fault and Batang Fault, but also underlain by extensive special lithologies such as altered ophiolite. Such lithologies are prone to softening when exposed to water, exhibiting a significant reduction in cohesion and internal friction angle, thus constituting a typical landslide-prone geological setting [7].
Mountain landslides pose severe threats to human lives and property [8,9,10,11,12]. A representative catastrophic case is the Baige landslide in the adjacent region, which triggered two river-blockage events and forced the relocation of more than 100,000 residents. Characterized by intensive engineering activities, the Batang reach lacks systematic landslide monitoring datasets to date. Insufficient hazard identification and risk assessment capabilities further create prominent challenges for engineering safety and regional disaster prevention and mitigation [13,14]. Analyses of severe landslide disasters demonstrate that these slope failures mostly occur at high elevations and feature strong concealment, making potential instability difficult to capture through conventional field geological surveys [15,16,17]. Landslide monitoring is undergoing a transition from ground-based point measurements to large-area observation supported by remote sensing techniques [18,19]. Traditional monitoring equipment, including inclinometers, GPS receivers, total stations and strain gauges, is capable of delivering sub-millimeter precision at known hazard sites. However, the deployment of these instruments relies on prior recognition of landslide locations [20,21]. Restricted by steep terrain and poor accessibility in deep-incised mountain gorges, such methods can hardly realize continuous spatial coverage, leading to an obvious trade-off between monitoring cost and operational efficiency [22]. In contrast, optical remote sensing can rapidly delineate pre-existing landslide geomorphology based on spectral and textural differences, yet it cannot effectively detect slow-moving landslides with annual displacements lower than 10 mm [23].
Leveraging active microwave coherent measurement, InSAR technology enables all-weather, round-the-clock observation with broad spatial coverage [24,25,26]. Persistent Scatterer InSAR (PS-InSAR) and Small Baseline Subset InSAR (SBAS-InSAR) are two mature InSAR approaches that have been extensively adopted for systematic monitoring of slow-moving landslides in recent years [27,28,29,30]. PS-InSAR extracts millimeter-level deformation measurements depending on long-term stable persistent scatterers, and it works well for artificial infrastructures and exposed bedrock. By comparison, SBAS-InSAR reduces spatiotemporal decorrelation using short-baseline interferogram combinations and can obtain denser monitoring points in vegetated areas and highly fractured rock masses [31,32,33,34,35,36]. To identify the optimal InSAR scheme suited to the high-mountain deep-canyon environment of the Batang reach, we implemented PS-InSAR and SBAS-InSAR algorithms in parallel using the same SAR dataset. A systematic comparison was carried out from four dimensions: monitoring point density, spatial continuity, coherence preservation, and deformation signal-to-noise ratio. The results reveal that SBAS-InSAR exhibits superior performance within altered ophiolite zones covered by dense vegetation and dominated by fragmented rock. Therefore, subsequent deformation extraction in this study is conducted based on SBAS-InSAR results.
To address the challenges posed by the high-mountain, deep-canyon terrain and significant geometric distortions in the Batang reach, we adopt a combined analysis approach centered on SBAS time-series InSAR, supplemented by PS point constraint calibration. Ascending and descending SAR datasets are processed independently, and their d]derived deformation results are integrated for comparative analysis. By evaluating the complementary advantages of slope aspect and viewing angle responses between two orbits, the defects of single-sided observation shadows and occlusions are compensated for, and continuous and high-precision surface displacement information is obtained. On this basis, we systematically characterize the regional topography, fault framework, lithological distribution, and spatial extent of altered ophiolite belts, and quantify the spatiotemporal intensity of human engineering activities (e.g., road cutting and dam site excavation). We further develop a technical framework that integrates optical remote sensing for landslide boundary interpretation with separately generated ascending and descending SBAS/PS-InSAR deformation results, enabling the automatic identification of potential landslide hazards and the concurrent quantification of millimeter-scale surface displacements. This framework provides a replicable scientific basis for ensuring the safety of major infrastructure corridors (e.g., the Sichuan–Tibet Railway) and supporting regional disaster prevention and mitigation efforts.

2. Materials

2.1. Study Area

The study area is situated in Batang County, Garzê Tibetan Autonomous Prefecture, Sichuan Province, China, within the upper reaches of the Jinsha River (geographic coordinates: 99°00′–99°30′E, 29°00′–30°00′N). It stretches northward from Suwalong Township (the Suwalong Hydropower Station reservoir area) to Diwu Town in the south along both banks of the Jinsha River, with a total length of approximately 80 km and a total area of 1408 km2 (Figure 1a) [1,2]. This area lies on the eastern margin of the Qinghai–Xizang (Tibetan) Plateau and within the core of the Jinsha River Tectonic Suture Zone. It is bounded to the north by the Batang Fault and adjoins the Sichuan–Tibet transportation corridor, with a branch line of the G318 National Highway running through the study area. Geomorphologically, the study area is characterized by a deeply incised high-mountain and deep-canyon landform. The mainstream of the Jinsha River forms a V-shaped valley in this reach, with bank slopes having a dip angle of 30° to 60° and a relative relief of 1500–2000 m. The climate is a subtropical warm and dry river valley climate, with an average annual precipitation of 350–450 mm, concentrated in the rainy season from May to September. The maximum hourly rainfall intensity can reach more than 20 mm. Above an elevation of 3800 m, the freeze–thaw cycle persists for 6–7 months annually, exerting additional weathering stress on the slope masses. The dominant lithologies are altered ophiolite, Triassic sandstone, slate, and phyllite (Figure 1b), which cover approximately 60% of the study area and are pervasively affected by clayey alteration. Tectonically, the study area spans the Jinsha River Suture Zone, the tectonic boundary between the Qiangtang and Songpan–Ganzi terranes. It is tectonically compressed by the NE-striking Batang right-lateral strike-slip fault (slip rate: 2–4 mm/yr) and the NW-striking Deqin–Zhongdian–Daju right-lateral strike-slip fault (slip rate: 5–7 mm/yr), forming a 5–10-km-wide structural fracture zone. Valley slopes on both banks fall within the influence of these faults, rendering this reach a high-hazard zone for landslides and other geohazards [1].
The 2021 Mw 5.8 Batang Earthquake (epicenter ~20 km northwest of Suwalong) and the 1870 M 7¼ Batang Earthquake both had a recorded peak ground acceleration (PGA) exceeding 0.25 g [37]. Since 1970, six earthquakes with Mw ≥ 5 have occurred within a 50 km radius of the study area, which has continuously degraded slope mass strength and made this reach one of the most landslide-prone and hazardous sections in the upper Jinsha River [38].
Under the combined influence of the aforementioned topography, tectonics, lithology, and seismic dynamics, the Batang reach has developed a unique environmental system characterized by the coexistence of steep slopes, unconsolidated and highly fractured rock masses, and intense external dynamic perturbations, which provide continuous energy and boundary conditions for the initiation, reactivation, and cascading failure of landslides. Accurately delineating their spatial distribution and capturing millimeter-scale creep signals are essential prerequisites for ensuring the long-term safety of the under-construction Sichuan–Tibet Railway corridor and supporting regional disaster prevention and mitigation, as well as the fundamental rationale for conducting comparative monitoring of ascending- and descending-track SBAS/PS-InSAR in this study.

2.2. Datasets

This study fuses multi-source spatial datasets to realize high-precision deformation monitoring and landslide boundary identification for the high-mountain and deep-canyon terrain of the Jinsha River Batang reach (Suwalong–Changbo–Diwu). The core dataset consists of C-band (λ = 5.6 cm) Interferometric Wide-Swath (IW) images acquired by the European Space Agency (ESA) Sentinel-1A satellite from January 2024 to January 2026, with a total of 212 Single Look Complex (SLC) images. Of these, 98 ascending-track images (Relative Orbit No. 99) and 114 descending-track images (Relative Orbit No. 33) feature a 12-day revisit cycle, with incidence angles ranging from 36.2° to 40.1° and vertical single polarization (VV). These dual-orbit datasets were processed independently for PS-InSAR and SBAS-InSAR time-series inversion, and their derived LOS deformation results were further integrated for complementary analysis (Table 1).
It should be clarified that the values of 98 and 114 refer to the total number of independent SLC image frames downloaded for each orbit track. For the ascending orbit (Relative Orbit Path 99), the acquired frames cover Frame IDs 88 and 93, with a total of 98 individual SLC scenes. For the descending orbit (Relative Orbit Path 33), the frames span Frame IDs 492 and 497, containing 114 separate SLC scenes. The Sentinel-1 IW mode has a wide along-track coverage, leading to partial spatial overlap between frames with different IDs but identical acquisition dates within the same orbit. All frames of each track were mosaicked in ENVI 5.6 (64-bit) software to eliminate overlapping redundant regions. After mosaicking, we retained unique acquisition dates that fully cover the entire Batang study area: 49 non-repetitive temporal phases for the ascending dataset and 57 for the descending dataset, which is consistent with the 49 acquisition nodes (indexed from 0 to 48) shown in the ascending spatiotemporal baseline network.
Topographic phase removal was performed using ALOS World 3D-30m (provided free of charge by the Japan Aerospace Exploration Agency, JAXA), which effectively mitigates topographic-related phase errors in the high-relief canyon terrain and enhances the signal-to-noise ratio (SNR) of the deformation measurements [39]. Landslide boundary identification incorporated 0.5-m-resolution Google Earth optical imagery from 2023 to 2025; initial regions of interest (ROIs) were generated via the interpretation of tonal, textural, and geomorphic features, and these were cross-validated with the InSAR-derived deformation results. Finally, two field surveys were carried out in July 2024 and April 2025 across 38 typical landslides, utilizing handheld GNSS and unmanned aerial vehicle (UAV) (DJI Mavic 3 Enterprise) photogrammetry to validate their displacement characteristics and boundary extents, thus ensuring the reliability of the overall monitoring results.

3. Methodology

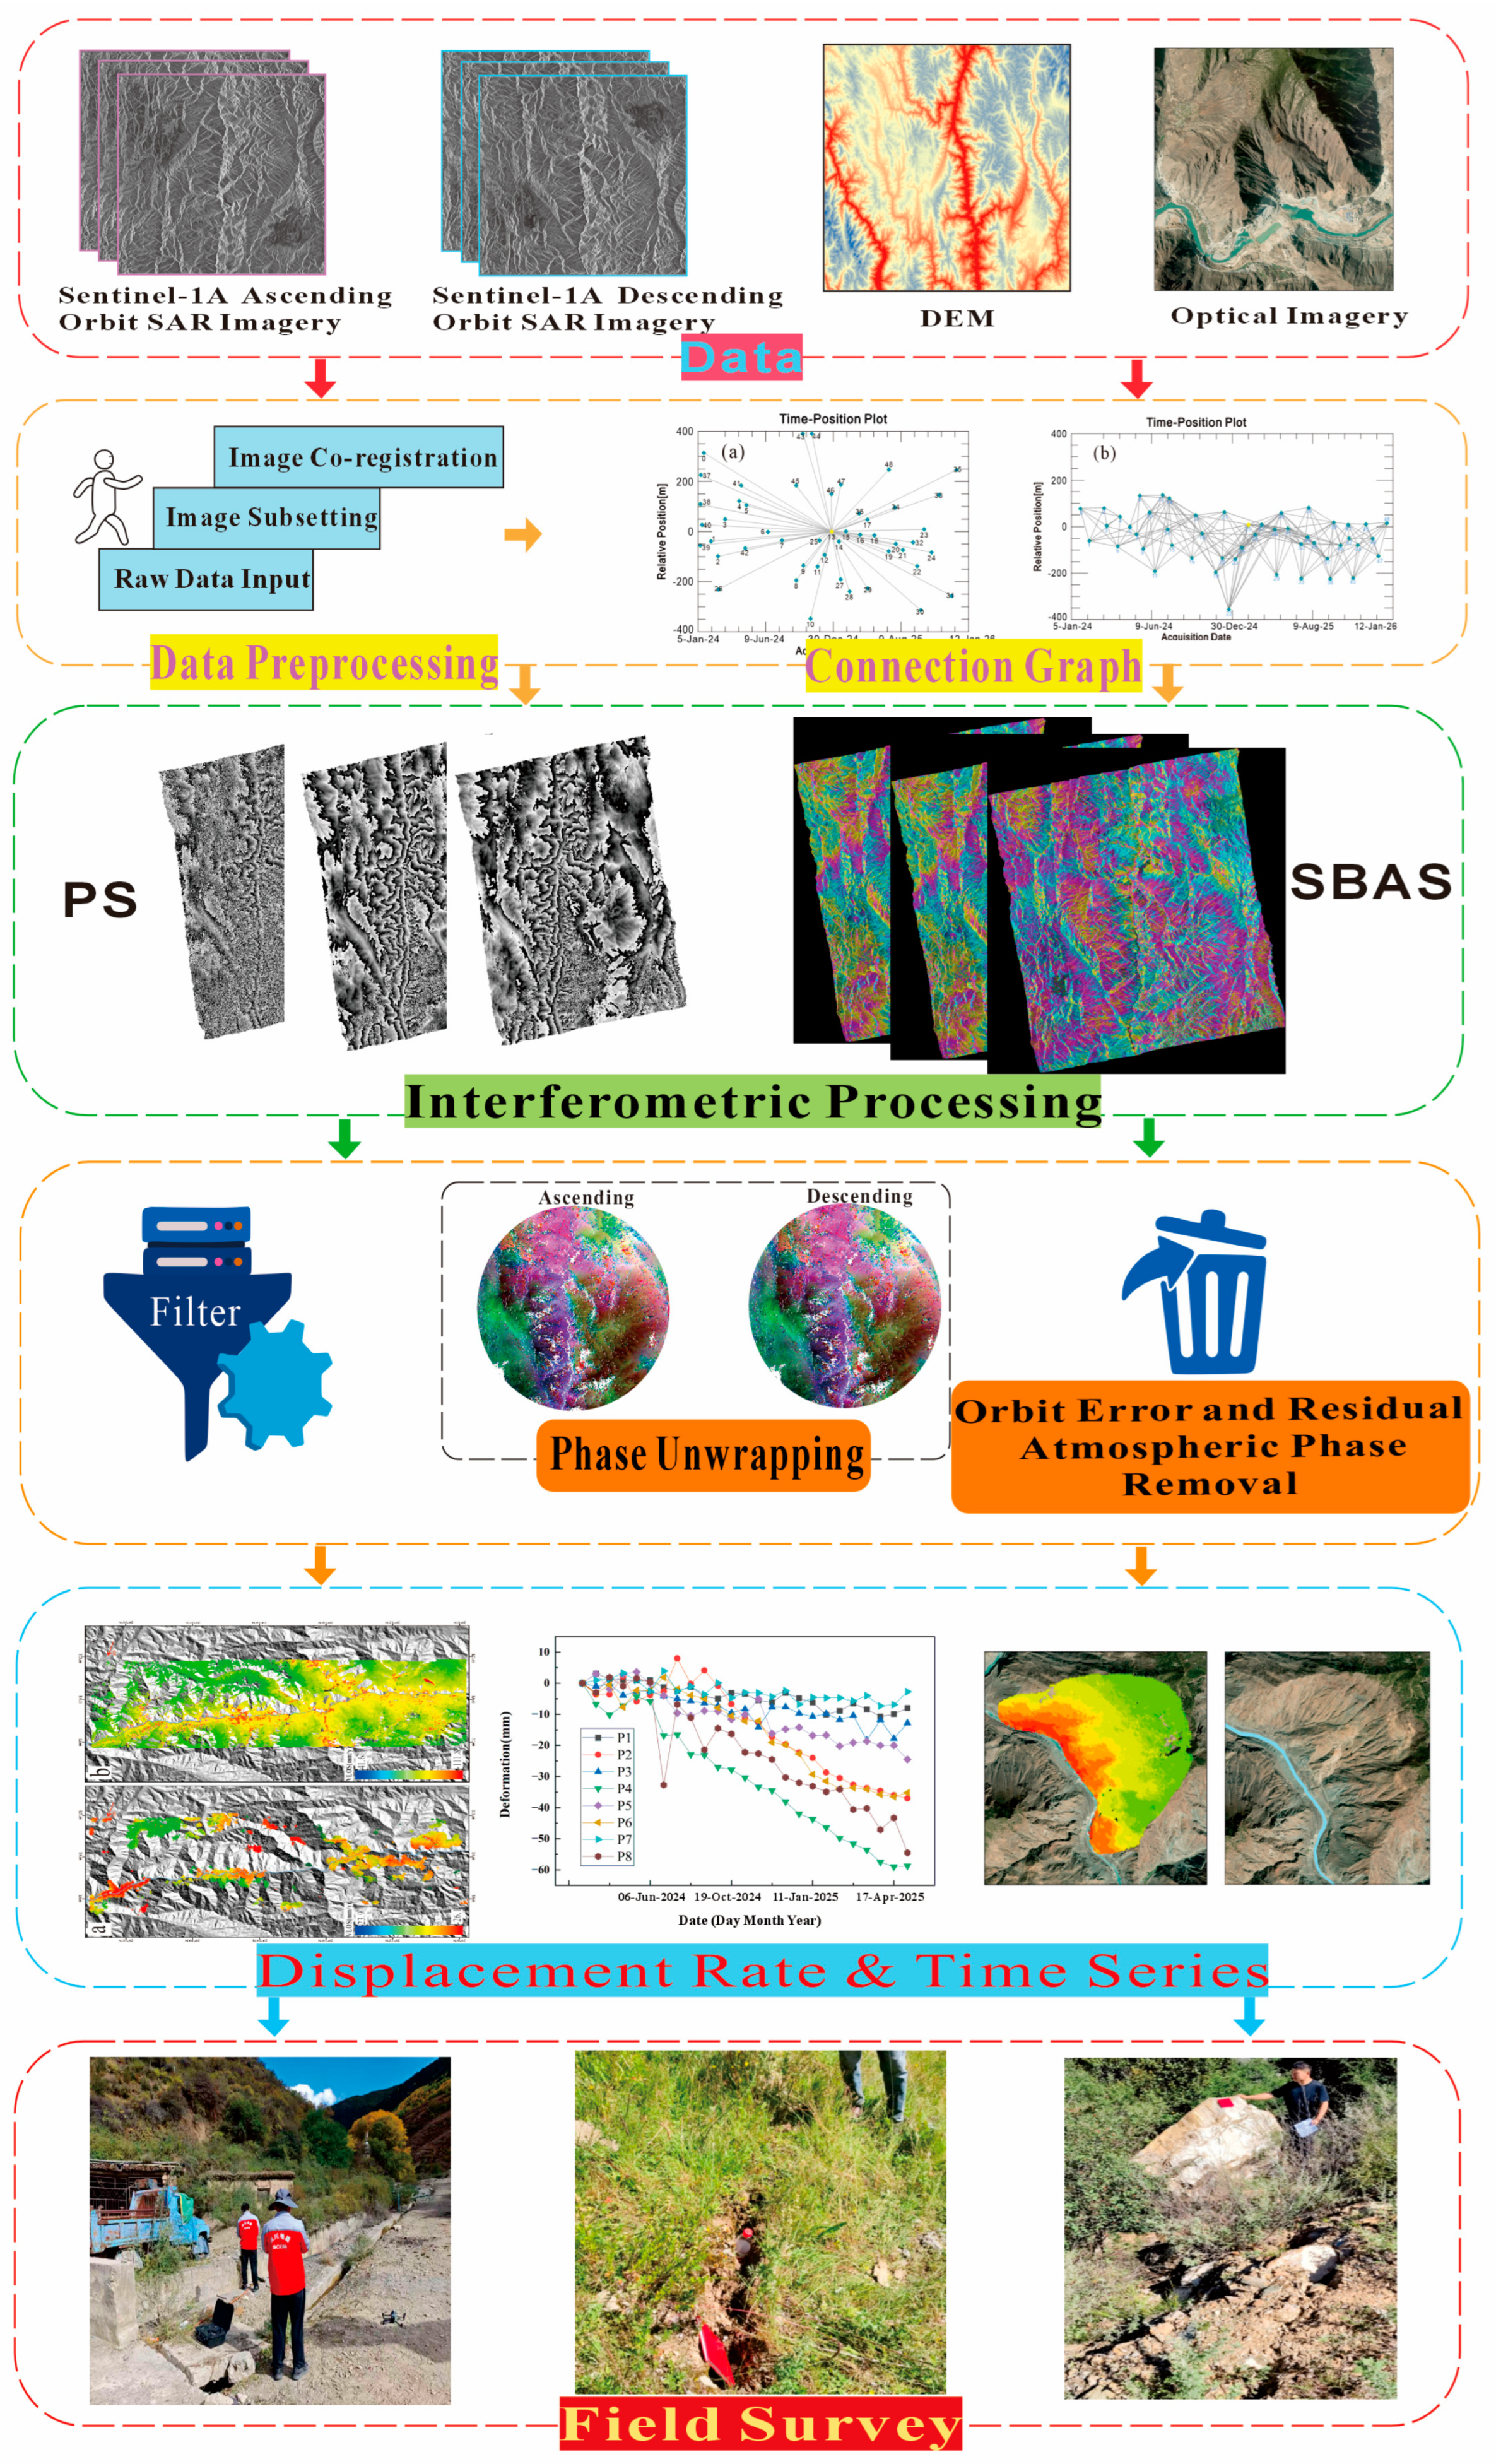
The methodological workflow adopted in this study is illustrated in Figure 2. Multi-source datasets (ascending/descending Sentinel-1A SAR imagery, DEM and optical images) are preprocessed separately for independent PS-InSAR and SBAS-InSAR calculations on each orbit. Persistent scatterer points identified by PS-InSAR are used to optimize SBAS-InSAR inversion. Deformation results from ascending-orbit PS-InSAR and SBAS-InSAR are compared, and the optimized SBAS-InSAR method is further applied to descending-orbit data. Finally, field surveys verify the InSAR-derived deformation.

3.1. PS-InSAR Processing

After importing the original Sentinel-1A ascending-orbit SAR images, basic preprocessing containing orbit correction and radiometric calibration was conducted to improve overall data quality and precision. Among all 98 SAR scenes, the image captured on 24 November 2024 was chosen as the super master image. This master scene owns favorable geometric matching conditions with all slave images and holds high overall coherence [40].
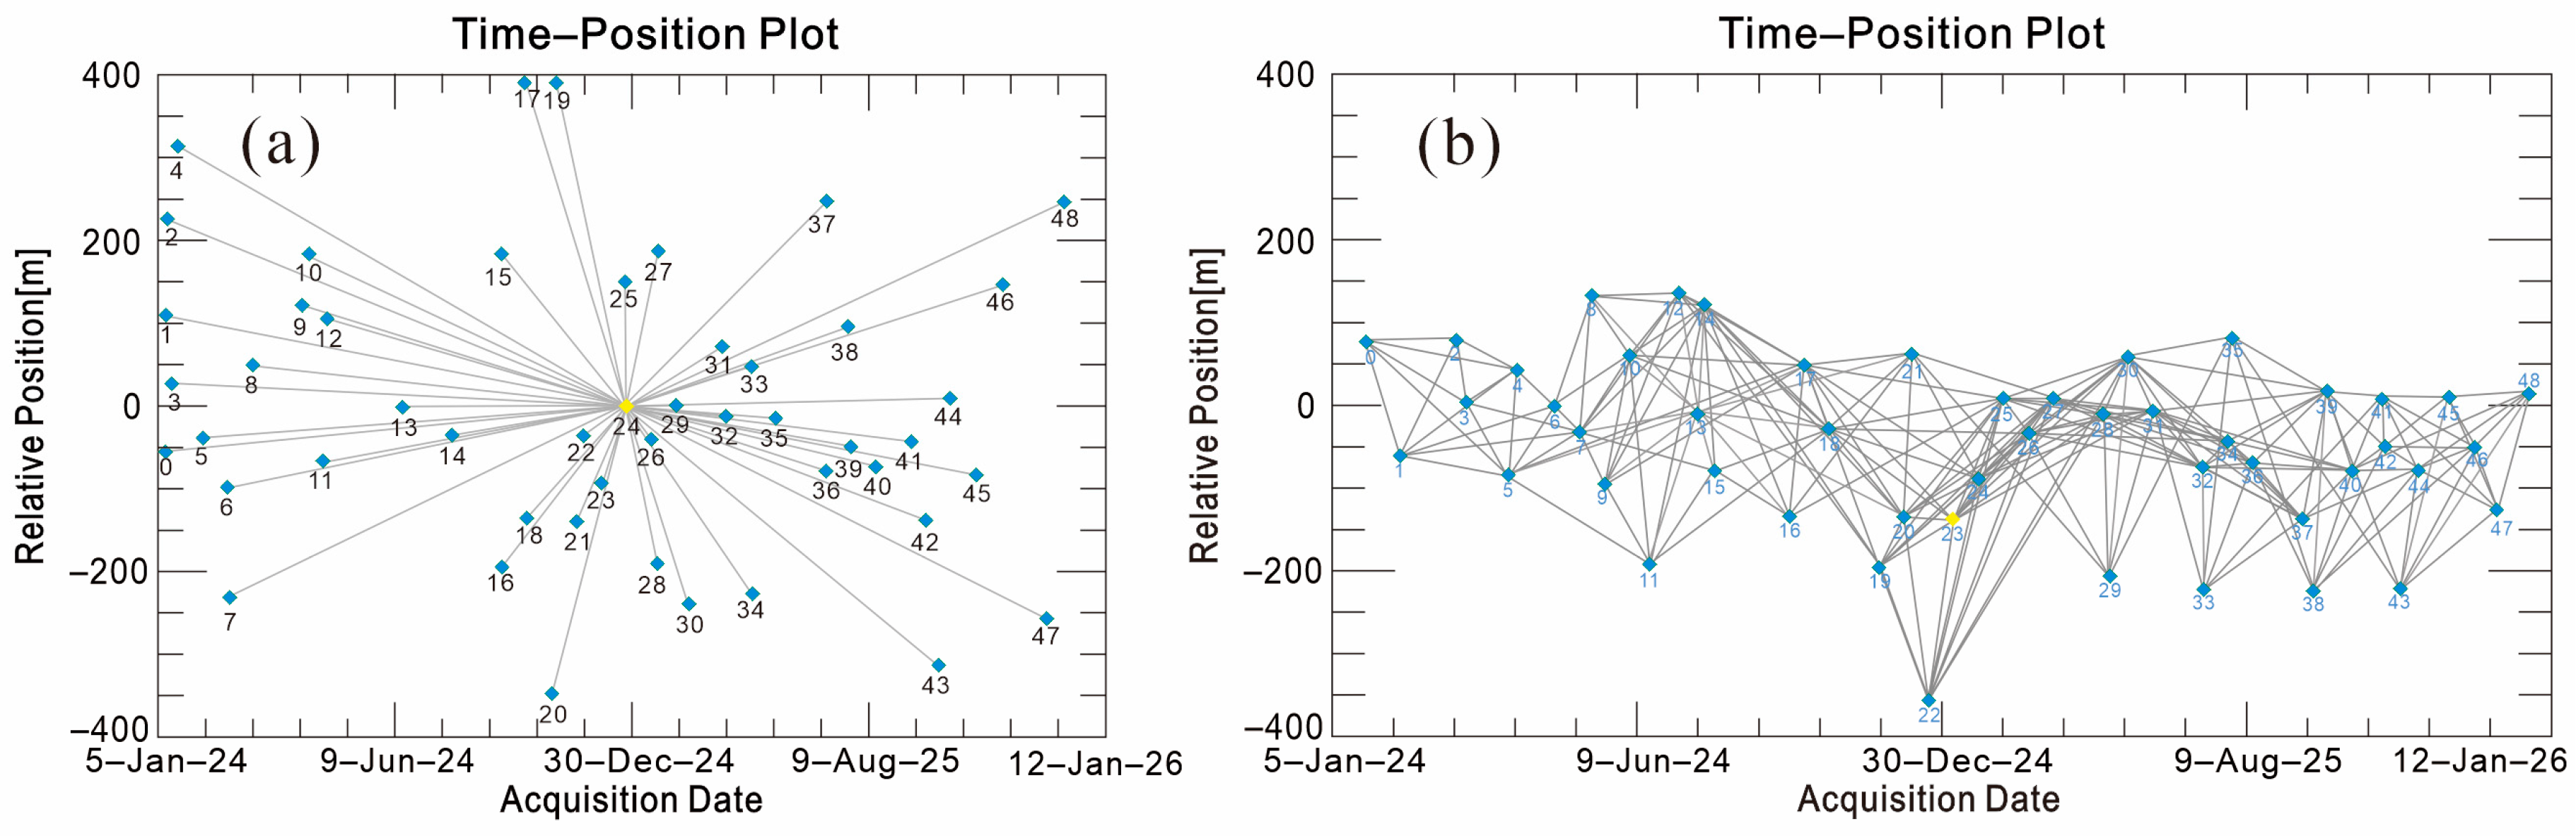
After co-registration of master and slave images, multi-temporal interferograms were generated (Figure 3a). Multi-looking with 6 range looks and 1 azimuth look was implemented, generating a final geocoded pixel size of 15 m × 15 m (rounded from the native multi-looked resolution of 13.8 m × 14.1 m). Adaptive spatial filtering with a 24 × 24 pixel window was applied to reduce phase noise. Phase unwrapping of PS interferograms adopted the Delaunay minimum cost flow method. Several stable bedrock PS points outside landslide and fault zones were selected as the unified deformation reference. PS points with deformation velocity beyond three times the standard deviation were removed as abnormal outliers. The interferograms record phase differences between SAR acquisitions at different times, which carry surface displacement information. Interferometric coherence acts as a key index for screening high-quality interferometric pairs and potential PS candidates [41]. Combined with local terrain features and previous regional research, this study set the coherence threshold to 0.85 and the amplitude dispersion threshold to 3.5 for PS identification [42].
The interferometric phase at each PS target can be decomposed into five physical components: surface deformation phase, topographic residual phase, atmospheric delay phase, orbital error phase, and random residual phase. The quantitative expression is written as:
φ PS = φ def + φ topo + φ atm + φ orbit + φ residual  
where φ PS is the total interferometric phase of PS pixels; φ def represents deformation phase; φ topo is residual topographic phase; φ atm denotes atmospheric phase screen; φ orbit stands for orbital error phase; φ residual refers to random noise and other residual phase signals.
A linear time-series model was adopted to invert the LOS deformation rate from the deformation component of the PS phase:
φ def = 4 π λ v LOS t
where λ is the wavelength of Sentinel-1A sensor; v LOS is line-of-sight deformation rate; t corresponds to the time span of SAR observation.
We calculated deformation rate, cumulative displacement and coherence parameters from interferometric phases. Stable persistent scatterer (PS) points were finalized by threshold screening of coherence and amplitude dispersion [43]. Persistent scatterers refer to ground targets with stable radar backscattering performance, which can supply continuous high-quality phase observations. PS points are mostly distributed on artificial constructions such as buildings and stable natural geomorphic surfaces [44,45].
After PS point extraction, network-based phase inversion was implemented. The final time-series displacement products and annual LOS velocity maps (Figure 2) provide fundamental data for analyzing the spatial-temporal deformation patterns of the landslide area. In addition, the reliable LOS velocity values of overlapping PS points are reserved as constraint benchmarks for subsequent SBAS-InSAR optimization.

3.2. SBAS-InSAR Processing

The SBAS-InSAR technique was utilized to perform time-series deformation analysis on 98 preprocessed ascending Sentinel-1A scenes to retrieve surface deformation information. First, the SBAS processing chain within ENVI SARscape was adopted to build a connection graph for organizing SAR acquisitions and constructing high-quality interferometric pairs. In this study, the maximum spatial baseline was limited to 10% of the critical baseline, the minimum temporal baseline was set to 12 days (consistent with the Sentinel-1A revisit cycle), and the maximum temporal baseline was restricted to 96 days. Based on these thresholds, a total of 564 valid interferometric pairs were selected, while 276 pairs were discarded due to excessive spatial/temporal baselines or large Doppler centroid differences [46].
Subsequently, differential interferometric processing was implemented to generate interferograms (Figure 3b), with the image acquired on 12 November 2024 defined as the super master image for uniform co-registration of all slave scenes. Multi-looking was conducted with 6 range looks and 1 azimuth look, resulting in a final ground pixel size of 15 m × 15 m (rounded from the native multi-looked resolution of 13.8 m × 14.1 m). Goldstein adaptive filtering with a 32 × 32 pixel window and a filtering coefficient of 0.6 was implemented for speckle and fringe phase processing [47]. Phase unwrapping was conducted using the Delaunay minimum cost flow (MCF) method with a coherence threshold of 0.35, which unwraps high-coherence pixels based on Delaunay triangular grids [48,49]. Stable bedrock points outside landslide and fault zones, consistent with the reference points used for PS-InSAR, were selected as the unified deformation reference. Pixels with deformation rates exceeding three times the standard deviation were identified as outliers and excluded.
After filtering and quality inspection, connection graph editing was carried out to exclude pairs contaminated by residual orbital errors [23]. Finally, geocoding was performed with unified thresholds for elevation consistency (1000 m), deformation consistency (9 mm), and atmospheric coherence (0.1), yielding the final LOS deformation rate raster dataset in geographic coordinates [50].
Different from PS-InSAR, which relies on stable single-point phase time series, SBAS-InSAR retrieves surface deformation by constructing dense multi-temporal interferometric pairs and solving an overdetermined observation system. This method suppresses temporal decorrelation errors through short temporal baselines and obtains continuous time-series deformation based on singular value decomposition (SVD). The linear quantitative relationship between deformation phase, LOS deformation rate, and cumulative displacement is defined as:
φ def = 4 π λ v LOS · t , d LOS = λ 4 π φ def  
where λ is the wavelength of the Sentinel-1A sensor, v LOS represents the average line-of-sight deformation rate, and t is the time interval of SAR observations. In SBAS-InSAR, numerous interferometric pairs are constructed to establish an overdetermined observation matrix, and the singular value decomposition (SVD) least-squares algorithm is applied to solve the time-series deformation and stabilize the inversion results.
Although the SVD least-squares algorithm can solve the overdetermined observation matrix for time-series deformation, conventional SBAS-InSAR inversion is still susceptible to temporal decorrelation and atmospheric residuals, which tend to induce minor systematic deviations in deformation results. To mitigate such limitations, this study adopts a classical and widely recognized optimization strategy, introducing stable high-precision PS point benchmarks obtained from PS-InSAR to assist and improve the SBAS inversion performance.
Stable permanent scatterers (PS) used as calibration benchmarks were screened from PS-InSAR outputs via multi-threshold discrimination to exclude unstable scatterers affected by vegetation, seasonal surface fluctuation and slope creep. Referring to the multi-criteria PS screening strategy adopted in previous landslide InSAR research, three screening criteria were simultaneously applied for ascending and descending datasets separately:
(1)
Amplitude dispersion index ≤ 3.5;
(2)
Temporal average interferometric coherence ≥ 0.85;
(3)
LOS annual deformation velocity limited to the range of −1 mm/yr ~ 1 mm/yr.
Only PS scatterers satisfying all three thresholds and distributed on intact bedrock outside landslide and fault boundaries were retained as stable control points.
The complete PS-constrained calibration workflow is divided into three standardized steps:
Step 1: Spatial matching of PS points and SBAS raster pixels. We extract geographic coordinates of all stable PS scatterers derived from PS-InSAR results, and search SBAS raster pixels within a 15 m radius of each PS point. Only pixels with one-to-one spatial overlap between PS measurement points and SBAS grid units are retained as valid control pairs to build constraints. Matching operations are implemented independently for ascending and descending datasets without mixing two orbit measurements.
Step 2: Embed PS residual constraint as a regularization term into SBAS SVD solving system. The original SBAS inversion only solves phase observations based on interferometric pairs. We add the velocity residual term in Equation (4) as a soft regularization constraint to the diagonal of the SBAS observation matrix, which limits the deviation between SBAS inverted velocity and high-stable PS reference velocity during iterative least-squares solving.
Step 3: Separate calibration for ascending and descending data. PS points extracted from ascending PS-InSAR results only calibrate ascending SBAS deformation raster; descending PS scatterers are used exclusively to correct descending SBAS results. The two orbit datasets are processed independently without unified joint solving.
Spatially overlapping PS and SBAS pixels within the landslide area are matched to construct a residual minimization constraint, which helps alleviate the overall calculation deviation of SBAS inversion. The corresponding mathematical optimization formula is expressed as follows:
min k = 1 n v SBAS x k , y k v PS x k , y k 2
where v PS x k , y k refers to the LOS deformation rate of the k-th high-precision PS control point, v SBAS x k , y k represents the original unconstrained SBAS deformation rate at the corresponding pixel, and n is the total number of valid overlapping control points. This constraint moderately reduces the residual deviation between SBAS inversion results and PS reference measurements during the solving process, which contributes to improving the relative stability and reliability of SBAS time-series deformation retrieval to a certain extent.

3.3. Slope-Oriented Deformation Rate Decomposition

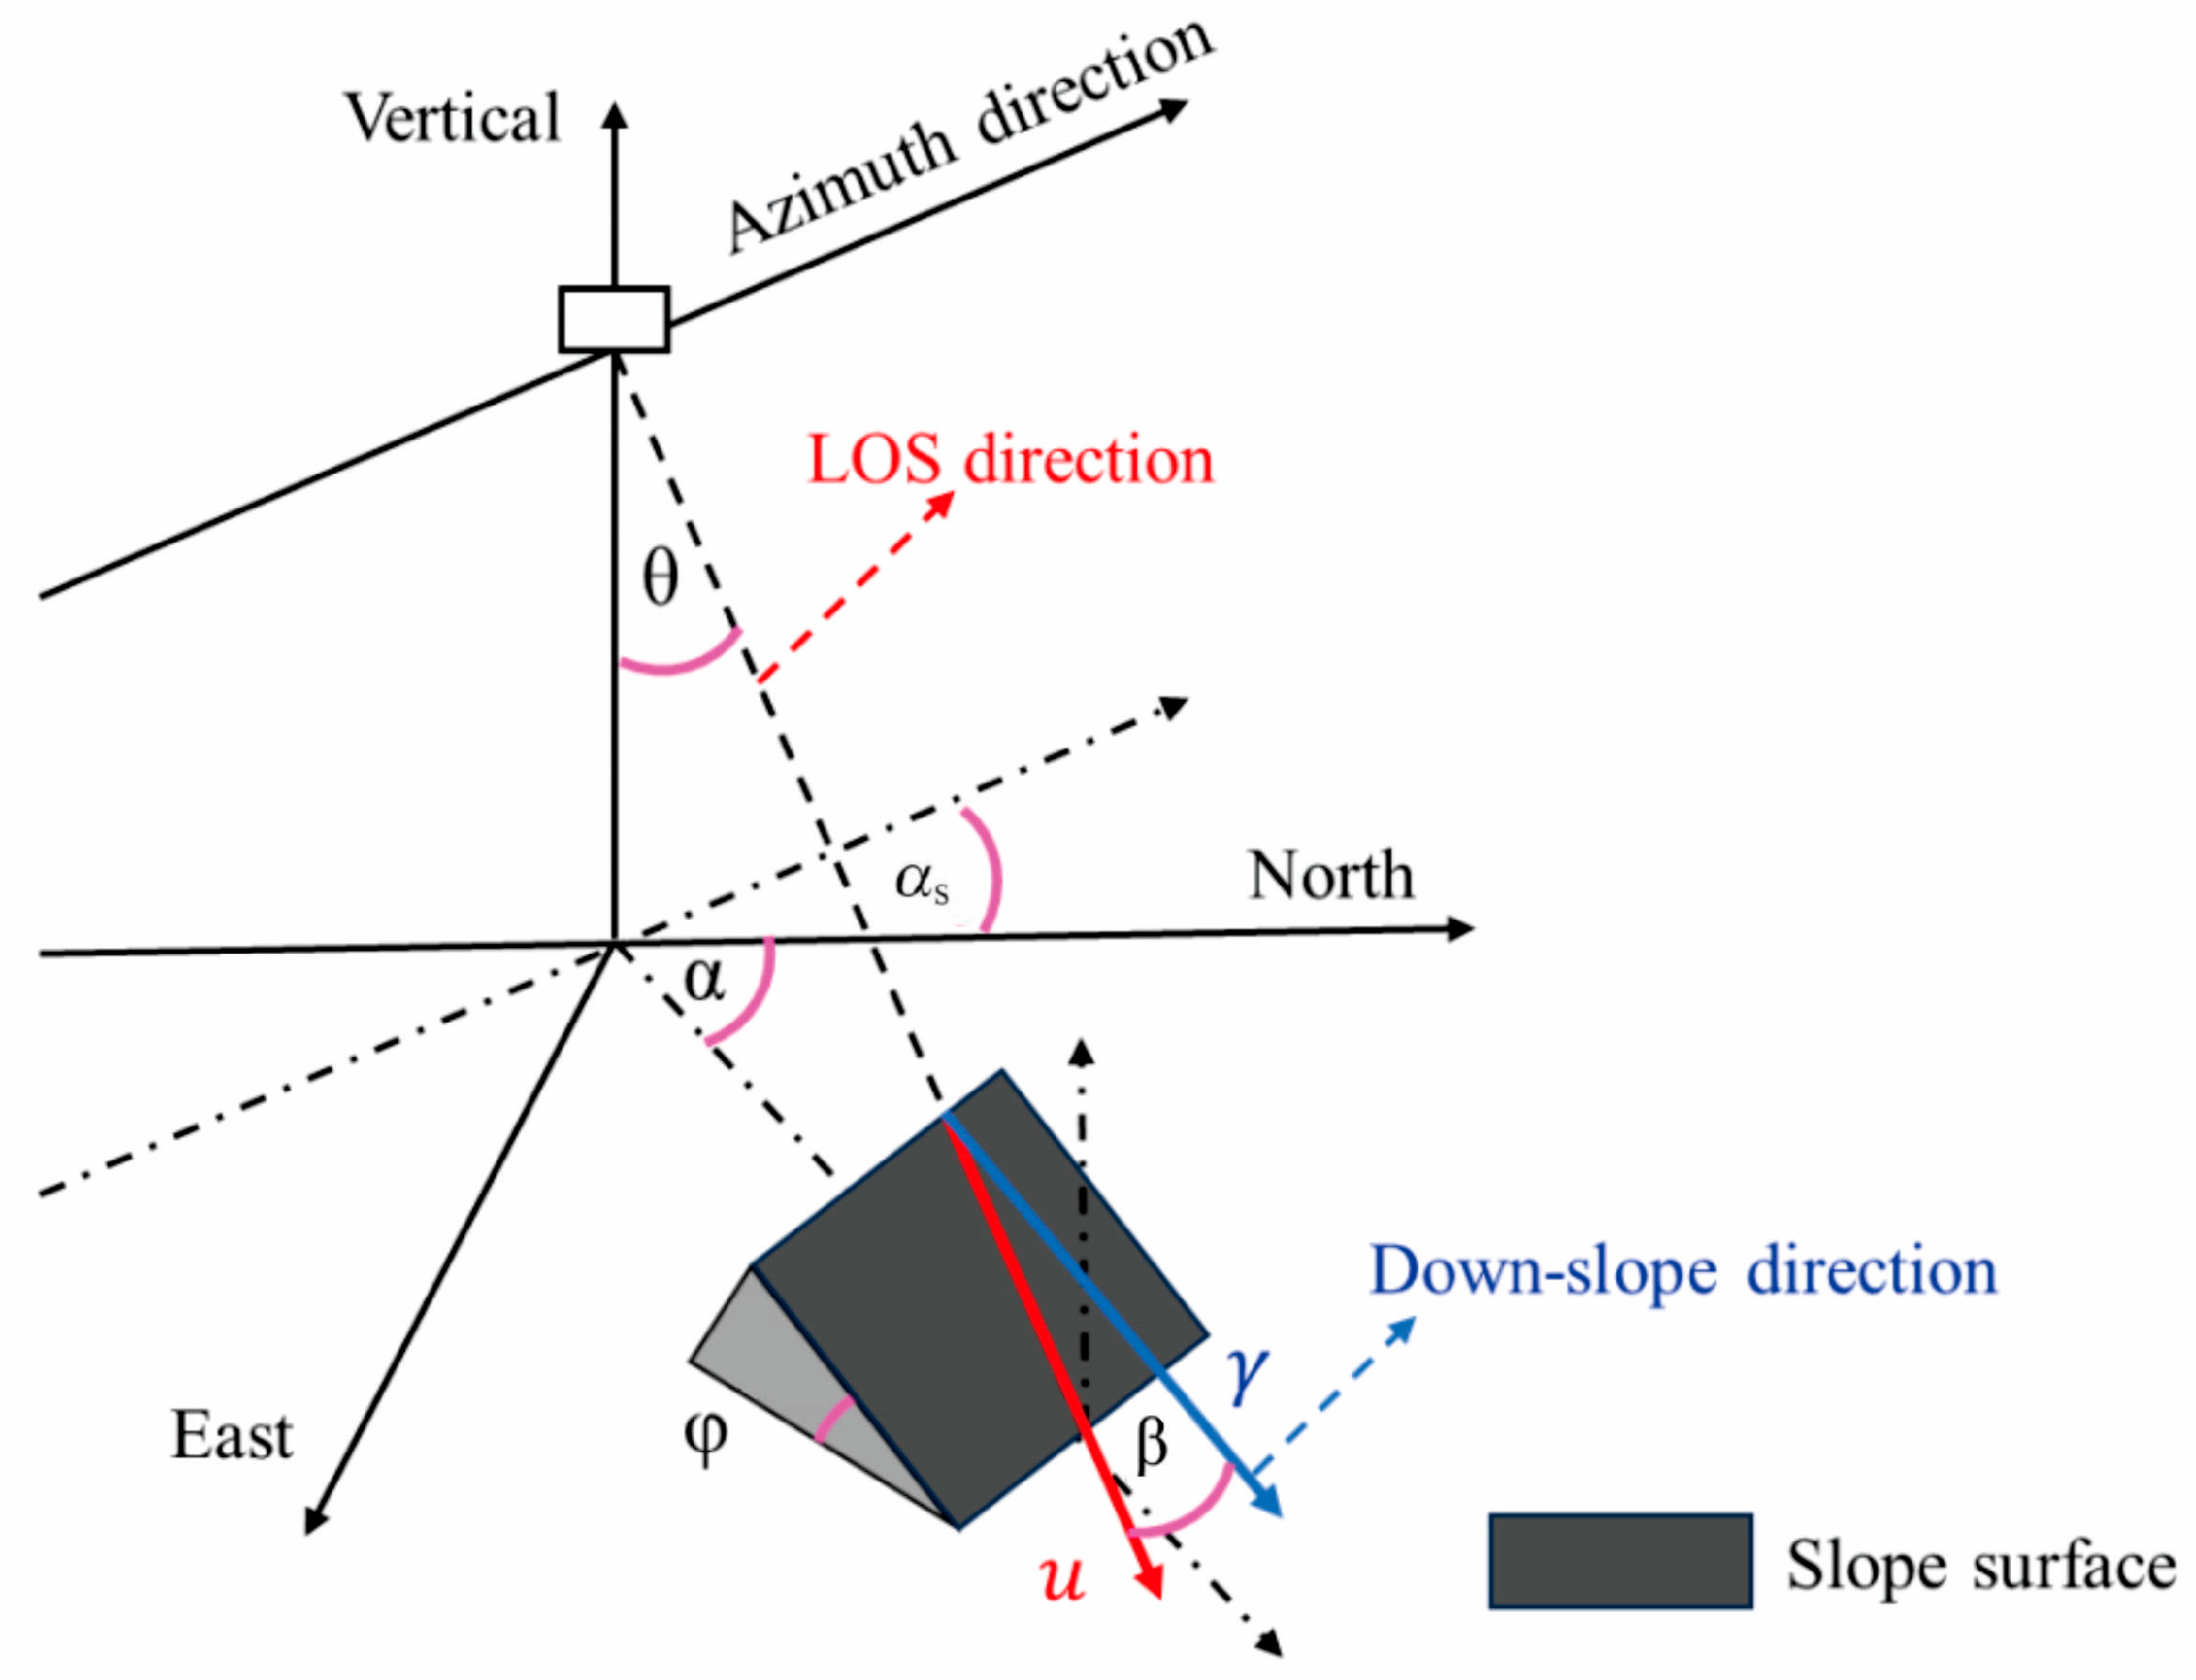
Surface deformation results derived from SBAS-InSAR have inherent limitations when analyzing landslide movement patterns, as they cannot accurately characterize the actual motion of landslides. Most landslides dominantly move downslope along the gradient direction. Therefore, converting line-of-sight (LOS) deformation values into slope-parallel deformation and vertical subsidence can better reflect the actual movement trend of landslides. It should be clarified that the geometric conversion below is performed separately on ascending and descending deformation datasets. Ascending and descending deformation results are only adopted for complementary comparative analysis of landslide movement characteristics, without multi-orbit joint inversion. Based on the geometric relationship between radar imaging and slope aspect (Figure 4), this study assumes that the landslide moves along the unit motion vector u. Equations (1)–(4) are adopted to convert LOS deformation rates into slope-parallel and vertical deformation components:
u = sin α cos φ cos α cos φ sin φ
cos β = sin α cos φ sin θ cos α s + cos α cos φ sin θ cos α s + sin φ cos θ
V S = V L O S / cos β
V V = L L O S + V S sin θ cos δ α S 3 2 π cos θ
where V s is the deformation rate parallel to the slope gradient; V L O S denotes the deformation rate along the radar line of sight; V v represents the vertical deformation rate; α s refers to the angle between the satellite azimuth and true north; α s 3 π / 2 stands for the LOS direction along the satellite azimuth; δ is the satellite azimuth angle;   α denotes terrain slope aspect; β is the apparent slope angle; θ represents radar incidence angle; and φ is terrain slope gradient. All geometric correlations are illustrated in Figure 4.

4. Results

4.1. Optical Remote Sensing Interpretation Results

Landslides generally evolve from quantitative accumulation to qualitative transformation, undergoing four sequential stages: initiation, creep, shearing, and failure [51,52]. When slope geological masses enter the creep stage, this marks the onset of slope instability. During this stage, the landslide mass typically exhibits distinct and measurable deformation signs, including rear-edge tensile cracks, shear walls, bulging cracks, closed depressions, and landslide mounds; these characteristic geomorphic features are collectively termed landslide indicators [52]. In addition, alterations to slope-surface vegetation and building morphology induced by landslide movement, such as “drunken forests”, “scythe trees”, house tilting, and road cracking and displacement, can also serve as auxiliary indicators for remote sensing interpretation [53].
The high-resolution multispectral optical imagery adopted in this study is Maxar WorldView-2/3/4 satellite data, which can be browsed and exported via the Google Earth platform. The multi-temporal image mosaics covering the Batang reach were acquired from 2023 to 2025, with a maximum spatial resolution of 0.5 m (sub-meter level). The dataset contains four multispectral bands (blue, green, red and near-infrared) dedicated to landslide geomorphology interpretation. All WorldView mosaic products downloaded from Google Earth have been pre-processed with orthorectification and radiometric correction by Maxar, removing geometric distortions caused by terrain relief and illumination differences. The interpreted landslide outlines derived from optical imagery were cross-validated against multi-temporal InSAR deformation results to filter slopes without continuous displacement signals. Furthermore, time-series optical remote sensing imagery enables the tracking of spatiotemporal variations in landslide indicators and auxiliary indicators, yielding more intuitive and accurate interpretation results [52].
Old landslides and creep-prone active landslides typically exhibit distinct geomorphic features compared with surrounding stable slopes, featuring well-defined landslide boundaries that are commonly characterized by armchair-shaped, dustpan-shaped, tongue-shaped, or horseshoe-shaped geometries. These unique geomorphic features serve as critical indicators for landslide interpretation [54]. The sparse, low-lying vegetation distributed along both banks of the Jinsha River facilitates the implementation of optical remote sensing interpretation for landslides.
It is insufficient to classify potential hazards merely according to the proximity between landslides, rivers and buildings. Therefore, this study establishes unified multi-index semi-quantitative criteria to classify landslide hidden dangers, combining available data including landslide area, slope-parallel velocity V s , horizontal distance to rivers and buildings, landslide runout distance, and valley width of the Jinsha River. Specific judgment thresholds are defined as follows:
A slope is defined to have river-blocking potential only when all five conditions are simultaneously satisfied:
(1)
The shortest horizontal distance from the landslide boundary to the Jinsha River channel ≤ 200 m;
(2)
Landslide coverage area ≥ 0.5 km2;
(3)
The predicted landslide runout distance reaches the river water surface;
(4)
The valley width at the landslide bank is less than 250 m;
(5)
The maximum LOS deformation rate is < −10 mm/yr, which demonstrates continuous active creep deformation.
A slope is classified as having building-burial potential only when all three conditions are met simultaneously:
(1)
Residential buildings, traffic roads and hydropower engineering facilities lie within a horizontal distance of 150 m from the landslide boundary;
(2)
The simulated runout path of the landslide covers the concentrated building distribution zone;
(3)
The maximum LOS deformation rate < −10 mm/yr, verifying sustained slope displacement.
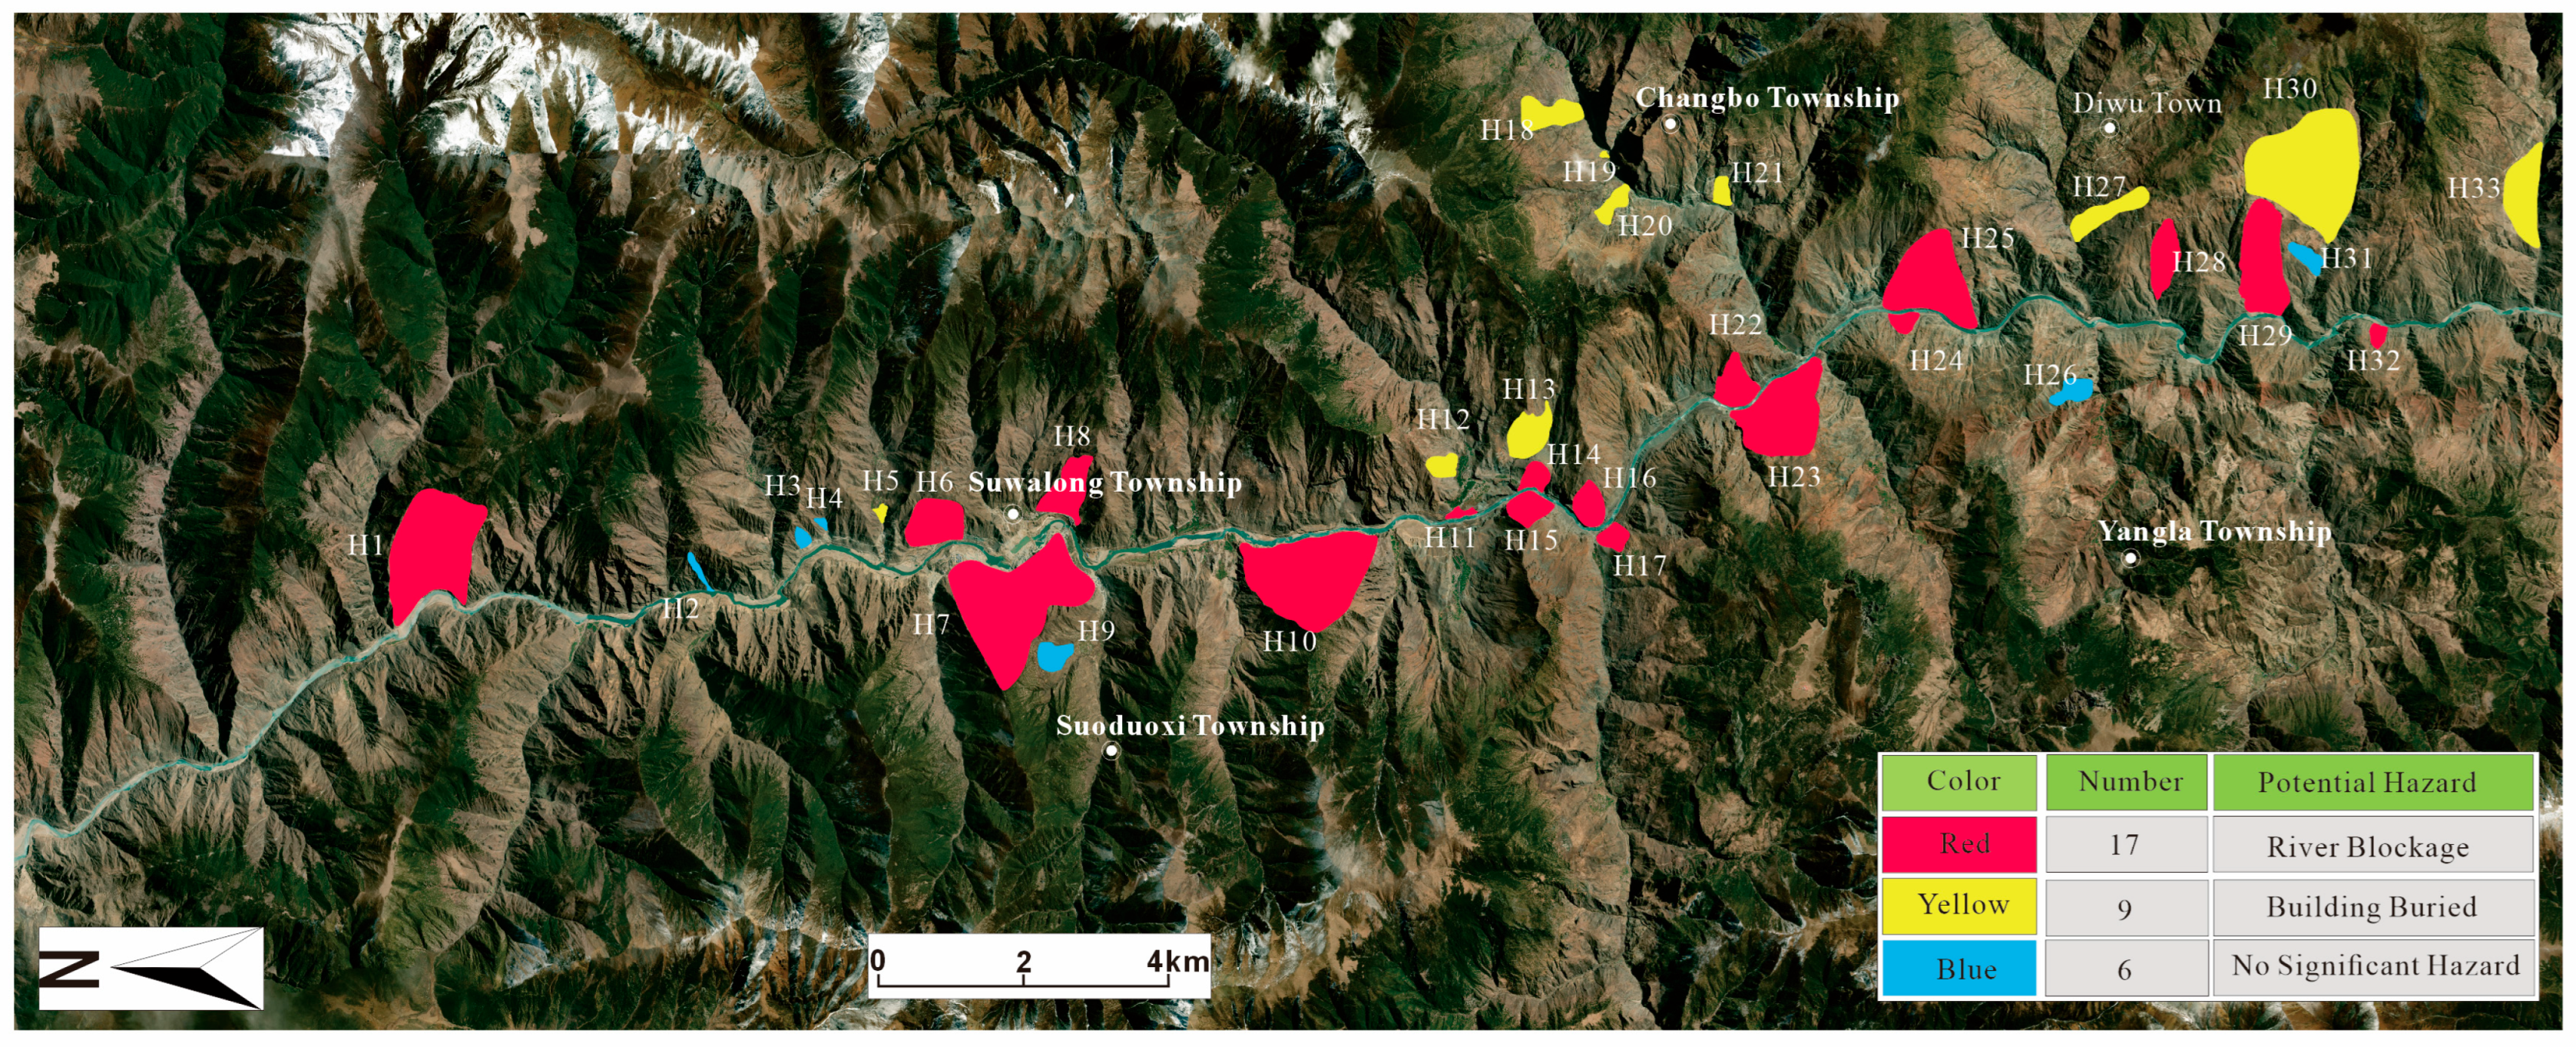
Due to limited field survey data, river discharge and landslide accumulation thickness are not incorporated into the evaluation framework. According to the above standardized thresholds, the 33 interpreted landslides are grouped into three categories: 17 landslides with river-blocking potential, 10 landslides with building-burial potential, and 6 landslides without obvious potential to cause economic losses or engineering damage after sliding (Figure 5). All basic attribute information and classification results of the 33 landslides are systematically summarized in Table 2.

4.2. Landslide Monitoring Based on InSAR Time Series

4.2.1. Comparison Between PS-InSAR and SBAS-InSAR Based on Ascending Orbit Data

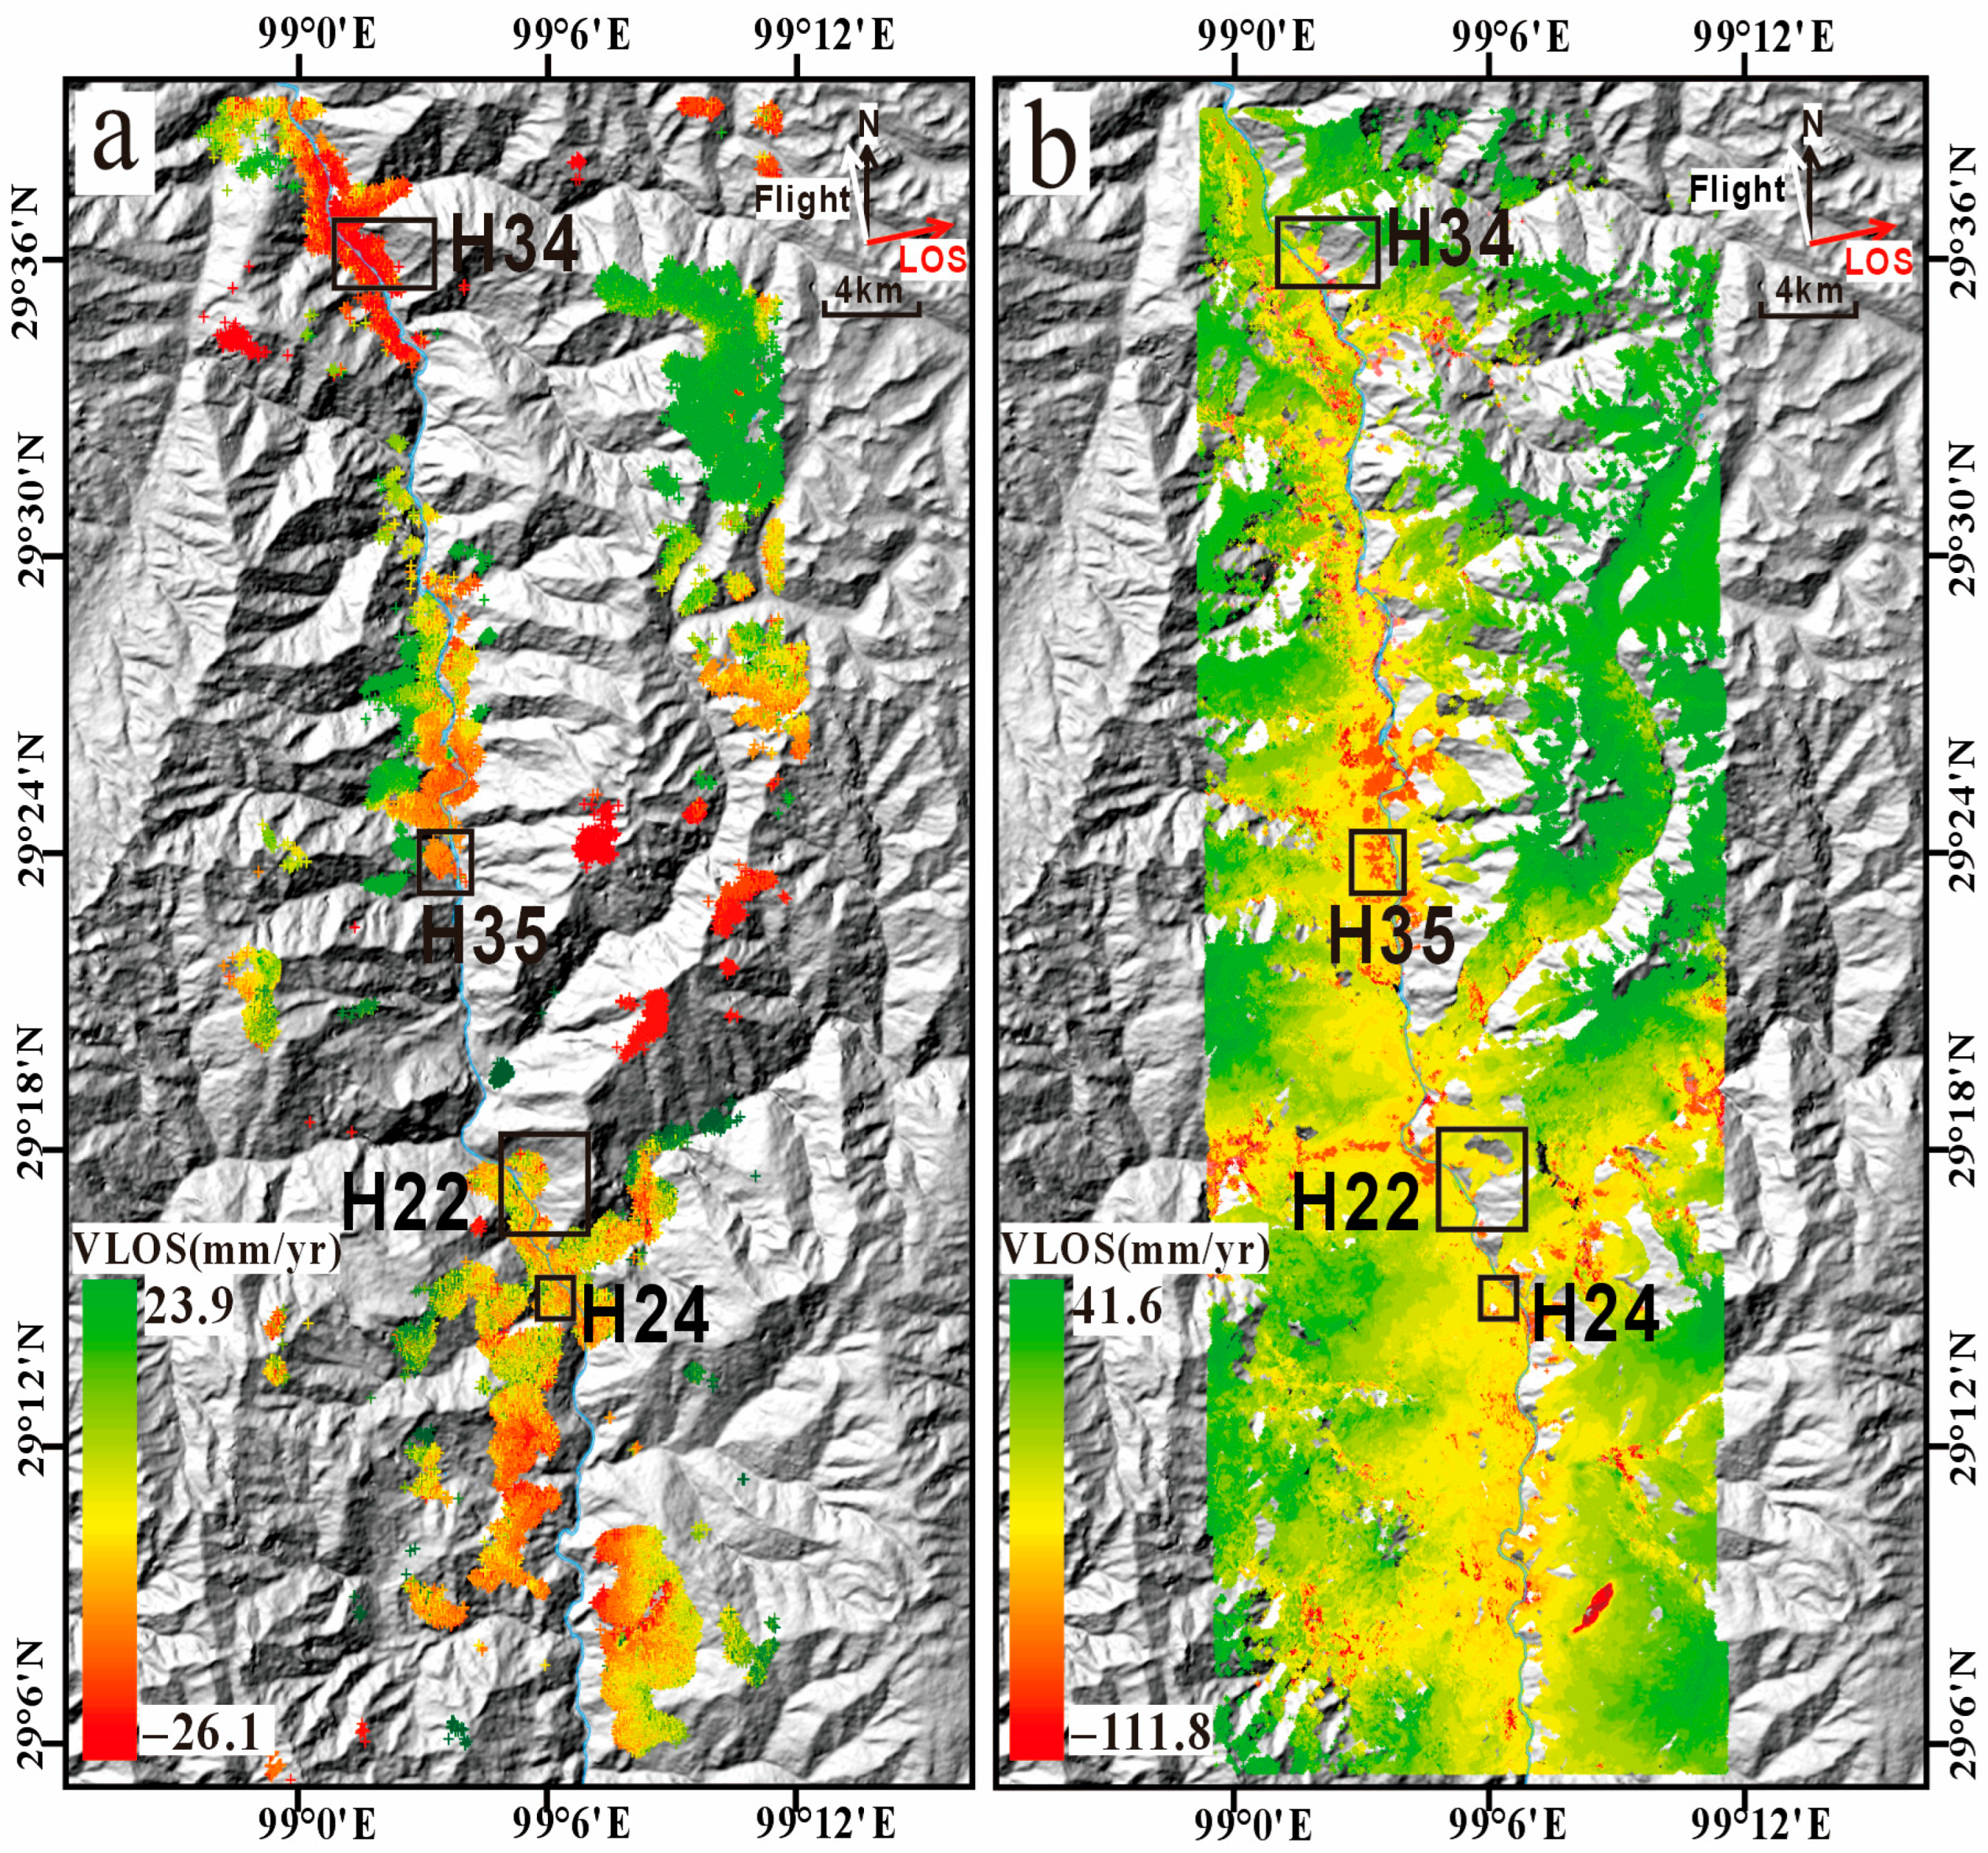
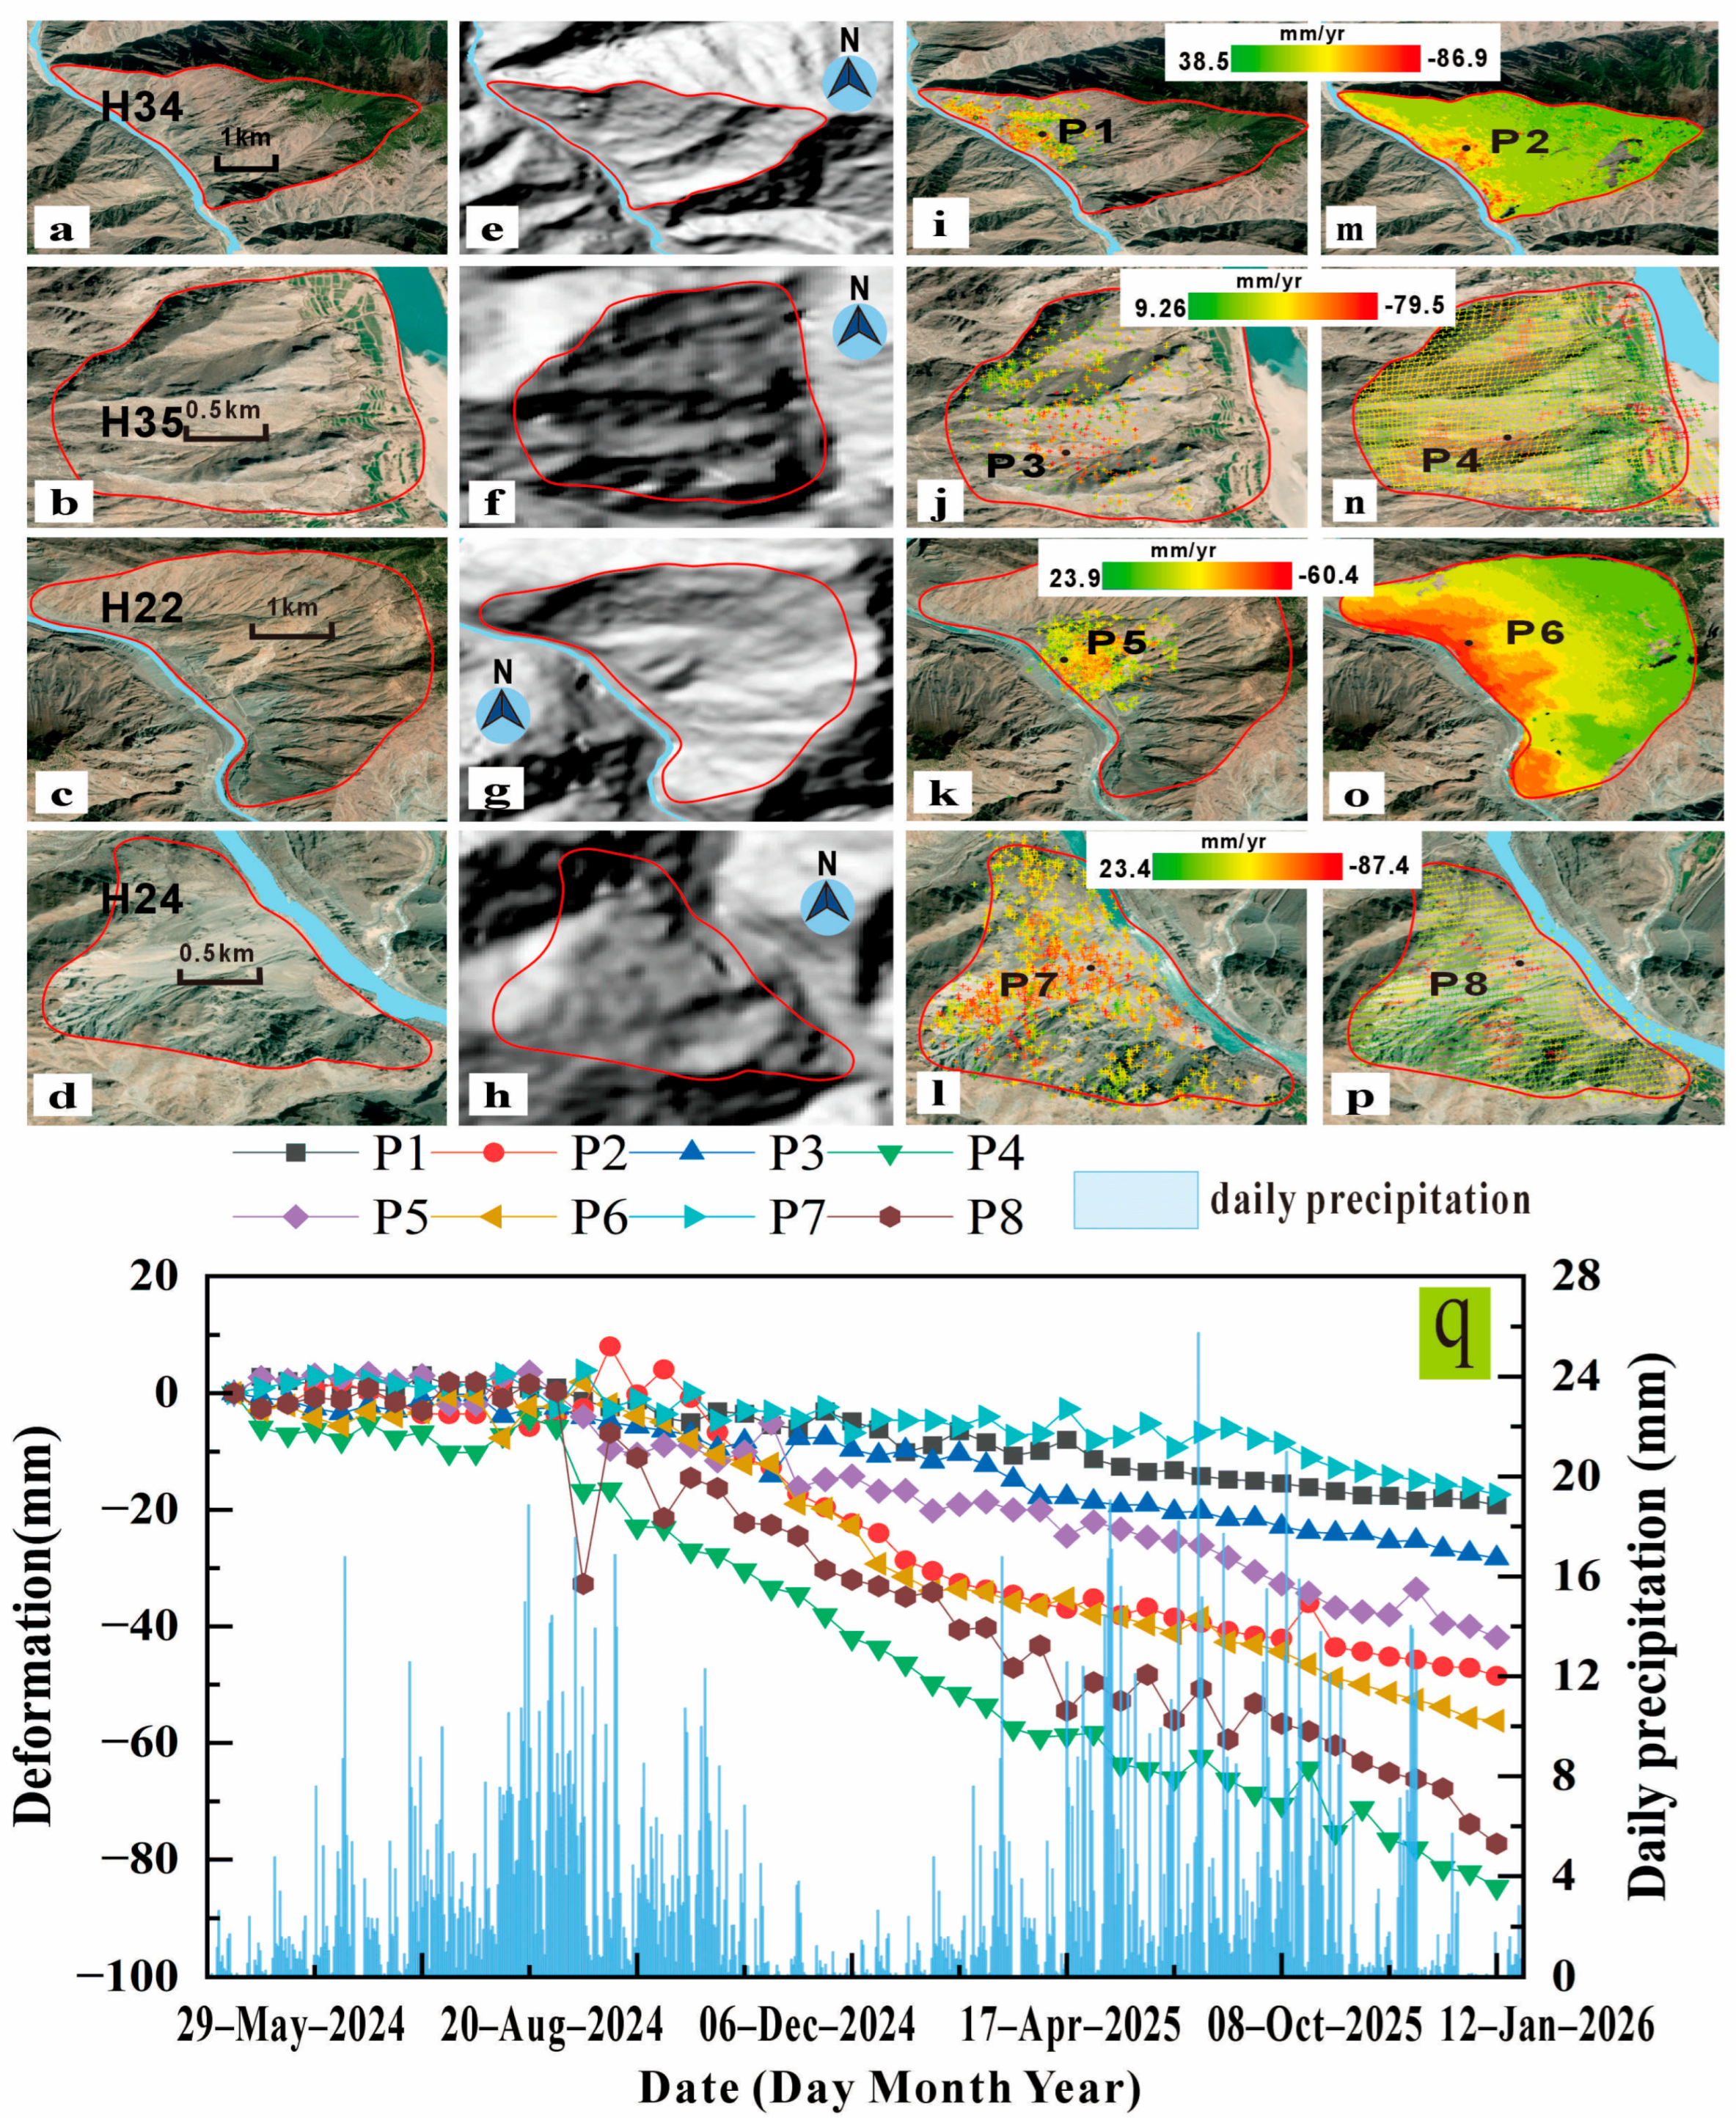
Figure 6 presents a side-by-side comparison of the applicability of PS-InSAR and SBAS-InSAR in the Batang Gorge area using Sentinel-1A ascending-track data as a unified reference. The PS-InSAR results show that LOS deformation gradients ranging from −26.1 to +23.9 mm/yr were captured on stable scatterers such as exposed bedrock and road piers, but the spatial continuity varies significantly (Figure 6a). Owing to its strict dependence on persistent coherent scatterers, PS-InSAR points generate extensive unmonitored blank zones in the vegetated slope shoulders of the representative landslides and the altered ophiolite zone, with an effective monitoring density of only 111 points·km−2 (Figure 7i–l). In contrast, SBAS-InSAR optimizes interferometric pair configuration by constraining the perpendicular spatial baseline to less than 10% of the critical baseline (stricter than the conventional critical baseline threshold), which reintroduces low-coherence pixels into the inversion solution, and elevates the effective monitoring density to 697 points·km−2 (a 6.28-fold increase relative to PS-InSAR) (Figure 6b). This technique captures LOS deformation gradients ranging from −111.8 to +41.6 mm/yr, and fully delineates the rear tensile and front compressive zones of the four representative landslides H22, H24, H34, and H35 (Figure 7m–p).
For consistency validation and comparative analysis, eight characteristic monitoring points (P1–P8; Figure 7i–p) were selected to conduct time-series deformation correlation analysis. The results indicate that the overall long-term deformation trends derived from SBAS-InSAR and PS-InSAR are highly consistent (Figure 7q). The deformation rates of these characteristic points exhibit a gradual upward trend within the annual monitoring period. The root mean square error (RMSE) of the PS-InSAR time-series deformation measurements is 3.82 mm, while that of the SBAS-InSAR time-series measurements is 3.41 mm. Both time-series deformation curves display pronounced abrupt deformation jumps during the rainy season (July–August) and the reservoir impoundment period (March–April) (Figure 7q). Benefiting from its significantly higher spatial point density, SBAS-InSAR exhibits superior performance in capturing spatially differential deformation responses to seasonal precipitation variations. Comprehensively evaluating three core performance indicators, namely RMSE, spatial coverage, and terrain adaptability, SBAS-InSAR is more suitable for the high mountain-gorge geomorphic environment characterized by dense vegetation and fragmented rock masses. Accordingly, all subsequent deformation analyses in this study will be conducted based on the SBAS-InSAR results derived from both ascending and descending orbit data.

4.2.2. Differences and Complementary Advantages of Ascending and Descending Orbit Observations

There are prominent differences in imaging geometry and terrain adaptability between ascending and descending Sentinel-1 datasets covering the Batang canyon area. Satellites travel south to north for ascending orbits with westward radar irradiation, while descending orbits feature north-to-south flight and east-oriented radar signals. The opposite viewing angles facilitate the separation of east–west horizontal deformation signals, whereas steep slopes tend to produce orbit-specific geometric anomalies such as layover, shadow and topographic reversal [55]. Ascending data is generally more appropriate for monitoring east-facing landslides, and descending data tends to perform better for west-facing slopes. Both orbits follow a 12-day revisit cycle but have inconsistent acquisition times. The combined use of ascending and descending data can help reduce terrain sheltering, often raise the number of valid monitoring points on vegetated broken rock slopes, enable potential mutual verification of landslide deformation trends, and tend to obtain relatively comprehensive and precise monitoring results in highly undulating alpine canyon terrain.
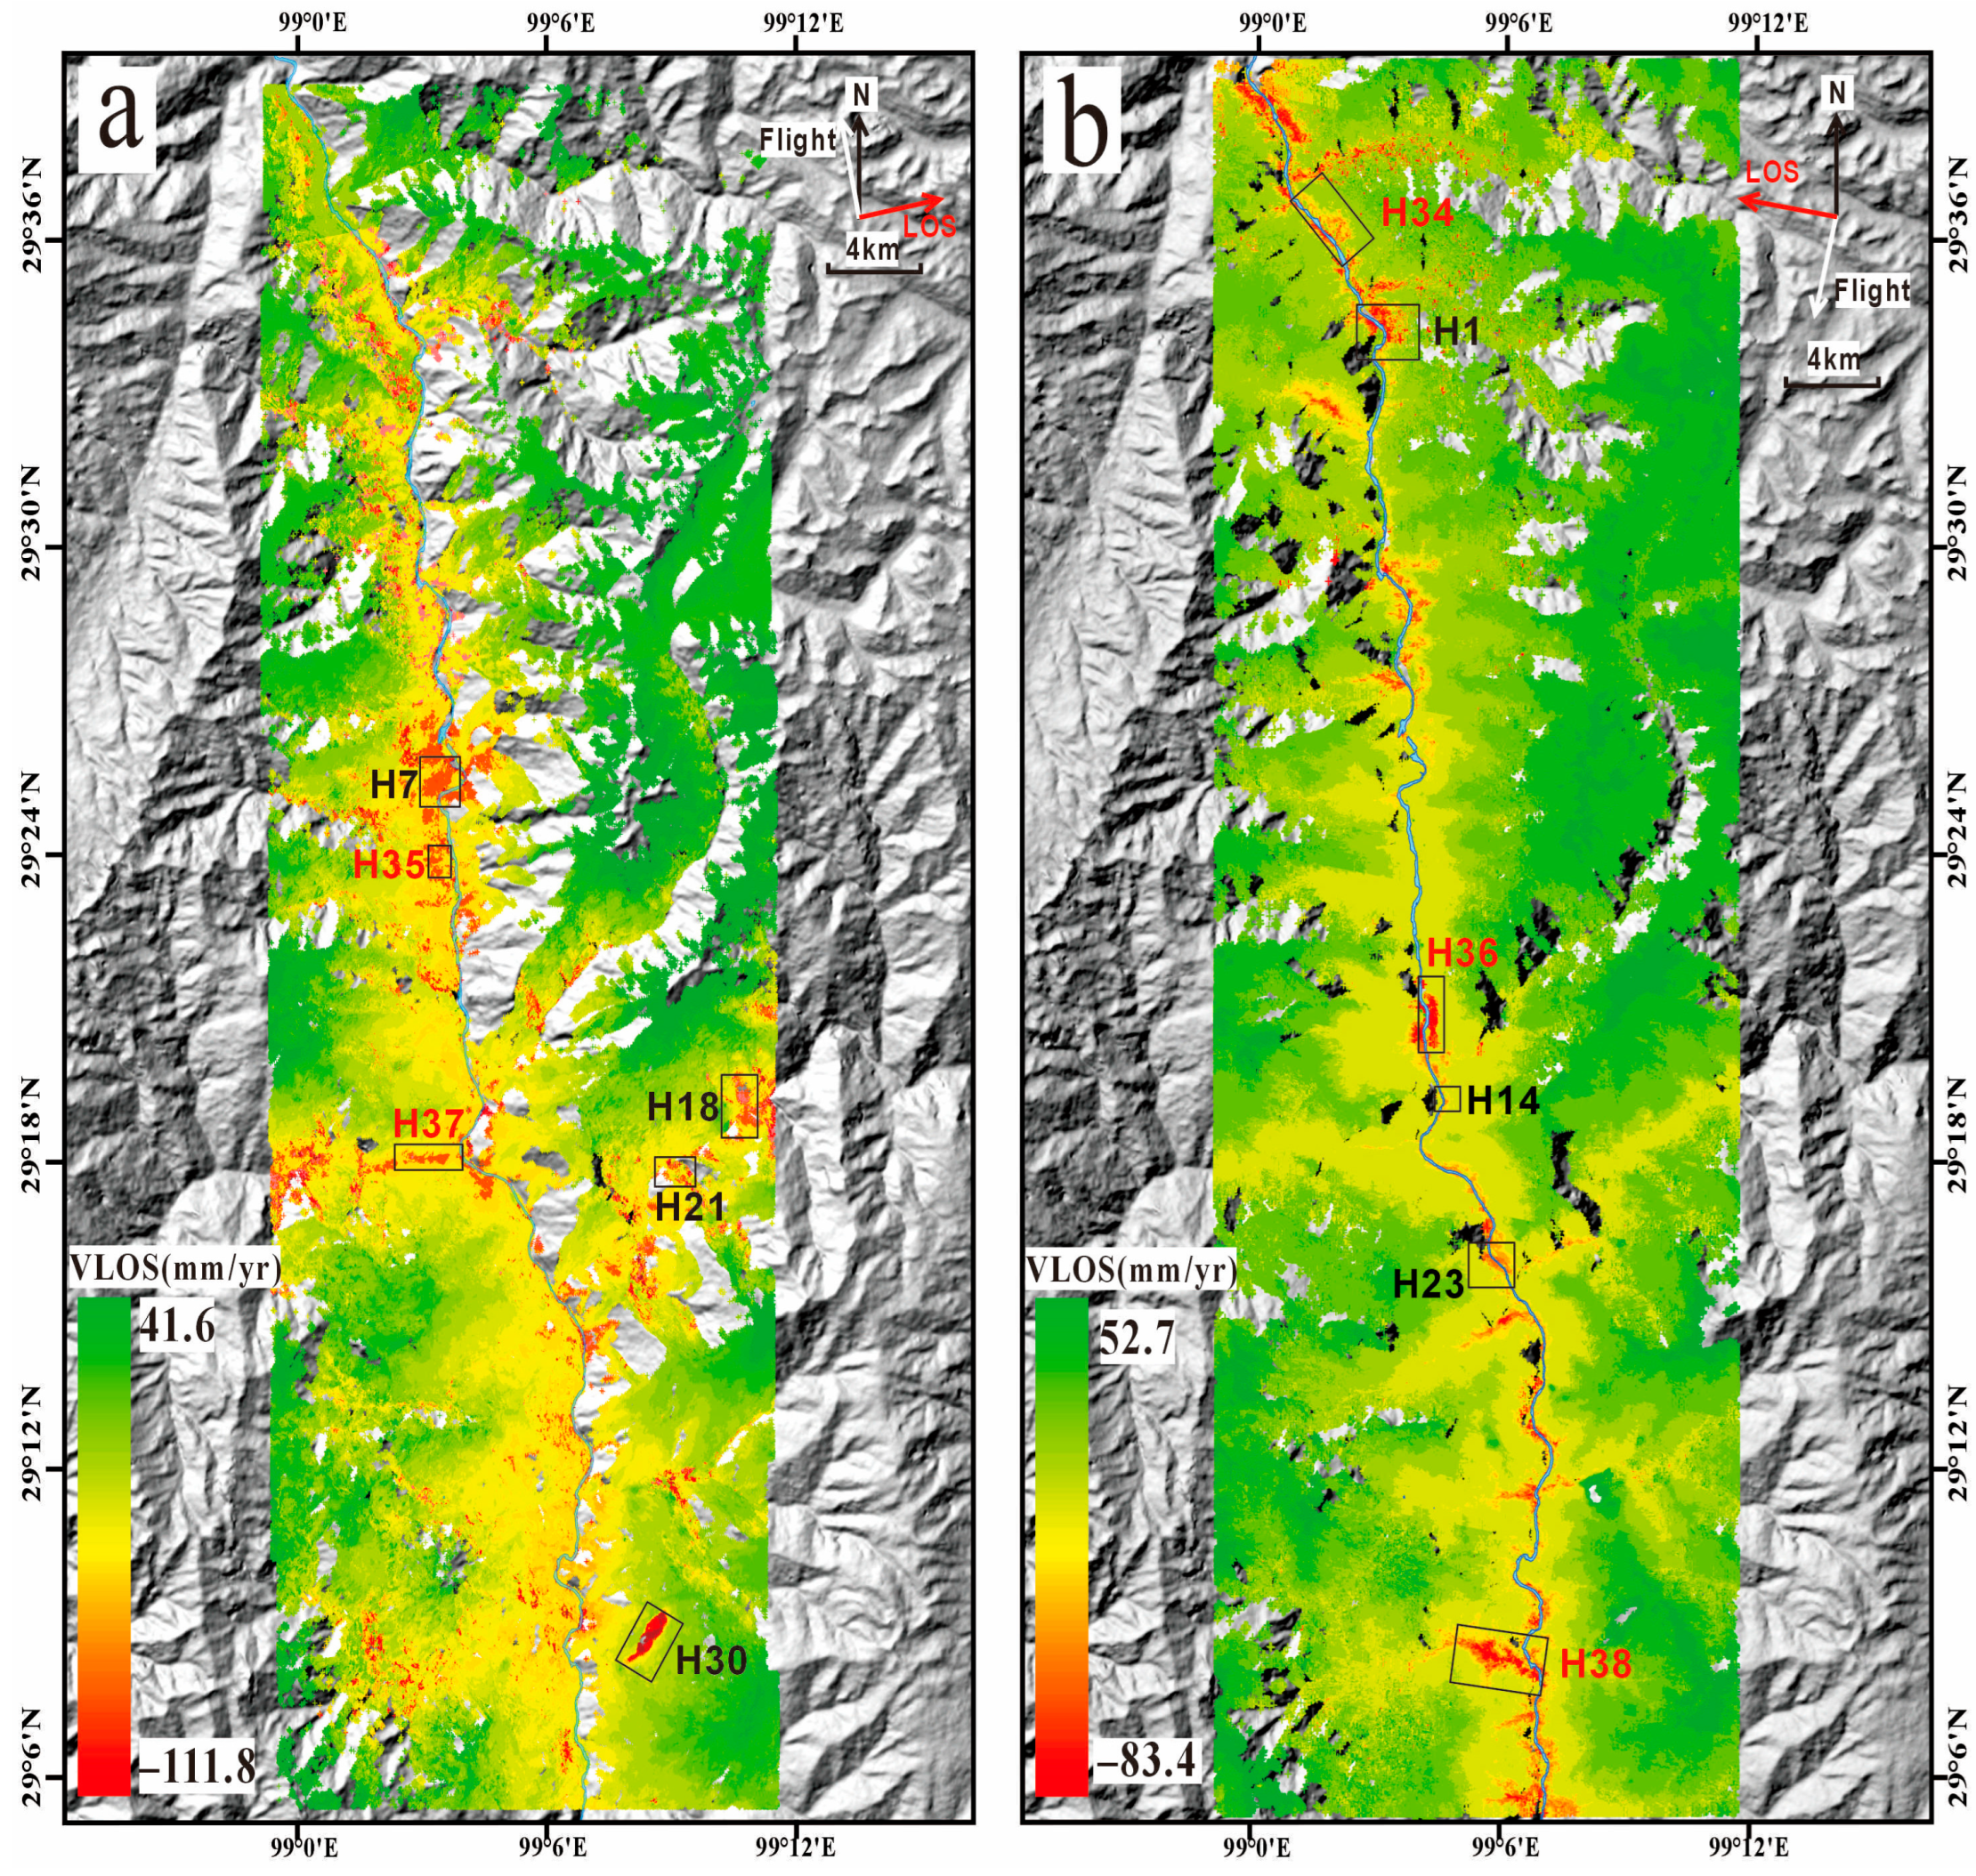
Figure 8 validates the regulatory effect of radar viewing geometry on landslide detectability across the two canyon banks, via independent SBAS-InSAR processing of ascending and descending orbit datasets. As the LOS direction of ascending orbit data is approximately orthogonal to the east-facing canyon slope (right bank), the corresponding deformation field (Figure 8a) exhibits complete deformation gradient distributions and a high signal-to-noise ratio for typical landslides including H7, H35, and H37. Benefiting from the mirror-symmetric radar viewing geometry of the descending orbit, the corresponding deformation results (Figure 8b) significantly enhance the coherence level and effective monitoring point density of west-facing slope landslides (left bank) including H1, H14, and H36. After correction based on stable scatterers extracted from PS-InSAR results, the geometric distortion blind zones are effectively mitigated. This correction yields a consistent, robust displacement reference framework to support subsequent hazard susceptibility classification of individual landslides. To further investigate the deformation characteristics and intuitively visualize landslide deformation patterns with greater clarity, three representative landslides were screened out for in-depth targeted analysis.

4.3. The H7 Landslide Group of Suwalong Hydropower Station

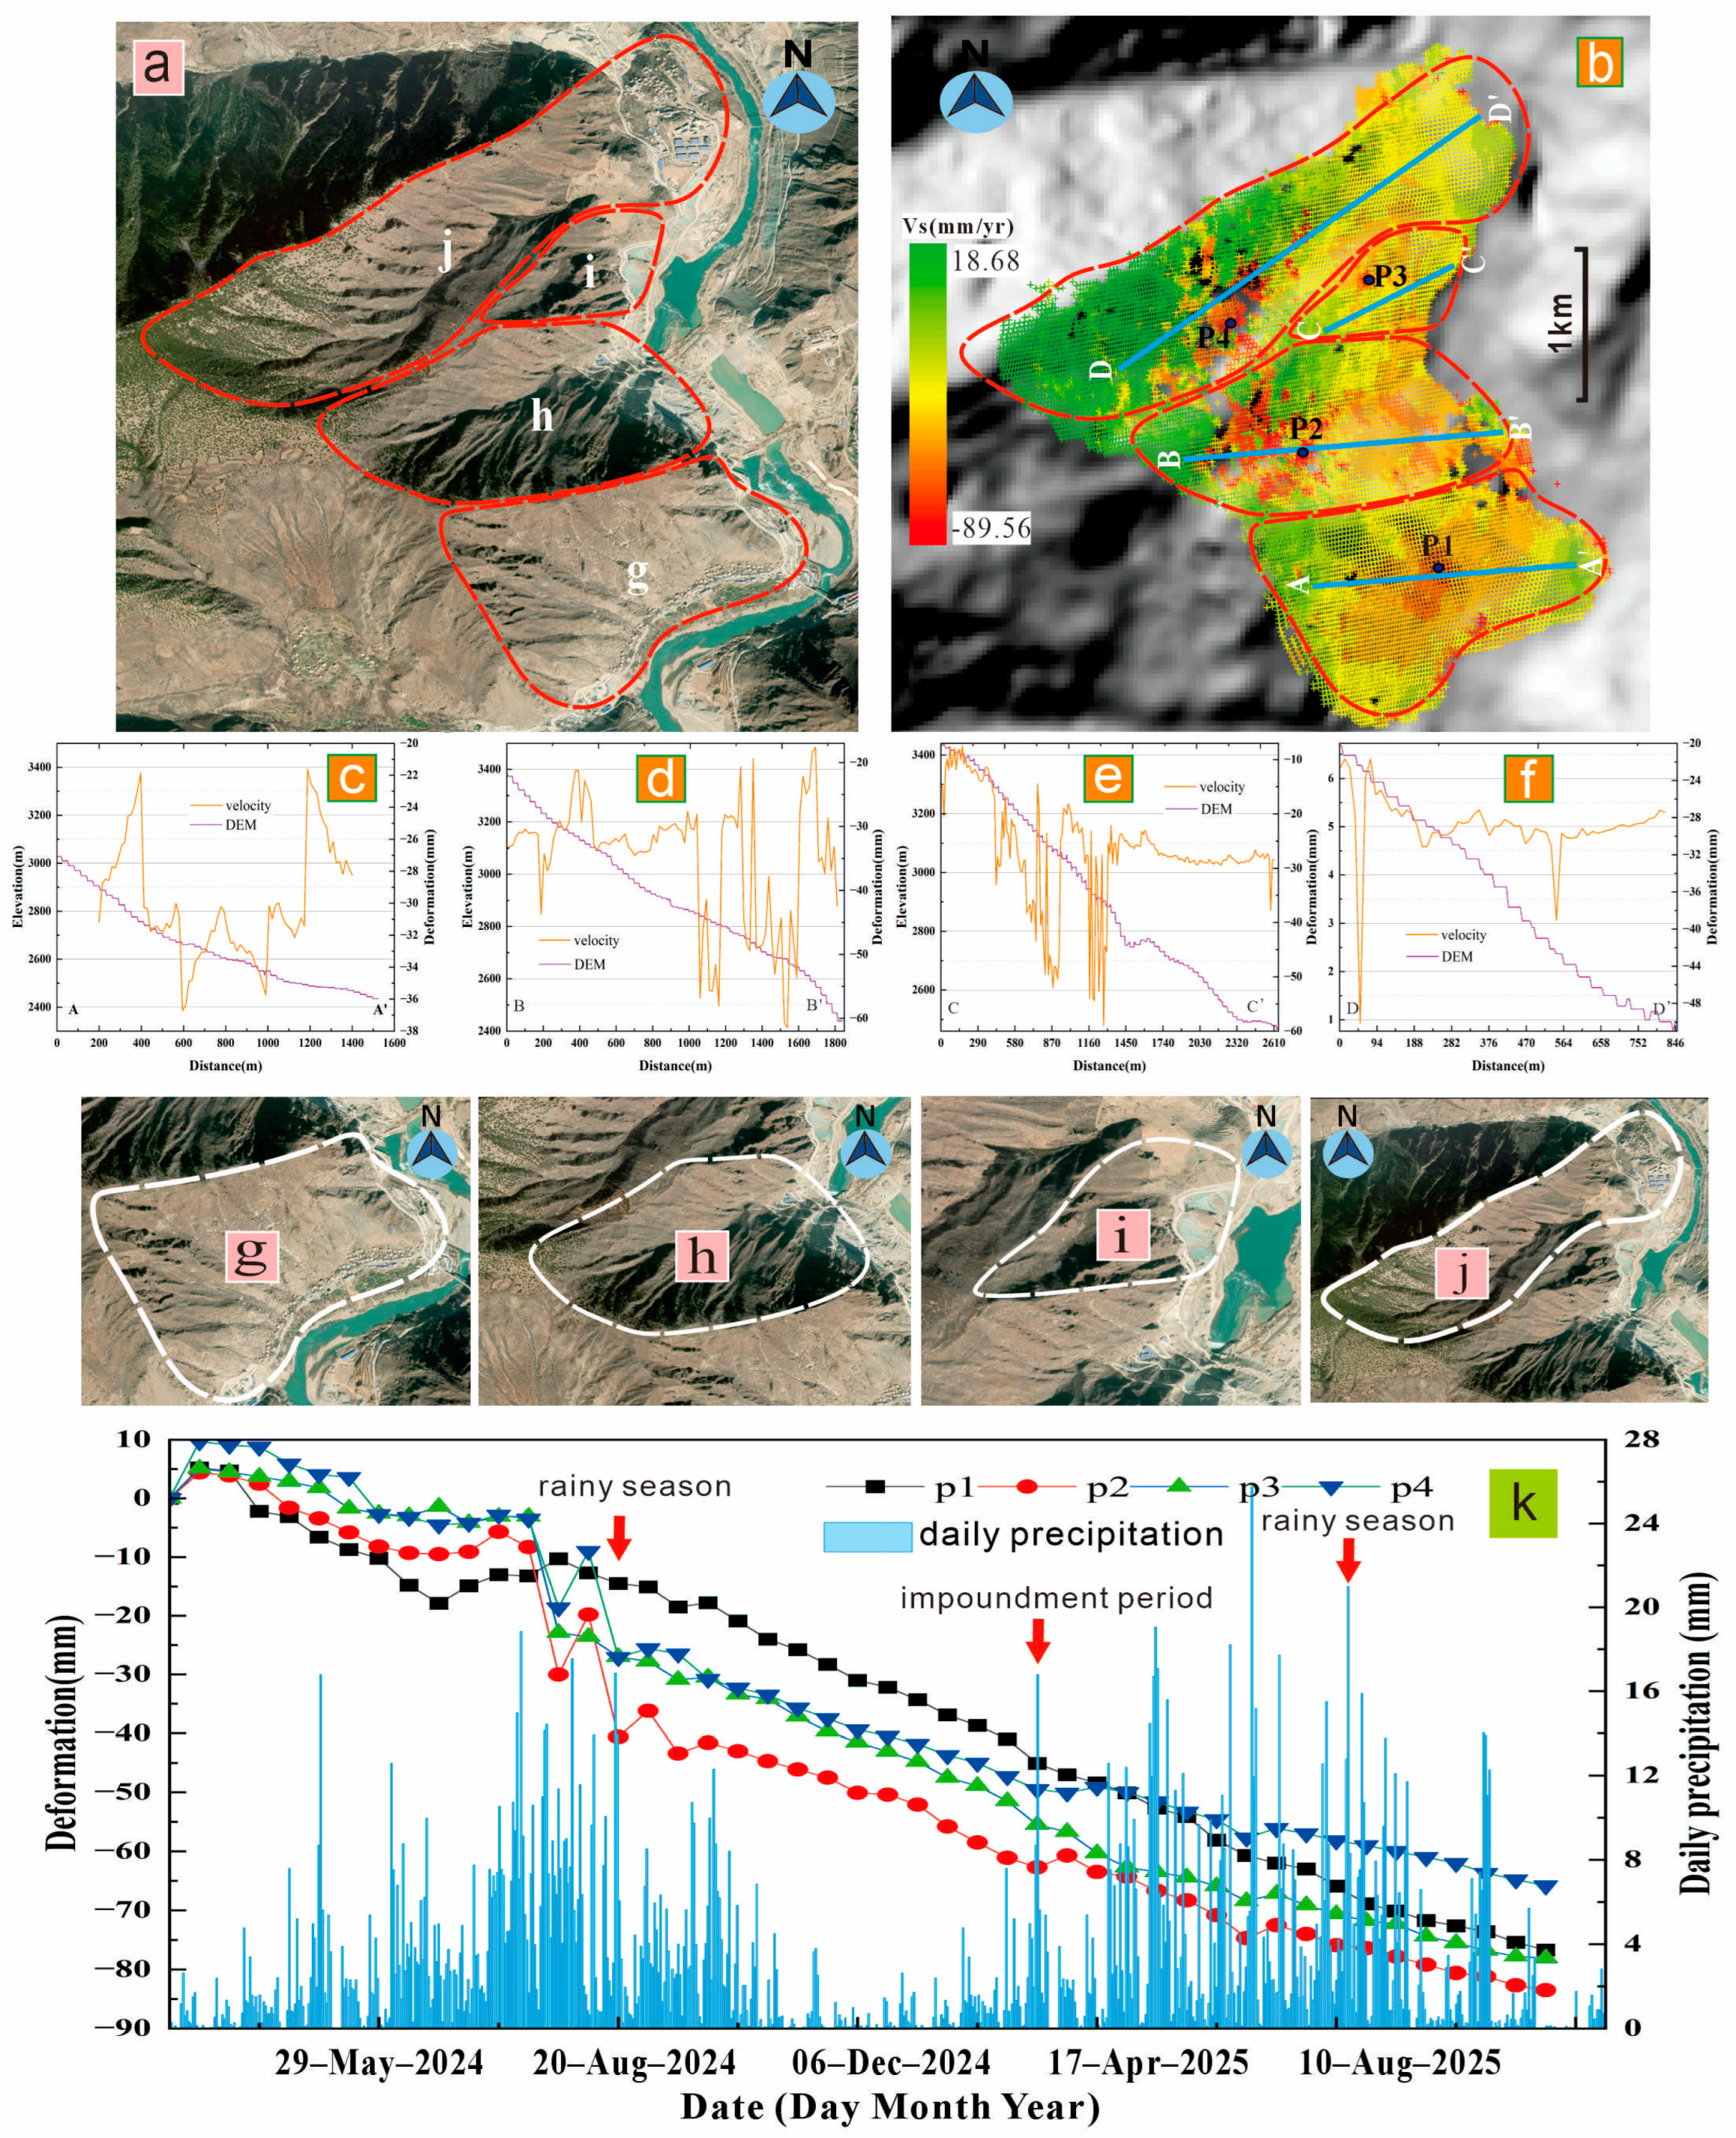
The H7 landslide group of Suwalong Hydropower Station is a large-scale complex landslide covering an area of 7.264 km2, situated on the right bank of the Jinsha River. As illustrated in Figure 9a, this landslide comprises four distinct sub-zones labeled g, h, i, and j. The geographical coordinates of this landslide are (99.04°E, 29.43°N), with a rear edge elevation of 3089 m and a main sliding direction of 66.7°. This landslide has a substantial sliding volume, with its toe directly adjacent to the Suwalong Hydropower Station. The H7 landslide developed in an area dominated by Triassic granodiorite and quartz diorite, with local outcrops of granodiorite porphyry and quartz monzodiorite (Figure 1b). The well-developed joints and fractures within these intermediate-acidic intrusive rocks, coupled with their heterogeneous weathering properties and bank erosion induced by the Jinsha River, have resulted in severe bedrock fragmentation and support loss at the landslide toe, ultimately triggering slope sliding on both sides of the gully. Furthermore, localized instability has been observed at the leading edges of the g and h sub-zones.
Based on the lithological characteristics and elevation-deformation trend profiles along the main sliding direction of the landslide (Figure 9c–f), the stability of the H7 landslide was analyzed from the perspective of spatial geological structure. Results indicate that the steep slope section corresponds to highly jointed and fissured granodiorite, which coincides with the high deformation rate zone. Based on the converted downslope deformation data from InSAR monitoring (Figure 9b), the concentrated deformation zone is clearly delineated, and the maximum average downslope deformation rate ( v s ) is −89.56 mm/yr.
Figure 9k presents the cumulative downslope time-series deformation of four characteristic points, together with daily rainfall distribution. The time-series trend shows stable overall landslide movement, accompanied by sharp deformation surges in the rainy season (July–August) and the reservoir impoundment stage (March–April). The maximum daily rainfall within the monitoring span reaches 18 mm. The evolution of the H7 landslide cluster of Suwalong Hydropower Station is controlled by the coupling influences of lithology, topography and rainfall [56].

4.4. Wang Dalong Blocking the River Landslide H14

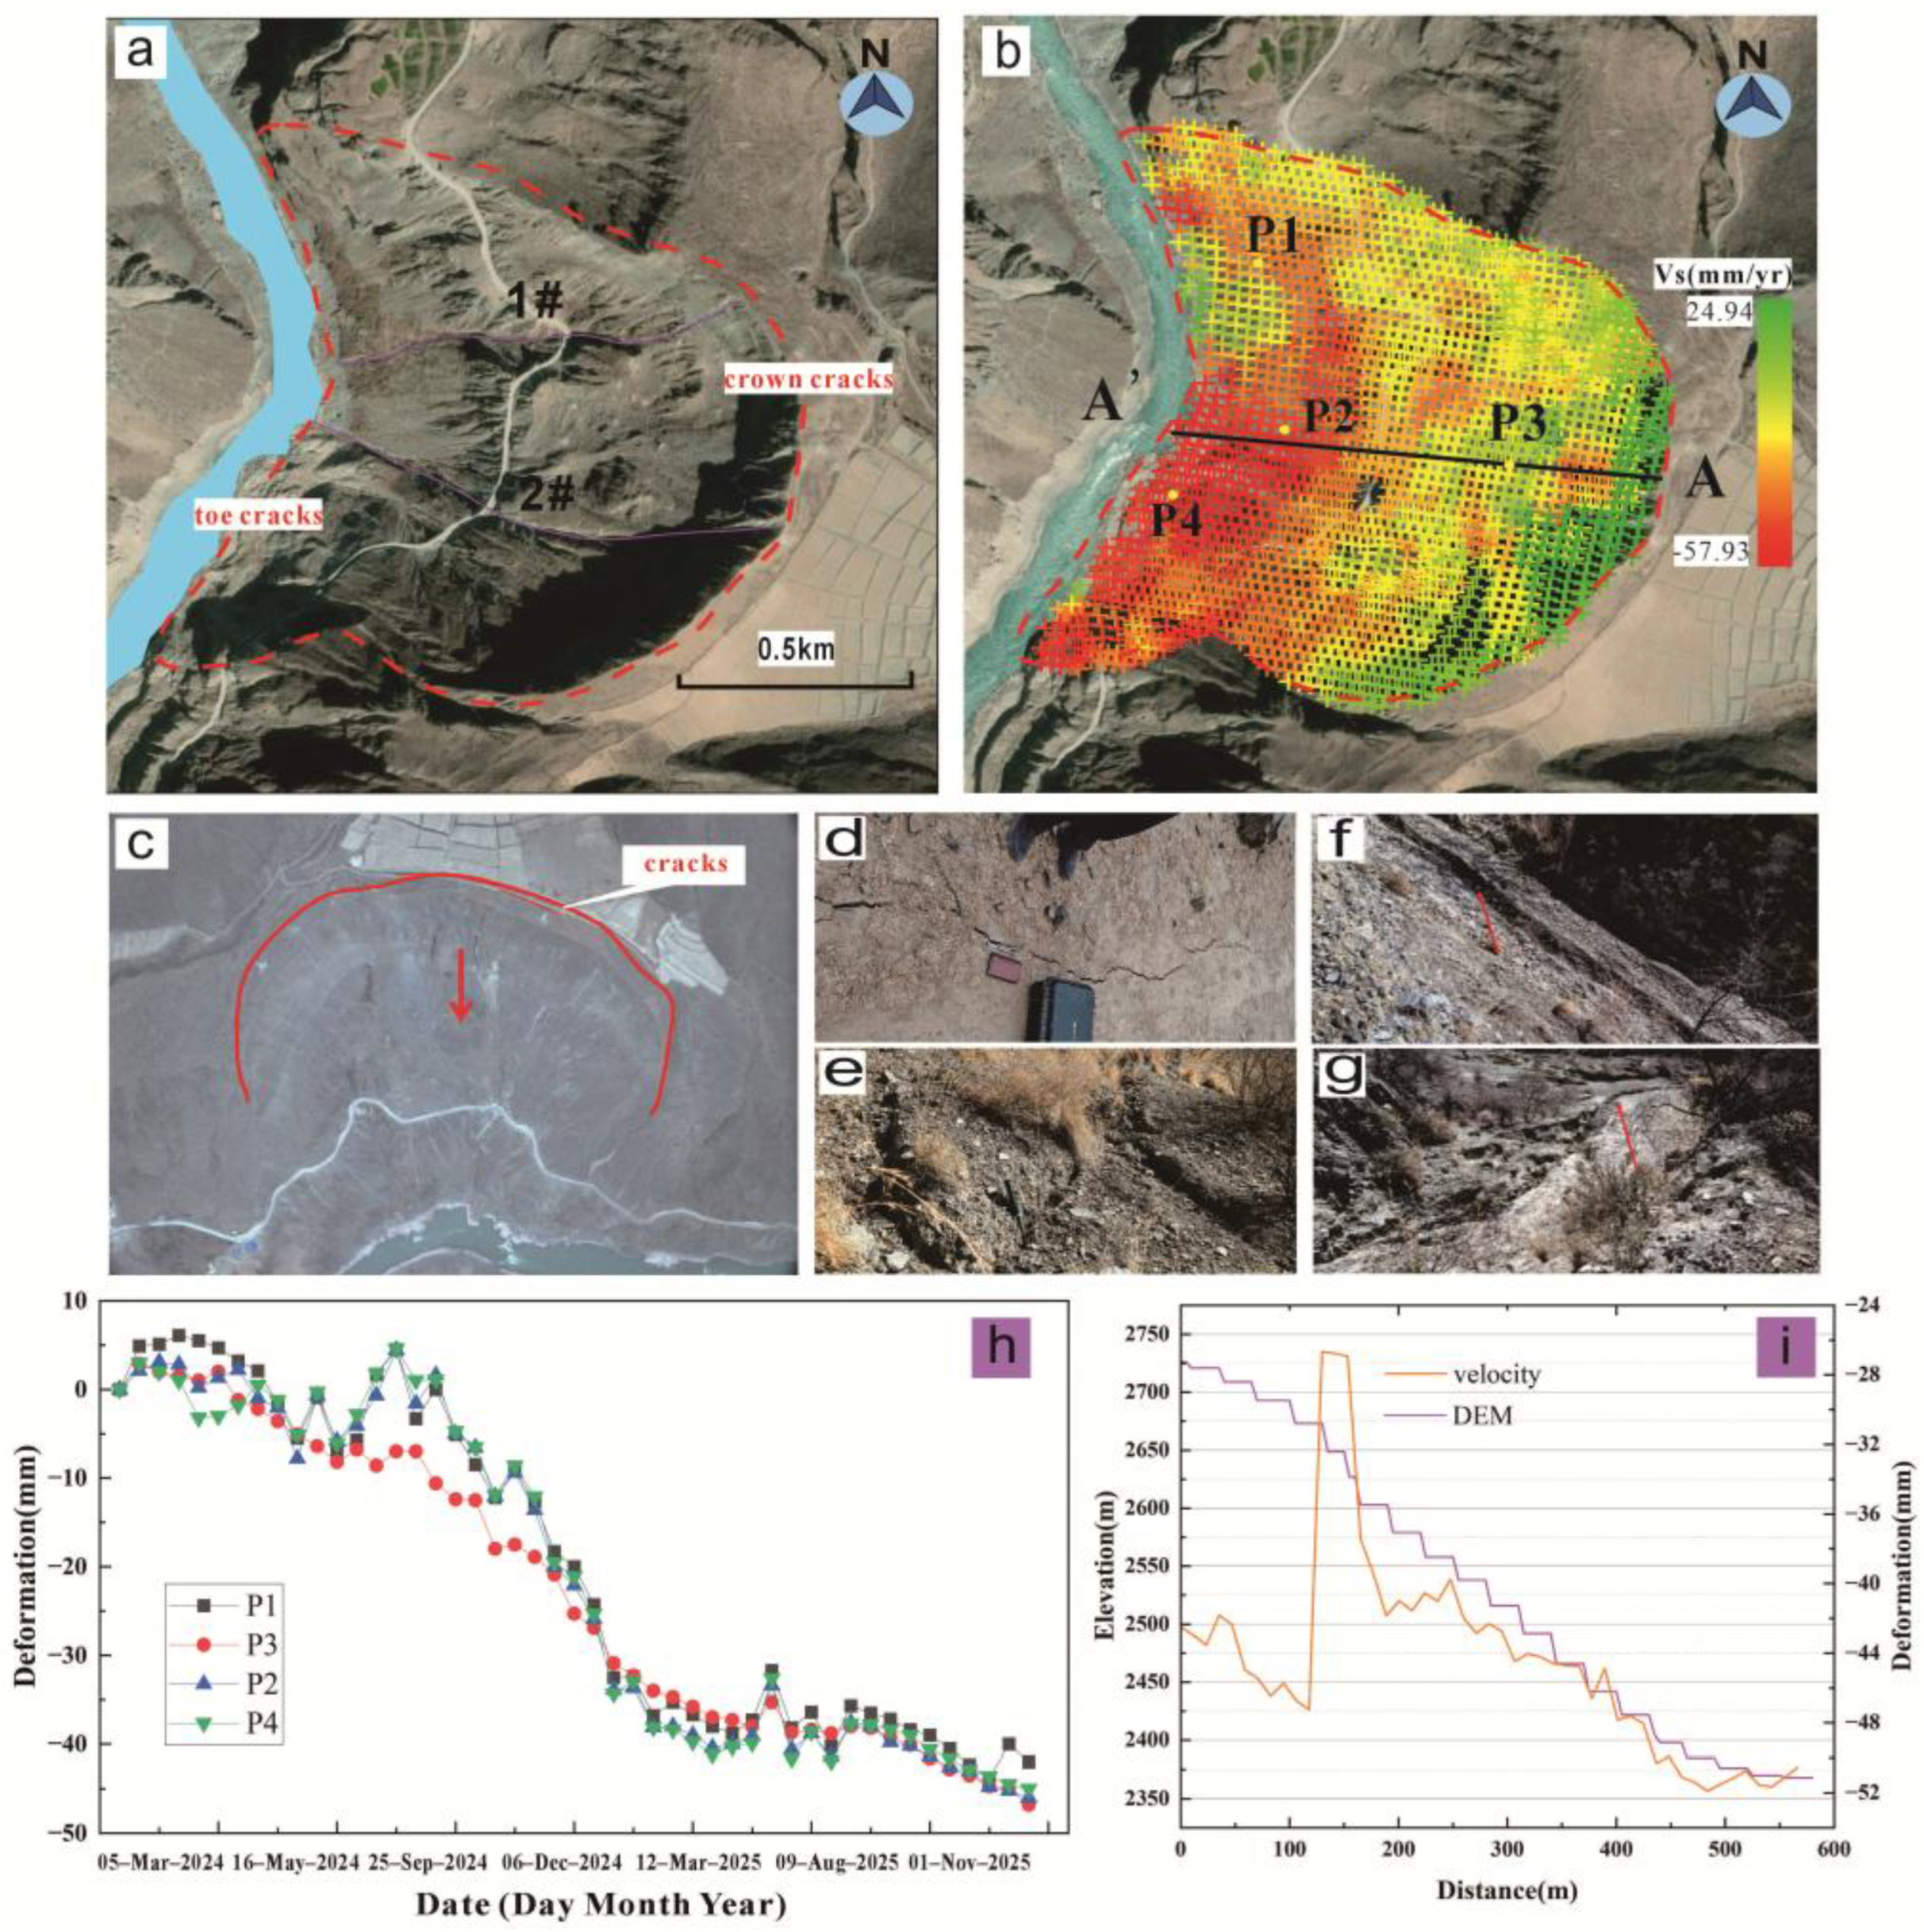
The Wangdalong H14 landslide is the one with the highest river-blocking risk identified within the study area. In terms of planar morphology, the landslide has a length of approximately 517 m and a width of 700 m, exhibiting a typical “armchair-shaped” landform. The slope’s leading edge is merely 170 m from the Jinsha River’s main channel, with unfavorable overhanging conditions and prominent spatial geomorphic conditions for direct river blocking. In terms of the slope-surface deformation rate characteristics, the maximum slope-parallel deformation rate ( V s ) of this landslide reaches −57.93 mm/yr, with deformation exhibiting a highly concentrated spatial distribution. The core deformation zone is situated at the slope foot, and the overall sliding direction is directly toward the Jinsha River mainstream.
Based on Google Earth imagery, unmanned aerial vehicle (UAV) aerial photographs, and field investigation results, the overall development characteristics and obvious instability signs of the landslide can be clearly identified [57]. Field investigations reveal the development of obvious tensile cracks at the slope top (Figure 10d) and slope foot (Figure 10e), which represent the intuitive surface features of slope deformation. Furthermore, two small gullies (No. 1 and No. 2) are developed within the slope extent, with persistent water flow observed within them (Figure 10f,g), which further exacerbates the slope’s instability trend.
The time-series deformation curves of representative characteristic points P1–P4 on the landslide (Figure 10h) show that cumulative deformation occurring in the rainy season accounts for approximately 70% of the annual total deformation. Obvious deformation acceleration is observed within this period, indicating a close temporal association between rainfall and slope deformation.
Meanwhile, the elevation-deformation relationship along the main sliding direction profile of the landslide (Figure 10i) exhibits a distinct positive correlation, which reveals the spatial evolution law of landslide deformation along the topographic profile of the main sliding direction and further confirms the landslide’s development trend of sliding continuously toward the Jinsha River mainstream along this direction.

4.5. Landslide H18 in Yudi Village, Changbo Commune

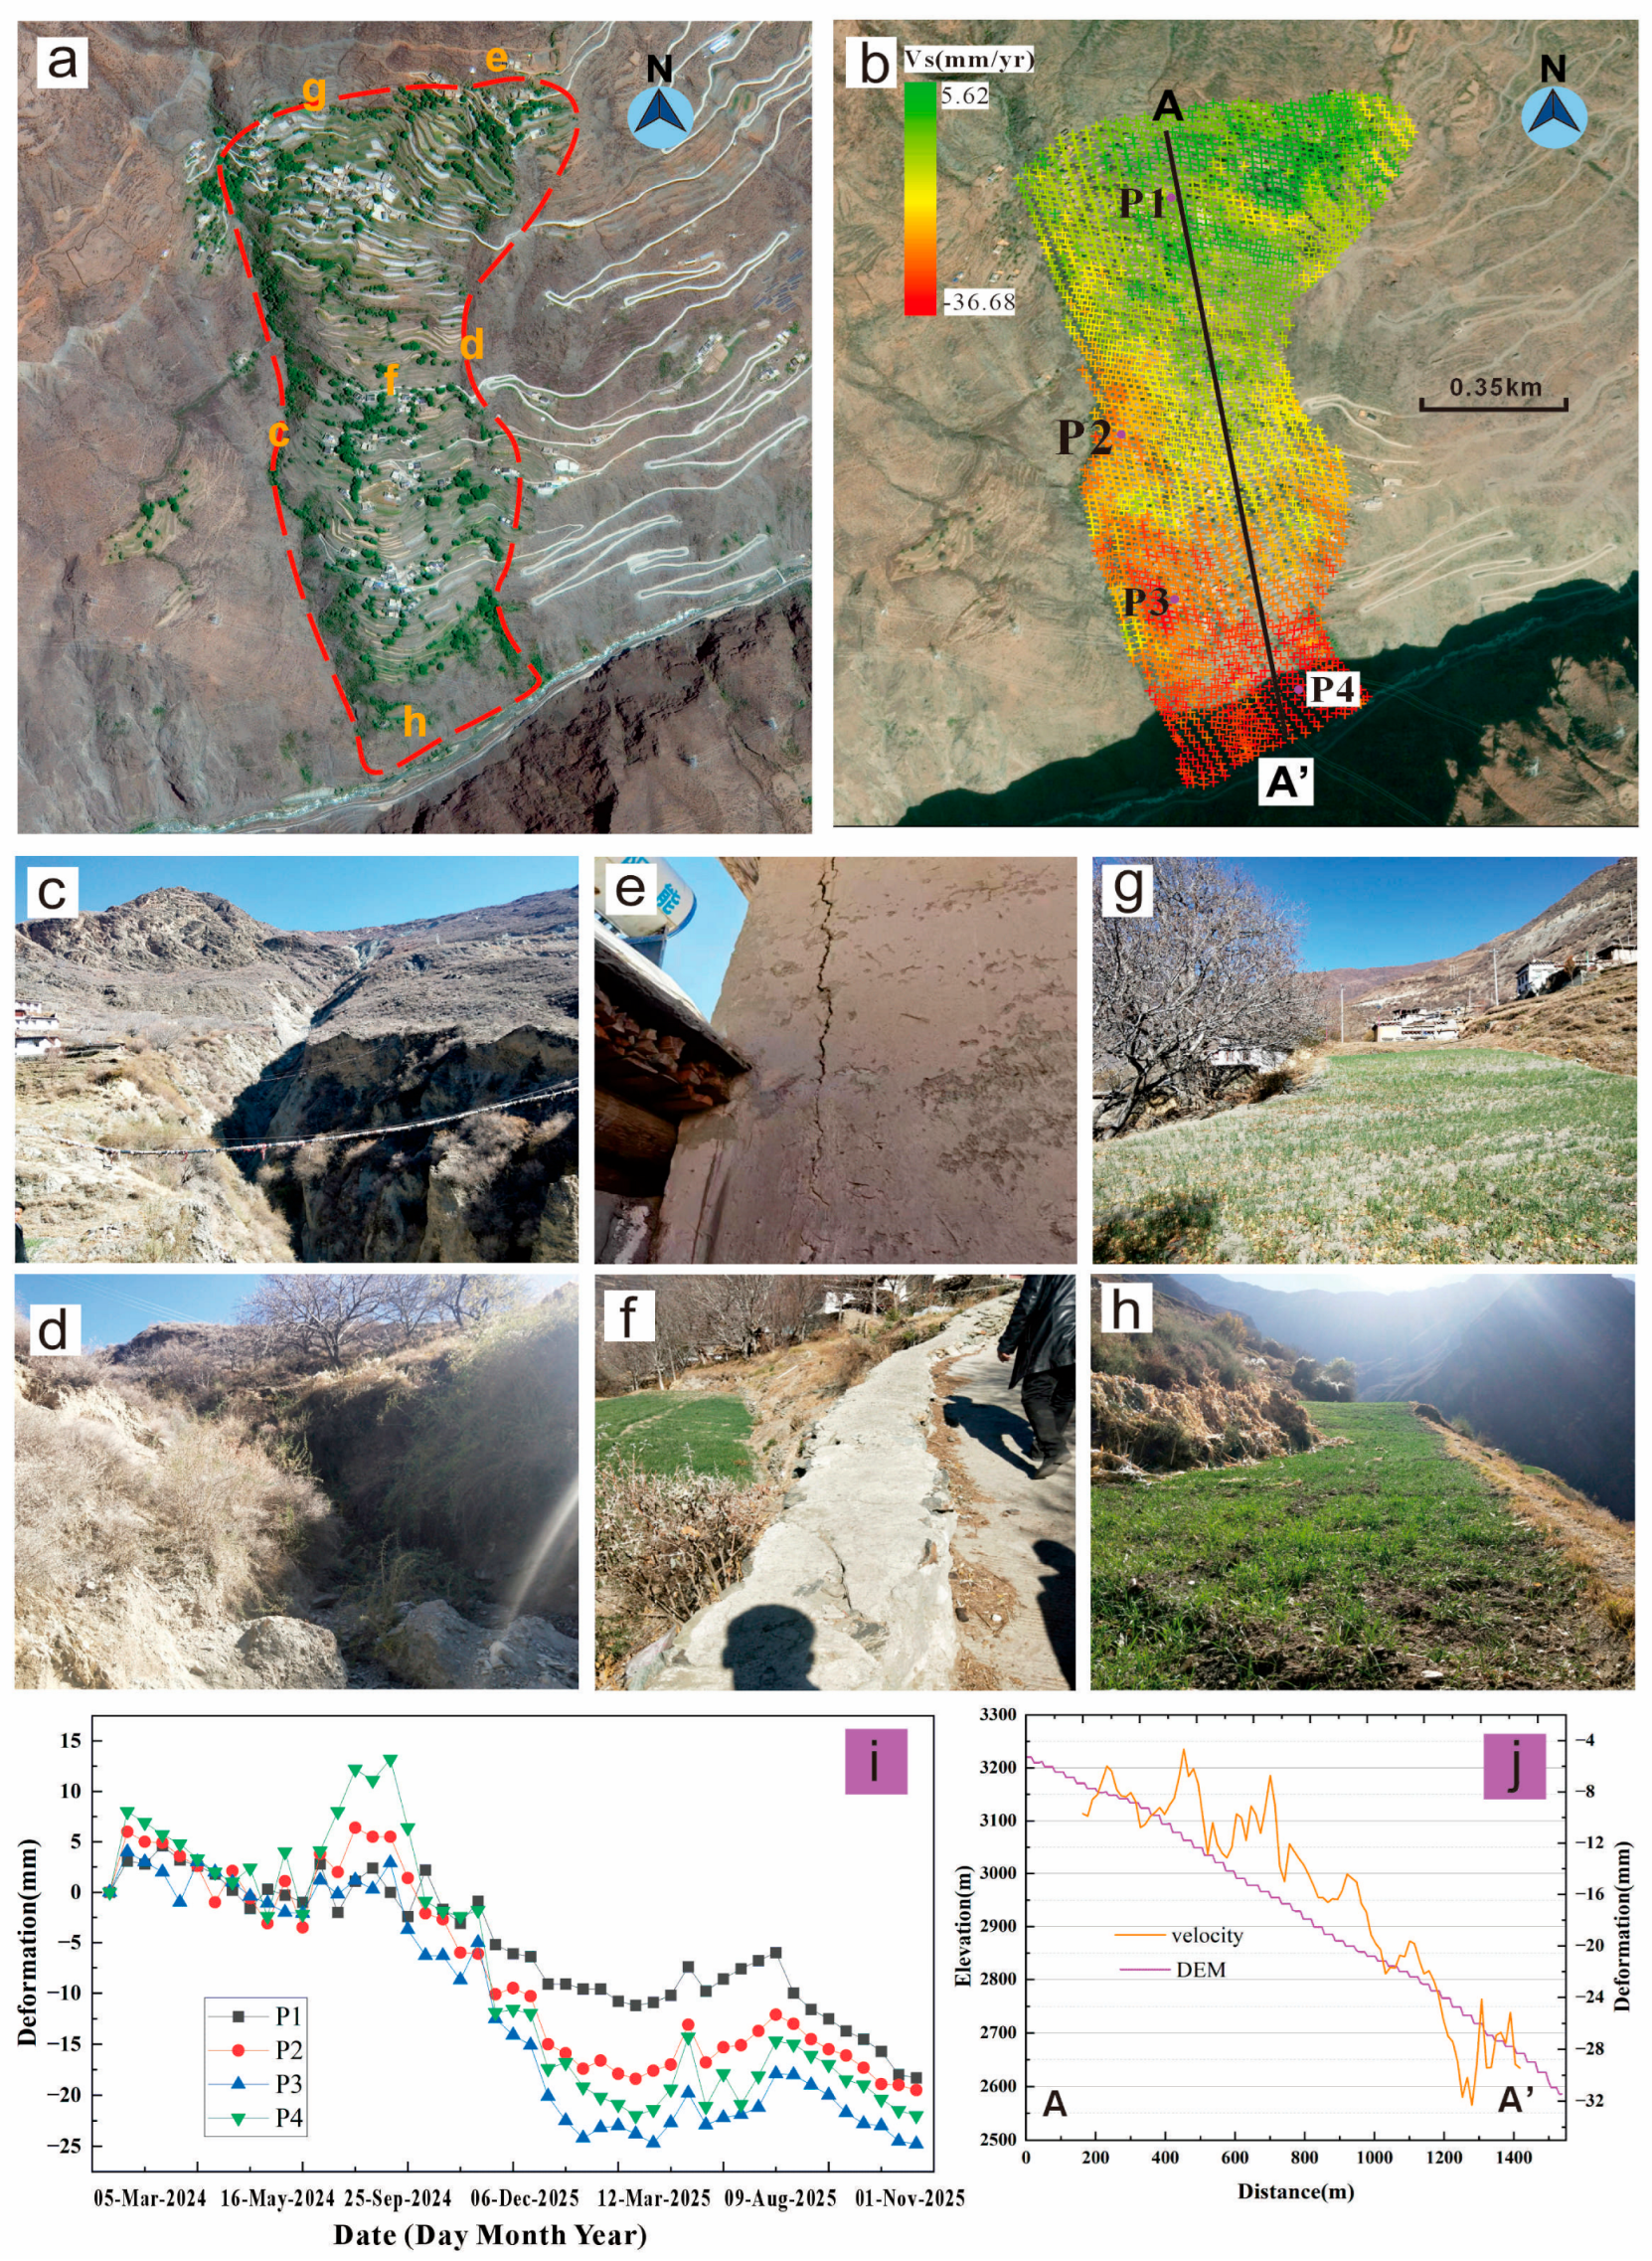
The H18 landslide in Yudi Village, Changbo Township, is situated in a deep canyon area with a steep topographic slope (Figure 11a). Its boundaries are demarcated by steep scarps on the left and right flanks (Figure 11c,d), a tensile fracture zone at the rear edge (Figure 11g), and a free face at the leading edge (Figure 11h). The slope exhibits multiple macroscopic deformations, with cracks developed on the building walls at the rear edge (Figure 11e) indicative of tensile creep characteristics. A continuous tensile crack developed on the village road at the slope midsection (Figure 11f) has formed a scarp, which reflects slow shear sliding toward the main sliding direction. Vegetation disturbance and soil slippage at the leading edge (Figure 11h) indicate a potential shear-out zone at the slope toe.
The downslope deformation field (Figure 11b) indicates prominent sliding deformation in the middle and lower sections of the landslide (P3, P4), with a maximum V s of −36.68 mm/yr. By contrast, the upper-middle zone (P1, P2) only presents weak deformation. Along the AA′ profile (Figure 11j), the deformation rate exhibits a positive correlation with elevation, peaking at the leading edge (at an elevation of approximately 2600 m), which is consistent with the mechanical unloading mechanism at the slope leading edge. The time-series deformation curves (Figure 11i) reveal that deformation at points P1 to P4 exhibits nonlinear growth, with a significant acceleration phase during the 2024 rainy season (August–November). Cumulative deformation at P3 and P4 exceeded 20 mm and 25 mm, respectively, which is coupled with intense rainfall events, demonstrating a distinct rainfall sensitivity of the landslide. Spatially, deformation intensity increases from the rear edge to the leading edge of the slope, which is consistent with the evolutionary pattern of “rear edge tensile fracturing—midsection shearing—leading edge shear-out”.
At present, the overall structure of the H18 landslide remains stable to basically stable, without any signals of large-scale global instability. Nevertheless, the analysis of its deformation evolution reveals slow creep deformation at the landslide front, and the displacement rate in partial zones shows a persistent rising tendency. Steep topography, weak rock-soil mass, and hydrological processes are the main controlling factors causing the reduction in slope stability, which directly endangers the lives and property of 15 residents from 3 households at the landslide rear edge. In summary, landslide deformation is highly correlated with rainfall, and the nonlinear growth characteristic of deformation indicates a continuous reduction in the landslide’s stability. Therefore, it is necessary to implement intensive monitoring, enhance rainfall early warning, and conduct targeted engineering treatment for the H18 landslide.

4.6. Active-Landslide Inventory and Deformation Characteristics

The active landslide inventory of the Batang reach compiled using ascending and descending SBAS-InSAR techniques provides a detailed record of active landslides in this seismically active, high-altitude segment of the upper Jinsha River. This study utilized 212 Sentinel-1 images acquired between January 2024 and January 2026. Taking advantage of slope-parallel velocity derived from ascending–descending SAR data and high-precision correction based on PS-InSAR, a total of 38 active landslides were identified (Table 2). The maximum v s of the H7 landslide near Suwalong Hydropower Station reaches −89.56 mm/yr. Landslides numbered H1 to H33 represent typical hazardous bodies with average v s ≥ 50 mm/yr and distinct optical geomorphic boundaries. H34 to H38 are newly identified rapid-deformation landslides with average v s rate > 68 mm/yr, covering a total area of 13.69 km2 and accounting for 24.9% of the total valley slope area.
The landslide inventory is established following standardized criteria. Preliminary landslide boundaries are extracted relying on tonal, textural, and geomorphic characteristics interpreted from 0.5-m-resolution 2023–2025 Google Earth optical imagery. The interpreted boundaries are further calibrated and screened by cross-checking against SBAS-InSAR time-series v s results, guaranteeing that only slopes with obvious continuous deformation are incorporated into the inventory. To verify the rationality of the landslide inventory and the reliability of InSAR deformation results, two field surveys were conducted in July 2024 and April 2025, focusing on the inspection of typical representative landslides. Handheld GNSS positioning and DJI Mavic 3 Enterprise UAV photogrammetry were adopted in field work. Field work focused on confirming landslide boundary ranges, ground deformation phenomena such as tensile cracks and slope bulging, and verifying consistency between field slope movement features and InSAR-derived v s patterns. Field observations match well with remote sensing interpretation and InSAR monitoring data, which proves the reliability of the compiled landslide inventory.
Spatial analysis reveals that 86% of the landslides are concentrated within the 5-km buffer zone of the Jinsha River West Branch Fault, exhibit significant coupling with the altered ophiolite belt and Quaternary loose deposits (Figure 1b), highlighting the dual control of tectonic activity and lithology. Time-series deformation results indicate that 33 landslides exhibit stable creep, whereas landslides H14, H18, H33, and H36 show significant acceleration during the rainy season, verifying the rainfall-induced landslide triggering mechanism. The tensile deformation rate at the rear edge of landslide H7 rose after the commencement of Suwalong Hydropower Station impoundment. This temporal coincidence suggests a potential link between reservoir impoundment and slope deformation. The integration of ascending and descending SBAS-InSAR not only expanded the landslide inventory by 5 additional landslides, but also quantitatively determined the maximum annual deformation rate and deformation trend of individual landslides, laying a solid data foundation for hazard classification, early warning, and disaster reduction decision-making along the under-construction Sichuan–Tibet Railway corridor.
Table 2. Summary of Landslide Monitoring Data in the Jinsha River Batang Section.
No.Landslide NameLocation (Lat, Lon)Landslide Size (km2)Aspect (°)Maximum   v s (mm/yr)Risk TypePossible Triggers
H1The Nangoding landslide(29.56N, 99.06E)4.440272.8−74.41R *Rainfall
H2Xiayalong landslide(29.50N, 99.05E)0.147238.9−49.92-Rainfall
H3Lazaxi Landslide 1(29.48N, 99.06E)0.118226.6−46.63-Rainfall
H4Lazaxi Landslide 2(29.47N, 99.06E)0.033195.1−46.18-Rainfall
H5Landslide in Gongba Village(29.46N, 99.07E)0.213261.2−43.39BRainfall
H6Suwalong Township Landslide 1(29.45N, 99.06E)1.003255.9−48.94RRainfall
H7Suwalong Hydropower Station Landslide(29.43N, 99.04E)7.26466.7−89.56Rengineering activities
H8Suwalong Township Government landslide(29.42N, 99.07E)1.151291−52.62RRainfall
H9East Mudin Landslide(29.42N, 99.03E)0.851160.1−44.86-Rainfall
H10Biji Landslide(29.36N, 99.05E)4.84486.2−83.10RRainfall
H11Wang Dalong Landslide 1(29.33N, 99.07E)0.116264.7−66.99RRainfall
H12Landslide Wang Dalong 2(29.33N, 99.08E)0.434197.8−49.39BRainfall
H13Landslide Wang Dalong 3(29.31N, 99.08E)0.845272.3−42.60BRainfall
H14Landslide at the Wang Dalong Blocking the River Landslide(29.31N, 99.07E)0.381280.5−57.93RRainfall
H15Sarrisi Landslide (29.31N, 99.07E)0.43594.0−77.33RRainfall
H16Wang Dalong Landslide 4(29.30N, 99.07E)0.701267.3−72.87RRainfall
H17As many as Ding Landslide(29.29N, 99.06E)0.47441.8−73.59RRainfall
H18Landslide in Yudi Village, Changbo Commune(29.31N, 99.16E)0.762173.0−36.68BRainfall
H19Landslide at Changbo Central School(29.29N, 99.15E)0.051171.6−39.60BRainfall
H20Landslide in the village of Goran(29.29N, 99.13E)0.487139.7−43.24BRainfall
H21Landslide in Riwa Village(29.27N, 99.14E)0.349272.0−55.57BRainfall
H22Wang Dalong Landslide 5(29.26N, 99.10E)0.359230.7−63.58RRainfall
H23Lakangding Landslide(29.25N, 99.08E)2.95239−86.74RRainfall
H24Jond Landslide(29.23N, 99.11E)0.25778.3−84.63RRainfall
H25Diwu Town Landslide 1(29.23N, 99.12E)1.568269.4−53.61RRainfall
H26Landslide 1 in Yangla Township(29.19N, 99.09E)0.397256.2−42.88-Rainfall
H27Landslide in Gonghuo Village, Diwu Town(29.18N, 99.13E)0.826332.1−15.98BRainfall
H28Diwu Town Landslide 2(29.17N, 99.12E)0.848280.3−38.84RRainfall
H29Diwu Town Landslide 3(29.15N, 99.12E)1.827267.0−45.53RRainfall
H30Landslide in Bahu Village(29.13N, 99.14E)4.872221.4−89.45BRainfall
H31Landslide in Jia Xue Village(29.14N, 99.12E)0.307210.8−34.09-Rainfall
H32Bengadin landslide(29.12N, 99.11E)0.192100.7−50.56RRainfall
H33Landslide in the village of Resi(29.09N, 99.14E)1.61188.9−42.15BRainfall
H34Landslide above Daxia Long(29.59N, 99.03E)8.653236.1−80.63NRainfall
H35Bijixi Landslide(29.39N, 99.05E)0.77385.0−83.68NRainfall
H36Landslide at the head hub camp of the Changbo Power Station(29.36N, 99.06E)0.173267.8−63.95NRainfall
H37Grahunqu Landslide(29.3N, 99.04E)2.15790.9−60.91NRainfall
H38Nanagong landslide(29.12N, 99.08E)1.941110.5−51.85NRainfall
* Note: B represents potential for burying houses, R represents potential for river blocking, N represents newly added rapid deformation potential, and “-” means none of the above potentials exist.

5. Discussions

5.1. Comparative Analysis of SBAS and PS-InSAR

PS-InSAR relies on stable persistent scatterers such as exposed bedrock and artificial buildings to extract millimeter-scale LOS deformation. Its strengths lie in outstanding anti-noise performance and stable long-term deformation inversion. However, PS-InSAR heavily depends on high-quality persistent scatterers, resulting in sparse monitoring points in mountainous areas covered by thick vegetation and fractured rock masses. As for SBAS-InSAR, short temporal and spatial baselines are selected to suppress spatiotemporal decoherence. It can acquire denser monitoring points on vegetated slopes and broken rock, which fits alpine canyon conditions well. Nevertheless, SBAS is more susceptible to atmospheric phase disturbance, and its long-term deformation stability is slightly inferior to that of PS-InSAR.
The SBAS-InSAR and PS-InSAR techniques were cross-compared to evaluate the consistency and precision of ground deformation measurements [44]. Notably, this comparison relies only on mutual calculation of spatially coincident monitoring points of the two InSAR methods without independent field measurement data such as GNSS and leveling, so all error indicators reflect relative consistency between the two datasets rather than absolute measurement accuracy. The root mean square error (RMSE) is calculated with the formula:
R M S E = 1 N i = 1 N V P S , i V S B A S , i 2  
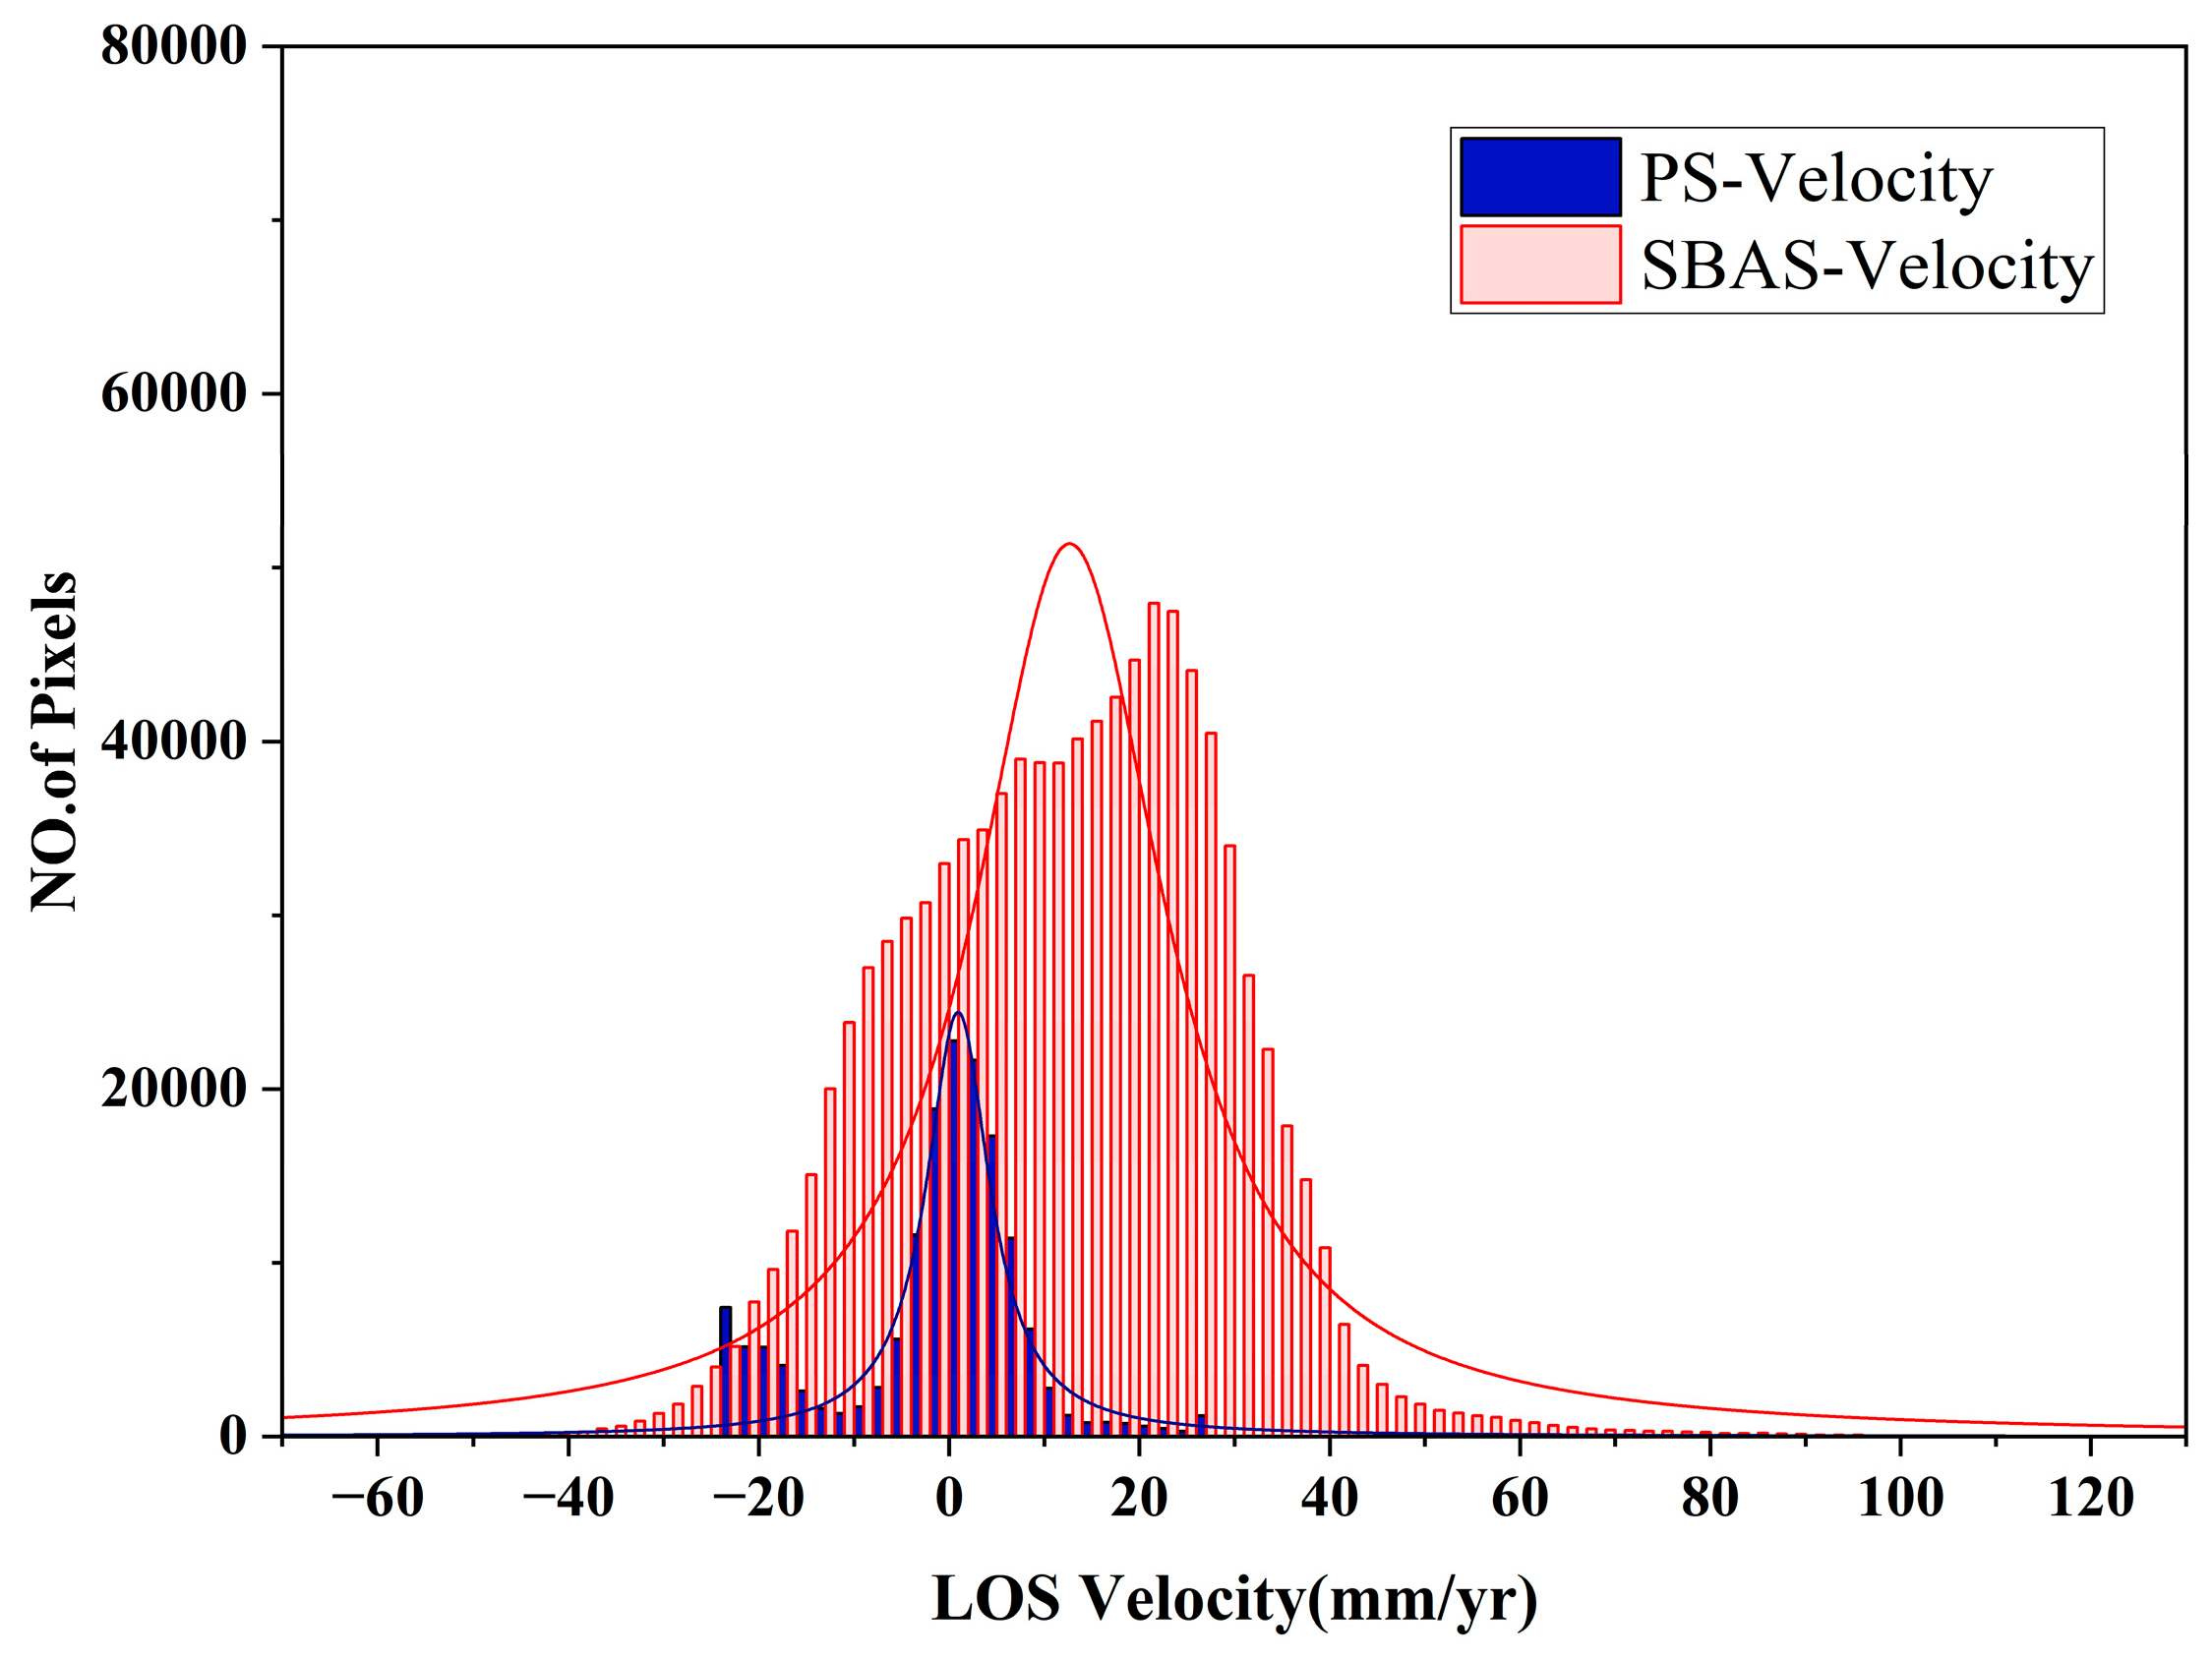
V P S , i and V S B A S , i refer to LOS deformation rates of matched PS and SBAS pixels; N is the total number of spatially matched pixel pairs, and the unit of RMSE is mm/yr. MuSigma is defined as the ratio of average deformation velocity (Mu) to deformation standard deviation (Sigma) of matched points, which characterizes the stability of deformation time series. Full sample information of matched points is counted uniformly in this section to guarantee statistical traceability. This evaluation focused primarily on three key indicators: scatterer density, deformation rate distribution, and time-series deformation analysis. This study found that the SBAS-InSAR method yielded significantly more time-series deformation data points than the PS-InSAR method. Within the 1408 km2 landslide study area, SBAS-InSAR yielded a total of 982,422 valid points, with a point density of 697 points/km2, whereas PS-InSAR only extracted 156,357 valid points. Figure 12 illustrates the point density distribution of PS and SBAS monitoring points relative to the LOS deformation rate. Overall, the SBAS point density curve exceeds that of PS across most deformation rate intervals; notably, in regions with deformation rates > 0 mm/yr, SBAS still maintains approximately 20,000 valid points, whereas the number of PS points declines rapidly, visually confirming that SBAS exhibits stronger spatial sampling capability in vegetated areas and rapid-deformation zones. Within the narrow rate interval of −22 to −24 mm/yr, the number of PS points reached 7428, which is higher than the 5184 points of SBAS; this discrepancy is attributed to the concentration of locally exposed bedrock and abundant stable scatterers within this interval. Across all other deformation rate intervals, the number of SBAS points is significantly higher than that of PS, further demonstrating the superior coverage advantage of SBAS in low-coherence environments of mountainous and canyon regions.
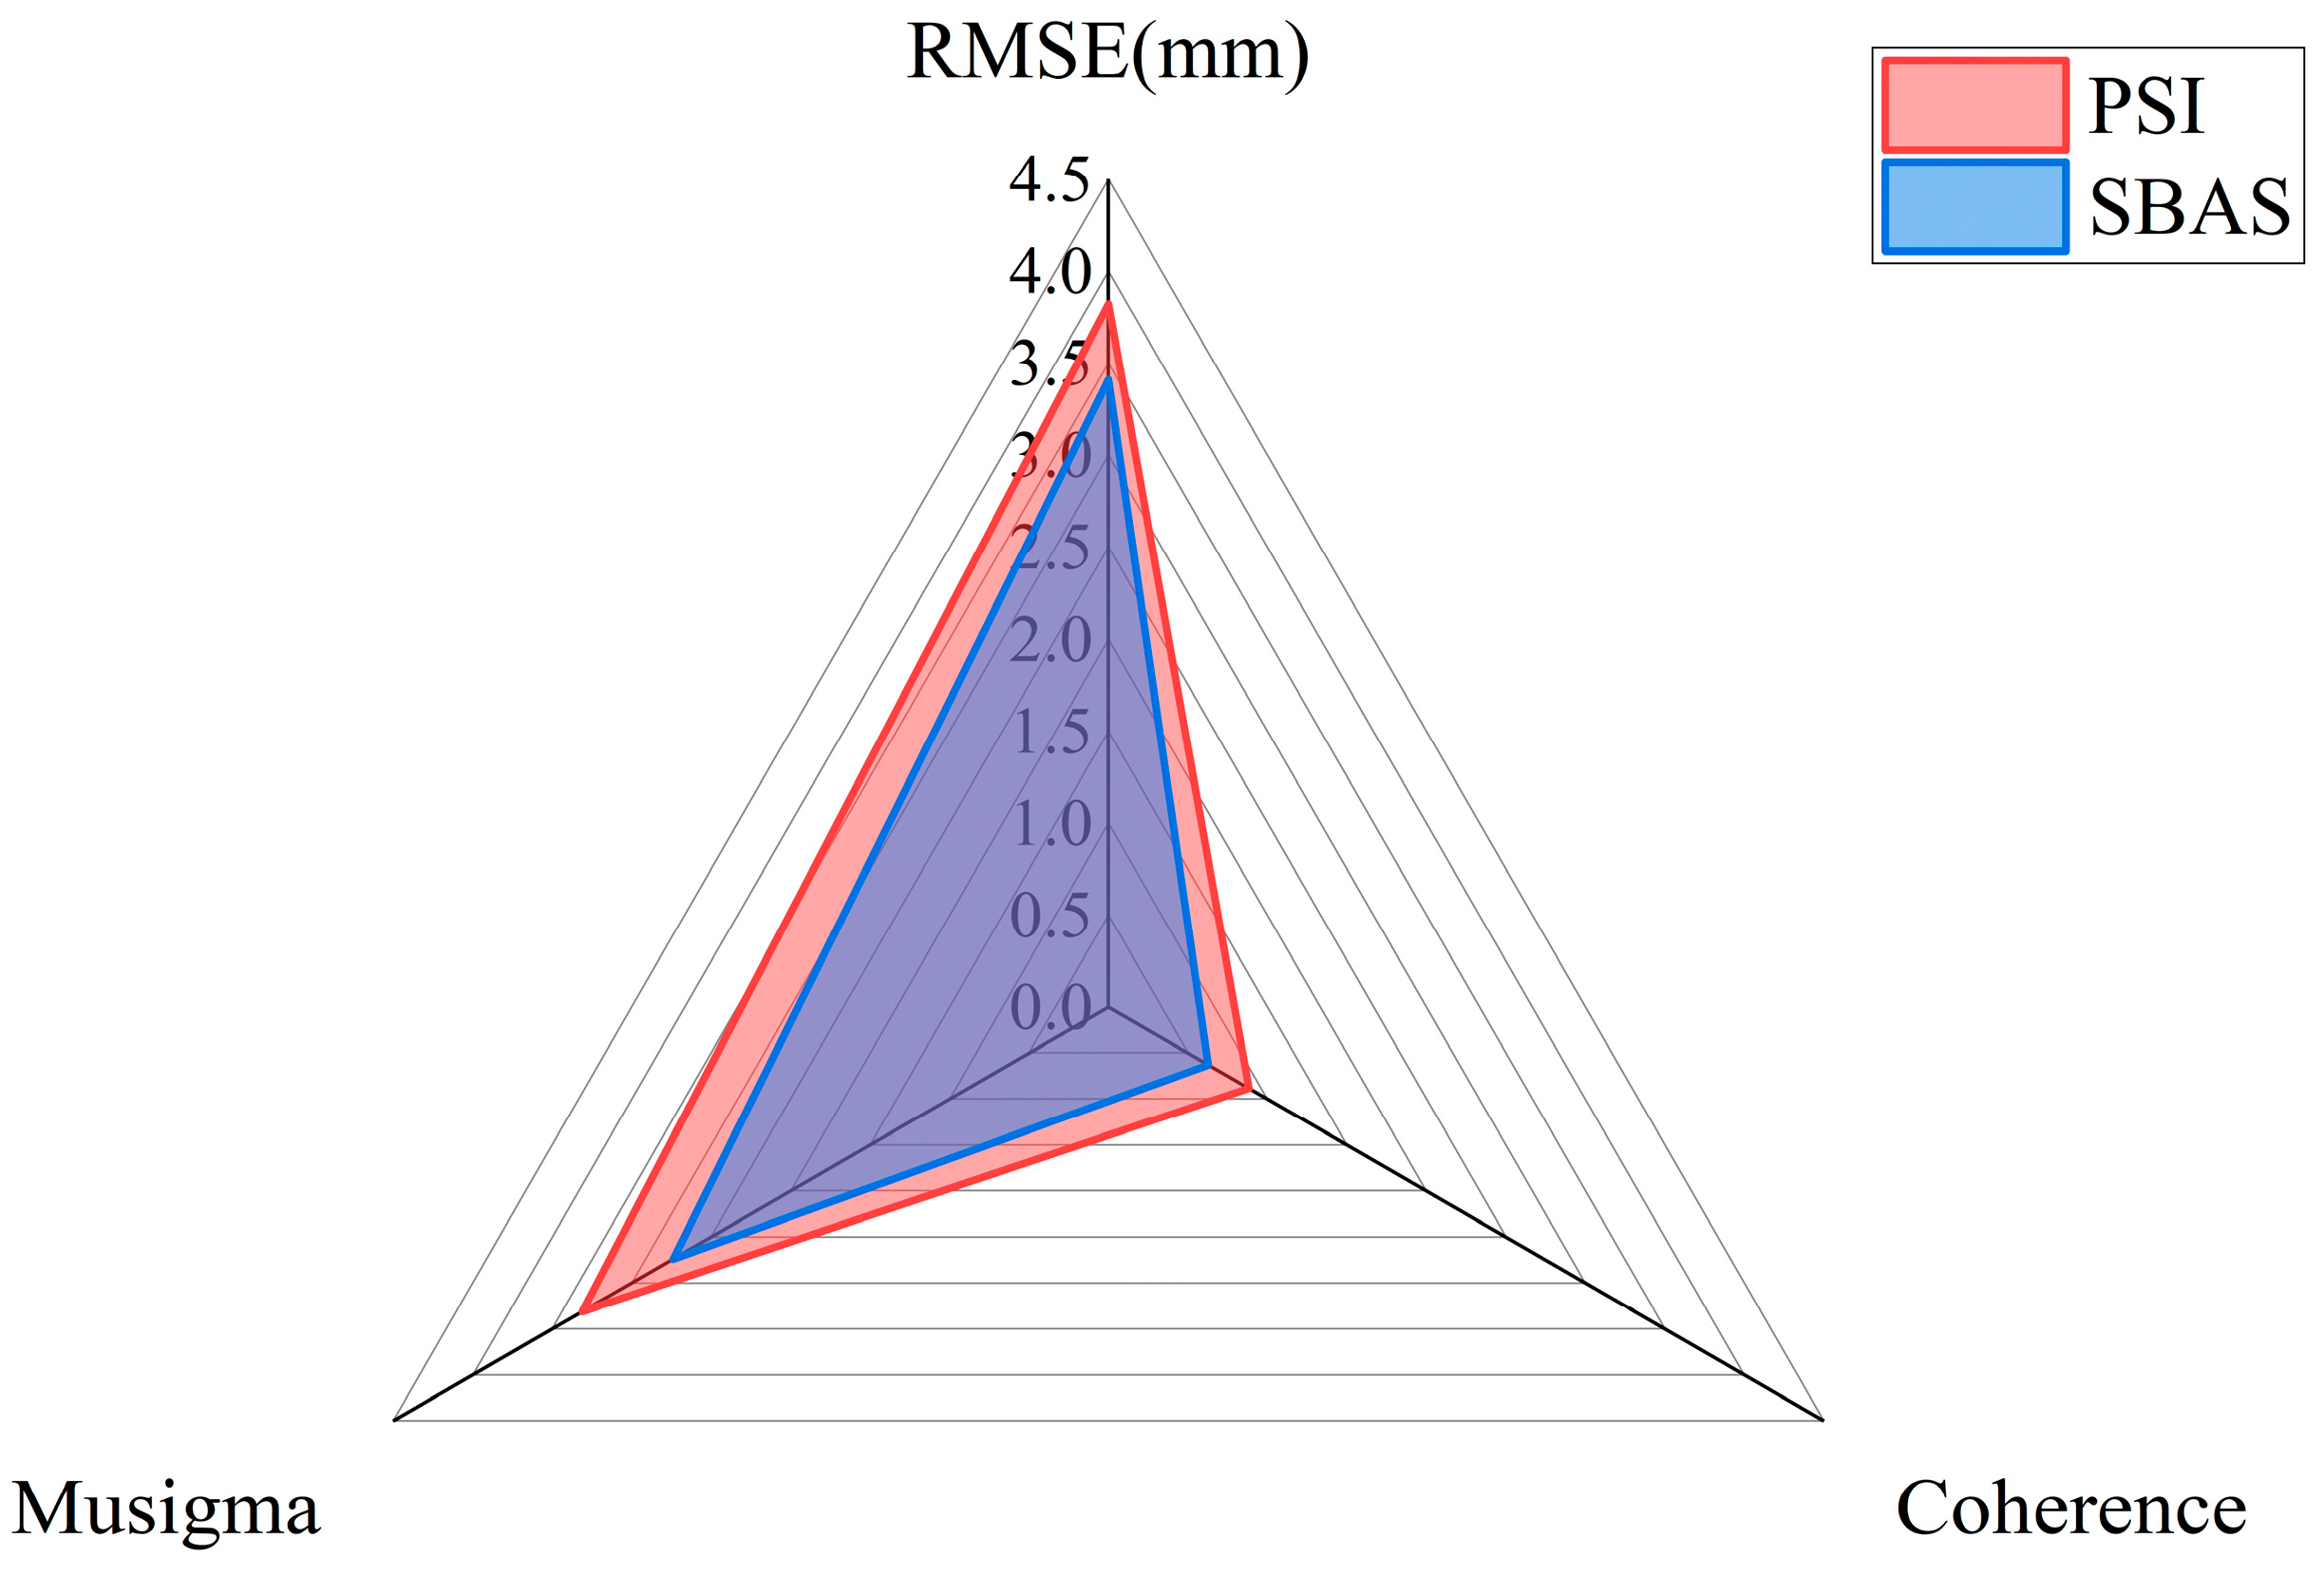
Figure 13 illustrates that the average coherence values of PS-InSAR and SBAS-InSAR are 0.88 and 0.62, respectively, confirming that PS-InSAR possesses a higher coherence level. The MuSigma value (2.74) and root mean square error (RMSE, 3.41) of SBAS-InSAR are both lower than the corresponding values of PS-InSAR (3.31 and 3.82, respectively), demonstrating that SBAS-InSAR outputs are more stable, with lower phase jitter, smaller residuals, higher linearity, and stronger reliability. By utilizing distributed scatterers and short-baseline strategies, SBAS-InSAR achieves wider spatial coverage and exhibits better performance in low-coherence regions such as mountainous gorges and complex terrain areas [35].
The elevation difference of valley slopes in the Batang reach exceeds 2000 m, with slope aspects varying drastically; single-geometry SAR data is highly prone to generating systematic blind spots due to layover, shadow, or top-bottom inversion [58,59,60,61,62,63,64,65]. In this study, an ascending- and descending-track data complementarity strategy was adopted to independently process SBAS-InSAR using the same image stack, and systematic bias correction was performed on both banks of the canyon using high-precision PS scatterers. This approach quantitatively validates the regulatory effect of radar viewing geometry on canyon landslide detectability, and provides a unified, reliable benchmark for the risk ranking of individual landslides.

5.2. Analysis of Landslide Development Parameters in the Batang Section

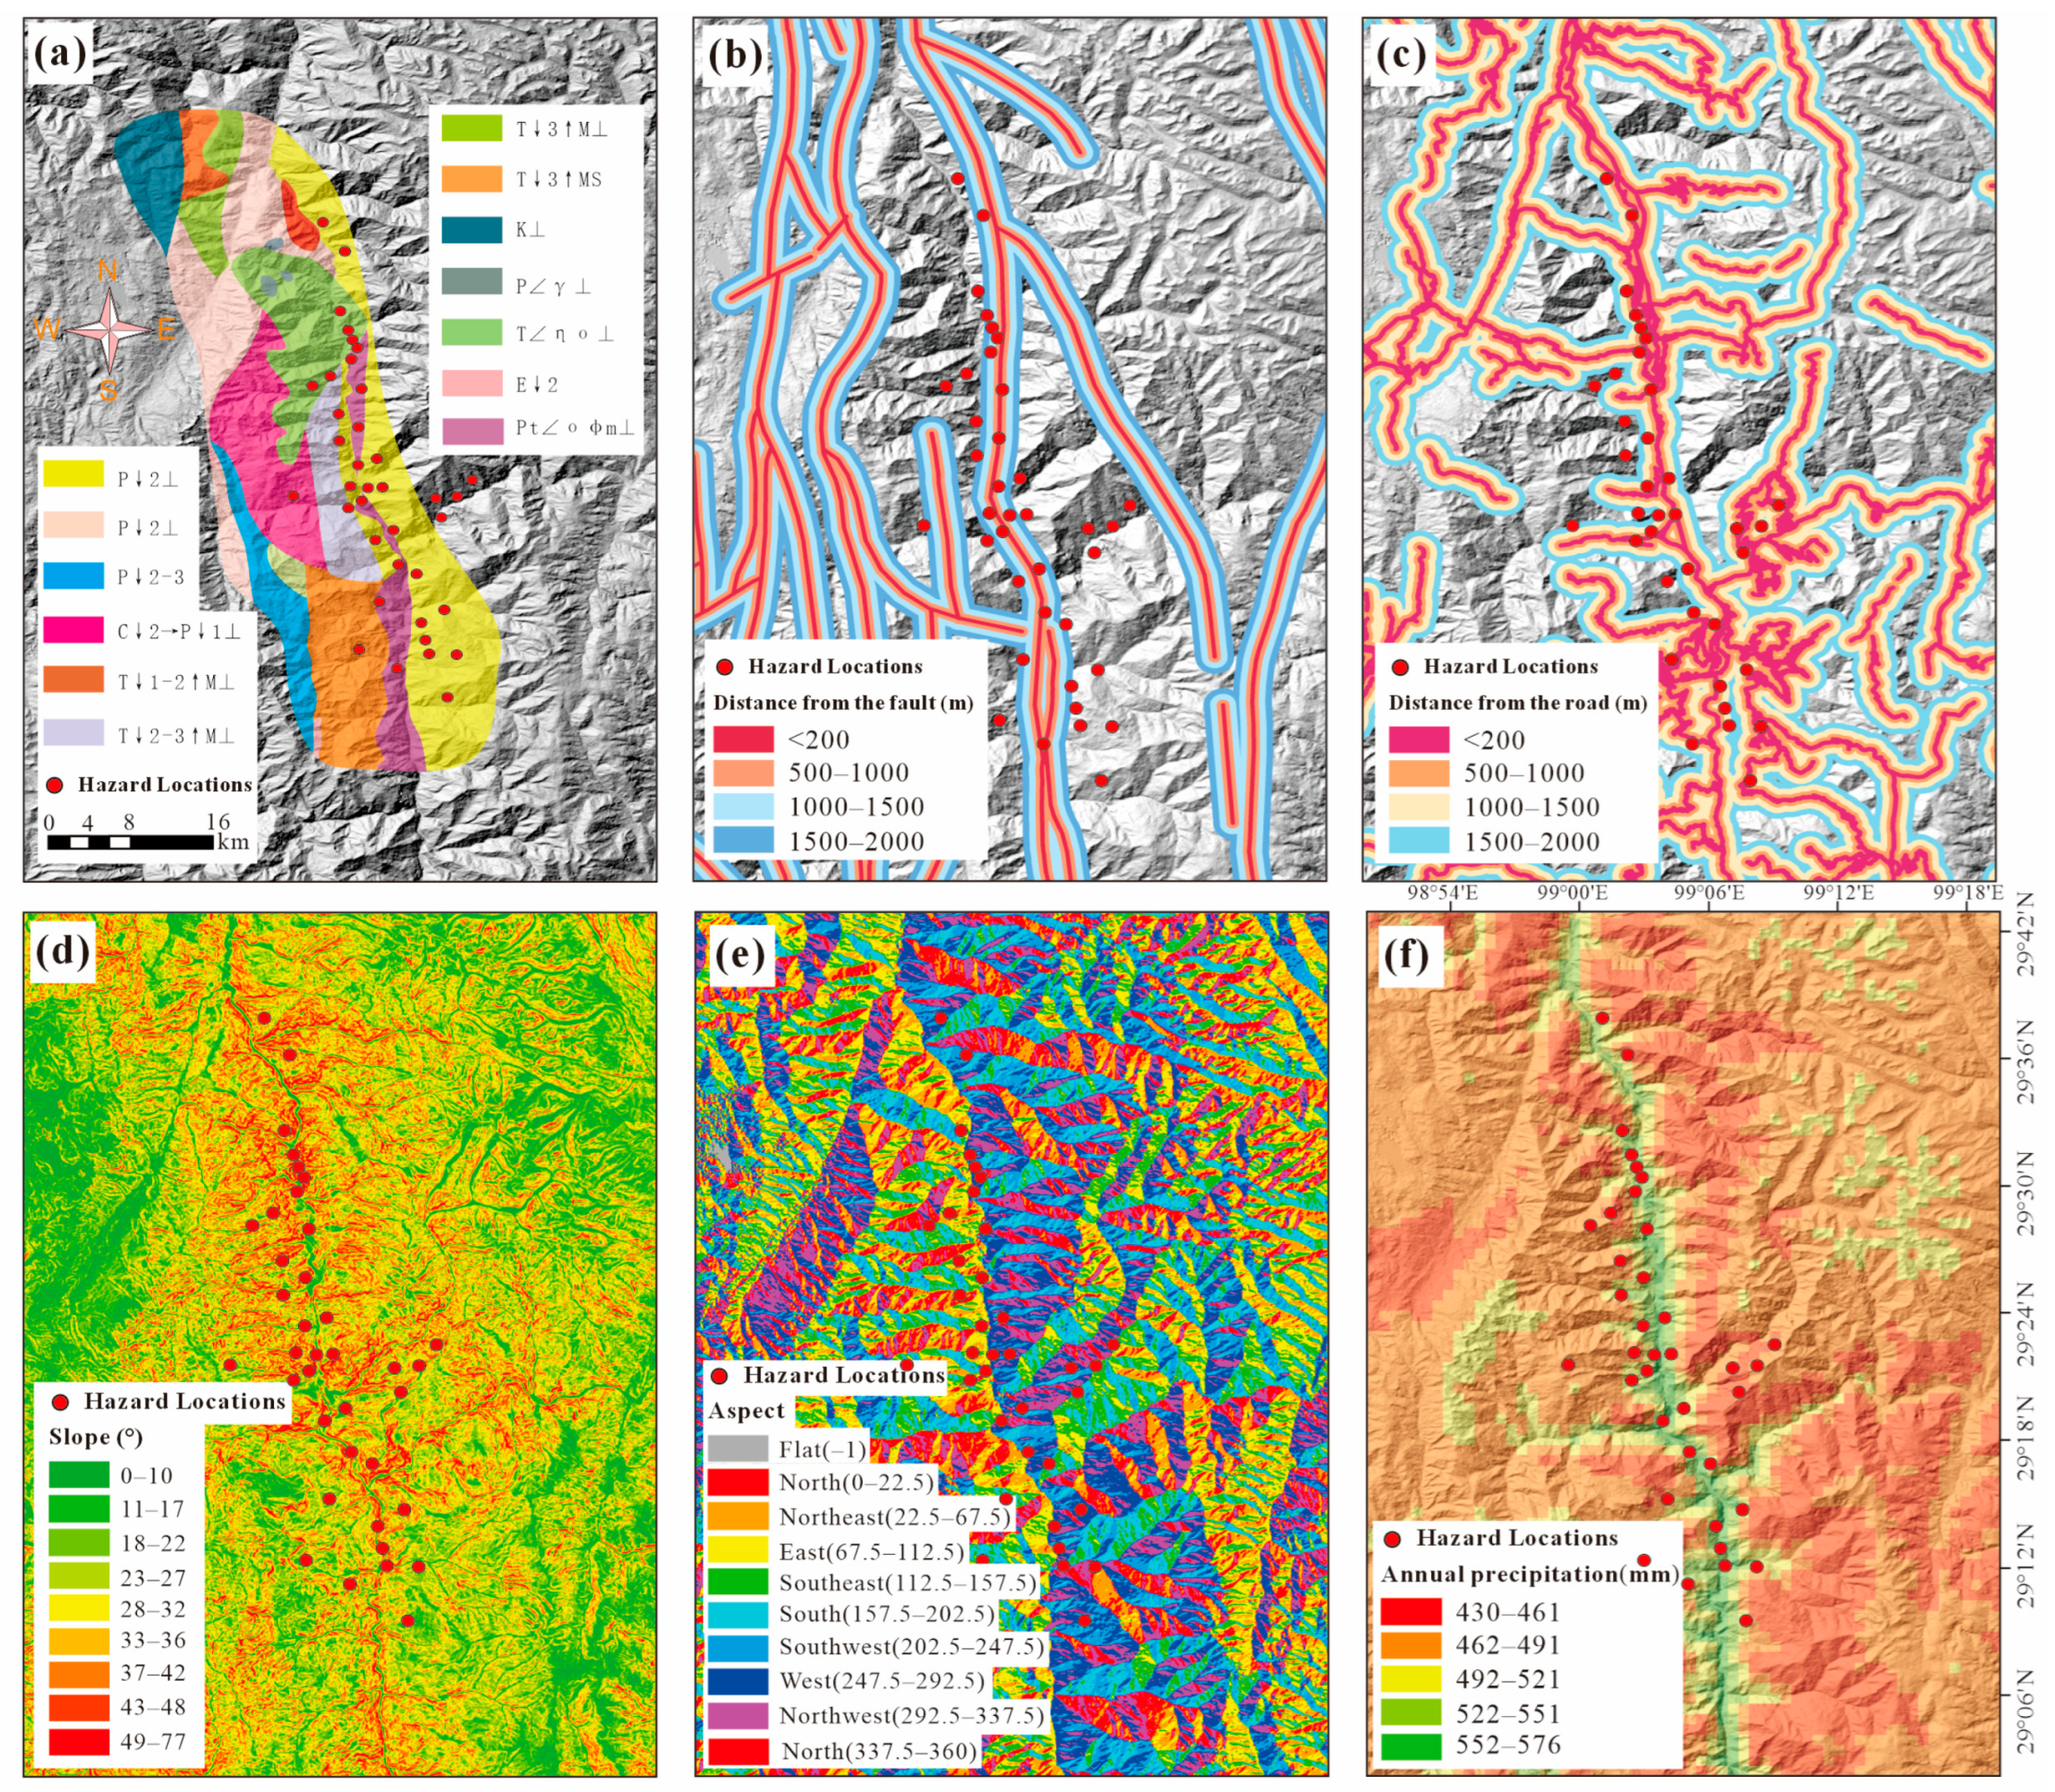
Based on the analysis of landslide influencing factors presented in Figure 14, this study identified the key controlling elements governing the spatial distribution of landslides. Lithology constitutes the fundamental geological background governing landslide distribution. Of the 38 identified landslide sites, 17 are concentrated in the weak lithological successions of the Middle Permian Changdu Mangcuo Formation and Jiaoga Formation. This stratigraphic succession is dominated by quartz sandstone, siltstone, shale and limestone, with local outcrops of basic volcanic rocks, and exhibits high landslide susceptibility. Additionally, 10 landslide sites are situated within the Permian-Triassic Jinsha River ophiolitic mélange zone, and 5 are distributed in Triassic quartz diorite outcrops. The influence of human engineering activities and tectonic activity is substantial, with the vast majority of landslide sites distributed within 500 m of the Jinsha River West Branch Fault. Meanwhile, over 90% of landslide sites are situated within 200 m of roads, strongly indicating that road excavation constitutes a major triggering factor for landslide occurrence. Topographic analysis reveals that landslides predominantly occur on steep slopes with a gradient exceeding 30°. Slope aspect distribution characteristics indicate that landslide sites are nearly evenly distributed along both banks of the Jinsha River (west-facing and east-facing slopes), with only a few being south-facing slopes. In terms of hydroclimatic conditions, most landslide sites are situated in areas with annual rainfall exceeding 500 mm, indicating the facilitating effect of precipitation on landslide initiation. In summary, landslides in the study area are the product of the combined effects of specific weak rock strata, proximity to active faults, intense artificial slope excavation, steep topography, and abundant precipitation.

6. Conclusions

This study focused on the alpine canyon region of the Jinsha River Basin, addressing the key challenge of landslide monitoring under complex terrain and dense vegetation cover conditions. By integrating ascending- and descending-track SBAS-InSAR and PS-InSAR techniques, this study performed regional surface deformation monitoring and active landslide identification. The spatial distribution characteristics, temporal deformation evolution patterns, and multi-factor coupling control mechanisms of landslides were systematically analyzed. The main conclusions are as follows:
(1)
The SBAS-InSAR technique exhibits stronger applicability in alpine canyon areas with dense vegetation cover compared with PS-InSAR, with an effective monitoring point density of 697 points/km2 (6.28 times that of PS-InSAR). Calibration with high-precision PS scatterers effectively alleviates geometric distortion blind zones within the study area. Furthermore, the deformation inversion results of this technique yield an RMSE of 3.41 and a MuSigma value of 2.74, both lower than those of PS-InSAR, confirming the significant advantages of the ascending- and descending-track SBAS-InSAR integration strategy in obtaining continuous and reliable deformation fields in complex terrain regions.
(2)
An active landslide inventory was successfully established, with a total of 38 potential landslides identified, including 17 river-blocking risk landslides, 10 landslides directly threatening residential buildings, and 5 newly discovered hazardous sites. Quantitative results reveal that the average annual deformation rate of landslides ranges from −111.8 to +41.6 mm/yr, providing a key data foundation for regional risk classification and precise prevention and control.
(3)
The development and occurrence of landslides are controlled by multi-factor coupling effects. Spatially, landslides are concentrated within 500 m of the Jinsha River West Branch Fault, weak lithological zones such as altered ophiolitic mélange, slopes with a gradient exceeding 30°, and adjacent to highway cut-slope projects. Temporally, landslide deformation displays an evident correlation with rainfall, and around 70% of annual cumulative deformation takes place in the rainy season. Meanwhile, hydropower reservoir impoundment and other engineering activities appear to be linked to elevated deformation rates of local landslides.
The integrated application of ascending- and descending-track SBAS-InSAR and PS-InSAR techniques improves landslide detection consistency, clearly characterizes the temporal deformation evolution of landslides, and provides key evidence for identifying deformation acceleration trends and high-risk hazard areas. The research results highlight the importance of establishing a long-term continuous monitoring and early warning system in this high-risk strategic region, providing replicable scientific support for the safety assurance of major strategic corridors such as the Sichuan–Tibet Railway and regional disaster reduction and governance.

Author Contributions

Conceptualization, F.R.; methodology, Y.L. (Yansong Liu); software, F.R.; validation, Y.H. and Y.W.; formal analysis, X.L.; investigation, F.R.; resources, Y.L. (Yansong Liu); data curation, S.C. and H.D.; writing—original draft preparation, F.R.; writing—review and editing, Y.L. (Yansong Liu); visualization, Y.L. (Yansong Liu); supervision, B.H., Y.L. (Yi Luo), and M.X.; funding acquisition, Y.L. (Yansong Liu). All authors have read and agreed to the published version of the manuscript.

Funding

This research was funded by the Sichuan Provincial Department of Natural Resources (Grant No. KJ-2016-07); the Innovation Fund for University Teachers of the Gansu Provincial Department of Education (Grant No. 2023A-253); the Sichuan Provincial Department of Education (Grant No. 18ZB0065); and the Tibet Autonomous Region Science and Technology Program (Grant No. XZ202501YD0004).

Data Availability Statement

The Sentinel-1 datasets used in this study were provided by Copernicus and the European Space Agency (ESA) (https://vertex.daac.asf.alaska.edu (accessed on 14 March 2026)). The DEM data were obtained from ALOS World 3D-30m, which is freely provided by the Japan Aerospace Exploration Agency (JAXA) (https://www.eorc.jaxa.jp/ALOS/en/aw3d30/registration.htm (accessed on 20 February 2026)). The 0.5-m-resolution Google Earth optical images were acquired for the period 2023–2025 (https://earth.google.com/web/ (accessed on 1 March 2026)). Rainfall data were sourced from the National Tibetan Plateau Data Center, China (https://data.tpdc.ac.cn/ (accessed on 7 March 2026)).

Acknowledgments

The authors sincerely thank the European Space Agency (ESA) for providing Sentinel-1 radar satellite data. The authors thank the Japan Aerospace Exploration Agency (JAXA) for providing the DEM data free of charge. The authors thank Google Earth for providing high-resolution optical imagery for interpretation and validation. The authors thank the Chinese Academy of Sciences for providing rainfall records. The authors also thank the anonymous reviewers for their valuable comments.

Conflicts of Interest

Authors Mingyuan Xu was affiliated by the company Sichuan Sumhope Spatial Technology Co., Ltd. The remaining authors declare that the research was conducted in the absence of any commercial or financial relationships that could be construed as a potential conflict of interest.

References

  1. Zhou, S.; Chen, B.; Lu, H.; Shan, Y.; Li, Z.; Li, P.; Cao, X.; Li, W. Analysis of the spatial distribution and deformation types of active landslides in the upper Jinsha River, China, using integrated remote sensing technologies. Remote Sens. 2024, 16, 100. [Google Scholar] [CrossRef] [Scilit]
  2. Liu, X.; Zhao, C.; Zhang, Q.; Lu, Z.; Li, Z.; Yang, C.; Zhu, W.; Liu-Zeng, J.; Chen, L.; Liu, C. Integration of Sentinel-1 and ALOS/PALSAR-2 SAR datasets for mapping active landslides along the Jinsha River corridor, China. Eng. Geol. 2021, 284, 106033. [Google Scholar] [CrossRef] [Scilit]
  3. Zhao, W.; Wang, F.; Xu, Q.; Zhao, J.; Zhang, F.; Li, W.; Dong, X.; Yang, J.; Guo, D.; He, W. Identification, distribution, and mechanisms of large landslides in the upper reaches of Jinsha River. Bull. Eng. Geol. Environ. 2025, 84, 199. [Google Scholar] [CrossRef] [Scilit]
  4. Hu, G.; Tian, S.; Chen, N.; Liu, M.; Somos-Valenzuela, M. An effectiveness evaluation method for debris flow control engineering for cascading hydropower stations along the Jinsha River, China. Eng. Geol. 2020, 266, 105472. [Google Scholar] [CrossRef] [Scilit]
  5. Li, Y.; Yao, A.; Gong, Y. Deformation and Failure Mechanism of a Massive Ancient Anti-Dip River-Damming Landslide in the Upper Jinsha River. Sustainability 2022, 14, 13048. [Google Scholar] [CrossRef] [Scilit]
  6. Sun, X.; Chen, J.; Li, Y.; Rene, N.N. Landslide susceptibility mapping along a rapidly uplifting river valley of the upper Jinsha River, southeastern Tibetan Plateau, China. Remote Sens. 2022, 14, 1730. [Google Scholar] [CrossRef] [Scilit]
  7. Qi, T.; Meng, X.; Qing, F.; Zhao, Y.; Shi, W.; Chen, G.; Zhang, Y.; Li, Y.; Yue, D.; Su, X.; et al. Distribution and characteristics of large landslides in a fault zone: A case study of the NE Qinghai-Tibet Plateau. Geomorphology 2021, 379, 107592. [Google Scholar] [CrossRef] [Scilit]
  8. Zhong, J.; Li, Q.; Zhang, J.; Luo, P.; Zhu, W. Risk assessment of geological landslide hazards using D-InSAR and remote sensing. Remote Sens. 2024, 16, 345. [Google Scholar] [CrossRef] [Scilit]
  9. Gariano, S.L.; Guzzetti, F. Landslides in a changing climate. Earth-Sci. Rev. 2016, 162, 227–252. [Google Scholar] [CrossRef] [Scilit]
  10. Larsen, I.J.; Montgomery, D.R. Landslide erosion coupled to tectonics and river incision. Nat. Geosci. 2012, 5, 468–471. [Google Scholar] [CrossRef] [Scilit]
  11. Gao, X.; Wang, B.; Dai, W.; Liu, Y. Bayesian Network-Based Landslide Susceptibility Safe Route Assessment in the Face of Uncertain Knowledge and Various Information. IEEE Access 2025, 13, 46190–46209. [Google Scholar] [CrossRef] [Scilit]
  12. Zhang, Y.; Meng, X.M.; Dijkstra, T.A.; Jordan, C.J.; Chen, G.; Zeng, R.Q.; Novellino, A. Forecasting the magnitude of potential landslides based on InSAR techniques. Remote Sens. Environ. 2020, 241, 111738. [Google Scholar] [CrossRef] [Scilit]
  13. Chen, B.; Li, Z.; Song, C.; Tomás, R.; Yu, C.; Zhu, W.; Peng, J. Unveiling the long-term cascading effects of the 2018 Baige landslide and subsequent outburst flood with satellite radar observations. Remote Sens. Environ. 2026, 334, 115231. [Google Scholar] [CrossRef] [Scilit]
  14. He, J.; Wen, B.; Zhang, Y.; Sun, F.; Zhang, L.; Yang, X.; Tong, B. Residential community-based quantitative risk assessment of rainfall-induced loess landslides for the suburban residential areas of Chengguan district in Lanzhou city with an innovative framework. Eng. Geol. 2026, 369, 108785. [Google Scholar] [CrossRef] [Scilit]
  15. Bekaert, D.P.S.; Handwerger, A.L.; Agram, P.; Kirschbaum, D.B. InSAR-based detection method for mapping and monitoring slow-moving landslides in remote regions with steep and mountainous terrain: An application to Nepal. Remote Sens. Environ. 2020, 249, 111983. [Google Scholar] [CrossRef] [Scilit]
  16. Budukumah, E.J.; Dai, C.L.; McColl, S.; Higman, B.; Howat, I.; Lu, Z.; Sui, Q.Y.; Hults, C. Detection of slow-moving landslides using satellite imagery at the Glacier Bay National Park and Preserve. Landslides 2026, 23, 2511–2519. [Google Scholar] [CrossRef] [Scilit]
  17. Dong, J.; Liao, M.; Xu, Q.; Zhang, L.; Tang, M.; Gong, J. Detection and displacement characterization of landslides using multitemporal satellite SAR interferometry: A case study of Danba County in the Dadu River Basin. Eng. Geol. 2018, 240, 95–109. [Google Scholar] [CrossRef] [Scilit]
  18. Shi, X.; Zhang, L.; Zhou, C.; Li, M.; Liao, M. Retrieval of time series three-dimensional landslide surface displacements from multi-angular SAR observations. Landslides 2018, 15, 1015–1027. [Google Scholar] [CrossRef] [Scilit]
  19. Liu, Z.; Qiu, H.; Ma, S.; Yang, D.; Pei, Y.; Du, C.; Sun, H.; Hu, S.; Zhu, Y. Surface displacement and topographic change analysis of the Changhe landslide on September 14, 2019, China. Landslides 2021, 18, 1471–1483. [Google Scholar] [CrossRef] [Scilit]
  20. Sun, Q.; Du, L.Z.; Zhang, W.; Chen, J.Q.; Wang, J.; Zhang, H.; Qin, Y.; Yin, H.; Zhao, Y.P. Investigation into the evolutionary mechanisms of catastrophic bedding rock landslides in deeply incised canyon regions: A case study of the Zhisi Mountain landslide. Landslides 2025, 22, 2677–2692. [Google Scholar] [CrossRef] [Scilit]
  21. Ding, C.; Feng, G.; Liao, M.; Tao, P.; Zhang, L.; Xu, Q. Displacement history and potential triggering factors of Baige landslides, China revealed by optical imagery time series. Remote Sens. Environ. 2021, 254, 112253. [Google Scholar] [CrossRef] [Scilit]
  22. Sun, Q.; Hu, J.; Zhang, L.; Ding, X. Towards slow-moving landslide monitoring by integrating multi-sensor InSAR time series datasets: The Zhouqu case study, China. Remote Sens. 2016, 8, 908. [Google Scholar] [CrossRef] [Scilit]
  23. Zhang, Y.; Meng, X.; Jordan, C.; Novellino, A.; Dijkstra, T.; Chen, G. Investigating slow-moving landslides in the Zhouqu region of China using InSAR time series. Landslides 2018, 15, 1299–1315. [Google Scholar] [CrossRef] [Scilit]
  24. Barla, G.; Antolini, F.; Barla, M.; Mensi, E.; Piovano, G. Monitoring of the Beauregard landslide (Aosta Valley, Italy) using advanced and conventional techniques. Eng. Geol. 2010, 116, 218–235. [Google Scholar] [CrossRef] [Scilit]
  25. Biggs, J.; Wright, T.J. How satellite InSAR has grown from opportunistic science to routine monitoring over the last decade. Nat. Commun. 2020, 11, 3863. [Google Scholar] [CrossRef] [Scilit] [PubMed]
  26. Wu, Z.; Xiao, R.; Jiang, M.; Ferreira, V.G. Characterizing the spatial structure and aliasing effect of ocean tide loading on InSAR measurements. Remote Sens. Environ. 2024, 311, 114297. [Google Scholar] [CrossRef] [Scilit]
  27. Hooper, A. A multi-temporal InSAR method incorporating both persistent scatterer and small baseline approaches. Geophys. Res. Lett. 2008, 35, L16302. [Google Scholar] [CrossRef] [Scilit]
  28. Cheng, Y.; Pang, H.; Li, Y.; Fan, L.; Wei, S.; Yuan, Z.; Fang, Y. Applications and advancements of spaceborne InSAR in landslide monitoring and susceptibility mapping: A systematic review. Remote Sens. 2025, 17, 999. [Google Scholar] [CrossRef] [Scilit]
  29. Zhu, Y.; Qiu, H.; Liu, Z.; Wang, J.; Yang, D.; Pei, Y.; Ma, S.; Du, C.; Sun, H.; Wang, L. Detecting long-term deformation of a loess landslide from the phase and amplitude of satellite SAR images: A retrospective analysis for the closure of a tunnel event. Remote Sens. 2021, 13, 4841. [Google Scholar] [CrossRef] [Scilit]
  30. Dong, J.; Zhang, L.; Tang, M.; Liao, M.; Xu, Q.; Gong, J.; Ao, M. Mapping landslide surface displacements with time series SAR interferometry by combining persistent and distributed scatterers: A case study of Jiaju landslide in Danba, China. Remote Sens. Environ. 2018, 205, 180–198. [Google Scholar] [CrossRef] [Scilit]
  31. Zhu, Z.; Yuan, X.; Gan, S.; Zhang, J.; Zhang, X. A research on a new mapping method for landslide susceptibility based on SBAS-InSAR technology. Egypt. J. Remote Sens. Space Sci. 2023, 26, 1046–1056. [Google Scholar] [CrossRef] [Scilit]
  32. Du, J.; Li, Z.; Song, C.; Zhu, W.; Tomás, R. Coupling effect of impoundment and irrigation on landslide movement in Maoergai Reservoir area revealed by multi-platform InSAR observations. Int. J. Appl. Earth Obs. Geoinf. 2024, 129, 103802. [Google Scholar] [CrossRef] [Scilit]
  33. Zheng, W.B.; Fan, W.; Cao, Y.B.; Zhang, S.L.; Liang, X.; Jing, P.X. Spatial distribution and reactivation assessment of ancient landslides in the Qinling-Daba Mountains: Insights from SBAS-InSAR analysis. Landslides 2026, 23, 2493–2510. [Google Scholar] [CrossRef] [Scilit]
  34. Zhu, Y.F.; Hu, C.X.; Zhou, Z.K.; Yao, X.; Wei, Y.; Lu, Z.; Wang, L.J.; Liu, X.J.; Wang, D.; Wu, J.X. Using SBAS-InSAR and audio-magnetotelluric sounding to characterize two-dimensional deformation and failure mechanisms in mining-induced landslides: A case study from Leji. Landslides 2026, 23, 755–772. [Google Scholar] [CrossRef] [Scilit]
  35. Zhang, J.M.; Zuo, X.Q.; Li, Y.F.; Shi, M.Y.; Shi, C.; Huang, C.; Tang, X.F. Detection and assessment of potential landslides in the Xiaojiang River Basin using SBAS-InSAR. Sci. Rep. 2025, 15, 16082. [Google Scholar] [CrossRef] [Scilit] [PubMed]
  36. Rajabi, A.M.; Salehi, M.; Sohbi Bidar, A. Groundwater over-exploitation and land subsidence in Tehran, Iran: A comprehensive assessment of causes and impacts. J. Mt. Sci. 2026, 23, 1476–1492. [Google Scholar] [CrossRef] [Scilit]
  37. Yu, H.; Zhong, N.; Zhang, X.B.; Yang, Z.; Yu, X.; Wu, R.A.; Wang, Y.; Yang, Z.H.; Guo, C.B.; Li, H.B. A preliminary exploration of active fault identification methods in the deep-cut river valley region: A case study of the Batang fault. Acta Geol. Sin. 2025, 99, 2479–2492. [Google Scholar]
  38. Yang, Z.H.; Guo, C.B.; Wu, R.A.; Zhong, N.; Ren, S.S. Predicting seismic landslide hazard in the Batang fault zone of the Qinghai-Tibet Plateau. Hydrogeol. Eng. Geol. 2021, 48, 91–101. [Google Scholar]
  39. Tadono, T.; Nagai, H.; Ishida, H.; Oda, F.; Naito, S.; Minakawa, K.; Iwamoto, H. Generation of the 30 m-mesh global digital surface model by ALOS PRISM. Int. Arch. Photogramm. Remote Sens. Spat. Inf. Sci. 2016, XLI-B4, 157–162. [Google Scholar] [CrossRef] [Scilit]
  40. Dong, J.H.; Niu, R.Q.; Li, B.Q.; Xu, H.; Wang, S.Y. Potential landslides identification based on temporal and spatial filtering of SBAS-InSAR results. Geomat. Nat. Hazards Risk 2023, 14, 52–75. [Google Scholar] [CrossRef] [Scilit]
  41. Kanwar, M.; Pokharel, B.; Lim, S. Application of Persistent Scatterer Interferometry to monitor land motion along radar line of sight in landslide-prone areas of Himachal Pradesh, India. Geomat. Nat. Hazards Risk. 2024, 15, 2362404. [Google Scholar] [CrossRef] [Scilit]
  42. Navarro-Sanchez, V.D.; Lopez-Sanchez, J.M.; Ferro-Famil, L. Polarimetric approaches for persistent scatterers interferometry. IEEE Trans. Geosci. Remote Sens. 2014, 52, 1667–1676. [Google Scholar] [CrossRef] [Scilit]
  43. Ferretti, A.; Fumagalli, A.; Novali, F.; Prati, C.; Rocca, F.; Rucci, A. A new algorithm for processing interferometric data-stacks: SqueeSAR. IEEE Trans. Geosci. Remote Sens. 2011, 49, 3460–3470. [Google Scholar] [CrossRef] [Scilit]
  44. Hussain, S.; Pan, B.; Hussain, W.; Sajjad, M.M.; Ali, M.; Afzal, Z.; Abdullah-Al-Wadud, M.; Tariq, A. Integrated PSInSAR and SBAS-InSAR analysis for landslide detection and monitoring. Phys. Chem. Earth. 2025, 139, 103956. [Google Scholar] [CrossRef] [Scilit]
  45. Zhang, K.; Zhao, Y.; Confuciorto, P.; Moretti, S.; Fibbi, G.; Ling, C.; Xu, D.; Guo, J.; Zhao, L. Ground residual subsidence during post-mining period based on Sentinel-1 and PS-InSAR technology: The Shendong coal field (China) case study. Geomech. Geophys. Geo-Energy Geo-Resour. 2025, 12, 30. [Google Scholar] [CrossRef] [Scilit]
  46. Carla, T.; Gigli, G.; Lombardi, L.; Nocentini, M.; Meier, L.; Schmid, L.; Wahlen, S.; Casagli, N. Real-time detection and management of rockfall hazards by ground-based Doppler radar. Landslides 2024, 21, 155–163. [Google Scholar] [CrossRef] [Scilit]
  47. Goldstein, R.M.; Werner, C.L. Radar interferogram filtering for geophysical applications. Geophys. Res. Lett. 1998, 25, 4035–4038. [Google Scholar] [CrossRef] [Scilit]
  48. Rehman, M.U.; Zhang, Y.; Meng, X.; Su, X.; Catani, F.; Rehman, G.; Yue, D.; Khalid, Z.; Ahmad, S.; Ahmad, I. Analysis of landslide movements using interferometric synthetic aperture radar: A case study in Hunza-Nagar valley, Pakistan. Remote Sens. 2020, 12, 2054. [Google Scholar] [CrossRef] [Scilit]
  49. Lee, J.-C.; Shirzaei, M. Novel algorithms for pair and pixel selection and atmospheric error correction in multitemporal InSAR. Remote Sens. Environ. 2023, 286, 113447. [Google Scholar] [CrossRef] [Scilit]
  50. Montazeri, S.; Rodríguez González, F.; Zhu, X.X. Geocoding error correction for InSAR point clouds. Remote Sens. 2018, 10, 1523. [Google Scholar] [CrossRef] [Scilit]
  51. Kang, X.; Wang, S.; Wu, W.; Xu, G. Residual state rate effects of shear-zone soil regulating slow-to-fast transition of catastrophic landslides. Eng. Geol. 2022, 304, 106692. [Google Scholar] [CrossRef] [Scilit]
  52. Li, W.; Zhan, W.; Lu, H.; Xu, Q.; Pei, X.; Huang, R.; Ge, D. Precursors to large rockslides visible on optical remote-sensing images and their implications for landslide early detection. Landslides 2023, 20, 121–138. [Google Scholar] [CrossRef] [Scilit]
  53. Cheng, Z.; Gong, W.; Jaboyedoff, M.; Chen, J.; Derron, M.-H.; Zhao, F. Landslide identification in UAV images through recognition of landslide boundaries and ground surface cracks. Remote Sens. 2025, 17, 1900. [Google Scholar] [CrossRef] [Scilit]
  54. Yu, W.; Li, W.; Wu, Z.; Lu, H.; Xu, Z.; Wang, D.; Dong, X.; Li, P. Integrated remote sensing investigation of suspected landslides: A case study of the genie slope on the Tibetan Plateau, China. Remote Sens. 2024, 16, 2412. [Google Scholar] [CrossRef] [Scilit]
  55. Guo, A.Q.; Hu, J.; Sun, Q.; Zhou, D.N.; Chen, Y.H.; Zheng, W.J.; Han, B.; Li, J.F. Revealing Hidden Deformation Patterns in Shallow Creeping Landslides: A Data-Driven InSAR Phase Filtering Method Addressing Geometric Distortions. IEEE Trans. Geosci. Remote Sens. 2025, 63, 5214822. [Google Scholar] [CrossRef] [Scilit]
  56. Li, X.; Zhang, Y.; Liu, G.; Wang, H. Investigating deformation mechanism of earth-rock dams with InSAR and numerical simulation: Application to Liuduzhai Reservoir Dam, China. Remote Sens. 2023, 15, 4110. [Google Scholar] [CrossRef] [Scilit]
  57. Casagli, N.; Frodella, W.; Morelli, S.; Tofani, V.; Ciampalini, A.; Intrieri, E.; Raspini, F.; Rossi, G.; Tanteri, L.; Lu, P. Spaceborne, UAV and ground-based remote sensing techniques for landslide mapping, monitoring and early warning. Geoenvironmental Disasters 2017, 4, 9. [Google Scholar] [CrossRef] [Scilit]
  58. Lanari, R.; Mora, O.; Manunta, M.; Mallorquí, J.J.; Berardino, P.; Sansosti, E. A small-baseline approach for investigating deformations on full-resolution differential SAR interferograms. IEEE Trans. Geosci. Remote Sens. 2004, 42, 1377–1386. [Google Scholar] [CrossRef] [Scilit]
  59. Shi, C.; Zuo, X.; Zhang, J.; Zhu, D.; Li, Y.; Bu, J. Accuracy assessment of geometric-distortion identification methods for Sentinel-1 synthetic aperture radar imagery in highland mountainous regions. Sensors 2024, 24, 2834. [Google Scholar] [CrossRef] [Scilit] [PubMed]
  60. Zhao, W.M.; Cong, P.F.; Ma, X.; Yi, M.X.; Liu, C.; Gao, J.C.; Zhang, Y. Landslide Hazard Identification and Prediction in Complex Mountainous Areas Using Ascending and Descending Orbits InSAR Technology. Sensors 2026, 26, 2455. [Google Scholar] [CrossRef] [Scilit] [PubMed]
  61. Cigna, F.; Bateson, L.B.; Jordan, C.J.; Dashwood, C. Simulating SAR geometric distortions and predicting Persistent Scatterer densities for ERS-1/2 and ENVISAT C-band SAR and InSAR applications: Nationwide feasibility assessment to monitor the landmass of Great Britain with SAR imagery. Remote Sens. Environ. 2014, 152, 441–466. [Google Scholar] [CrossRef] [Scilit]
  62. He, L.; Pei, P.; Zhang, X.; Qi, J.; Cai, J.; Cao, W.; Ding, R.; Mao, Y. Sensitivity evaluation of time series InSAR monitoring results for landslide detection. Remote Sens. 2023, 15, 3906. [Google Scholar] [CrossRef] [Scilit]
  63. Delgado, F. Rhyolitic volcano dynamics in the Southern Andes: Contributions from 17 years of InSAR observations at Cordón Caulle volcano from 2003 to 2020. J. S. Am. Earth Sci. 2021, 106, 102841. [Google Scholar] [CrossRef] [Scilit]
  64. Du, E.; Wang, L.; Zhao, L.; Zhou, H.; Liu, S.; Zou, D.; Liu, G.; Xiao, Y.; Hu, G.; Li, Z.; et al. Quantifying the soil water content of the permafrost active layer using InSAR deformation. J. Hydrol. 2025, 661, 133660. [Google Scholar] [CrossRef] [Scilit]
  65. Chen, J.; Huang, Z.; Lu, L.; Zhang, P. Coseismic and postseismic slip analysis of the 2024 Mw 7.0 Wushi earthquake: Insights from InSAR observations and slip inversion. IEEE J. Sel. Top. Appl. Earth Obs. Remote Sens. 2025, 18, 22620–22629. [Google Scholar]
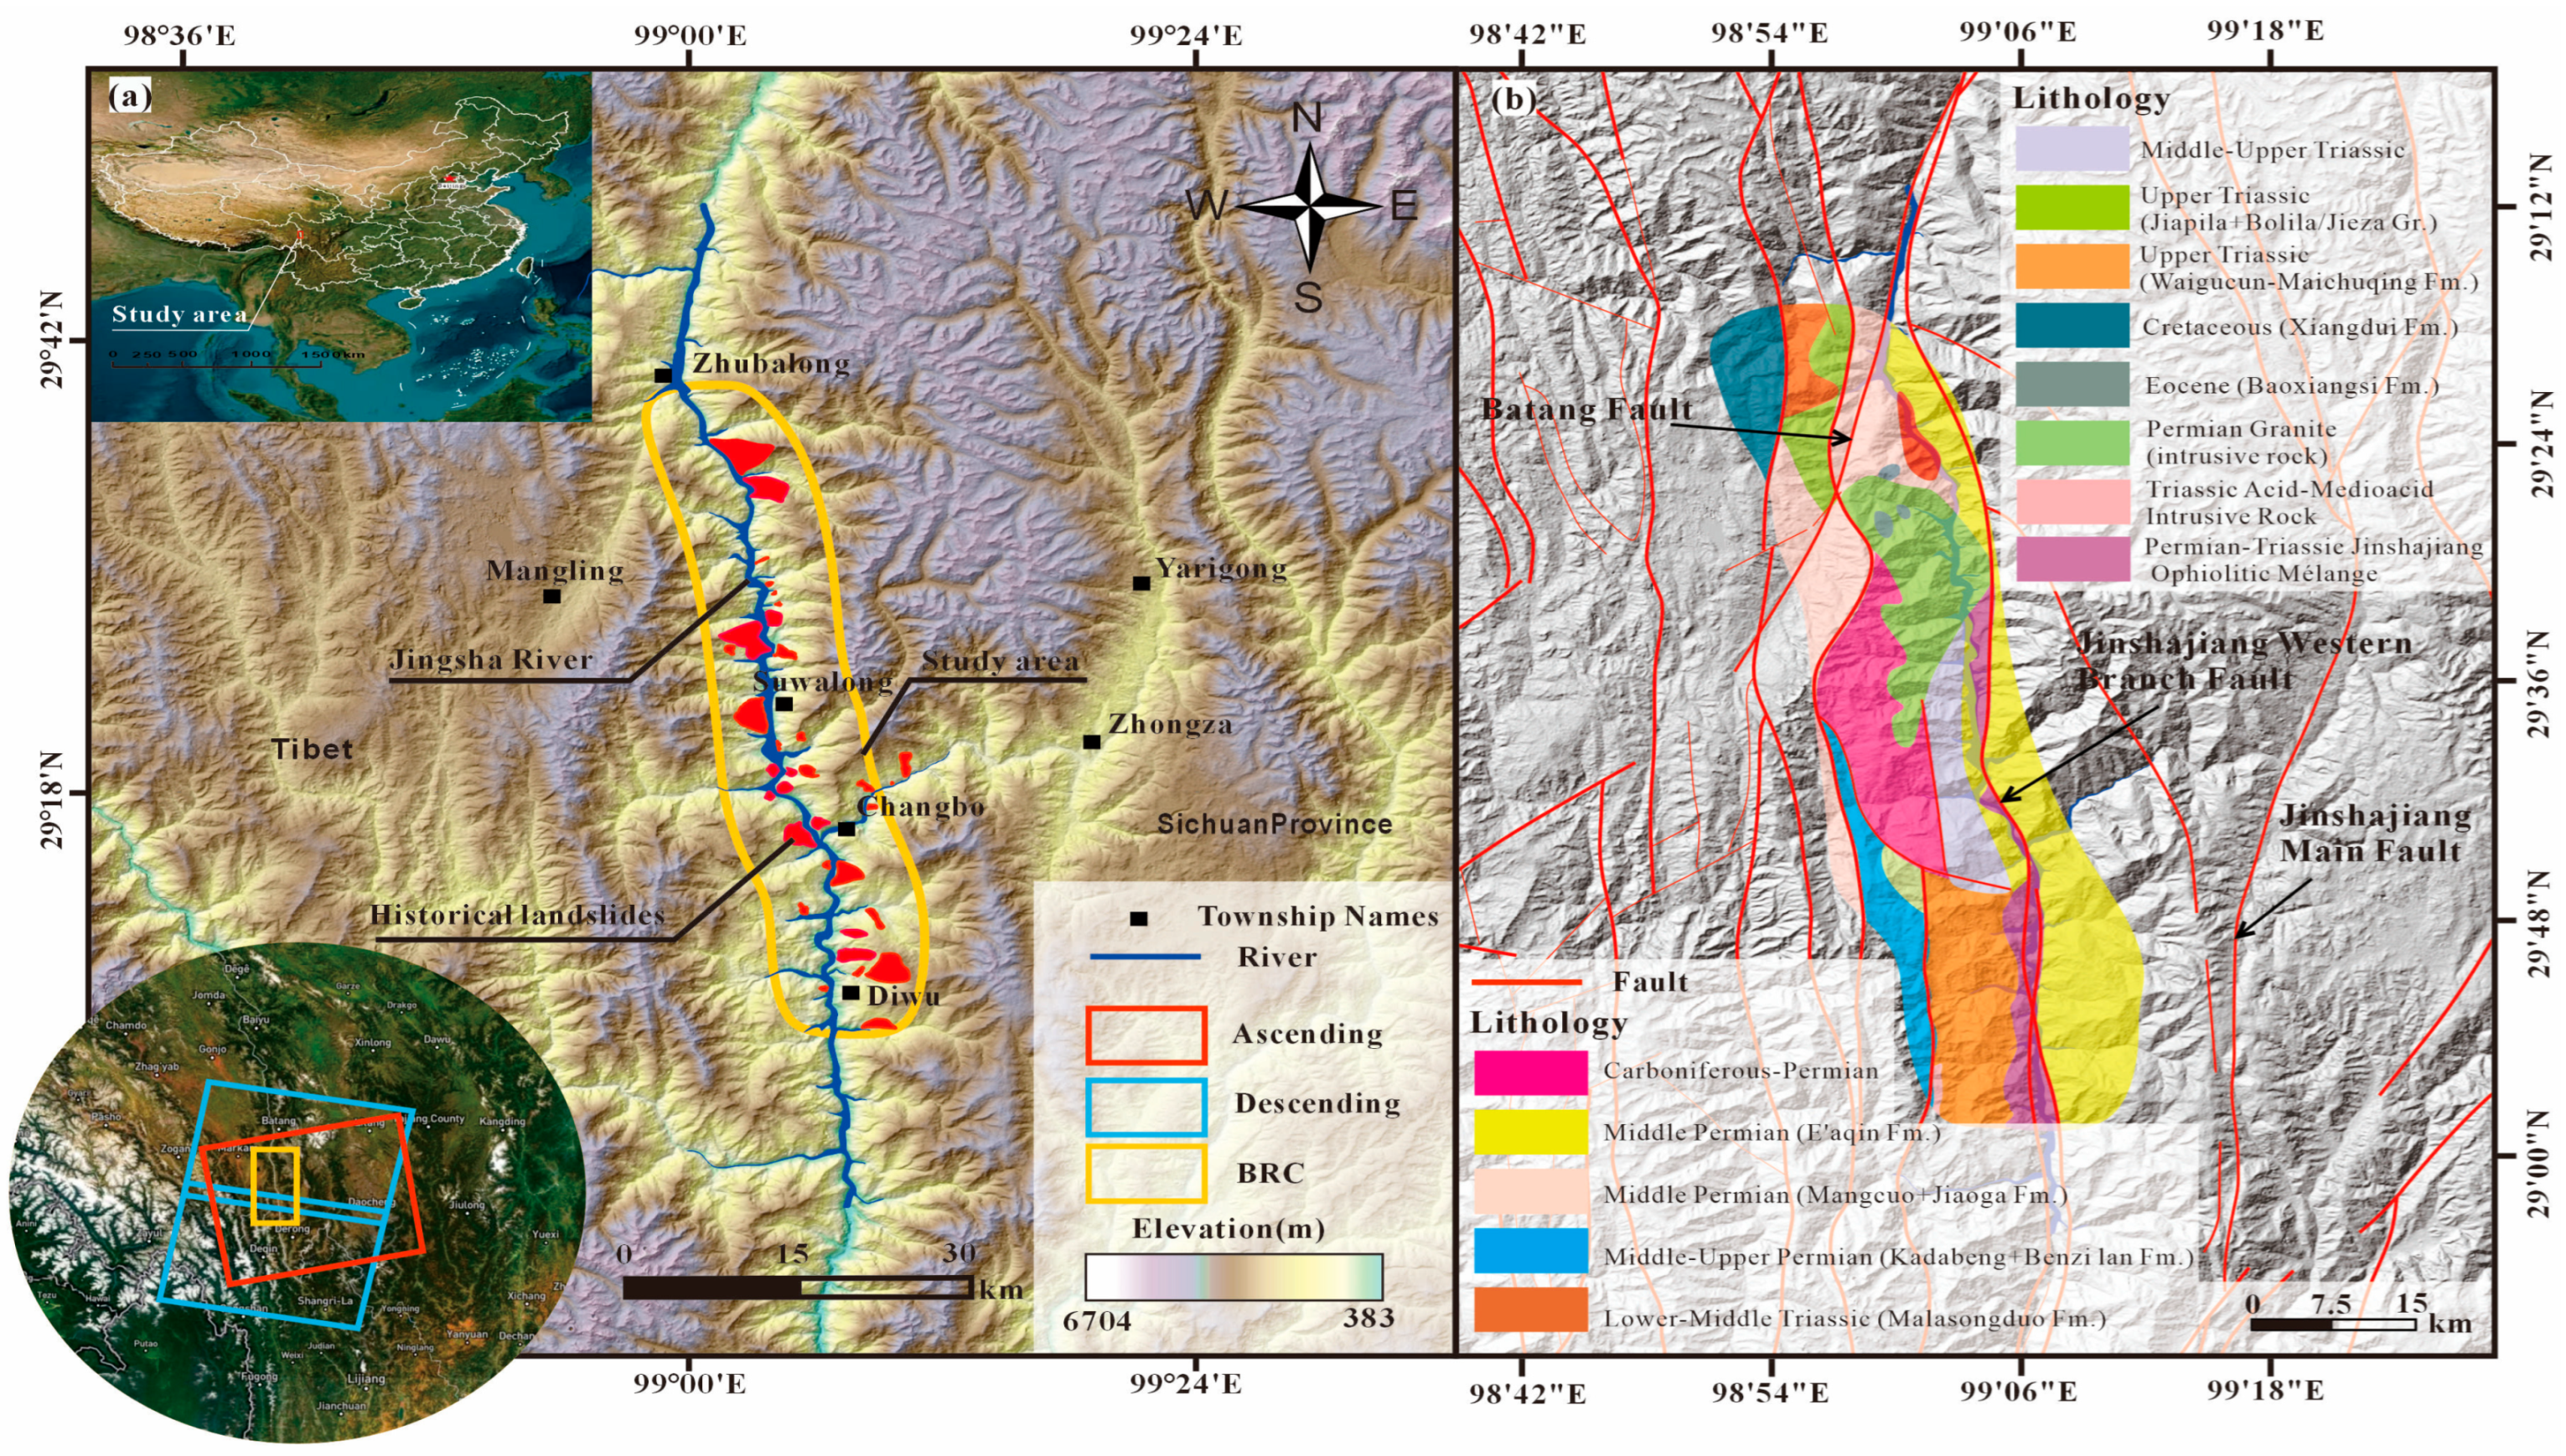
Figure 1. Overview of the study area. (a) Geographical location of the study area and spatial coverage of SAR images. (b) Geological map of the study area.
Remotesensing 18 02786 g001
Figure 2. Flowchart of the methodology.
Remotesensing 18 02786 g002
Figure 3. Spatiotemporal baseline network of the ascending Sentinel-1A dataset (Path 99, 98 scenes) adopted in this study. (a) Baseline network for PS-InSAR processing. (b) Baseline network for SBAS-InSAR processing.
Remotesensing 18 02786 g003
Figure 4. Spatial relationship between slope deformation in LOS and actual directions.
Remotesensing 18 02786 g004
Figure 5. Optical interpretation results of the study area.
Remotesensing 18 02786 g005
Figure 6. Comparative Analysis of PS-InSAR and SBAS-InSAR Methods (Ascending Sentinel-1A Data). (a) LOS deformation rate derived from PS-InSAR; (b) LOS deformation rate derived from SBAS-InSAR.
Remotesensing 18 02786 g006
Figure 7. Detailed comparison of deformation features for typical landslides. (ad) Optical images of the four typical landslides (H22, H24, H34, H35). (eh) Hill-shade views of the corresponding landslides. (il) Deformation rate maps obtained from PS-InSAR processing. (mp) Deformation rate maps obtained from SBAS-InSAR processing. (q) Time series of cumulative deformation for points P1–P8 (marked in panels (ip)) and daily precipitation.
Remotesensing 18 02786 g007
Figure 8. Comparative analysis of deformation results derived from separately processed ascending and descending SBAS-InSAR datasets in the Batang Gorge. (a) LOS deformation rate (VLOS) of ascending SBAS-InSAR; (b) LOS deformation rate (VLOS) of descending SBAS-InSAR. (Black numbers denote typical landslides; red numbers denote newly identified landslides by remote sensing monitoring.)
Remotesensing 18 02786 g008
Figure 9. Deformation characteristics and multi-dimensional analysis of the H7 landslide at Suwalong Hydropower Station. (a) Google Earth image. (b) Slope deformation model overlaid on hillshade map. (cf) Downslope deformation rate versus elevation curves along profiles AA′, BB′, CC′ and DD′ in (b). (gj) Magnified views of the red dashed box areas in (a). (k) Time series of cumulative deformation for characteristic points P1–P4 in (b) with superimposed daily precipitation.
Remotesensing 18 02786 g009
Figure 10. Comprehensive Characteristics and Deformation Analysis of the H14 Wangdalong River-Damming Landslide. (a) Google Earth image. (b) Slope deformation field overlaid on Google Earth image. (c) UAV aerial photograph of the overall landslide. (d) Close-up view of cracks at the slope top. (e) Close-up view of cracks at the slope toe. (f) Field photo of water flow in Gully 1#. (g) Field photo of water flow in Gully 2#. (h) Time series of cumulative deformation for characteristic points P1–P4 in (b). (i) Deformation rate vs. elevation curve along profile AA′ in (b).
Remotesensing 18 02786 g010
Figure 11. Comprehensive Characteristics and Deformation Analysis of the H18 Yudi Village Landslide, Changbo Township. (a) Google Earth image. (b) Downslope deformation field overlaid on Google Earth image. (c) Close-up view of the right boundary of the landslide. (d) Close-up view of the left boundary of the landslide. (e) Field photo of wall cracks at the rear edge of the landslide. (f) Field photo of tensile cracks on the road in the middle of the landslide. (g) View of the rear edge of the landslide. (h) View of the front edge of the landslide. (i) Time series of cumulative Downslope deformation for characteristic points P1–P4 in (b). (j) Downslope deformation rate versus elevation curve along profile AA′ in (b).
Remotesensing 18 02786 g011
Figure 12. Point density comparison chart.
Remotesensing 18 02786 g012
Figure 13. Graphical comparison of average coherence, Root Mean Square Error (RMSE), and MuSigma estimated by PS-InSAR and SBAS-InSAR.
Remotesensing 18 02786 g013
Figure 14. Spatial distribution of landslide conditioning factors. (a) Lithology. (b) Distance to faults. (c) Distance to roads. (d) Slope gradient. (e) Aspect. (f) Annual precipitation.
Remotesensing 18 02786 g014
Table 1. Sentinel-1A basic data parameters.
ParameterAscending OrbitDescending Orbit
Wavelength (cm)5.65.6
Path9933
Temporal coverage5 January 2024–12 January 202612 January 2024–7 January 2026
Revisit cycle (d)1212
Incident Angle (°)36.2040.11
Imaging modeInterferometric Wide (IW)Interferometric Wide (IW)
Polarization modeVV+VHVV+VH
Number of images98114
Disclaimer/Publisher’s Note: The statements, opinions and data contained in all publications are solely those of the individual author(s) and contributor(s) and not of MDPI and/or the editor(s). MDPI and/or the editor(s) disclaim responsibility for any injury to people or property resulting from any ideas, methods, instructions or products referred to in the content.