Article

A Comprehensive Machine Learning Approach for Crop Classification Using Multi-Sensor Satellite Datasets and Multiple Vegetation Indices

1
Department of Geodesy and Geoinformatics, Tashkent Institute of Irrigation and Agricultural Mechanization Engineers (TIIAME)—National Research University, 39 Koriy Niyoziy str., Tashkent 100000, Uzbekistan
2
Department of Photogrammetry and Geoinformatics, Faculty of Civil Engineering, Budapest University of Technology and Economics, Műegyetem rkp. 3, K Building First Floor 31., H-1111 Budapest, Hungary
3
Civil Engineering Department, Faculty of Engineering, Qena University, Qena 83523, Egypt
4
School of Sustainability, Arizona State University, Tempe, AZ 82581, USA
5
Geodynamics Department, National Research Institute of Astronomy and Geophysics (NRIAG), Helwan, Cairo 11421, Egypt
6
Department of Geodesy and Surveying, Faculty of Civil Engineering, Budapest University of Technology and Economics, Műegyetem rkp. 3, H-1111 Budapest, Hungary
*
Author to whom correspondence should be addressed.
Remote Sens. 2026, 18(15), 2571; https://doi.org/10.3390/rs18152571
Submission received: 26 April 2026 / Revised: 20 July 2026 / Accepted: 23 July 2026 / Published: 4 August 2026

Highlights

What are the main findings?
  • The integration of Sentinel-2 optical and Sentinel-1 SAR data improved crop classification performance (up to 2.38% over optical dataset, and up to 13.28% over the SAR dataset) by providing complementary spectral, structural, and moisture-related information beyond single-sensor approaches.
  • The use of multiple vegetation indices enhanced crop separability and classification accuracy (up to 3.52%) compared with NDVI alone, particularly for spectrally similar crop types.
  • Ensemble machine learning models, especially GBT and RF, consistently delivered the highest classification accuracy (97.06% and 96.92% respectively), demonstrating their effectiveness for crop mapping in heterogeneous semi-arid agricultural environments.
  • KNN achieved moderate classification performance, with reduced effectiveness in high-dimensional feature spaces due to distance-based limitations, while CART showed less consistent results across fields, likely associated with overfitting and sensitivity to noise.
What are the implications of the main findings?
  • The improvements demonstrated in crop classification accuracy contribute to more reliable agricultural inventories and crop area estimation, supporting regional food security planning and resource management.
  • The framework provides a scalable methodology that can be adapted for operational monitoring programs using freely available satellite data, reducing the cost and effort associated with field-based surveys.
  • Improved crop discrimination can support precision agriculture applications, including targeted irrigation, fertilizer management, and yield forecasting, thereby promoting more efficient and sustainable agricultural practices.

Abstract

Accurate crop classification is essential for sustainable agriculture activities and food security studies. Recent advancements in remote sensing data acquisition and analysis techniques enable various solutions for cropland detection; however, reliable crop maps are still lacking in many heterogeneous semi-arid regions (e.g., Central Asia). Machine learning approaches address such challenges and distinguish different crop types using multiple datasets. The main aim of this study is to optimize crop classification outcomes by integrating multi-sensor datasets leveraging numerous vegetation indices through different machine learning models. Four datasets: Landsat-8 (DS-1), Sentinel-2 (DS-2), optical Sentinel-2 integrated with SAR Sentinel-1 (DS-3), and Sentinel-1 (DS-4) were used for the developed experiments. Five vegetation indices, NDVI, GNDVI, EVI, SAVI, and MSAVI, were derived using Sentinel-2 and Landsat-8 bands; in addition, NDRE was only obtained for Sentinel-2 exploiting the red edge band. Three input scenarios were considered for model training and image classification, featuring solely NDVI and its related bands; a set of vegetation indices and their associated bands for optical imagery; and VV, VH, and VV/VH ratio bands for SAR data. Five classifiers, Gradient Boosting Tree (GBT), Random Forest (RF), K-Nearest Neighbor (KNN), Classification and Regression Tree (CART), and Minimum Distance (MD), were employed to assess the machine learning quality for scene classification. Findings demonstrated that Sentinel-2 outperforms Landsat-8 images due to the higher spatial resolution and red edge bands. DS-3 consistently outperforms both DS-2 (optical-only) and DS-4 (SAR-only) across all classifiers, enhancing the overall accuracy up to 2.38% over the optical dataset, and up to 13.28% over the SAR data, demonstrating the added details on canopy spectral reflectance, structure and moisture content. Using multiple vegetation indices consistently improves performance over NDVI alone across DS-1, DS-2, and DS-3, with gains reaching up to 96.22% due to the complementary information captured by multi-index spectral sensitivity. The GBT and RF classifiers consistently achieved the highest classification performance, effectively combining multiple decision trees to capture complex nonlinear relationships and decision boundaries; meanwhile, the MD classifier exhibited the lowest accuracy due to its reliance solely on distances to class mean vectors. All in all, the presented approach offers a robust framework for crop classification supplemented with multiple data sources using different VI feature scenarios and variable machine learning tools for precise farming applications in semi-arid regions.

1. Introduction

Cotton and wheat are among the most important crops grown in many regions of the world, including Central Asia. Agricultural crops play a significant role in ensuring national food security, improving the living standards of rural populations, and developing national economies [1]. Wheat is a staple food for millions of people, providing calories and protein, while cotton is a crucial industrial resource for textiles and exports [2,3]. Accurate and time-series information about cultivated crops is essential for farmers, researchers, and policymakers to monitor growth, manage resources, and plan production. Meaningful land cover data and reliable classification techniques are key aspects for better scene analysis and improving overall agricultural management.
The latest developments in remote sensing technologies have greatly expanded the ability to monitor crops at wide range scales and consecutive growth stages through a variety of satellite datasets [4]. Landsat-8, equipped with an Operational Land Imager (OLI) sensor, measures in the visible, near-infrared, and short-wave infrared (VNIR and SWIR) portions of the spectrum, capturing about 740 scenes a day. OLI provides longer wavelength spectral bands and archival imagery, useful for long-term monitoring and assessment of plant health [5]. Sentinel-2 delivers continuity to services, relying on multispectral high spatial resolution optical explorations of Earth surfaces. The mission seeks to sustain operational resources for land use land cover state and changes, risk management, forest monitoring, food security, early warning systems, water management and soil protection, urban expansion tracking, and terrestrial mapping for human development. Given that cloud cover decreases the effectiveness of Landsat-8 and Sentinel-2 data during critical moments, cloud mask bands are gradually employed to create cloud-free scenes based on threshold tests using spectral information [6]. Additionally, Sentinel-1’s Synthetic Aperture Radar (SAR) imagery provides information on soil structure and moisture regardless of weather conditions, making it a valuable complementary dataset [7]. The integration of inclusive Sentinel-2 and Sentinel-1 datasets provides a more complete scene of crop growth than using a single sensor [8,9]. Understanding how data from multiple sensors work, in fragmented landscapes, helps to improve the reliability and effectiveness of crop classification models. For instance, the long-wavelength bands and SWIR images of the Landsat-8 satellite are very sensitive to vegetation moisture and soil properties, whereas the high-resolution optical channels of the Sentinel-2 satellite provide additional structural and spectral information alongside SAR features that effectively account for canopy structural differences and reduce the influence of soil moisture [10].
Machine Learning (ML) has offered powerful tools for improving crop classification accuracy, considering the diverse relationships between spatial resolution, spectral bands and radar backscatter coefficients. Sophisticated multi-sensor inputs necessitate large-scale ML models with considerable parameters and consume substantial computational resources. Instead, vegetation indices are applied to harmonize spectral bands as normalized, biophysical indicators that accurately represent vegetation health, density, and condition over time and space [11]. The Normalized Difference Vegetation Index (NDVI) is presented, featuring vegetation greenness and vigor; Green NDVI (GNDVI) is calculated, focusing on chlorophyll content; the Enhanced Vegetation Index (EVI) is used, enhancing vegetation signals in high biomass; the Soil Adjustment Vegetation Index (SAVI) is advantageous, reducing the soil background effect; Modified SAVI (MSAVI) is powerful, minimizing soil influence; and Normalized Difference Red Edge (NDRE) is effective, and necessary for chlorophyll in dense vegetation. Combining multiple vegetation indices considers crop phenology and reduces spectral redundancy to improve classification efficiency. Image classification algorithms, such as Gradient Boosting Tree (GBT), Random Forest (RF), K-Nearest Neighbor (KNN), Classification and Regression Tree (CART), and Minimum Distance (MD) classifiers, are widely used in crop monitoring studies [12]. Each technique has its own advantages: ensemble models such as GBT and RF can optimize outcomes and reduce overfitting, while statistical approaches such as KNN, CART, and MD allow interpretable and distributed measurements for assessing class separability in feature space [9]. Therefore, it is crucial to determine the most reliable approach among the different accessible classifiers for specific agricultural conditions within the surrounding environment. A substantial body of literature has adopted an integrated framework combining satellite imagery, spectral bands, vegetation indices, and machine learning techniques for agricultural monitoring and crop assessment [13,14,15,16]. Giannico et al. (2024) employed Sentinel-2 multispectral imagery bands and vegetation indices as predictor variables to estimate vine water status in a semi-arid environment using Random Forest and several regularized linear models. The study demonstrated that RF-based ensemble modeling outperformed linear approaches, including Lasso, Ridge, Elastic Net, and Linear Regression models, highlighting its capability to capture complex nonlinear relationships between remotely sensed variables and crop conditions. Furthermore, the study showed that the integration of multiple vegetation indices provided greater predictive power than the use of spectral bands alone and identified the red edge spectral region as the most informative domain for vegetation monitoring and drought-stress assessment [16]. Hosseini et al. (2024) employed multi-temporal Sentinel-2 and Landsat-8/9 imagery within the Google Earth Engine platform to map cropping intensity patterns in agricultural areas. The study integrated spectral bands and NDVI with a stacked ensemble learning framework combining GBT, RF, CART, SVM, and MD classifiers. Results demonstrated that the ensemble model outperformed the individual classifiers and maintained high accuracy when transferred across multiple years. The study further highlighted the effectiveness of integrating multi-temporal optical satellite data and machine learning techniques for agricultural monitoring and crop-related mapping applications [15].
Uzbekistan, where cotton and wheat remain the main agricultural crops, is an ideal case study to validate the suggested approach. The Urta Chirchik district was chosen due to the diverse field sizes, irrigation systems, and management practices [17]. The heterogeneous conditions allow the evaluation of multi-sensor data and machine learning algorithms under realistic conditions. The developed workflow is applicable to other semi-arid regions with similar ecological and agricultural properties. The work showcases a robust and practical wheat and cotton classification model employing Landsat-8, Sentinel-2, Sentinel-1, and integrated Sentinel-1 and Sentinel-2 datasets, a set of vegetation index inputs, and five machine learning classifiers. Given the advantages of combining optical and radar data over single sensors and the impact of the vegetation indices, the efficiency of ML models is assessed for precise crop classification [18]. Unlike conventional approaches relying on single-sensor data or limited spectral features, the proposed framework integrates optical and SAR datasets with multiple vegetation indices and evaluates their performance across several machine learning classifiers. It is hypothesized that the integration of multi-sensor satellite data (Sentinel-1 and Sentinel-2) combined with multiple vegetation indices significantly enhances crop classification accuracy compared to single-sensor and NDVI-based approaches. The system facilitates precision agriculture by providing farmers, agronomists, and policymakers with time-series and accurate crop information [19].

2. Study Area and Data Used

2.1. Study Area

The study was conducted in the Urta Chirchik (41°02′34.4″N, 69°21′26.6″E), located in the eastern part of the Tashkent region of Uzbekistan (Figure 1) [20]. The district covers an area of approximately 560 km2 with a population of 210,000, representing one of the main irrigated agricultural zones of the country [21]. The main economic sectors are agriculture, agro-processing, and irrigation, considering the region is situated between the Chirchik River in the north and the Ahangaron irrigation network in the east, creating a very productive agricultural landscape dominated by wheat and cotton [22]. The climate is continental, characterized by hot, dry summers (up to 35–40 °C) and cold winters (reaching −5 °C). The annual precipitation ranges from 300 mm to 350 mm, most of which falls in winter and early spring [23]. Due to the insufficient precipitation, agriculture relies almost entirely on irrigation through canals provided by the Tashkent canal system for growing crops [24]. The weather and hydrological conditions significantly affect the spectral and radar features observed in satellite imagery [25]. The soil is mainly meadow-alluvial and serozem, fertile and well-suited for irrigated agriculture, although some areas are subject to moderate to high salinity due to long-term waterlogging and evaporation [26].

2.2. Satellite Data

Optical and radar data combination improves the discrimination of different crop types under various conditions, increasing overall classification accuracy. Wheat and cotton crops are categorized using multi-sensor satellite data from Landsat-8, Sentinel-2, and Sentinel-1. The Landsat-8 dataset (DS-1) comprises variated spectral information at a coarser spatial resolution of 30 m. Surface reflectance channels B2 (blue), B3 (green), B4 (red), and B5 (near infrared) are used to depict vegetation structure, soil moisture and canopy moisture status (Table 1) [5,8].
The Sentinel-2 satellite is equipped with a multispectral instrument, capturing 13 spectral bands in the visible, red, red edge, near-infrared and short-wave infrared ranges, allowing for detailed characterization of plant biophysical properties (Table 2). The mission provides high-resolution optical images (10–20 m) with a nominal return interval of 5 days, which is essential for monitoring rapid crop development during critical growth stages. The Sentinel-2 dataset (DS-2) combines Sentinel-2A and Sentinel-2B data, providing frequent temporal coverage suitable for monitoring crop phenology and growth dynamics [6].
Sentinel-1 is a C-band Synthetic Aperture Radar (SAR) platform designed for land surface monitoring, disaster management and environmental observations, and is particularly valuable in agricultural areas with extensive cloud cover during key phenological phases [27]. The C-band SAR is particularly sensitive to crop biomass, plant moisture and overall canopy structure, making it very informative when wheat and cotton exhibit different backscatter responses [28]. Sentinel-1 data was acquired in the Interferometric Wideband (IW) mode, which provides dual polarization (VV and VH) images with a spatial resolution of 10 m and a nominal revisit time of 12 days [29]. However, the repeat interval is 12 days, with overlapping orbits in mid-latitude regions often reducing the effective nominal time to about 6 days, allowing for frequent temporal measurements for crop monitoring [7,9]. In addition to the VV and VH backscatter coefficients, the VV/VH ratio was calculated to improve the separation of wheat and cotton, as it accounts for differences in canopy structure and moisture conditions [30]. The VV/VH ratio, through techniques well established in previous agricultural studies, reduces the effects of soil moisture and absolute backscatter intensity, revealing structural differences between crop types [31]. A combined dataset (DS-3) was developed through the fusion of Sentinel-2 optical and Sentinel-1 SAR data, enabling the integration of complementary spectral information and radar measures to enhance crop classification performance and strengthen the characterization of wheat and cotton phenological stages. Meanwhile, a SAR only dataset (DS-4) was created exclusively from Sentinel-1 images to serve as a baseline reference for assessing the added value of integrating Sentinel-1 and Sentinel-2 observations, while enabling a systematic evaluation of feature importance within the multi-sensor learning framework. The full image classification dataset was developed using satellite imagery acquired during the mid-season period (June–July), which corresponds to a key phenological stage when wheat reaches maturity and cotton attains peak flowering. At this stage, the two crops exhibit distinct spectral and backscatter characteristics, enhancing their separability. All available Landsat-8, Sentinel-2, and Sentinel-1 images acquired within this time window were collected, provided they satisfied the cloud-cover requirements and ensured complete coverage of the study area. The selected images were then organized into a three-period time-series framework to capture crop phenological dynamics. Mean composite images were generated for each period, resulting in a three-period time-series (P-1, P-2, and P-3) dataset that preserves crop phenological information while reducing the effects of cloud contamination, noise, and missing observations (Table 3).

2.3. Field Data and Reference Sample Preparation

Field data collection is integral for thematic mapping using remotely sensed imagery, calling for more regional knowledge and careful point selection. For model training and accuracy assessment, the areas of cotton, wheat, and other classes were identified in the Urta Chirchik district of Uzbekistan, a semi-arid region characterized by diverse agricultural landscapes and mixed farming. Training samples are supposed to be representative, pure, meaningful, and encompass the entire scene fulfilling the minimal requirements based on class and band numbers [32]. The agricultural field boundaries were derived from 1:2000 scale agricultural maps produced by the Republican Aero-geodesy Center of the Cadastral Agency of Uzbekistan in cooperation with the Ministry of Agriculture. These maps are updated every five years using aerial photography surveys and constitute the official agricultural boundary database of the country. The reference data used for cotton, wheat, other crops (e.g., vegetables, orchards, and forage crops), and bare land classes were obtained from the Ministry of Agriculture, following the most recent update of 2024. To ensure the reliability of the agricultural reference data, field verification visits were conducted by our team in Uzbekistan in April and June 2025. During these visits, representative wheat and cotton fields within the study area were visually inspected to confirm the correctness of crop types and field boundaries recorded in the official database. The agricultural records included official field-level crop data, field boundaries, and seasonal planting information. The verified field boundaries were subsequently digitized and processed to establish a reliable dataset for classification and validation purposes. Moreover, for non-agricultural classes, including buildings, roads, and water bodies, reference polygons were visually delineated using high-resolution imagery acquired in 2025. These features were further cross-checked against Sentinel-2 imagery from the 2025 growing season to verify their spatial location and extent. Due to the large lake located within the study area, the water class was subdivided into multiple smaller polygons to improve the spatial distribution of samples and avoid the dominance of a single large water feature during the training and validation process. The non-vegetated areas, such as buildings, roads and water bodies, were added as contrast classes, necessary to reduce spectral noise, especially in complex agro-mosaic settings where field boundaries often intersect with anthropogenic objects.
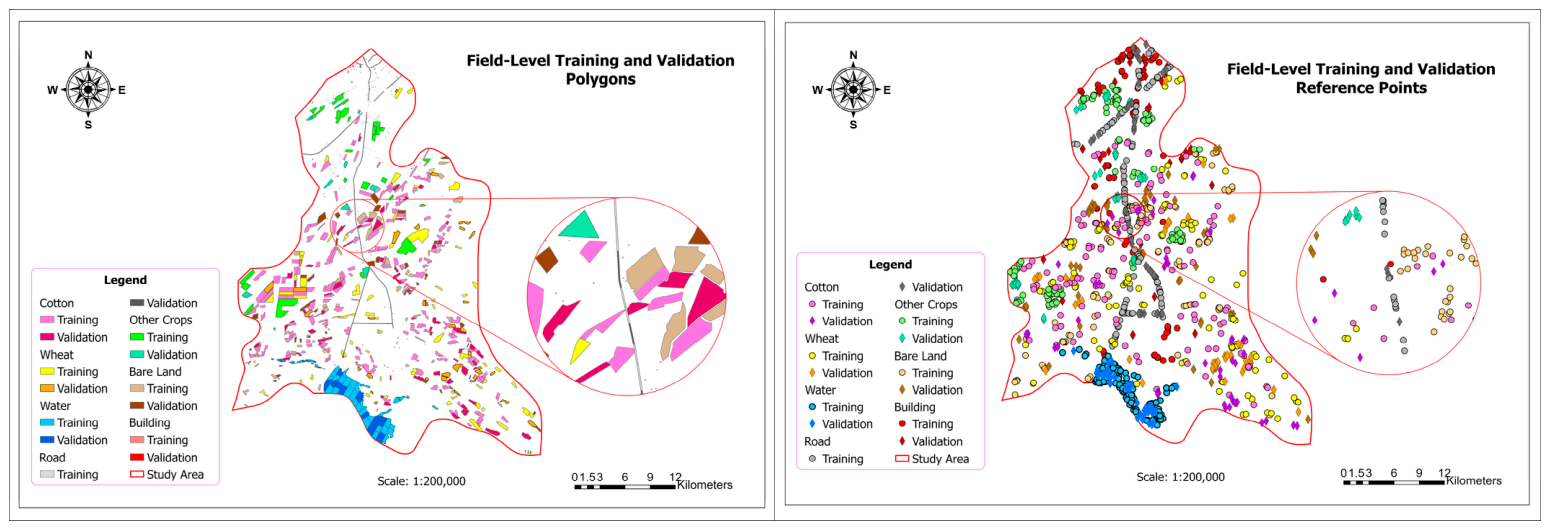
To ensure the independence of reference data and minimize spatial autocorrelation effects, the identified class polygons were first randomly partitioned into independent training and validation regions using a field-level sampling strategy with an approximate 70:30 ratio. Subsequently, a balanced, representative, and spatially distributed ground-truth dataset was generated by collecting a total of 2380 sample points, comprising 340 samples for each of the seven land-cover and crop classes, ensuring equitable coverage of all classes and preventing the models from being biased towards common crop types. Class points comprise 238 training points and 102 validation points to support machine learning model development and robust accuracy assessment (Figure 2). The delineated sample points contain spectrum and radar information of single pixels for training the models and ground reference class for accuracy assessment. The collection of image-based points derived from verified field boundaries using agricultural records and satellite imagery is a widely accepted approach in large-scale crop mapping studies [33].

3. Experimental Work

3.1. Methodology

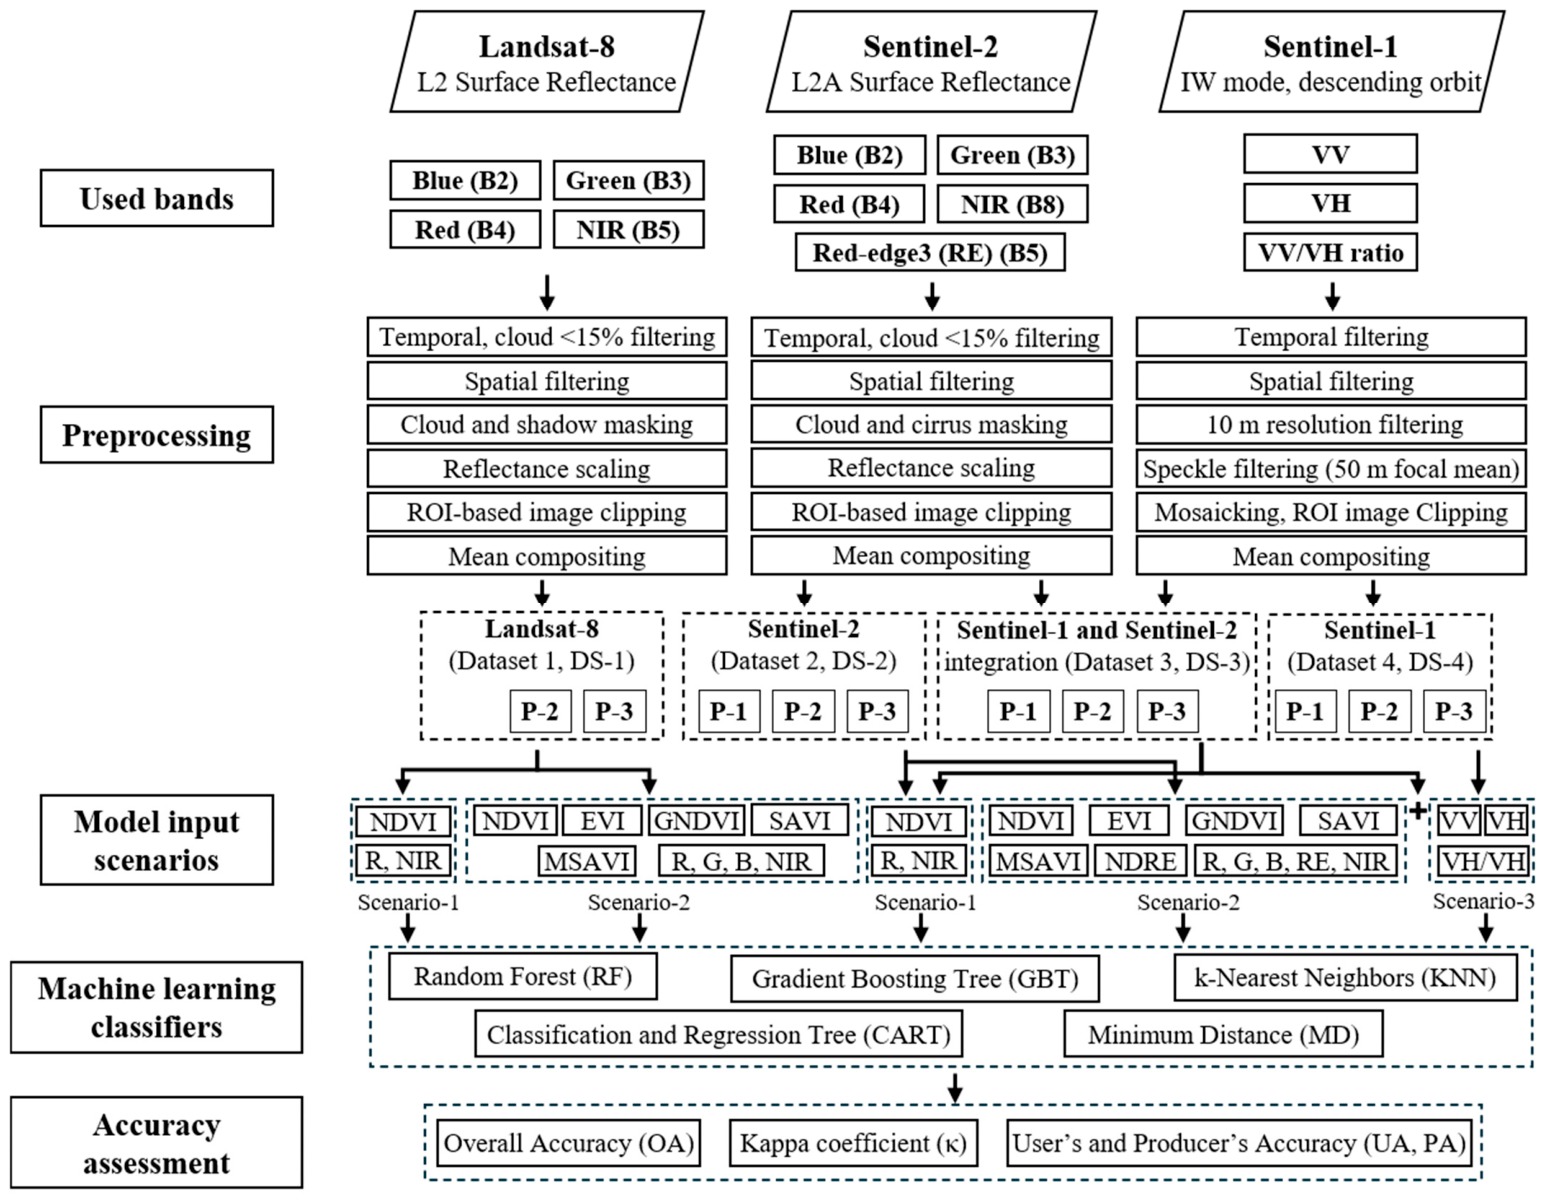
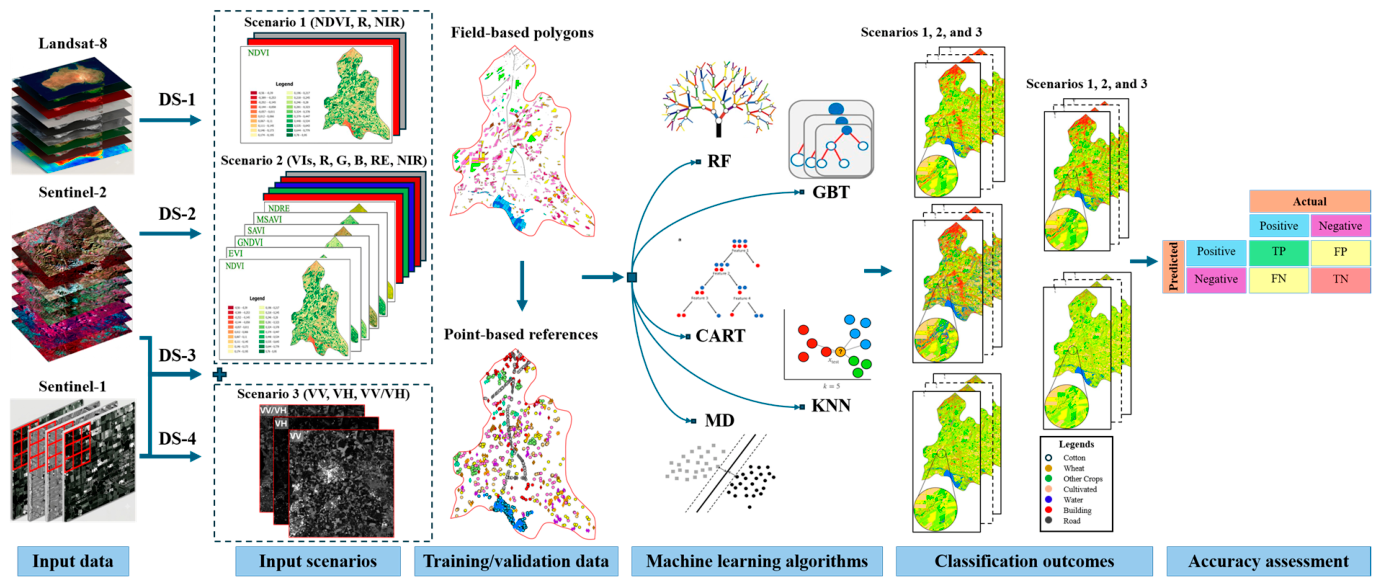
To achieve the study objective of an accurate crop classification machine learning model, the following procedures (Figure 3) were applied and the outcomes assessed. The workflow provides a reproducible and scalable methodology suitable for precision agriculture, regional crop monitoring, and large-scale agricultural mapping across diverse landscapes [34]. The input data of Landsat-8, Sentinel-2, and Sentinel-1 are defined, preprocessed, and clipped to fit the ROIs. Multiple spectral indices and SAR measures were generated and visualized, using the specified datasets (DS-1, DS-2, DS-3, and DS-4), to analyze the temporal dynamics of crop development and determine the appropriate timeframe for scene classification. Two practical scenarios for optical datasets and a third scenario for SAR bands were undertaken and their contribution evaluated: (1) A single NDVI index with its associated bands; (2) a combination of NDVI, GNDVI, EVI, SAVI, MSAVI, and NDRE and their related bands; and (3) SAR VV, VH, and VV/VH inputs were investigated to feed the classification models [35]. Comparing the applied experiments allowed for the determination of how the inclusion of multimodal data improves crop separation in real field conditions compared to single sensors. The approach also highlights the importance of spectral diversity for crop classification in heterogeneous agricultural landscapes. All vegetation indices and SAR measures were generated in Google Earth Engine (GEE) using preprocessed composite data acquired during the first and middle periods of each month from March to November 2025 to provide consistent wheat and cotton full-season temporal representations. The vegetation index and SAR backscatter representations highlight the variation in agriculture land cover and its fluctuation through different seasons. Following this, supervised classification was performed based on three composite periods (P-1, P-2, and P-3) during the June–July period using DS-1, DS-2, DS-3, and DS-4 to map wheat, cotton, and other land cover classes in the Urta Chirchik district. Landsat-8 images (DS-1) were classified separately due to their coarser spatial resolution and the lack of a red edge band, which is required to derive NDRE measurements. Sentinel-2 images (DS-2) were classified separately, investigating the high spatial resolution and presence of the RE band. Sentinel-1 and Sentinel-2 data were integrated (DS-3) since SAR information is particularly effective for detecting structural differences and moisture content where solely optical data are inadequate. Sentinel-1-only images (DS-4) were classified as a benchmark for the data fused. To provide a comprehensive evaluation of classification performance, five machine learning algorithms were selected to represent both advanced ensemble methods and simpler baseline approaches. Ensemble models such as Gradient Boosting Tree (GBT) and Random Forest (RF) are known for their strong performance in high-dimensional classification tasks, while simpler models such as K-Nearest Neighbor (KNN), Classification and Regression Tree (CART), and Minimum Distance (MD) were included to evaluate model robustness and practical trade-offs. To ensure optimal classification performance, hyperparameter tuning was applied to each classifier, where the parameter combination producing the highest accuracy across the different datasets and scenarios was selected. Finally, all classified images were exported from GEE in GeoTIFF format for further analysis within a GIS environment, using a spatial resolution of 10 m for the Sentinel-1, Sentinel-2, and the Sentinel-1/Sentinel-2 integrated dataset and 30 m for Landsat-8. The exported data allowed for the creation of thematic maps of wheat, cotton, and other agricultural lands, allowing for visual evaluation and better validation of the real-world field data [36].

3.2. Data Preprocessing

Data preprocessing prepares satellite images in a more appropriate setting to enhance interpretation outcomes. The preprocessing phase was performed on Landsat-8, Sentinel-2, and Sentinel-1 datasets within Google Earth Engine (GEE), including temporal and spatial filtering, cloud and shadow masking, reflectance scaling, ROI-based image clipping, and mean compositing. Furthermore, Sentinel-1 data underwent additional SAR-specific processes, including resolution filtering and speckle noise reduction.
The used Landsat-8 Level 2 and Sentinel-2 Level 2A Surface Reflectance data have already undergone radiometric calibration and atmospheric correction through the standard processing chains, providing analysis-ready products suitable for quantitative remote sensing applications. To ensure accurate crop classification outcomes, a two-stage cloud quality-control procedure was implemented, consisting of scene-level cloud filtering and pixel-level cloud, cirrus, and shadow masking. Both Landsat-8 and Sentinel-2 scenes were first selected with cloud coverage <15%, ensuring that only high-quality observations were retained for subsequent analysis, lessening the surface-obscuration effects, and thereby improving the quality and reliability of the spectral information. Subsequently, Landsat cloud- and shadow-contaminated pixels were identified and masked using the QA_PIXEL quality assessment band. Specifically, cloud (Bit 3) and cloud-shadow (Bit 5) flags were utilized to exclude affected pixels from further analysis. Meanwhile, Sentinel-2 cloud-contaminated pixels were detected and masked using the QA60 quality assessment band, where cloud (Bit 10) and cirrus cloud (Bit 11) flags were removed from further analysis. This pixel-level quality-control procedure reduced atmospheric and illumination-related artifacts, thereby improving the quality, consistency, and reliability of the surface reflectance information used for subsequent feature extraction and classification. Following this, pixel values were scaled by a factor of 0.0001 to convert the original digital numbers into physically meaningful surface reflectance values suitable for spectral vegetation index computation and subsequent machine-learning-based land-cover classification.
The used Sentinel-1 Ground Range Detected (GRD) imagery featured Interferometric Wide Swath (IW) mode images with a spatial resolution of 10 m. Furthermore, all observations were restricted to the descending orbit direction, thereby maintaining a uniform imaging geometry throughout the study period. Sentinel-1 VV and VH polarization datasets were processed separately. The selected SAR observations were combined using a mosaicking approach to generate spatially continuous backscatter datasets. To reduce the influence of inherent SAR speckle noise and improve image homogeneity, a focal mean filter with a 50 m radius (5 × 5 kernel size) was applied to both VV and VH backscatter images. The kernel size was chosen after many trials testing smaller filters (1 × 1 and 3 × 3) that did not suppress speckles sufficiently while larger filters (≥7 × 7) were too coarse to separate narrow agricultural fields.
An optimized Sentinel-2 dataset was integrated with Sentinel-1 information to directly produce a multi-sensor dataset that enhances crop type differentiation based on canopy structure and biophysical properties [37]. To address the spatial resolution disparity between optical and SAR datasets, the native 10 m resolution was retained for Sentinel-1 GRD backscatter bands (VV, VH, and VV/VH) and Sentinel-2 Level-2A bands (B2, B3, B4, and B8), while all remaining bands were harmonized to match the same resolution [38]. The refined image collection for all datasets was temporally and spatially filtered using the study area boundaries to retain only related scenes. Each image was clipped to the study area using ROI geometry, thereby reducing computational requirements and ensuring spatial consistency throughout the analysis.

3.3. Vegetation Indices

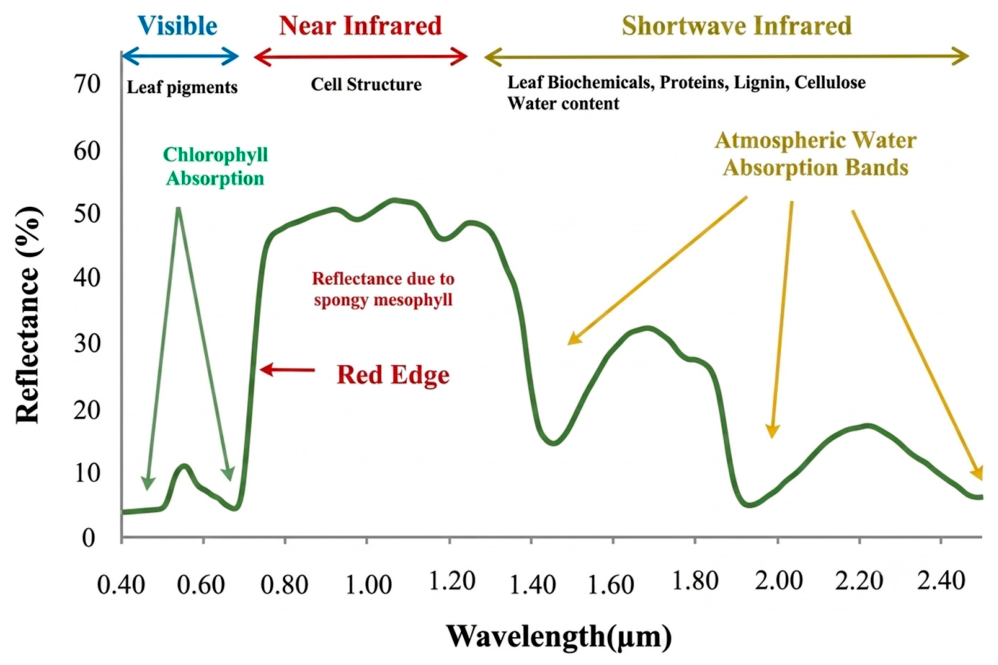
Vegetation Indices (VIs) play an important role in crop detection by converting raw spectral reflectance data into meaningful indicators of plant conditions, maximizing input information while reducing the number of bands. VIs are widely helpful in the assessment of canopy greenness, biomass accumulation, and chlorophyll concentration, and as early indicators of stress, making them useful for distinguishing crops with similar growth cycles. Vegetation can be identified using the visible red, green, blue, red edge, and near-infrared wavelengths. Green crops frequently show low reflectance in the visible parts of the electromagnetic spectrum due to the substantial absorption by leaf mesophyll. However, leaves exhibit strong reflectance in the near-infrared due to high scattering effects (Figure 4) [39].
A set of VIs, based on Landsat-8 and Sentinel-2 multispectral bands, was calculated for more accurate distinguishing of cotton and wheat fields (Table 4) [41]. Due to variations in spectral bands and spatial resolution, the calculation of vegetation indices differed somewhat between Landsat-8 and Sentinel-2 products. Landsat-8, despite its short range and resolution (up to 30 m), supports the calculation of basic vegetation indices such as NDVI, GNDVI, EVI, SAVI, and MSAVI. The lack of a red edge channel limits its ability to calculate NDRE; however, Landsat-8 retains its value due to its extensive historical archive and consistently high data quality. Meanwhile, Sentinel-2 provides 13 multispectral channels, including narrow wavelengths in the visible, red edge, near- and short-wave infrared ranges, particularly sensitive to chlorophyll content and canopy biochemistry. Sentinel-2 bands allow a variety of normalized indices to be acquired: NDVI, GNDVI, EVI, SAVI, and MSAVI, in addition to NDRE, an index that improves the separation of dense foliage while NDVI saturation [35]. Using multiple vegetation indices rather than a single NDVI offers phenological, biochemical, and physiological meaningful transformations of spectral data that improve class separability, particularly for simple classifiers, by explicitly encoding various aspects of vegetation structure and health that raw spectral bands alone may not optimally represent [42]. NDVI and GNDVI measure overall greenness and chlorophyll content, EVI enhances the vegetation signal in areas with high biomass such as mature cotton canopies, while SAVI and MSAVI reduce the influence of soil background in sparsely vegetated fields; NDRE (only for Sentinel-2) improves the detection of subtle changes in crop condition. Indices demonstrate the added value of combining spectral data of different wavelengths for crop mapping in complex agricultural environments [43].

3.4. Machine Learning Techniques

Advanced machine learning techniques combined with satellite data revolutionize agricultural mapping and monitoring activities. Selecting an appropriate algorithm, optimized classifier parameters, dataset, and input feature scenario is essential for maximizing model performance in crop monitoring. Large-scale remote sensing dataset processing, analysis, classification, and mapping have significantly improved since the development of Google Earth Engine (GEE), a dependable cloud-based computing platform [44]. GEE features several machine learning algorithms for satellite image classification, where the classification package includes diverse supervised models like GBT, RF, KNN, CART, and MD. Ensemble classification techniques, such as RF and GBT, are learning models that generate a set of classifiers, rather than a single one, for each input point, and afterwards decide outcome class based on their optimal predictions. GBT applies an ensemble of decision trees, gradually trains each branch model, then fits the next tree using the residuals of the previous outputs, enhancing classification performance by offering a weighted composite of all previous trials. GBT can effectively address complex, multi-dimensional, nonlinear connections and feature interactions; however, it might be expensive to compute and is prone to overfitting [45]. RF combines the output of several decision trees to produce a single result by assembling a set of tree-structured classifiers enhanced with random behavior [46]. KNN is a supervised algorithm for classification problems which assigns outcomes based on majority vote among a k number of nearest points in the feature space. KNN performs multivariate modeling in tasks when reliable parametric estimates of probability densities are either difficult to determine or are not well defined [47]. CART is a binary multidimensional statistical strategy that applies a decision tree model produced using a set of training data to interpret continuous and distinct variables as targets and predictors. CART has the advantage of being a highly automated method that is simple to understand, demonstrate, and assess. However, when analysis considers minimal training data, it returns inaccurate predictions [48]. The MD classifier assigns samples to the class whose mean feature vector is closest to the multidimensional feature space. Its main advantages are computational efficiency, simplicity, and the ability to classify all samples based on the available training data. However, since the MD classifier considers only the distance to class centroids and does not account for within-class variability or feature covariance, its ability to represent complex class distributions is limited. This limitation is particularly clear in heterogeneous agricultural landscapes, where crop classes exhibit substantial spectral variability and overlapping feature characteristics. Under such conditions, representing each class by a single centroid may not adequately characterize the underlying distribution of class responses, increasing the likelihood of misclassification. Consequently, the MD classifier generally exhibits lower classification performance than ensemble-based approaches, which are better able to model complex decision boundaries and nonlinear relationships among features [49].

3.5. Hyperparameter Optimization

Hyperparameter optimization was conducted for all classification models across the four datasets, including the Landsat-8 (DS-1), Sentinel-2 (DS-2), integrated Sentinel-2 and Sentinel-1 (DS-3) datasets, and Sentinel-1 SAR only (DS-4) as a benchmark for the integration process. The classification experiments were performed using three input scenarios corresponding to different feature combinations, covering three temporal periods to maximize the input information. For the optical datasets (DS-1 and DS-2), Scenario 1 utilized the NDVI together with the related red and NIR bands. Scenario 2 employed multiple vegetation indices, including NDVI, EVI, GNDVI, SAVI, and MSAVI, in addition to the related spectral bands R, G, B, and NIR; while for Sentinel-2 data, the RE band and NDRE were also included. Moreover, for the SAR dataset (DS-4), Scenario 3 used the Sentinel-1 backscatter features consisting of VV, VH polarization, and the VV/VH ratio. Furthermore, the integrated optical-SAR dataset (DS-3) combined all optical indices and spectral bands of Scenario 2 with the SAR features of Scenario 3.
To identify the optimal model configurations, hyperparameter tuning was performed using a grid-search strategy. For GBT, the number of trees varied between 25 and 200, and learning rates of 0.01, 0.05, and 0.10 were assessed. For RF, the number of trees was evaluated at 25, 50, 75,100, 150, and 200, while the number of randomly selected features at each split (mtry) was tested using values of 1, 3, 5, 7, 9, and 11. For KNN, the number of neighbors (k) was tested using values of 3, 5, 7, 9, 11, 15, 21, 31, and 51. For CART, maximum tree depths (maxNodes) of 5, 10, 20, 30, 40, 50, 60, 70, 80, 90, 100, 150 and 200 were examined. The MD classifier was implemented using the default distance measure; thus, it does not require extensive hyperparameter tuning [50]. The optimal parameter configuration was identified for each classifier under each dataset and input-feature scenario based on the highest classification accuracy achieved on the validation samples. Nevertheless, to ensure a fair and consistent evaluation, a unified parameter setting was subsequently adopted for each classifier across all datasets and input scenarios. The final classifier parameters consisted of 100 trees with a learning rate of 0.05 for GBT, 50 trees with mtry = 3 for RF, k = 7 for KNN, and a maximum of 30 nodes for CART. This approach ensures a reliable and consistent comparison among datasets while providing a more rigorous assessment of how variations in the number and type of input features influence classification performance.

3.6. Accuracy Assessment

Classification performance is evaluated using standard accuracy metrics derived from confusion matrices for training and validation processes, including Overall Accuracy (OA), Kappa coefficient (κ), Producer’s Accuracy (PA), and User’s Accuracy (UA). The overall accuracy is calculated as the percentage of pixels correctly classified out of the total number of pixels (Equation (1)). The Kappa coefficient (κ) measures the degree of agreement between observed and predicted classifications, other than by chance (Equation (2)). Producer’s Accuracy is the probability that a reference pixel of a given class is correctly classified (Equation (3)), while User’s (consumer’s) Accuracy is the probability that a pixel assigned to a given class truly belongs to that class (Equation (4)) [51].
O A = i = 1 k x i i N
where x i i is the correctly classified pixel number for class i, k is the class number, and N is the total number of pixels.
κ = p o p e 1 p e
where p o is the observed accuracy and p e is the expected accuracy based on random probability.
P A i = x i i x i +
U A i = x i i x + i
where xii denotes the number of correctly classified samples for class i (the diagonal element of the confusion matrix), x i + represents the total number of reference samples belonging to class i (row total), and x + i represents the total number of samples predicted as class i (column total). Accordingly, P A i is calculated as the ratio of correctly classified samples to the total number of reference samples in class i, while U A i is calculated as the ratio of correctly classified samples to the total number of samples assigned to class i by the classifier.
Given that models exhibited highly similar classification accuracies, a McNemar test is applied to determine whether the performance variance was statistically significant using the same validation samples (Equation (5)) [52].
X 2 = b c 1 2 b + c
where a = samples where both GBT and RF achieved correct classification, b = samples correctly classified by RF but misclassified by GBT, c = samples misclassified by RF but correctly classified by GBT, and d = samples where classifiers are incorrect.

3.7. Machine Learning Classification

The main goal of the study is to assess machine learning crop classification techniques using multi-sensor satellite data with multiple input feature scenarios. The classification processes are applied considering three input feature scenarios of NDVI and its related bands, multi-index inputs and their relevant bands, and a SAR VV, VH, and VV/VH ratio combination. Five different algorithms were implemented for land cover classification using Landsat-8 images (DS-1), Sentinel-2 data (DS-2), Sentinel-2 improved with Sentinel-1 information (DS-3), and Sentinel-1-only bands (DS-4) and their results are presented and evaluated (Figure 5).

4. Results and Discussion

4.1. Vegetation Indices’ Temporal Variation

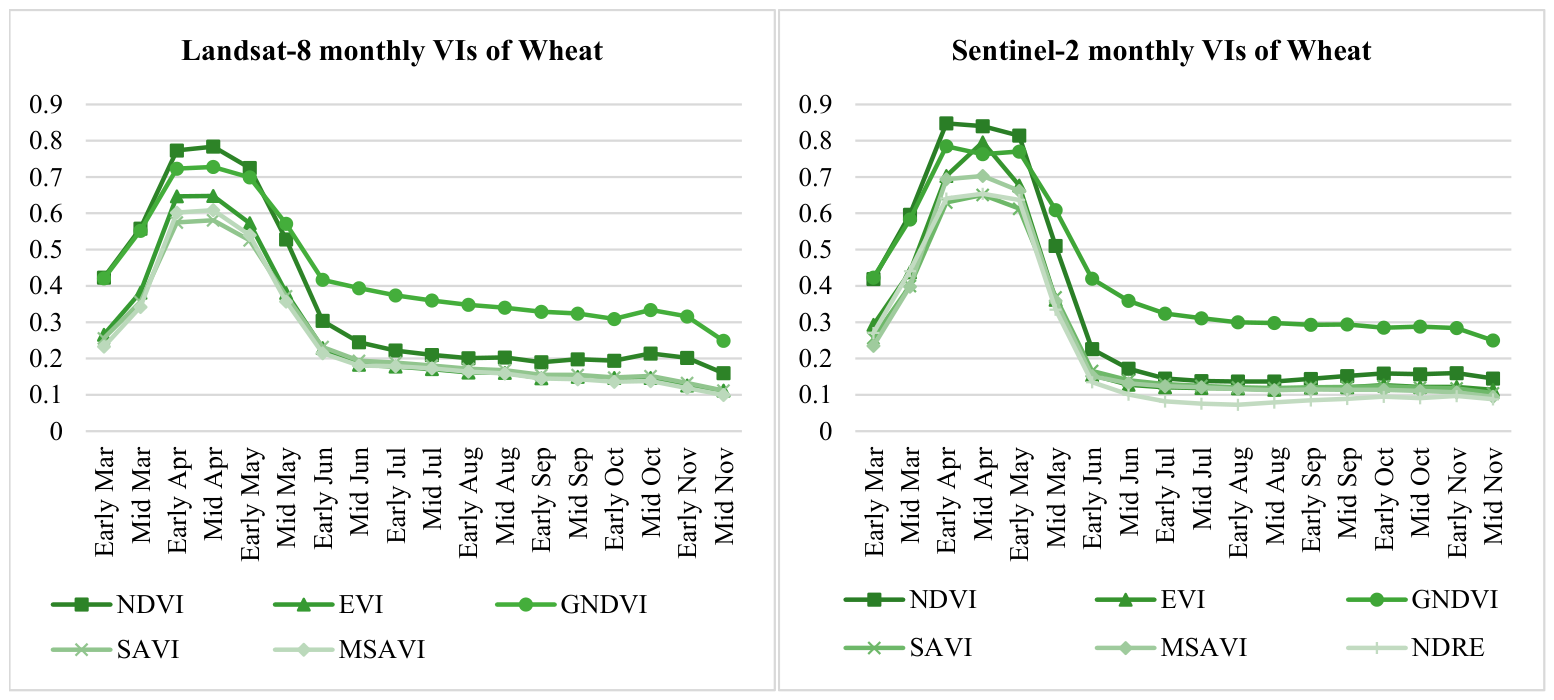
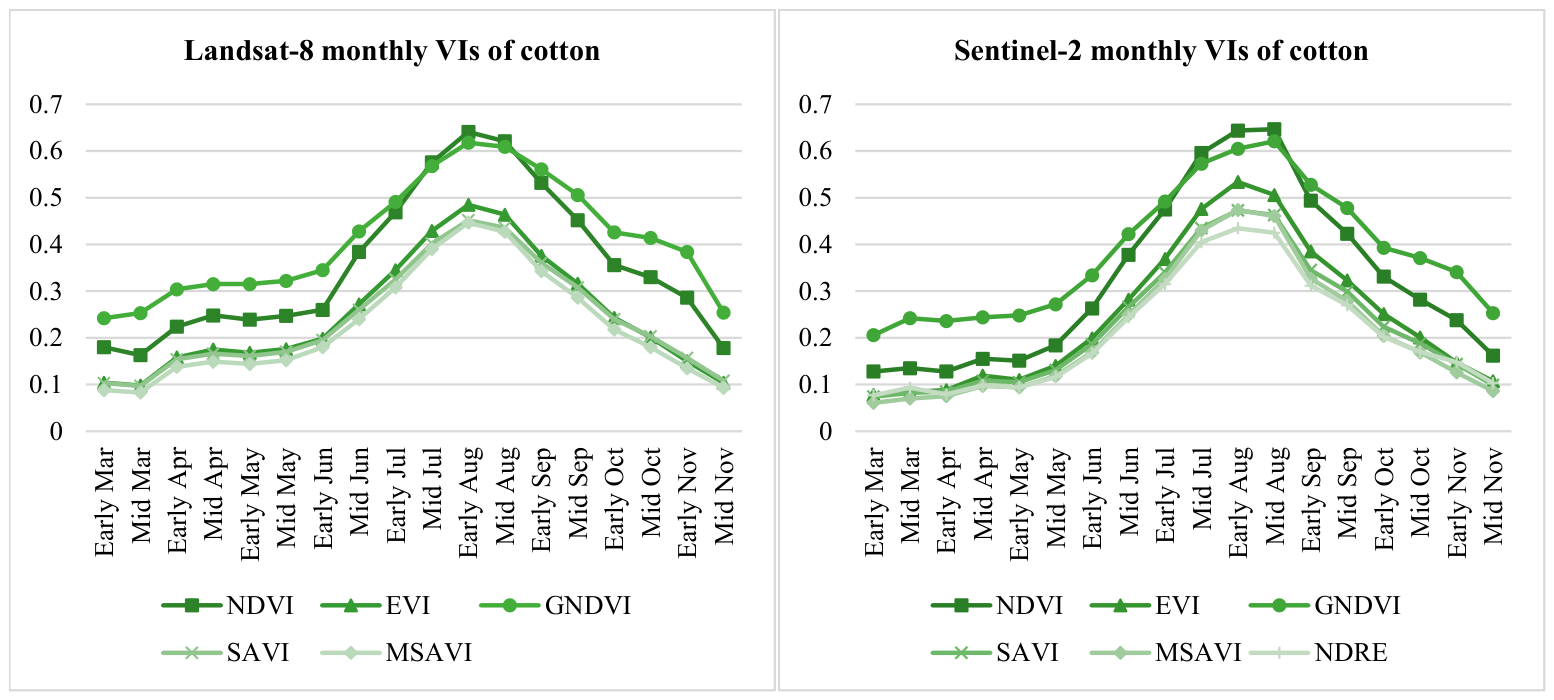
The temporal analysis of vegetation indices was conducted using Landsat-8 (DS-1) and Sentinel-2 (DS-2) surface reflectance to ensure consistent temporal coverage throughout the study period (March–November 2025). For each month, two composite images representing the early and mid-month periods were generated by averaging all available cloud-free scenes (<15% cloud cover). The number of scenes contributing to each composite varied temporally, ranging from an average of two scenes during periods with higher cloud contamination to up to seven scenes during relatively cloud-free periods, thereby ensuring improved temporal consistency and enabling the characterization of vegetation dynamics across the main phenological stages of wheat and cotton. Since Landsat-8 lacks a red edge band to derive NDRE, the index was calculated only for Sentinel-2. While including NDRE enhances the sensitivity to chlorophyll content and supports crop discrimination for Sentinel-2 data, its absence in Landsat-8 introduces a minor limitation in feature space comparability between datasets. However, the overall comparison remains consistent, as both datasets share a common set of core vegetation indices and related bands used for scene classification. Seasonal variations in the vegetation indices revealed clear phenological patterns: wheat had its highest value in April, corresponding to maximal canopy development, whereas cotton growth peaked in late August, suggesting the off-season growth phase. During the mid-season, wheat reaches complete maturity with decreased indices; meanwhile, cotton attains full blossom with increased values (Figure 6 and Figure 7). Multi-index analysis guarantees additional characteristics of soil effects, chlorophyll content, and canopy structure, which offer further data for classification [53].

4.2. Vegetation Indices’ Spatial Distribution

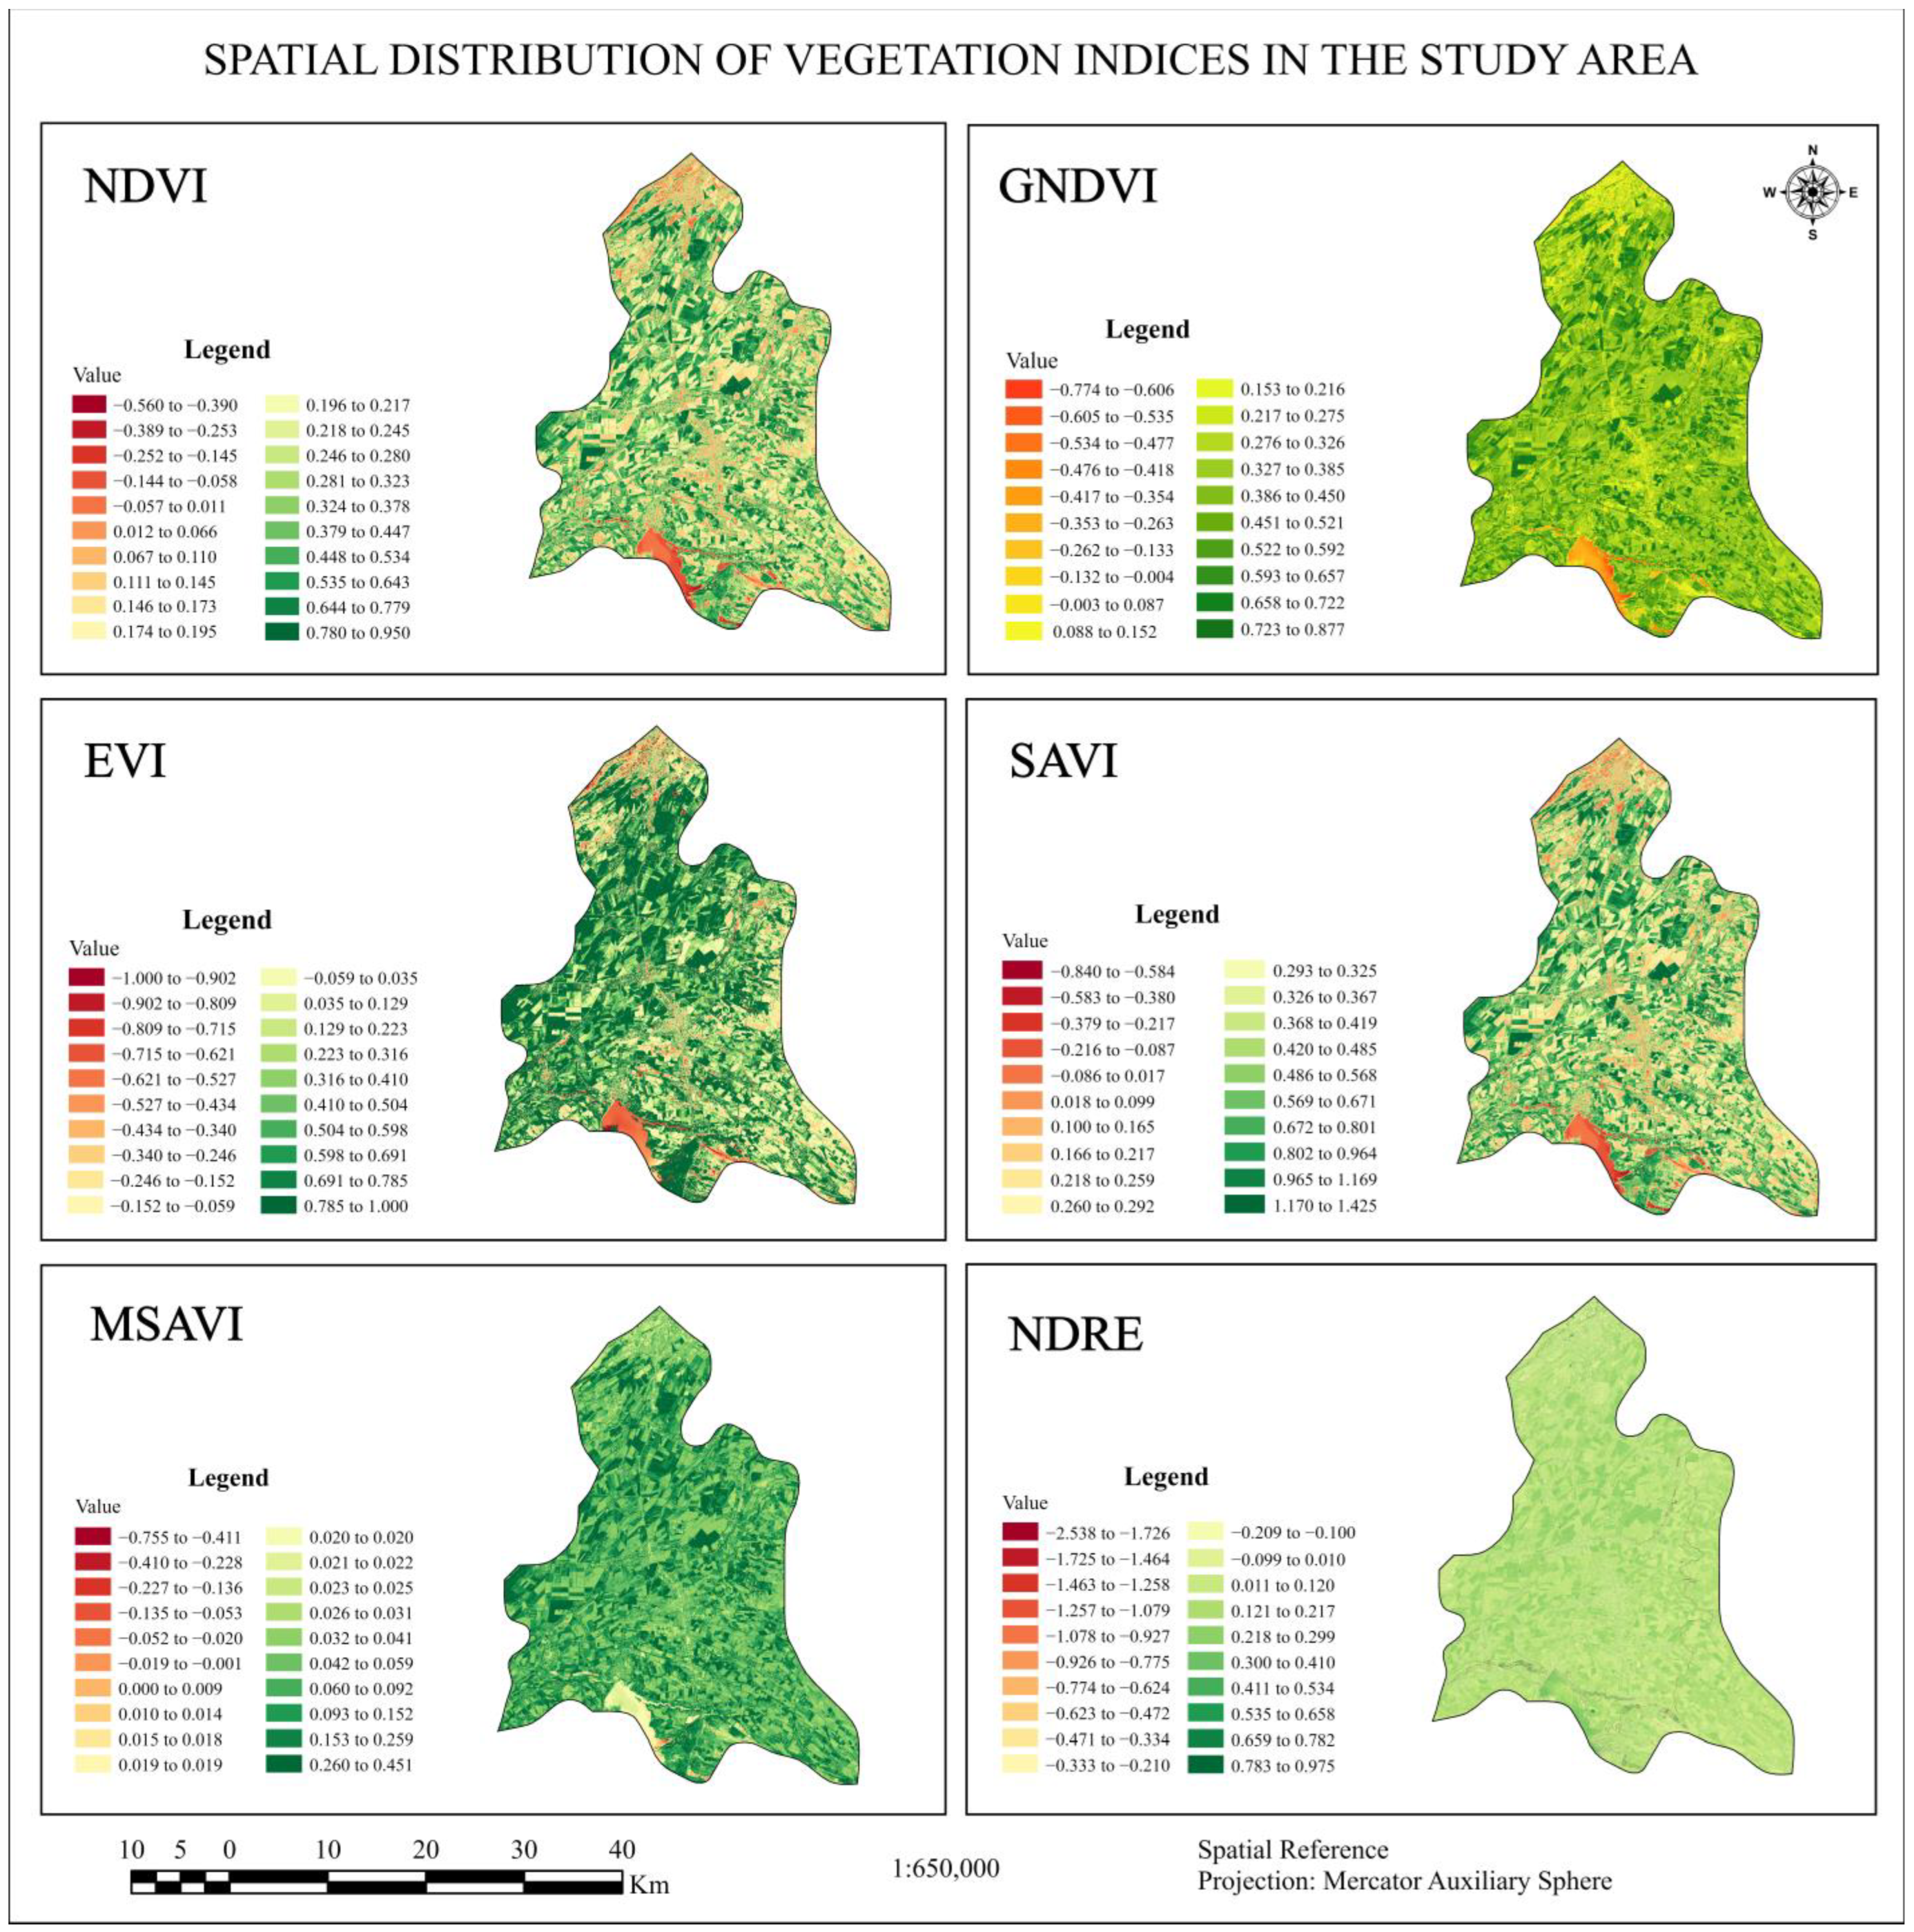
For visual investigation, vegetation indices are derived using the Sentinel-2 dataset, rich with NDRE bands, in the middle of the growing season since wheat and cotton possess separate spectral properties. NDVI, GNDVI, EVI, SAVI, MSAVI, and NDRE present a heterogeneous distribution of vegetation throughout the entire scene; high vegetation indicators in the East and West regions reveal agricultural activities, while low values in the North, South, and Central regions reflect non-agricultural activities of water and urban features (Figure 8).
Following the visualization of vegetation indices, a correlation-based feature assessment using the Correlation Feature Selection (CFS) approach was conducted to evaluate the relative relevance of the derived indices for crop discrimination. The analysis indicated that NDVI, GNDVI, and SAVI exhibited the strongest associations with crop classes, with correlation coefficients of 0.97, 0.95, and 0.88, respectively. Meanwhile, moderate correlations were observed for EVI, MSAVI, and NDRE (0.72, 0.76, and 0.81, respectively), suggesting their complementary value for distinguishing crops with similar spectral characteristics. Although NDVI, GNDVI, and SAVI exhibit similar spatial distribution due to their sensitivity to vegetation greenness, their high correlation indicates partial redundancy among these indices. In contrast, EVI, MSAVI, and NDRE provide unique information by capturing variations related to canopy structure, soil background, and chlorophyll content. The combination of correlated and complementary indices improves the overall discriminative capability of the classification models, as basic indices support general vegetation detection, while advanced indices enhance class separability under complex agricultural conditions [54].

4.3. SAR Backscatter Temporal Variation

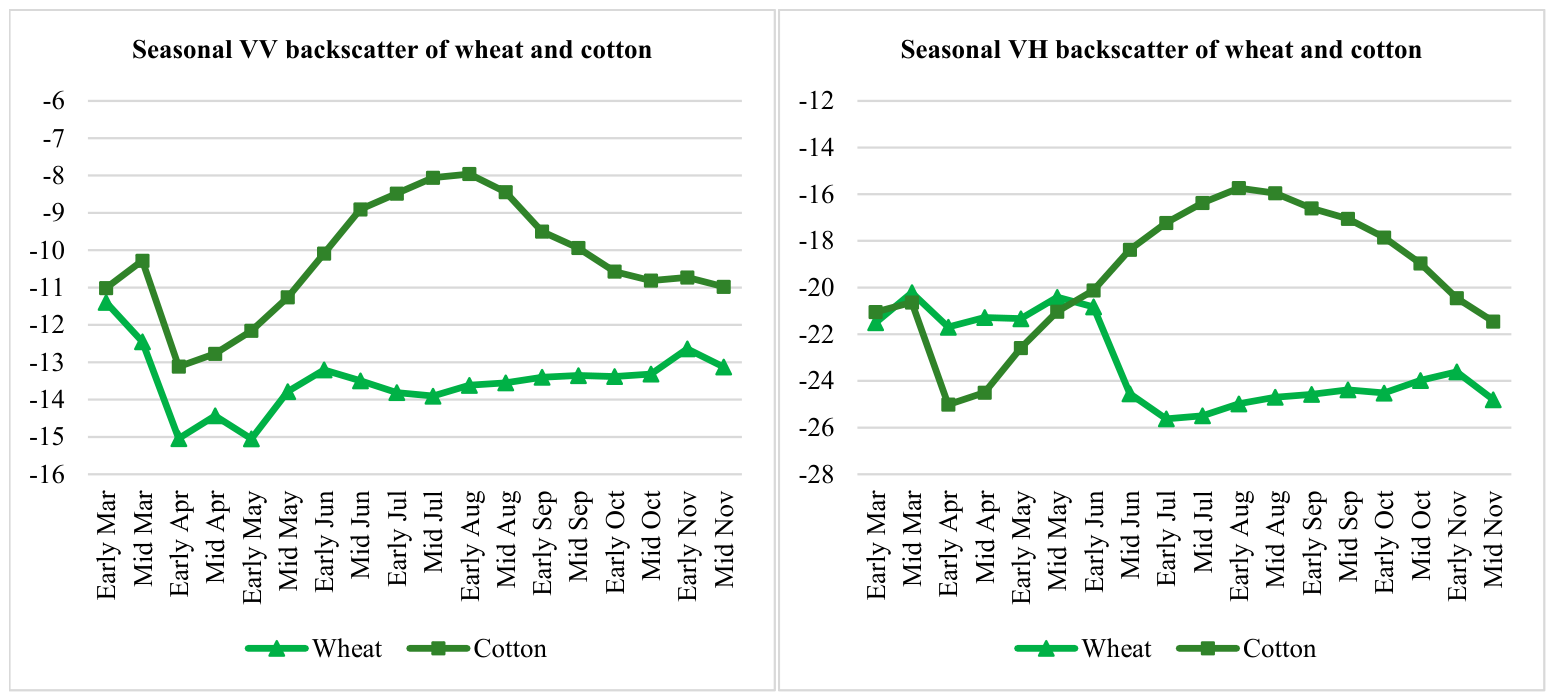
In addition to the temporal dynamics of VIs for cotton and wheat using Landsat-8 and Sentinel-2 data, the seasonal VV and VH backscatter profiles are presented using Sentinel-1 measures (Figure 9). Sentinel-1 SAR data is well suited for monitoring scattering and backscatter differences between wheat and cotton, as it captures variations in crop biomass, vegetation water content, and canopy structural characteristics. Thus, supplementary SAR measures enable improved crop separability while mitigating the influence of soil moisture variability.

4.4. Classification Findings

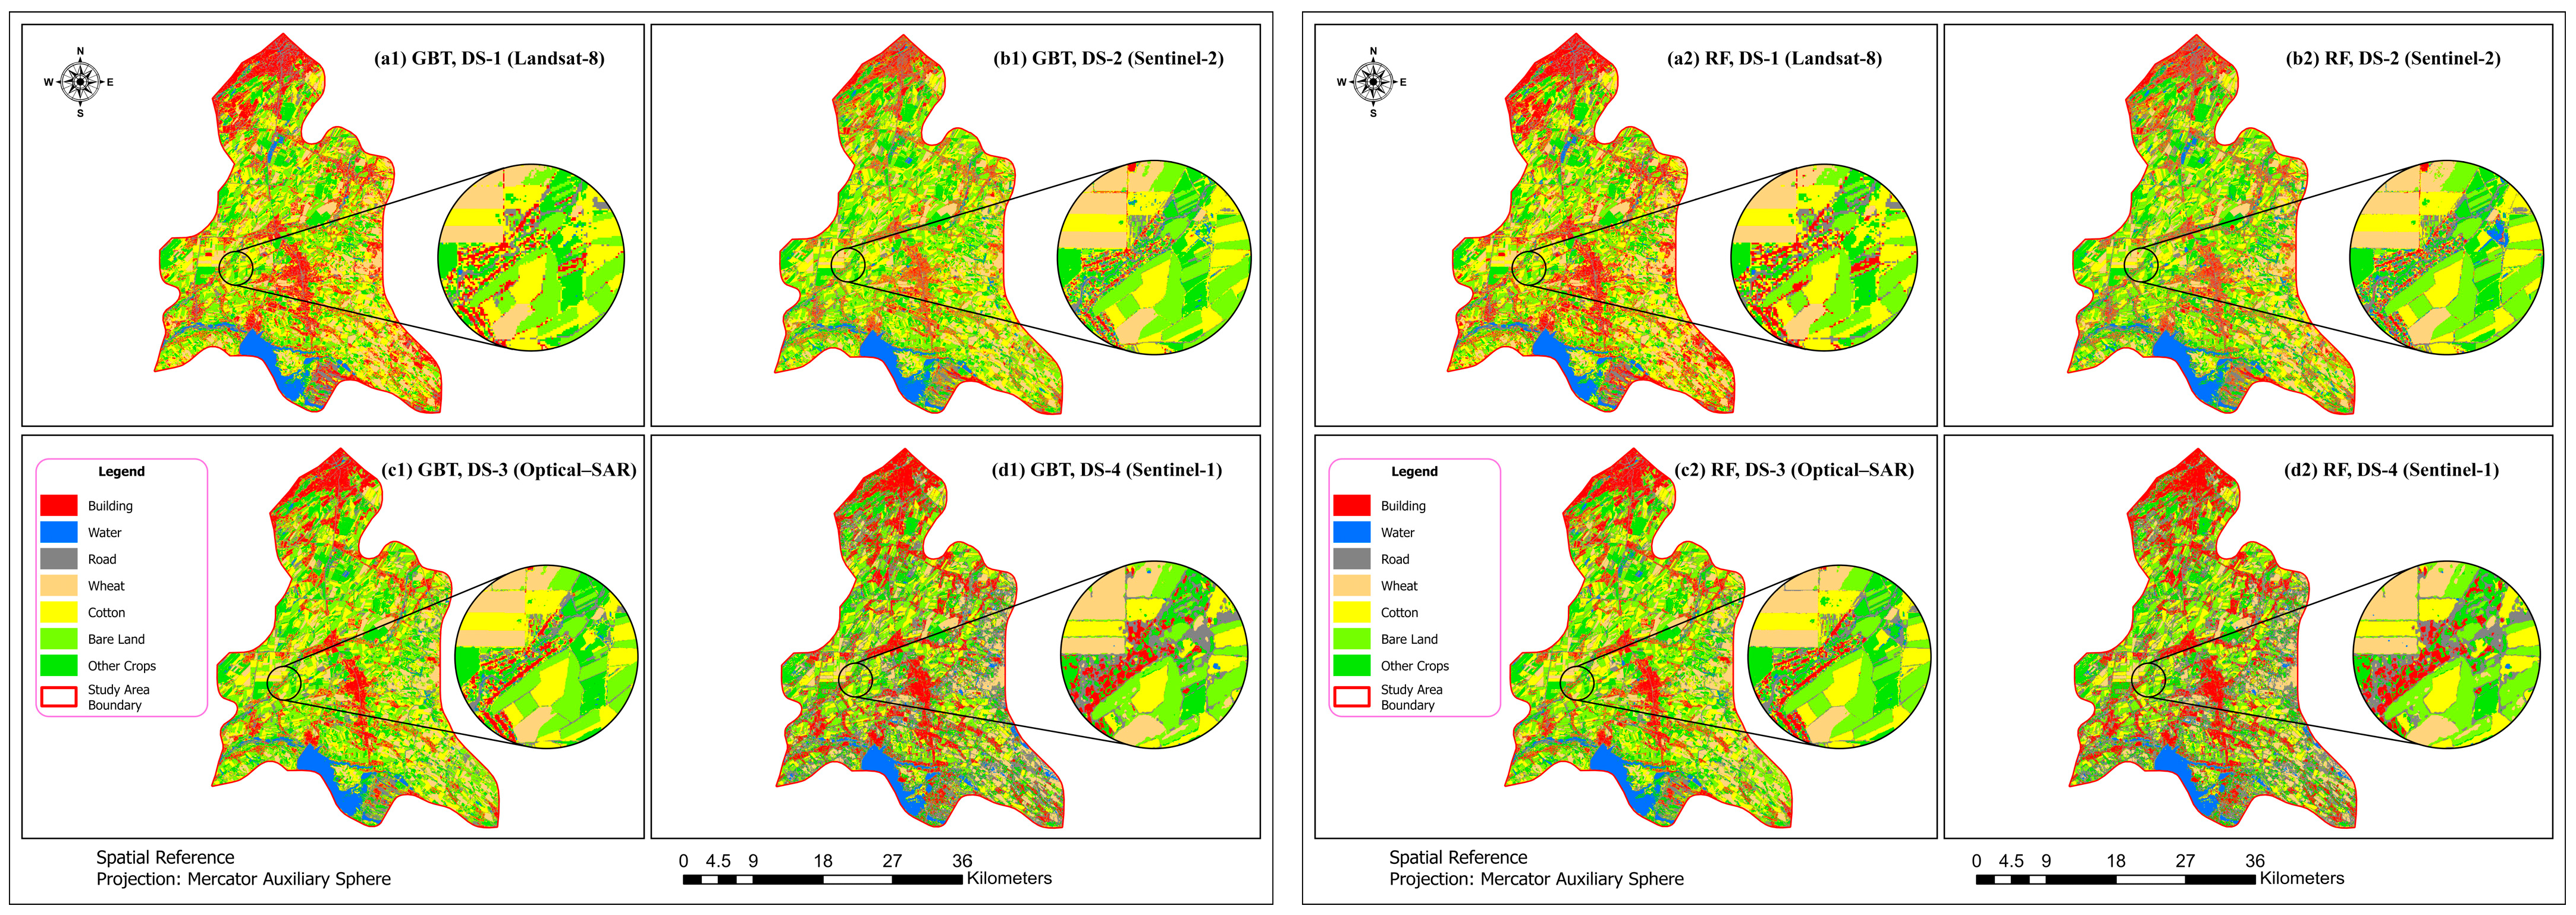
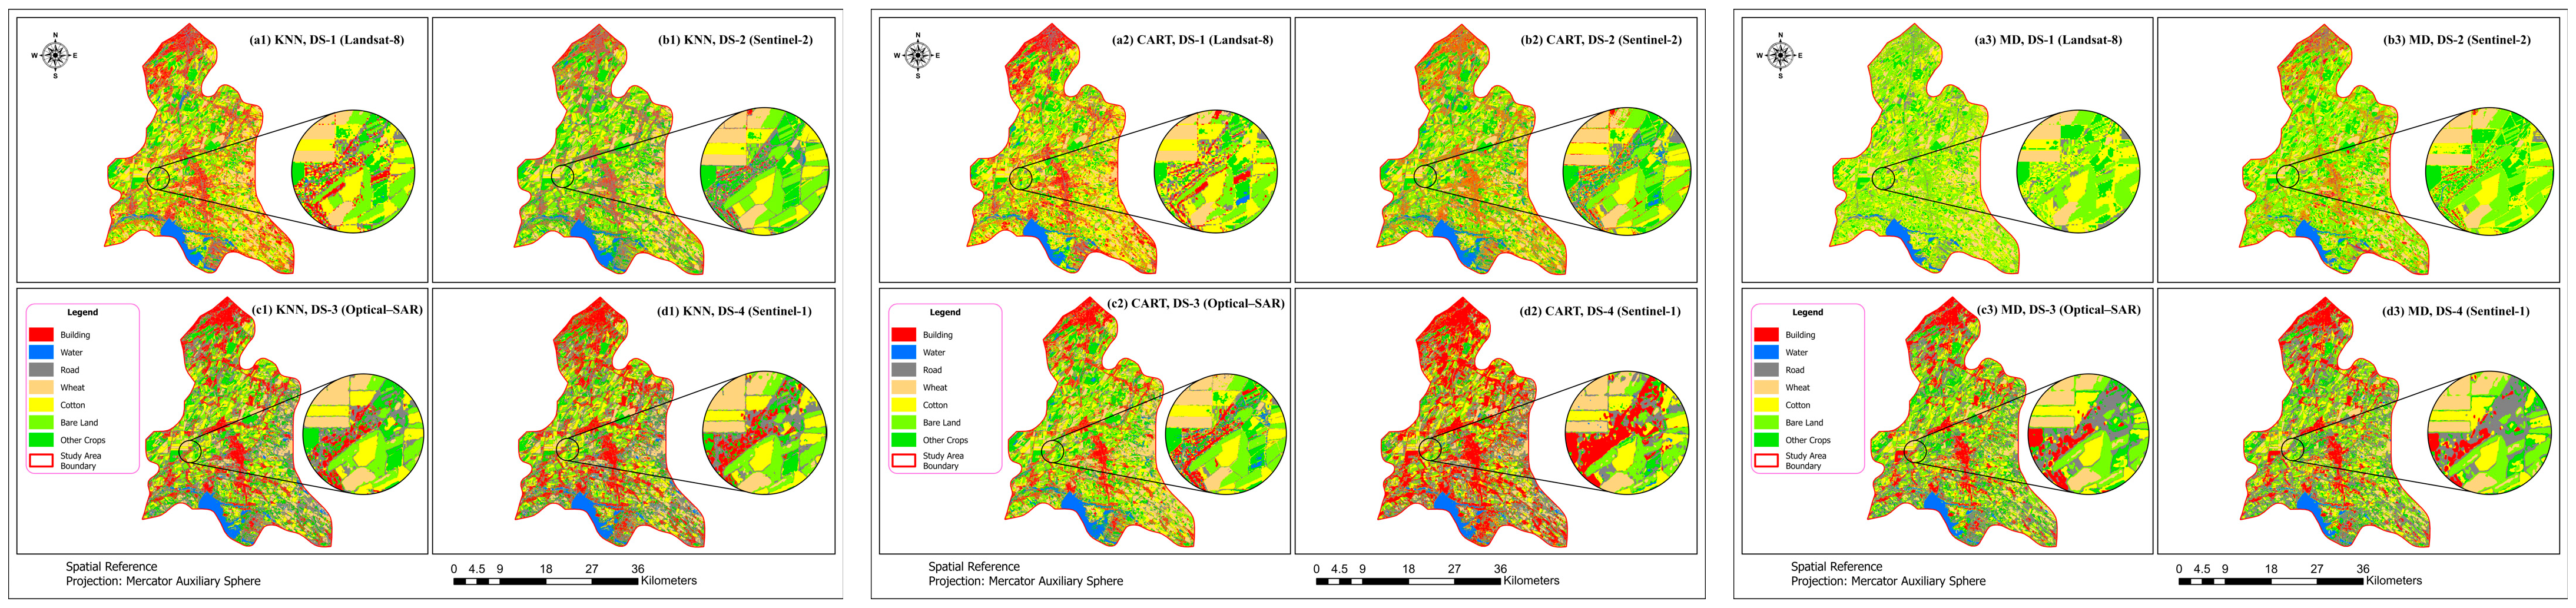
Qualitative comparison with reference data showed that GBT and RF classifiers (Figure 10) achieved the best performance using the Sentinel-2 and Sentinel-1 integrated dataset (DS-3) with all VI input features, consistently outperforming other classifiers, datasets, and input scenarios. The KNN and CART techniques showed moderate performances with slightly less consistency across fields, likely due to overfitting and sensitivity to noise, while MD classification typically demonstrated the lowest accuracy, likely due to the assumption of a normal class distribution and uniform variance, making it unsuitable for complex agricultural landscapes (Figure 11). Classification errors were mainly observed in areas with mixed pixel composition, where spectral properties were affected by the soil background. Such limitations are closely related to spectral confusion between crop and non-crop classes in heterogeneous landscapes. The inclusion of non-vegetated classes as contrast features helped mitigate the confusing effect by providing clearer class boundaries and improving the model’s ability to distinguish crops from surrounding land-cover types. The notable impact was particularly evident in areas with complex land-cover patterns, where mixed pixels often reduce classification accuracy. Validation using independent field reference data, verified by local agricultural records, confirmed that wheat and cotton were mapped with promising accuracy at the mid-season growth periods. Misclassifications were mainly observed for cotton, whose spectral characteristics were similar to some other crops at early and mid-growth stages.
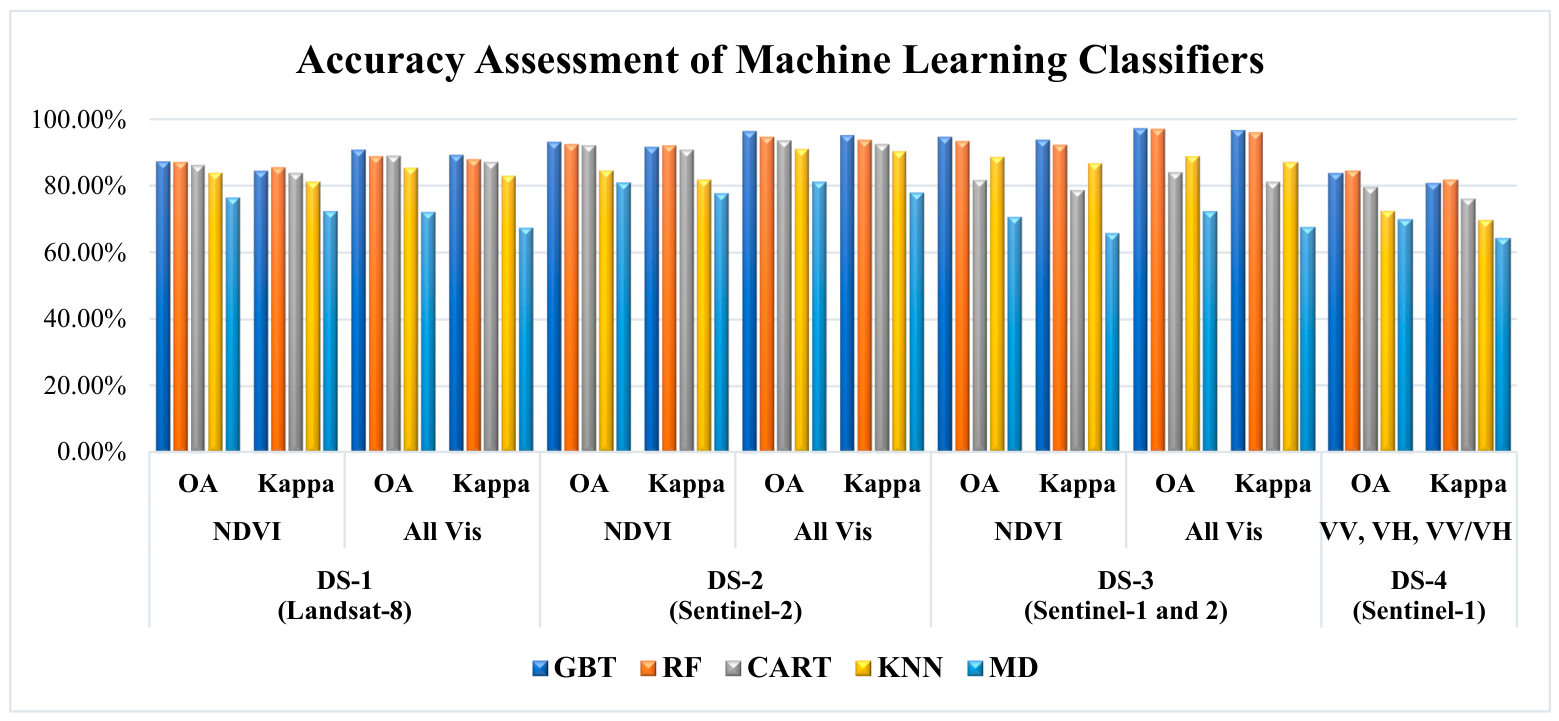
Quantitative result analysis using Overall Accuracy (OA) and Kappa coefficient (κ) (Table 5, Table 6 and Table 7 and Figure 12) demonstrated that GBT achieved the highest OA (97.06%), slightly outperforming RF (96.92%), with the lowest classification errors across the entire scene. Since GBT and RF achieved comparable classification accuracies, a McNemar significance test (Equation (5)) was conducted to determine whether the observed difference in performance was statistically significant. Among the 714 validation samples, 686 were correctly classified by both classifiers, eight were correctly classified only by GBT, five were correctly classified only by RF, and 15 were misclassified by both models. The resulting McNemar statistic (χ2 = 0.308, p = 0.579) indicates that the performance difference between GBT and RF is not statistically significant.
The superiority of ensemble approaches for heterogeneous agricultural landscapes is achieved by combining numerous weak learners (such as decision trees), allowing for processing multi-dimensional datasets (DS-3) and complex interactions of spectral bands and vegetation indices (Scenario 2) to produce a more accurate and stable model than any single learner could achieve alone. Meanwhile, KNN and CART models performed mediocrely (93.43% and 90.91% respectively) due to the “curse of dimensionality” in multivariate spaces requiring statistical assumptions and sensitivity to multiplex features. On the other hand, the MD classifier achieved lower accuracy (81.12%), with higher error rates observed in areas characterized by class boundaries and mixed compositions. This reduced performance can be attributed to its assumption that all classes follow a normal distribution with equal variances, which is rarely satisfied in real agricultural landscapes due to variations in crop phenology, soil background, and spectral characteristics. Therefore, MD is less suitable for complex agricultural environments and is mainly recommended for applications where computational simplicity and limited resources are prioritized. Despite the raised limitations of the Kappa coefficient, including concerns regarding its randomness baseline, it was reported in this study because it remains a commonly adopted metric in remote sensing research. Its inclusion enables meaningful comparison with previously published studies, being a part of the culture in remote sensing and other fields.
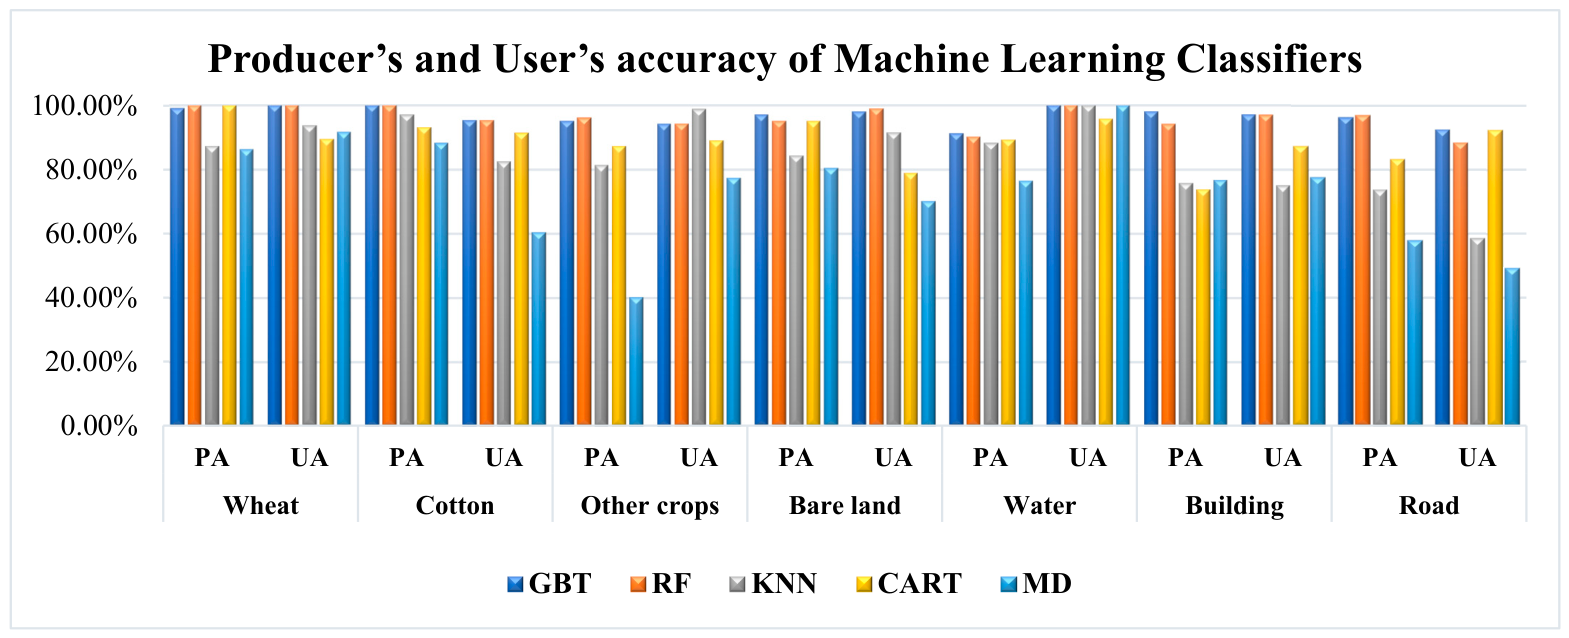
While overall accuracy and Kappa coefficients reflect the classification performance across the entire scenes, they do not represent specific crop classification quality. Therefore, to explicitly assess wheat and cotton classification performance, Producer’s Accuracy (PA) and User’s Accuracy (UA) were calculated using DS-3 with Scenario 2 (Table 8, Figure 13). PA and UA show how good the system is at identifying wheat, cotton, and other classes. Wheat achieved very high classification performance, with PA reaching up to 99.02% (GBT) and 100% (RF), and UA reaching 100% for both classifiers. Similarly, cotton exhibited consistently strong results, with PA reaching 100% for both GBT and RF, and UA values reaching up to 95.33% for both models, indicating reliable crop identification with minimal omission and commission errors. Other crops showed high reliability for PA and UA, while bare land exhibited near-perfect separability. Water was also classified with high consistency, indicating very low commission errors. Built-up areas were accurately detected, reflecting strong structural separability in the feature space. In contrast, the road class showed comparatively lower performance, suggesting higher confusion with spectrally similar urban or bare surfaces. Overall, GBT and RF provided the most stable and robust performance across all classes, outperforming KNN, CART, and MD in terms of both producer and user accuracies and ensuring reliable land cover discrimination.
Spectral and backscatter signal integration works well for both wheat and cotton due to the uniform growth and strong reflection of radar signals, providing reliable classification performance beyond a regional scale, and achieving the crop mapping requirements. The integration of optical and SAR Sentinel data (DS-3) improved classification accuracy by up to 1.54% for GBT and 0.98% for RF in Scenario 1, and by up to 0.84% for GBT and 2.38% for RF in Scenario 2 compared with single optical sensor approaches (DS-2), highlighting the additional information provided by radar backscatter on canopy structure and moisture content [55]. Sentinel-1 radar sensors are highly effective, particularly when optical sensors offer contradictory information about moisture and structure or humid conditions, illustrating the advantages of radar and optical data fusion along fields with mixed pixels in high biomass areas. However, it is important to note that SAR backscatter is influenced not only by crop structural characteristics but also by surface and canopy moisture conditions. In irrigated and heterogeneous agricultural environments such as the study area, this may introduce ambiguity between crop-related signals and moisture-induced variations, representing a source of uncertainty in interpreting the contribution of Sentinel-1 data [56]. Moreover, the combined dataset (DS-3) achieved an improvement of up to 10.77% over Sentinel-1 only data (DS-4) for GBT using NDVI input, and up to 13.28% using multiple vegetation indices, while also improving RF performance by up to 8.82% (NDVI) and 12.45% (multiple VIs), reflecting the added value of complementary optical and SAR information due to improved class separability and reduced spectral ambiguity.
In addition, using multiple vegetation indices improved the discrimination of crops with overlapping spectral signatures and led to a consistent increase in overall classification accuracy compared with NDVI alone, reaching up to 3.52% for the Landsat dataset (DS-1), 3.21% for the Sentinel-2 dataset (DS-2), and 2.51% for the combined Sentinel-2 and Sentinel-1 dataset (DS-3) for GBT, and up to 1.69%, 2.23%, and 3.63% for RF, respectively, confirming the importance of collecting additional spectral information on fields, phenological timing, chlorophyll content and soil effects [57]. Consequently, the sole reliance on NDVI proved inadequate for accurate crop-background segmentation, particularly under heterogeneous agricultural conditions where spectral confusion was prevalent. Meanwhile, the multi-index approach enhanced classification robustness by capturing both biochemical and structural characteristics of vegetation, thereby enabling more accurate discrimination of spectrally similar crop types across complex agricultural landscapes [58]. Furthermore, the results obtained from Sentinel-2 imagery (DS-2) outperform those from Landsat imagery (DS-1) for both GBT and RF across the two scenarios, with gains of up to 5.83% (GBT) and 5.27% (RF) in Scenario 1, and up to 5.52% (GBT) and 5.81% (RF) in Scenario 2, showing the efficiency of the highest spatial resolution data for image classification techniques. Additionally, using Sentinel-2 highlighted the value of the red edge band and NDRE index for detecting subtle differences in chlorophyll content.
While most classifiers benefited from the incorporation of additional vegetation indices and SAR–optical data fusion, several negative impacts were observed for less robust models. CART exhibited a slight decline from DS-2 to DS-3 under the all-VIs scenario (90.91% to 88.81%), indicating limited capacity of a single decision tree to fully exploit the more complex relationships introduced by data fusion. A more substantial reduction was observed for KNN, where the inclusion of SAR features consistently degraded performance in both NDVI and all-VIs scenarios (from 92.03% to 81.68% and from 93.29% to 83.78%, respectively), reflecting sensitivity to increased feature dimensionality in distance-based classification. Similarly, MD showed persistent performance deterioration when additional vegetation indices were introduced for Landsat-8 data (76.34% to 72.11%) and when Sentinel-1 SAR data were integrated with Sentinel-2 imagery (approximately 80.98–81.12% down to 70.63–72.31%), highlighting its limitations in handling high-dimensional and nonlinearly separable feature spaces. Overall, while SAR–optical fusion and multi-index inputs improved ensemble-based methods (GBT and RF), they had neutral to negative effects on KNN, CART, and MD.

5. Conclusions

Mapping various crop types is among the most crucial resources for agricultural and environmental activities. Several approaches are presented for farmland monitoring using advancing remote sensing data collection techniques and cutting-edge analysis strategies. However, adequate crop mapping is still lacking in several diverse areas due to crop land fragmentation, agricultural practice variation, and single-sensor data constraints. Moreover, traditional agricultural classification practices are insufficient to satisfy real-world needs due to relying heavily on labor-intensive and human error-prone manual inspection processes. Farming practices emphasize the importance of multi-sensor datasets and machine learning techniques to identify subtle variations in crop phenology and structure, particularly for crops with overlapping spectral characteristics.
The proposed framework integrates multi-satellite imagery across four distinct datasets and evaluates three input scenarios using five machine learning classifiers to enhance agricultural monitoring under heterogeneous landscape conditions. By combining multi-sensor data (Landsat-8, Sentinel-2, Sentinel-1 integrated with Sentinel-2, and Sentinel-1 images) with multi-vegetation index representations, the framework provides complementary spectral, structural, and temporal information, enabling more reliable crop classification and improved discrimination of wheat, cotton, and other crop classes under the studied experimental conditions.
Findings proved that: (1) Sentinel-2 surpasses Landsat-8 with respect to all classifiers due to its improved spatial resolution and red edge band. (2) The integration of multiple Sentinel sensors (SAR + optical) reduces the likelihood of misclassification near field boundaries and mixed pixels, verifying the valuable information of radar backscatter measures regarding moisture content and canopy structure. (3) A multi-index approach provides more consistent and accurate classification results than using NDVI alone, investigating the greenness, biomass accumulation, and chlorophyll calculated features. Multi-indices offer phenological, biochemical, and physiological substantial variations in spectral data that support class separability and reflect various features of vegetation structure and health; yet feature selection is crucial as too many input features can reduce performance for simple classifiers lacking the capacity to learn complex spectral relationships. (4) Ensemble machine learning methods, particularly GBT and RF, consistently outperformed KNN, CART, and MD by aggregating multiple base learners, such as decision trees, into a unified predictive model, enabling more effective handling of high-dimensional feature spaces. The distance-based and single-tree classifiers (KNN, CART, and MD) are sensitive to high-dimensional and fused SAR–optical feature spaces, often leading to reduced accuracy under complex input scenarios. This indicates limitations in handling nonlinearly separable data and the challenges associated with high-dimensional feature spaces. In contrast, ensemble methods demonstrate greater robustness, suggesting that model selection remains critical when integrating multi-sensor remote sensing data.
The findings are derived for the tested region due to the availability of reference data and reflect the performance of the proposed approach under the specified experimental conditions, while remaining inherently influenced by the characteristics of the dataset and the study area. Therefore, external validation, transferability assessment, and controlled ablation experiments are recommended to further strengthen future evaluations. The proposed framework demonstrates strong potential for enhancing crop classification accuracy within the investigated area. However, further research is needed to examine its applicability across different agro-ecological zones and to systematically assess the contribution of individual data sources and feature sets under more controlled experimental designs. In addition, future studies may explore advanced deep learning approaches, such as convolutional and recurrent neural networks, to better capture complex spatial and temporal dependencies, while the integration of environmental and topographic variables is expected to further improve classification performance and support more comprehensive agricultural monitoring across diverse landscapes.

Author Contributions

O.T. conceived of the presented idea, collected the field data, and developed the used codes; M.F. and O.T. designed the methodology, managed the datasets and reference data, performed the data analysis, and drafted the initial manuscript; K.A., A.B., R.K., L.F. and Z.M. revised the methods and findings of the work. All authors have read and agreed to the published version of the manuscript.

Funding

This research received no external funding.

Data Availability Statement

The materials, source codes, and supplementary data used in this study are publicly available through the following OSF repository to support transparency, reproducibility, and further research: https://doi.org/10.17605/OSF.IO/JY4F8 (accessed on 25 April 2026).

Acknowledgments

The Ministry of Agriculture in Uzbekistan is acknowledged for providing the agricultural field boundaries of cotton, wheat, other crops, and bare land classes. Mohamed Fawzy is funded by the Stipendium Hungaricum Scholarship under the joint executive programme between Hungary and Egypt.

Conflicts of Interest

The authors declare no conflict of interest.

References

  1. Fan, M.; Shen, J.; Yuan, L.; Jiang, R.; Chen, X.; Davies, W.J.; Zhang, F. Improving crop productivity and resource use efficiency to ensure food security and environmental quality in China. J. Exp. Bot. 2012, 63, 13–24. [Google Scholar] [CrossRef] [Scilit] [PubMed]
  2. Rodriguez-Sanchez, J.; Li, C.; Paterson, A.H. Cotton yield estimation from aerial imagery using machine learning approaches. Front. Plant Sci. 2022, 13, 870181. [Google Scholar] [CrossRef] [Scilit] [PubMed]
  3. Ceyhan, M.; Kartal, Y.; Özkan, K.; Seke, E. Classification of wheat varieties with image-based deep learning. Multimed. Tools Appl. 2024, 83, 9597–9619. [Google Scholar]
  4. Wu, B.; Zhang, M.; Zeng, H.; Tian, F.; Potgieter, A.B.; Qin, X.; Yan, N.; Chang, S.; Zhao, Y.; Dong, Q.; et al. Challenges and opportunities in remote sensing-based crop monitoring: A review. Natl. Sci. Rev. 2023, 10, nwac290. [Google Scholar] [PubMed]
  5. Cao, Z.; Ma, R.; Liu, M.; Duan, H.; Xiao, Q.; Xue, K.; Shen, M. Harmonized chlorophyll-a retrievals in inland lakes from Landsat-8/9 and Sentinel 2A/B virtual constellation through machine learning. IEEE Trans. Geosci. Remote Sens. 2022, 60, 4209916. [Google Scholar] [CrossRef] [Scilit]
  6. Spoto, F.; Sy, O.; Laberinti, P.; Martimort, P.; Fernandez, V.; Colin, O.; Hoersch, B.; Meygret, A. Overview of sentinel-2. In Proceedings of the 2012 IEEE International Geoscience and Remote Sensing Symposium; IEEE: New York, NY, USA, 2012. [Google Scholar]
  7. Bulut, Ü.; Mohammadi, B.; Duan, Z. Estimation of surface soil moisture from Sentinel-1 synthetic aperture radar imagery using machine learning method. Remote Sens. Appl. Soc. Environ. 2024, 36, 101369. [Google Scholar] [CrossRef] [Scilit]
  8. Rahman, M.M.; Robson, A. Integrating landsat-8 and sentinel-2 time series data for yield prediction of sugarcane crops at the block level. Remote Sens. 2020, 12, 1313. [Google Scholar] [CrossRef] [Scilit]
  9. Amankulova, K.; Farmonov, N.; Omonov, K.; Abdurakhimova, M.; Mucsi, L. Integrating the Sentinel-1, Sentinel-2 and topographic data into soybean yield modelling using machine learning. Adv. Space Res. 2024, 73, 4052–4066. [Google Scholar] [CrossRef] [Scilit]
  10. Asgarian, A.; Soffianian, A.; Pourmanafi, S. Crop type mapping in a highly fragmented and heterogeneous agricultural landscape: A case of central Iran using multi-temporal Landsat 8 imagery. Comput. Electron. Agric. 2016, 127, 531–540. [Google Scholar] [CrossRef] [Scilit]
  11. Giovos, R.; Tassopoulos, D.; Kalivas, D.; Lougkos, N.; Priovolou, A. Remote sensing vegetation indices in viticulture: A critical review. Agriculture 2021, 11, 457. [Google Scholar] [CrossRef] [Scilit]
  12. Badshah, A.; Alkazemi, B.Y.; Din, F.; Zamli, K.Z.; Haris, M. Crop classification and yield prediction using robust machine learning models for agricultural sustainability. IEEE Access 2024, 12, 162799–162813. [Google Scholar] [CrossRef] [Scilit]
  13. Vasilakos, C.; Kavroudakis, D.; Georganta, A. Machine learning classification ensemble of multitemporal Sentinel-2 images: The case of a mixed mediterranean ecosystem. Remote Sens. 2020, 12, 2005. [Google Scholar] [CrossRef] [Scilit]
  14. Sonobe, R.; Yamaya, Y.; Tani, H.; Wang, X.; Kobayashi, N.; Mochizuki, K.-I. Crop classification from Sentinel-2-derived vegetation indices using ensemble learning. J. Appl. Remote Sens. 2018, 12, 026019. [Google Scholar] [CrossRef] [Scilit]
  15. Hosseini, M.M.; Zoej, M.J.V.; Dehkordi, A.T.; Ghaderpour, E. Cropping intensity mapping in Sentinel-2 and Landsat-8/9 remote sensing data using temporal transfer of a stacked ensemble machine learning model within google earth engine. Geocarto Int. 2024, 39, 2387786. [Google Scholar] [CrossRef] [Scilit]
  16. Giannico, V.; Garofalo, S.P.; Brillante, L.; Sciusco, P.; Elia, M.; Lopriore, G.; Camposeo, S.; Lafortezza, R.; Sanesi, G.; Vivaldi, G.A. Temporal vine water status modeling through machine learning ensemble technique and Sentinel-2 multispectral images under semi-arid conditions. Remote Sens. 2024, 16, 4784. [Google Scholar] [CrossRef] [Scilit]
  17. Remelgado, R.; Zaitov, S.; Kenjabaev, S.; Stulina, G.; Sultanov, M.; Ibrakhimov, M.; Akhmedov, M.; Dukhovny, V.; Conrad, C. A crop type dataset for consistent land cover classification in Central Asia. Sci. Data 2020, 7, 250. [Google Scholar] [CrossRef] [Scilit] [PubMed]
  18. Rasul, A. Crop Classification in Uzbekistan Using Random Forest: Integrating Sentinel-1 SAR and Sentinel-2 Optical Data with Ground-Truth Validation. Remote Sens. Earth Syst. Sci. 2025, 8, 1265–1276. [Google Scholar] [CrossRef] [Scilit]
  19. ZandKarimi, A.; Shamsoddini, A.; Ebrahimi, O. Ebrahimi, Combining multisource remote sensing images using machine learning methods (RF and SVM) for improved cotton field mapping. Remote Sens. Appl. Soc. Environ. 2025, 39, 101645. [Google Scholar] [CrossRef] [Scilit]
  20. Aslanov, I.; Mukhtorov, U.; Mahsudov, R.; Makhmudova, U.; Alimova, S.; Djurayeva, L.; Ibragimov, O. Applying remote sensing techniques to monitor green areas in Tashkent Uzbekistan. E3S Web Conf. 2021, 258, 04012. [Google Scholar]
  21. Erdanaev, E.; Kappas, M.; Wyss, D. Irrigated crop types mapping in Tashkent province of Uzbekistan with remote sensing-based classification methods. Sensors 2022, 22, 5683. [Google Scholar] [CrossRef] [Scilit] [PubMed]
  22. Amonov, M.O.; Steward, B.L.; Mirzaev, B.S.; Mamatov, F.M. Agricultural development and machinery usage in Uzbekistan. In Proceedings of the 2021 ASABE Annual International Virtual Meeting; American Society of Agricultural and Biological Engineers: St. Joseph, MI, USA, 2021. [Google Scholar]
  23. Egamberdiev, A.; Teshaev, N.; Abdimuminov, B.; Ruzikulova, O.; Yuldoshev, J.; Karshibaeva, L. Monitoring climate dynamics and cryospheric changes in Ugam Chatkal National Park, Uzbekistan: A remote sensing and GIS-based analysis. InterCarto 2025, 31, 550–560. [Google Scholar] [CrossRef] [Scilit]
  24. Matyakubov, B.; Goziev, G.; Makhmudova, U. State of the inter-farm irrigation canal: In the case of Khorezm province, Uzbekistan. E3S Web Conf. 2021, 258, 03022. [Google Scholar]
  25. Alimkulov, S.; Makhmudova, L.; Talipova, E.K.; Baspakova, G.; Tigkas, D.; Gulsaira, I. Response of the water level of the Balkash lake to the distribution of meteorological and hydrological droughts under the conditions of climate change. J. Water Clim. Change 2024, 15, 3395–3408. [Google Scholar] [CrossRef] [Scilit]
  26. Rustamova, I. Economic Evaluation of the Resource-Saving Technologies in Non-irrigated Lands. J. Agric. Sci. Technol. A 2016, 6, 211–219. [Google Scholar] [CrossRef] [Scilit]
  27. Dingle Robertson, L.; Davidson, A.; McNairn, H.; Hosseini, M.; Mitchell, S.; De Abelleyra, D.; Verón, S.; Cosh, M.H. Synthetic Aperture Radar (SAR) image processing for operational space-based agriculture mapping. Int. J. Remote Sens. 2020, 41, 7112–7144. [Google Scholar] [CrossRef] [Scilit]
  28. Baghdadi, N.; Cerdan, O.; Zribi, M.; Auzet, V.; Darboux, F.; El Hajj, M.; Kheir, R.B. Operational performance of current synthetic aperture radar sensors in mapping soil surface characteristics in agricultural environments: Application to hydrological and erosion modelling. Hydrol. Processes Int. J. 2008, 22, 9–20. [Google Scholar]
  29. Gao, Y.; Sun, J.; Zhang, J.; Guan, C. Extreme wind speeds retrieval using Sentinel-1 IW mode SAR data. Remote Sens. 2021, 13, 1867. [Google Scholar] [CrossRef] [Scilit]
  30. Vavlas, N.-C.; Waine, T.W.; Meersmans, J.; Burgess, P.J.; Fontanelli, G.; Richter, G.M. Deriving wheat crop productivity indicators using Sentinel-1 time series. Remote Sens. 2020, 12, 2385. [Google Scholar] [CrossRef] [Scilit]
  31. Greimeister-Pfeil, I.; Wagner, W.; Quast, R.; Hahn, S.; Steele-Dunne, S.; Vreugdenhil, M. Analysis of short-term soil moisture effects on the ASCAT backscatter-incidence angle dependence. Sci. Remote Sens. 2022, 5, 100053. [Google Scholar] [CrossRef] [Scilit]
  32. Fawzy, M.; Khodary, F.; Mostafa, Y.G. Selecting Training Samples Automatically from VHR Satellite Images for Image Classification. Sohag Eng. J. 2021, 1, 71–84. [Google Scholar] [CrossRef] [Scilit]
  33. Zhang, C.; Marzougui, A.; Sankaran, S. High-resolution satellite imagery applications in crop phenotyping: An overview. Comput. Electron. Agric. 2020, 175, 105584. [Google Scholar] [CrossRef] [Scilit]
  34. Mallick, J.; Alqadhi, S.; Talukdar, S.; Hang, H.T. Evaluating groundwater sustainability and vegetation dynamics in arid regions: Advanced remote sensing and spatiotemporal analysis in Saudi Arabia. Environ. Technol. Innov. 2025, 38, 104203. [Google Scholar] [CrossRef] [Scilit]
  35. Voitik, A.; Kravchenko, V.; Pushka, O.; Kutkovetska, T.; Shchur, T.; Kocira, S. Comparison of NDVI, NDRE, MSAVI and NDSI indices for early diagnosis of crop problems. Agric. Eng. 2023, 27, 47–57. [Google Scholar] [CrossRef] [Scilit]
  36. Luo, Y.; Zhang, Z.; Zhang, L.; Han, J.; Cao, J.; Zhang, J. Developing high-resolution crop maps for major crops in the European Union based on transductive transfer learning and limited ground data. Remote Sens. 2022, 14, 1809. [Google Scholar] [CrossRef] [Scilit]
  37. Orynbaikyzy, A.; Gessner, U.; Mack, B.; Conrad, C. Crop type classification using fusion of sentinel-1 and sentinel-2 data: Assessing the impact of feature selection, optical data availability, and parcel sizes on the accuracies. Remote Sens. 2020, 12, 2779. [Google Scholar] [CrossRef] [Scilit]
  38. Zhou, T.; Pan, J.; Zhang, P.; Wei, S.; Han, T. Mapping winter wheat with multi-temporal SAR and optical images in an urban agricultural region. Sensors 2017, 17, 1210. [Google Scholar] [CrossRef] [Scilit] [PubMed]
  39. Fawzy, M.; Mostafa, Y.G.; Khodary, F. Automatic Indices Based Classification Method for Map Updating Using VHR Satellite Images. JES J. Eng. Sci. 2020, 48, 845–868. [Google Scholar] [CrossRef] [Scilit]
  40. Hoffer, R.M. Biological and physical considerations in applying computer-aided analysis techniques to remote sensor data. In Remote Sensing: The Quantitative Approach; Swain, P.H., Davis, S.M., Eds.; McGraw-Hill Book Company: New York, NY, USA, 1978; pp. 227–289. [Google Scholar]
  41. Davis, E.; Wang, C.; Dow, K. Comparing Sentinel-2 MSI and Landsat 8 OLI in soil salinity detection: A case study of agricultural lands in coastal North Carolina. Int. J. Remote Sens. 2019, 40, 6134–6153. [Google Scholar] [CrossRef] [Scilit]
  42. Tian, Y.; Shuai, Y.; Shao, C.; Wu, H.; Fan, L.; Li, Y.; Chen, X.; Narimanov, A.; Usmanov, R.; Baboeva, S. Extraction of cotton information with optimized phenology-based features from sentinel-2 images. Remote Sens. 2023, 15, 1988. [Google Scholar] [CrossRef] [Scilit]
  43. Brickner, N.Z.; Fine, L.; Rozenstein, O.; Paz-Kagan, T. Field Crop Mapping Using Machine Learning and Multi-Sensor Satellite Fusion: Toward Dynamic Agricultural Monitoring. Smart Agric. Technol. 2025, 12, 101650. [Google Scholar] [CrossRef] [Scilit]
  44. Savitha, C.; Talari, R. Evaluating the performance of random forest, support vector machine, gradient tree boost, and CART for improved crop-type monitoring using greenest pixel composite in Google Earth Engine. Environ. Monit. Assess. 2025, 197, 437. [Google Scholar] [CrossRef] [Scilit] [PubMed]
  45. Xu, S.; Liu, S.; Wang, H.; Chen, W.; Zhang, F.; Xiao, Z. A hyperspectral image classification approach based on feature fusion and multi-layered gradient boosting decision trees. Entropy 2020, 23, 20. [Google Scholar] [CrossRef] [Scilit] [PubMed]
  46. Ok, A.O.; Akar, O.; Gungor, O. Evaluation of random forest method for agricultural crop classification. Eur. J. Remote Sens. 2012, 45, 421–432. [Google Scholar] [CrossRef] [Scilit]
  47. Bishnoi, S.; Al-Ansari, N.; Khan, M.; Heddam, S.; Malik, A. Classification of cotton genotypes with mixed continuous and categorical variables: Application of machine learning models. Sustainability 2022, 14, 13685. [Google Scholar] [CrossRef] [Scilit]
  48. Faqe Ibrahim, G.R.; Rasul, A.; Abdullah, H. Improving crop classification accuracy with integrated Sentinel-1 and Sentinel-2 data: A case study of barley and wheat. J. Geovisualization Spat. Anal. 2023, 7, 22. [Google Scholar] [CrossRef] [Scilit]
  49. Bîscoveanu, O.M.; Badea, G.; Dragomir, P.I.; Badea, A.C. Evaluation of LULC Use Classification for the Municipality of Deva, Hunedoara County, Romania Using Sentinel 2A Multispectral Satellite Imagery—A Comparative Study of GIS Software Analysis and Accuracy Assessment. Appl. Sci. 2025, 15, 11437. [Google Scholar] [CrossRef] [Scilit]
  50. Mather, P.; Tso, B. Classification Methods for Remotely Sensed Data; CRC Press: Boca Raton, FL, USA, 2016. [Google Scholar]
  51. Sorek-Hamer, M.; Kloog, I.; Koutrakis, P.; Strawa, A.W.; Chatfield, R.; Cohen, A.; Ridgway, W.L.; Broday, D.M. Assessment of PM2. 5 concentrations over bright surfaces using MODIS satellite observations. Remote Sens. Environ. 2015, 163, 180–185. [Google Scholar] [CrossRef] [Scilit]
  52. McNemar, Q. Note on the sampling error of the difference between correlated proportions or percentages. Psychometrika 1947, 12, 153–157. [Google Scholar] [CrossRef] [Scilit] [PubMed]
  53. Gomes, H.; da Silva, G.F.; Calonego, J.C.; Barcelos, J.P.d.Q.; Junior, V.M.C.; Putti, F.F. Comparative Evaluation of the Multispectral Platforms Sentinel-2, CBERS-04A, and UAV for Nitrogen Detection in Maize Crops. AgriEngineering 2025, 7, 201. [Google Scholar] [CrossRef] [Scilit]
  54. Vera-Esmeraldas, A.; Pizarro-Oteíza, S.; Labbé, M.; Rojo, F.; Salazar, F. UAV-Based Spectral and Thermal Indices in Precision Viticulture: A Review of NDVI, NDRE, SAVI, GNDVI, and CWSI. Agronomy 2025, 15, 2569. [Google Scholar] [CrossRef] [Scilit]
  55. Chakhar, A.; Hernández-López, D.; Ballesteros, R.; Moreno, M.A. Improving the accuracy of multiple algorithms for crop classification by integrating sentinel-1 observations with sentinel-2 data. Remote Sens. 2021, 13, 243. [Google Scholar] [CrossRef] [Scilit]
  56. Stroppiana, D.; Azar, R.; Calò, F.; Pepe, A.; Imperatore, P.; Boschetti, M.; Silva, J.M.N.; Brivio, P.A.; Lanari, R. Integration of optical and SAR data for burned area mapping in Mediterranean Regions. Remote Sens. 2015, 7, 1320–1345. [Google Scholar] [CrossRef] [Scilit]
  57. Peña-Barragán, J.M.; Ngugi, M.K.; Plant, R.E.; Six, J. Object-based crop identification using multiple vegetation indices, textural features and crop phenology. Remote Sens. Environ. 2011, 115, 1301–1316. [Google Scholar] [CrossRef] [Scilit]
  58. Parida, P.K.; Somasundaram, E.; Krishnan, R.; Radhamani, S.; Sivakumar, U.; Parameswari, E.; Raja, R.; Rangasami, S.R.S.; Sangeetha, S.P.; Selvi, R.G. Unmanned Aerial Vehicle-Measured Multispectral Vegetation Indices for Predicting LAI, SPAD Chlorophyll, and Yield of Maize. Agriculture 2024, 14, 1110. [Google Scholar] [CrossRef] [Scilit]
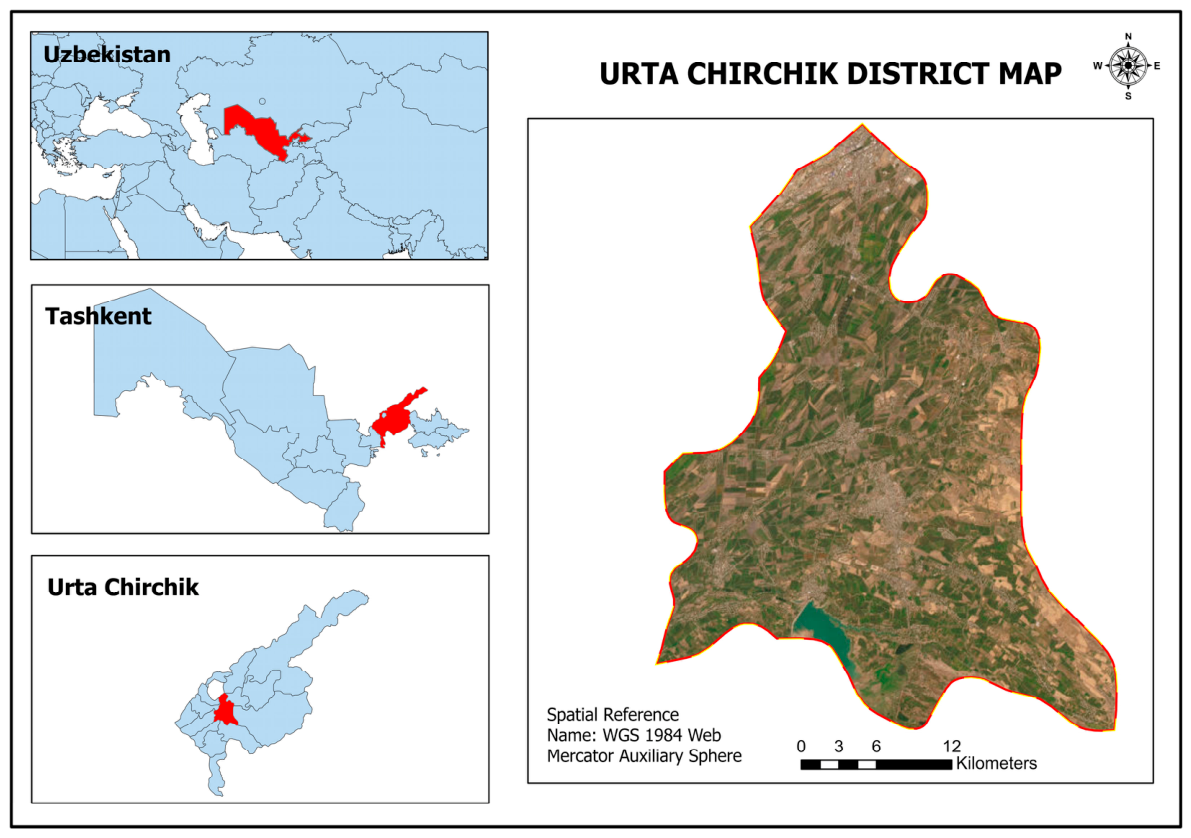
Figure 1. Land cover scene, geographic location, and administrative boundaries of the Urta Chirchik district.
Remotesensing 18 02571 g001
Figure 2. Ground-truth training and reference points for ML classification.
Remotesensing 18 02571 g002
Figure 3. Workflow diagram for multi-sensor data processing using machine learning-based crop classification techniques.
Remotesensing 18 02571 g003
Figure 4. Spectral responses of vegetation [40].
Remotesensing 18 02571 g004
Figure 5. Machine learning crop classification procedures.
Remotesensing 18 02571 g005
Figure 6. Monthly temporal dynamics of VIs for wheat during the 2025 growing season using Landsat-8 and Sentinel-2.
Remotesensing 18 02571 g006
Figure 7. Monthly temporal dynamics of VIs for cotton during the 2025 growing season using Landsat-8 and Sentinel-2.
Remotesensing 18 02571 g007
Figure 8. Spatial distribution of vegetation indices at the mid-season across the Urta Chirchik district using Sentinel-2.
Remotesensing 18 02571 g008
Figure 9. Seasonal VV and VH backscatter profiles of wheat and cotton using Sentinel-1 measures.
Remotesensing 18 02571 g009
Figure 10. GBT and RF land-cover classification maps using DS-1, DS-2, and DS-3 through multi-index inputs (Scenario 2) and DS-4 using SAR band inputs (Scenario 3).
Remotesensing 18 02571 g010
Figure 11. KNN, CART, and MD land-cover classification maps using DS-1, DS-2, and DS-3 through multi-index inputs (Scenario 2) and DS-4 using SAR band inputs (Scenario 3).
Remotesensing 18 02571 g011
Figure 12. Overall accuracy and Kappa coefficients of machine learning classifiers.
Remotesensing 18 02571 g012
Figure 13. Producer’s and User’s accuracy of machine learning classifiers.
Remotesensing 18 02571 g013
Table 1. Spectral characteristics of the Landsat-8 OLI/TIRS bands and their relevance for agricultural monitoring.
BandWavelength (nm)Resolution (m)Primary Use/Application
B1 (Aerosol)430–45030Aerosol correction, water bodies, coastal analysis
B2 (Blue)450–51030Water bodies, soil/vegetation differentiation
B3 (Green)530–59030Green biomass, vegetation vigor
B4 (Red)640–67030Chlorophyll absorption, NDVI
B5 (NIR)850–88030Vegetation vigor, NDVI, biomass estimation
B6 (SWIR-1)1550–175030Vegetation, water content, soil moisture
B7 (SWIR-2)2100–230030Vegetation water stress, soil/vegetation moisture
B8 (Pan)500–68015Higher-resolution imagery for sharpening multispectral bands
B9 (Cirrus)1360–1380100Cirrus cloud detection
B10 (TIRS1)10,600–11,190100Land surface temperature
B11 (TIRS2)11,500–12,510100 Land surface temperature
Table 2. Spectral configuration of Sentinel-2 MSI bands and their primary applications for crop monitoring.
BandWavelength (nm)Resolution (m)Primary Use/Application
B1 (Aerosol)44360Aerosol correction, water body analysis
B2 (Blue)49010Chlorophyll absorption, water bodies, soil/vegetation differentiation
B3 (Green)56010Green biomass detection, vegetation vigor, crop health monitoring
B4 (Red)66510Chlorophyll absorption, NDVI calculation, stress detection
B5 (Red edge-1)70520 (10 *)Sensitive to chlorophyll content, NDRE index calculation
B6 (Red edge-2)74020Chlorophyll monitoring, canopy structure
B7 (Red edge-3)78320Dense canopy chlorophyll
B8 (NIR)84210Vegetation vigor, biomass estimation, NDVI
B8A (NIR narrow)86520Chlorophyll and canopy structure analysis
B9 (Water vapor)94060Atmospheric correction, water absorption studies
B10 (Cirrus)137560Cirrus cloud detection and masking
B11 (SWIR-1)161020Vegetation water content, soil moisture
B12 (SWIR-2)219020Vegetation water stress, soil/vegetation moisture
* Resampled.
Table 3. Available satellite images covering the study area during the June and July 2025 period.
Available ImagesP-1
(1 June–20 June)
P-2
(21 June–10 July)
P-3
(11 July–31 July)
Landsat-8No full-coverage cloud-free images
(<15% cloud cover)
33
Sentinel-2699
Sentinel-1464
Table 4. Comparative overview of vegetation indices for multi-sensor crop analysis.
IndexFormula (L8)Formula (S2)Purpose/
Application
NDVI B 5 B 4 B 5 + B 4 B 8 B 4 B 8 + B 4 Vegetation greenness and vigor
GNDVI B 5 B 3 B 5 + B 3 B 8 B 3 B 8 + B 3 Chlorophyll
content
EVI 2.5 × B 5 B 4 B 5 + 6 × B 4 7.5 × B 2 + 1 2.5 × ( B 8 B 4 ) B 8 + 6 × B 4 7.5 × B 2 + 1 Enhances vegetation signal in high biomass
SAVI B 5 B 4 × 1 + L B 5 + B 4 + L B 8 B 4 × 1 + L B 8 + B 4 + L Reduces soil background effect
MSAVI 2 × B 5 + 1 2 × B 5 + 1 2 8 × B 5 B 4 2 2 × B 8 + 1 2 × B 8 + 1 2 8 × B 8 B 4 2 Minimizes soil
influence
NDRE B 8 B 5 B 8 + B 5 Chlorophyll in dense vegetation
Table 5. Overall accuracy of machine learning classifiers across different vegetation index scenarios and satellite datasets.
ClassifierDS-1 (Landsat-8)DS-2 (Sentinel-2)DS-3 (Sentinel-1 and 2)DS-4 (Sentinel-1)
NDVI (%)All VIs (%)NDVI (%)All VIs (%)NDVI (%)All VIs (%)VV, VH, VV/VH (%)
GBT87.1890.7093.0196.2294.5597.0683.78
RF87.0488.7392.3194.5493.2996.9284.47
KNN86.0688.8792.0393.4381.6883.9279.44
CART83.8085.3584.4790.9188.5388.8172.31
MD76.3472.1180.8481.1270.6372.3169.79
Table 6. Kappa coefficients for machine learning classifiers across satellite datasets and vegetation index scenarios.
ClassifierDS-1 (Landsat-8)DS-2 (Sentinel-2)DS-3 (Sentinel-1 and 2)DS-4 (Sentinel-1)
NDVIAll VIsNDVIAll VIsNDVIAll VIsVV, VH, VV/VH
GBT0.84380.89150.91510.95100.93630.96570.8075
RF0.85370.87830.92000.93640.92170.95920.8189
KNN0.83720.87000.90700.92330.78620.81070.7601
CART0.81100.82890.81720.90210.86620.86950.6948
MD0.72370.67360.77640.77810.65730.67530.6427
Table 7. Performance ranking by classifier type showing best accuracy, dataset and scenario, and accuracy range.
RankClassifierBest Overall AccuracyDataset and ScenarioAccuracy Range
1GBT97.06%DS-3 (Sentinel-1 and 2) with all VIsHigh (83.78–97.06%)
2RF96.92%DS-3 (Sentinel-1 and 2) with all VIsHigh (84.47–96.92%)
3KNN93.43%DS-2 (Sentinel-2) with all VIsModerate–High (79.44–93.43%)
4CART90.91%DS-2 (Sentinel-2) with all VIsModerate (72.31–90.91%)
5MD81.12%DS-2 (Sentinel-2) with all VIsLow–Moderate (69.79–81.12%)
Table 8. Class-specific Producer’s and User’s accuracy for wheat and cotton using DS-3 (Sentinel-1 and 2) with all VIs.
ClassifierWheatCottonOther CropsBare LandWaterBuildingRoad
%PA%UA%PA%UA%PA%UA%PA%UA%PA%UA%PA%UA%PA%UA
GBT99.02100.00100.0095.3395.1094.1797.0698.0291.18100.0098.0697.1296.0892.45
RF100.00100.00100.0095.3396.0894.2395.1098.9890.20100.0094.1797.0097.0688.39
KNN87.2593.6897.0682.5081.3798.8184.3191.4988.24100.0075.7375.0073.5358.59
CART100.0089.4793.1491.3587.2589.0095.1078.8689.2295.7973.7987.3683.3392.39
MD86.2791.6788.2460.4040.2077.3680.3970.0976.47100.0076.7077.4557.8449.17
Disclaimer/Publisher’s Note: The statements, opinions and data contained in all publications are solely those of the individual author(s) and contributor(s) and not of MDPI and/or the editor(s). MDPI and/or the editor(s) disclaim responsibility for any injury to people or property resulting from any ideas, methods, instructions or products referred to in the content.