Systematic Review

Change Detection in Remote Sensing Imagery: A Systematic Review of Statistical, Machine Learning, and Deep Learning Methods


by
Mohammad Jabbarizadegan
* and
Piero Fraternali
Department of Electronics, Information, and Bioengineering, Politecnico di Milano, Via Ponzio 34/5, 20133 Milan, Italy
*
Author to whom correspondence should be addressed.
Remote Sens. 2026, 18(15), 2573; https://doi.org/10.3390/rs18152573
Submission received: 25 June 2026 / Revised: 24 July 2026 / Accepted: 28 July 2026 / Published: 4 August 2026

Highlights

What are the main findings?
  • Architectural gains in change detection have saturated across three successive post-attention model generations.
  • Annotation cost, not model capacity, is now the binding constraint on change detection performance.
What are the implications of the main findings?
  • Method selection should be driven by each deployment’s binding constraint rather than by architectural recency.
  • Research effort is best redirected toward label-efficient learning and standardized benchmark protocols.

Abstract

Change detection (CD) is a fundamental remote sensing task that identifies surface modifications from multi-temporal imagery of the same area, with applications in urban monitoring, agriculture, forest disturbance mapping, disaster assessment, and land cover analysis. The task is complicated by radiometric and atmospheric variability, co-registration errors, seasonal cycles, and sensor heterogeneity. Deep learning has progressively superseded traditional and classical machine learning approaches through hierarchical feature extraction and end-to-end optimization. Following the PRISMA 2020 guidelines, this systematic review examines 144 primary studies identified through a structured Scopus search complemented by the authors’ prior research and citation searching, spanning three paradigms: traditional approaches (algebraic operators, transformations, probabilistic frameworks), classical machine learning (support vector machines, random forests, object-based analysis), and deep learning architectures (fully convolutional, Siamese, attention-based, Transformer, state space, diffusion-based, and weakly supervised models). We provide background on problem formulation, benchmark datasets, and evaluation metrics, alongside a taxonomy organized by paradigm and supervision mode. A quantitative comparison on dominant benchmarks reveals the strengths and limitations of current methods. Open challenges include the absence of a universal benchmark protocol, the research-to-deployment gap, and the need for label-efficient learning. This review serves as a structured reference and outlines promising directions for the field.

1. Introduction

Change in remote sensing refers to the process of identifying meaningful modifications in the state of the Earth’s surface by analyzing images of the same geographic area acquired at different time points [1,2]. The problem is conceptually straightforward: given two co-registered images acquired at times t 1 and t 2 , identify pixels or regions that have undergone genuine semantic change. In practice, however, the task is complicated by geometric misregistration between acquisitions, atmospheric effects causing radiometric inconsistencies, seasonal phenological variability in vegetation, differential illumination, and the diversity of sensor modalities, spatial resolutions, and geographic contexts encountered across operational deployments.
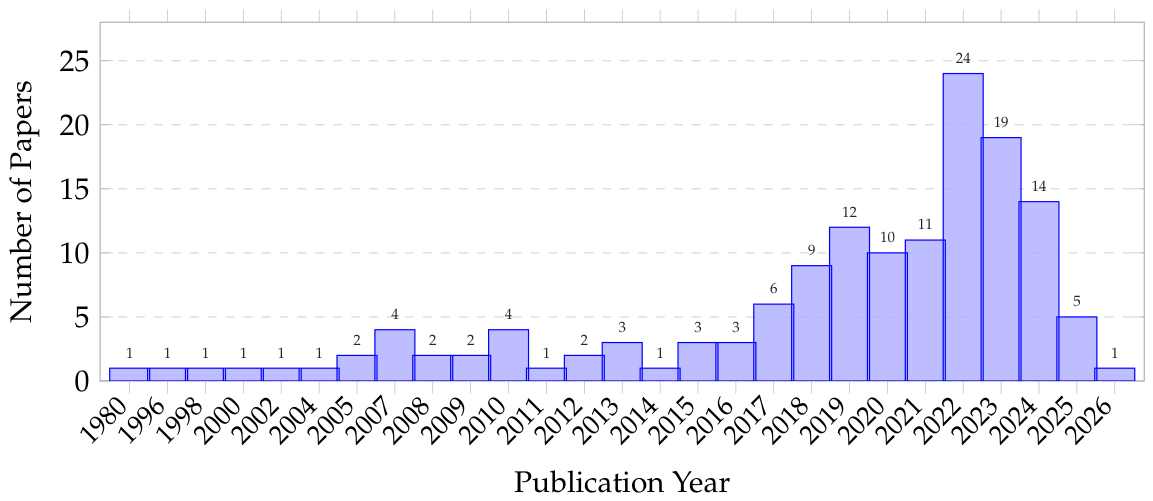
The past decade has witnessed an exponential growth of Earth observation infrastructure and a corresponding surge in change detection research. Figure 1 illustrates the temporal distribution of the 144 papers comprising this review. It reveals an acceleration commencing approximately in 2017, corresponding to the widespread adoption of convolutional neural networks and the emergence of the first large-scale annotated change detection benchmarks. The acceleration continues through the most recent years: two-thirds of the corpus was published from 2019 onward, with a peak of 24 papers in 2022. The methodology for extracting the papers is discussed in detail in Section 3.
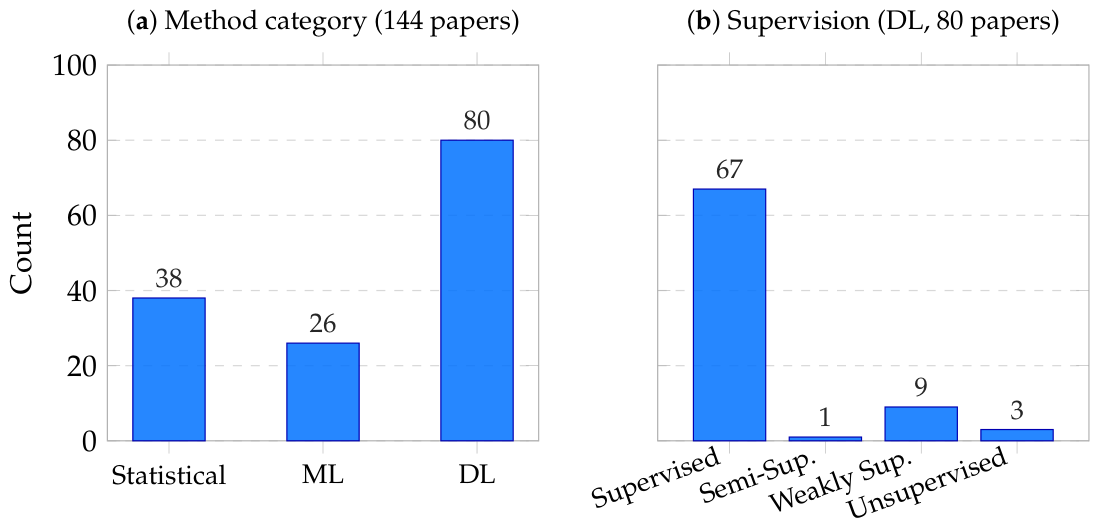
Figure 2 shows the methodological composition of the full corpus: deep learning accounts for 80 of the 144 papers (56%), classical statistical methods for 38 (26%), and machine learning for 26 (18%). Within the deep learning sub-corpus, supervised learning is dominant (67 papers, 84%), with weakly supervised methods, an emerging and practically important paradigm that operates under image-level rather than pixel-level annotation, comprising 9 papers (11%), fully unsupervised approaches 3 (4%), and semi-supervised learning 1 (1%).
This supervision-based division mirrors the taxonomy by which Khelifi and Mignotte [3] organized the deep-learning change-detection literature.
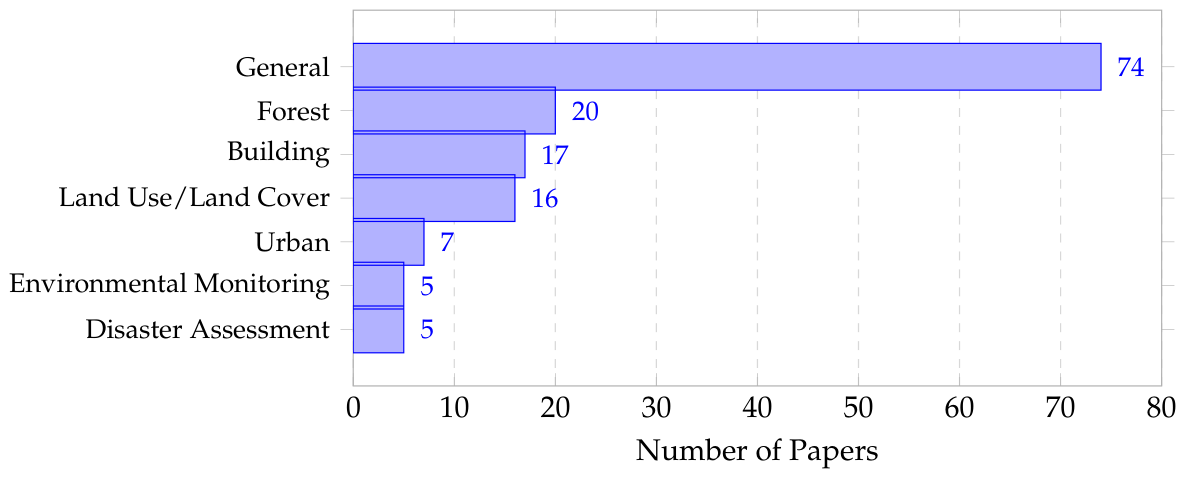
Figure 3 illustrates the multiple application domains addressed by terrestrial change detection: general binary change detection constitutes the largest category, followed by forest disturbance, building change, land use and land cover change, urban monitoring, disaster assessment, and environmental monitoring.
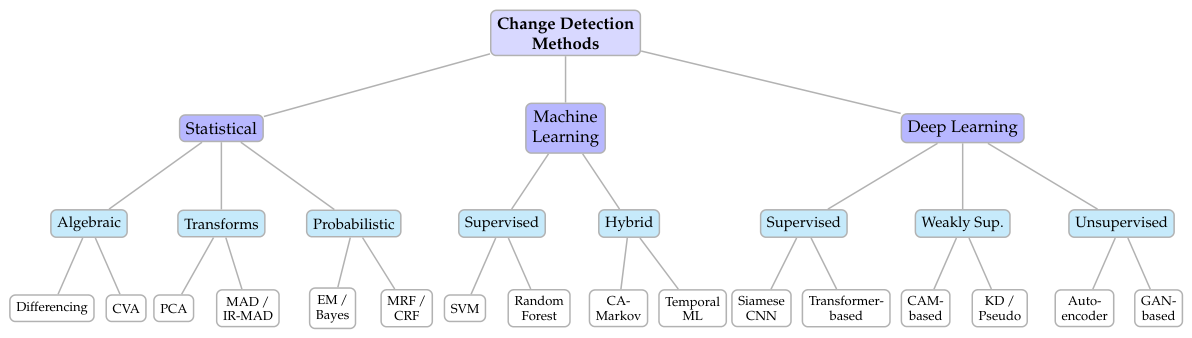
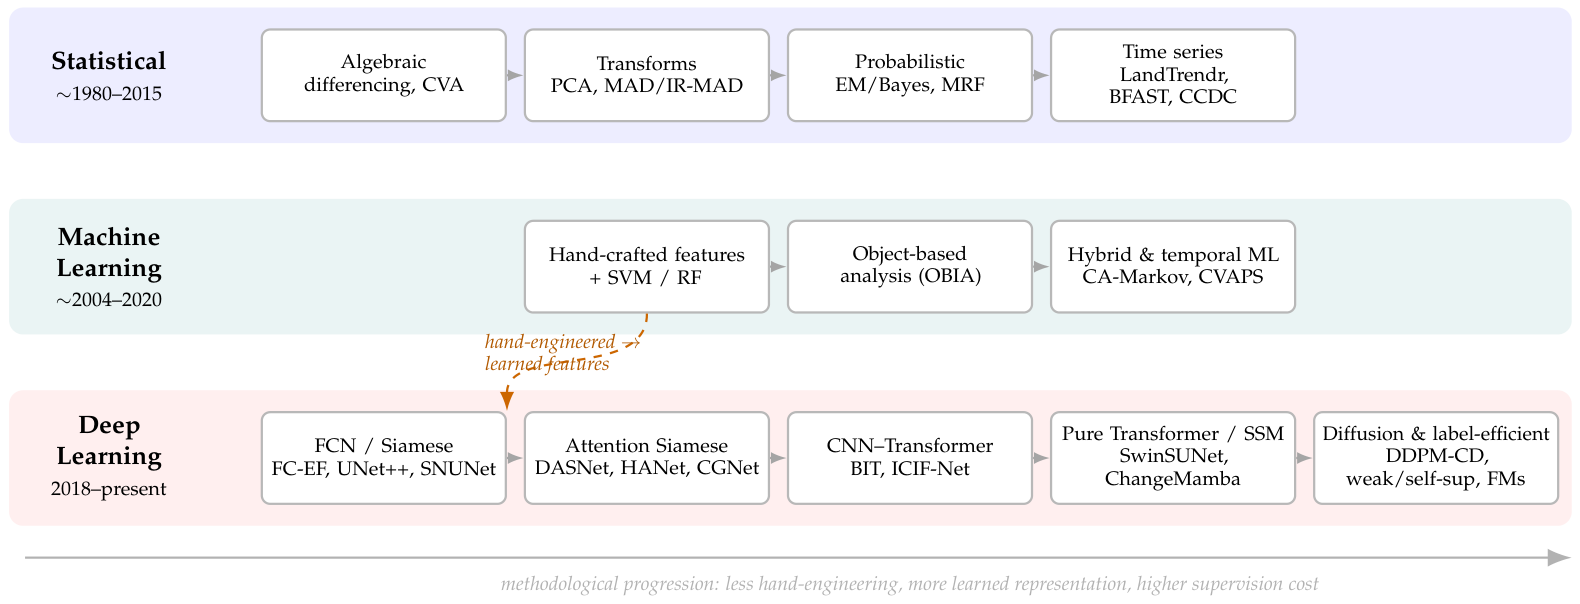
The architectural taxonomy in Figure 4 organizes the surveyed methods across three epochs, which are reviewed in depth in Section 5, Section 6 and Section 7.
This review focuses on optical and multi-spectral (MS) remote sensing imagery, which constitutes the dominant modality in the reviewed corpus. Methods for synthetic aperture radar (SAR), hyperspectral (HS), heterogeneous multi-modal, and three-dimensional point cloud data are discussed with representative references in Section 8.
Several surveys have examined the change detection literature. Singh [1] established the foundational taxonomy of pre-digital and early digital methods. Lu et al. [2] provided the most comprehensive pre-deep-learning investigation. Coppin et al. [4] addressed ecosystem change monitoring from an ecological perspective. Radke et al. [5] contributed a cross-disciplinary systems-level perspective.
Bruzzone and Bovolo [6], in an invited synthesis, paired a review of multi-temporal change-detection techniques with a top-down framework for designing change-detection systems tailored to very-high-resolution imagery, one that explicitly models the distinct types of radiometric change, extracts their semantic meaning, and exploits the multiscale object structure and the high spatial correlation among neighboring pixels, design principles that anticipate the spatial-context and multiscale emphases later made central by deep architectures.
Shi et al. [7] provided the first comprehensive review of artificial-intelligence-based change detection, organizing the early deep-learning literature by network-stream architecture and surveying the autoencoder, convolutional, recurrent, and generative-adversarial generations that preceded the Transformer era, while excluding classical machine learning from its scope.
Khelifi and Mignotte [3] complemented this with a meta-analysis of the deep-learning change-detection literature, organizing methods by supervision paradigm into fully supervised, fully unsupervised, and transfer-learning families, and identified weakly supervised change detection as a key emerging direction.
Jiang et al. [8] restricted their scope to deep-learning change detection from high-resolution imagery, organizing methods by detection granularity and by feature-extraction architecture and cataloging the high-resolution benchmarks and evaluation metrics in current use.
Shafique et al. [9] surveyed the same deep-learning literature from a modality-centric standpoint, organizing methods by data type, SAR, MS, HS, very-high-resolution, and heterogeneous imagery and cross-cutting each by supervision level.
Bai et al. [10] took a mechanistic view, asking why deep models outperform their predecessors, and organized the literature both by the dimension of remote-sensing information exploited (spectral, spatial, temporal, and multi-sensor) and by a separate-versus-coupled network taxonomy.
Parelius [11] narrowed the focus further to MS imagery, surveying supervised, semi-supervised, and unsupervised deep models and foregrounding the conceptual distinction between apparent, irrelevant, and task-relevant changes.
Wang et al. [12] present the most recent systematic treatment of deep learning approaches through 2024. Lv et al. [13] reviewed heterogeneous remote sensing change detection with emphasis on cross-modal challenges.
Two recent reviews narrow the scope to individual axes of the present treatment. Yu et al. [14] survey the integration of foundation models with change detection, classifying methods by data modality and by network position of feature injection, and benchmark the resulting models against conventional architectures. Peng et al. [15] review label-efficient deep-learning change detection, organizing the semi-supervised, weakly supervised, and self-supervised literature around the shared constraint of annotation cost.
A further set of reviews, published as the present work was in preparation, sharpens individual axes of this landscape and is engaged in the corresponding sections below. Yu et al. [16] and Lei et al. [17] survey deep-learning change detection comprehensively across data types, very-high-resolution, hyperspectral, SAR, and heterogeneous imagery, the former adding an analysis in terms of computational cost and commercial deployment, the latter organizing methods by supervised, semi-supervised, and unsupervised regimes and enumerating label-privacy, lightweight, and vision–language directions. Jiang et al. [18] concentrate on multisource change detection, organizing methods by detection framework, granularity, and data source, while Saidi et al. [19] survey deep multi-modal fusion across homogeneous and heterogeneous, notably optical–SAR, scenes. Lv et al. [20] provide a dedicated survey of hyperspectral land cover change detection built around pseudo-invariant feature extraction and change-magnitude metric design. Bao et al. [21] survey the Mamba state-space family across remote sensing, including its bi-temporal application to change detection, and Zou et al. [22] review remote-sensing image change captioning, the language-interfaced interpretation of detected change.
Beyond change-detection-specific reviews, the broader surge of deep learning across remote sensing has been synthesized in dedicated meta-analyses. M. et al. [23] reviewed and statistically analyzed more than two hundred deep-learning remote-sensing studies, spanning scene classification, object detection, land cover mapping, segmentation, and change detection. That treatment situates change detection as one application area within a much larger methodological shift and thereby motivates a review focused on change detection in its own right.
Hussain et al. [24] organized the field along a different axis, the unit of image analysis, systematically contrasting pixel-based, predominantly statistical detectors with object-based change detection (OBCD) and spatial-data-mining approaches and argued that object-based methods are better suited to the very-high-resolution regime in which per-pixel detectors incur salt-and-pepper artifacts. Tewkesbury et al. [25] refined this organization by decoupling the unit of analysis from the comparison method used to identify change, arguing that most comparison operators are transferable across analysis units and that the prevailing pixel-versus-object dichotomy therefore introduces conceptual redundancy. The present review is distinguished from these works, and in particular from the unit-of-analysis taxonomy of Hussain et al. [24] and Tewkesbury et al. [25] and the recent deep-learning-focused treatment of Wang et al. [12], by four contributions. First, it spans the full methodological arc within a single unified taxonomy, from classical algebraic, transformation-based, and probabilistic operators through classical machine learning to the successive deep-learning generations, including Mamba state space and diffusion-based architectures. Second, it treats the weakly supervised, label-efficient paradigm as a first-class subject rather than a footnote. Earlier deep-learning reviews flagged it only as an emerging direction [3], and the dedicated treatments of Peng et al. [15] and Yu et al. [14] review it in isolation. The present work instead integrates it with the classical and full supervised generations within a single taxonomy. Third, it develops corpus-level observations that cut across the classical and deep-learning eras, most notably the saturation of architectural gains on current benchmarks and a unifying account of the supervision-cost frontier, rather than cataloging methods generation by generation. Fourth, it provides a practitioner-oriented decision guide framed in terms of binding deployment constraints rather than specific named methods. The corpus of 144 primary papers underlying these contributions was assembled through a systematic Scopus-based search (Section 3).
Table 1 positions this review against the principal prior surveys along the dimensions on which they differ.
Section 2 introduces the formal problem definition and evaluation metrics. Section 3 describes the literature search protocol. Section 4 presents the principal benchmark datasets. Section 5, Section 6 and Section 7 review the three methodological categories. Section 8 addresses non-optical modalities. Section 9 presents the quantitative benchmark comparison. Section 10 identifies open challenges and future directions. Section 11 draws conclusions.

2. Background and Problem Formulation

2.1. Formal Definition

Let X 1 R H × W × C and X 2 R H × W × C denote two co-registered remote sensing images of the same geographic area acquired at times t 1 < t 2 , where H and W are spatial dimensions, and C is the number of spectral channels. The change detection problem is to produce a change map M via a detection function f:
M = f PR ( X 1 ) , PR ( X 2 ) ,
where PR ( · ) denotes image pre-processing and registration. Three bi-temporal fusion strategies are distinguished [12]: early fusion (concatenation along the channel dimension prior to feature extraction), middle/Siamese fusion (independent branch encoding with subsequent feature comparison), and late fusion (post-classification comparison of per-date label maps). In binary change detection (BCD), M { 0 , 1 } H × W . In semantic change detection (SCD), M additionally characterizes the land cover and other semantic categories at t 1 and t 2 , providing from–to transition information.
A conceptual distinction orthogonal to this formalization separates apparent changes (radiometric or atmospheric artifacts rather than true surface change), irrelevant changes (real but outside the task of interest), and relevant changes (the detection target), the boundary between the latter two being entirely application-dependent [11].

2.2. Evaluation Metrics

Performance assessment relies on four fundamental quantities: true positives (TP), true negatives (TN), false positives (FP), and false negatives (FN). Standard metrics are
Precision = TP TP + FP ,
Recall = TP TP + FN ,
F 1 = 2 TP 2 TP + FP + FN = 2 Precision · Recall Precision + Recall ,
IoU = TP TP + FP + FN ,
OA = TP + TN TP + TN + FP + FN ,
κ = p o p e 1 p e .
Precision and recall (Equations (2) and (3)) quantify commission and omission error, and F 1 (Equation (4)) is their harmonic mean; IoU (Equation (5)) is the intersection-over-union and OA (Equation (6)) the overall accuracy. For SCD, mean intersection-over-union (mIoU), separated kappa (Sek), and the composite F scd score [26] are additionally employed. In Cohen’s kappa κ (Equation (7)), p o is the observed agreement (the fraction of pixels for which the prediction and the reference label coincide, equivalent to overall accuracy), and p e is the agreement expected by chance under the marginal class distributions of the prediction and the reference; κ therefore measures the agreement above what chance alone would produce. A critical observation, recurring throughout this review, is that different papers report different metric subsets on different train/test splits, making direct cross-paper numerical comparison unreliable even within nominally shared benchmark datasets.

3. Literature Search Methodology

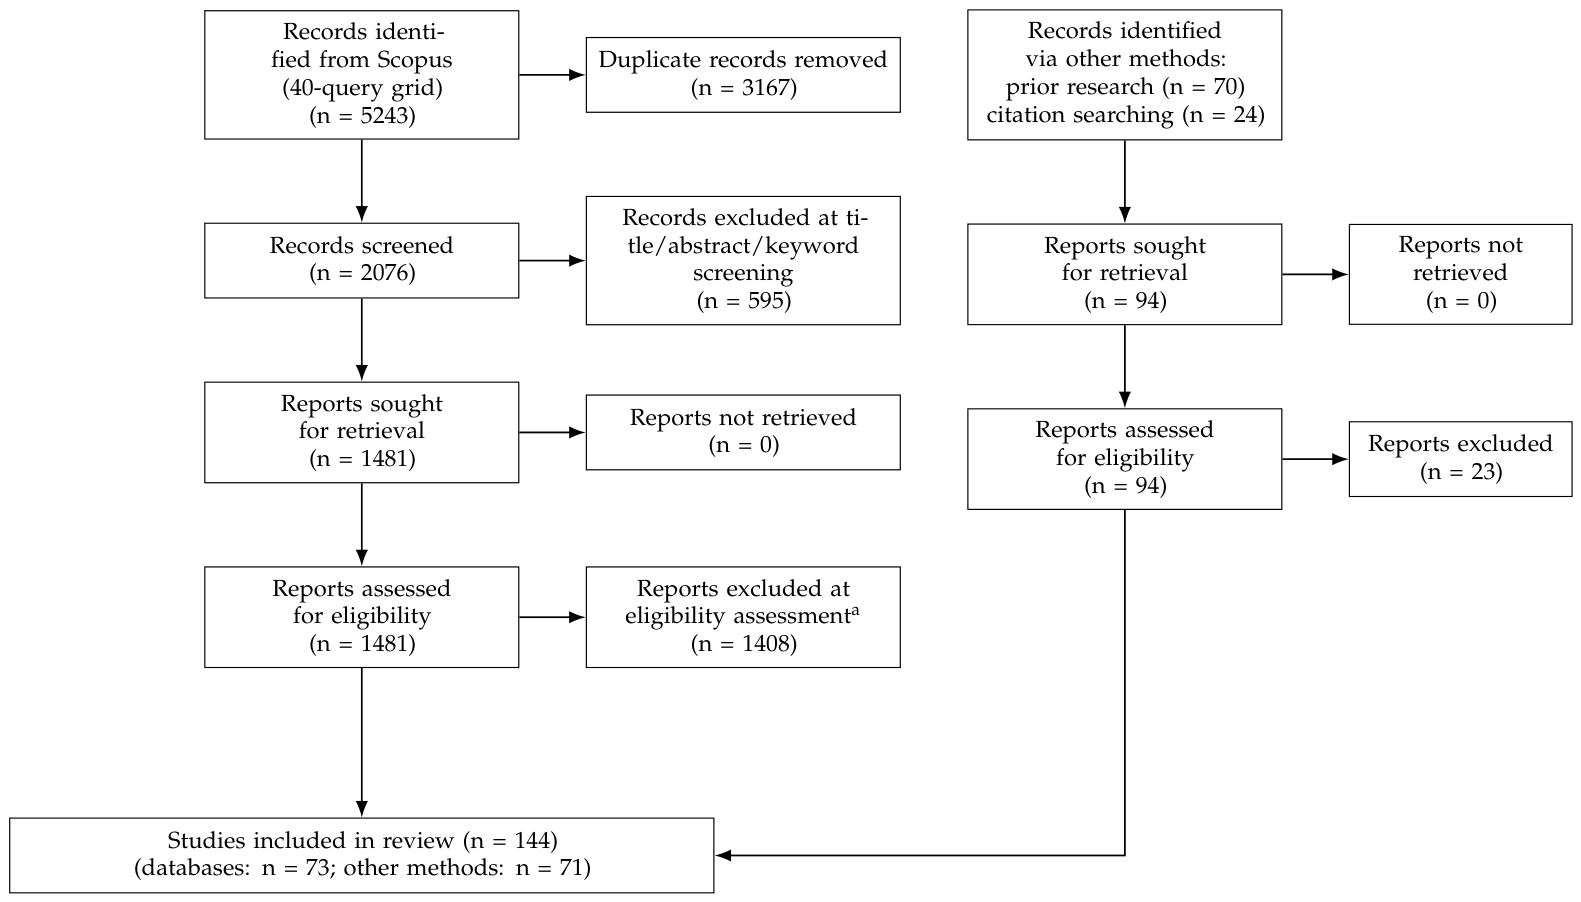
This review was conducted and is reported in accordance with the PRISMA 2020 statement [27]; the completed PRISMA 2020 checklist is provided as Supplementary Materials File S1. The review protocol was not registered, as registries such as PROSPERO do not accept methodological reviews outside the health sciences, and no separate protocol document was prepared. Studies were identified through two complementary routes, reported separately in the PRISMA flow diagram (Figure 5). The first was a structured search of the Scopus database Elsevier B.V., Amsterdam, The Netherlands; https://www.scopus.com, executed on 5 January 2026 with no restriction on publication year. Scopus was adopted as the single database arm because, as a broad curated abstract and citation index rather than a single-publisher platform, it aggregates the peer-reviewed venues in which change detection research appears; the complementary identification route described below further guarded against any single-database omission. The second comprised studies identified through the authors’ prior research and through backward citation searching, i.e., the examination of the reference lists of articles read during the review. This second route extends the temporal coverage of the corpus beyond the search date, through 2026. The database search was executed as a grid of forty queries, one per combination of the values of three semantic slots:
<search> :- <source> AND <task> AND <method>
where each slot was instantiated with multiple synonyms to maximize recall:
<source>satellite images ∣ satellite imagery ∣
remote sensing images ∣ remote sensing imagery ∣
aerial images ∣ aerial imagery ∣
UAV images ∣ UAV imagery (unmanned aerial vehicle)
<task>change detection
<method>method ∣ approach ∣ technique ∣ model ∣ framework
Each query combined one <source> phrase, the <task> phrase, and one <method> term over the default Scopus search fields; the executed query grid is reproduced verbatim in Appendix A. Three filters were applied at query time: only English-language publications were retained (LANGUAGE(english)); only journal articles and conference or workshop proceedings were considered (SRCTYPE(j) OR SRCTYPE(p)); and only open-access publications were included (OPENACCESS(1)).
Studies were eligible for inclusion if they proposed or evaluated a change detection method for optical or multi-spectral remote sensing imagery and were published in English as peer-reviewed journal articles or conference or workshop proceedings. The open-access constraint of the query grid applied to the automated database search only, as a measure to keep the volume of retrieved records tractable; studies entering through the complementary identification route were assessed against the same topical and methodological criteria without any restriction on access status, their full texts being obtained through the authors’ institutional subscriptions to the principal high-impact venues in the field. Studies were excluded if they addressed a non-optical modality exclusively (synthetic aperture radar, LiDAR, or point cloud data as the sole input), targeted video or medical imaging domains, constituted review articles or dataset-only descriptors, or reported an experimental evaluation insufficiently detailed to support comparison. Included studies were grouped for synthesis by methodological paradigm (Section 5, Section 6 and Section 7).
The query grid returned 5243 records; removal of 3167 duplicates arising from overlapping sub-queries left 2076 unique records. These were screened by the first author on titles, abstracts, and keywords, excluding 595 records unrelated to change detection in remote sensing imagery. The remaining 1481 reports were assessed for eligibility in two stages. An automation script, whose decisions were verified manually and could be overridden, first filtered the candidates on topical keywords and excluded uncited papers, review articles, and dataset-only descriptors. Retention was balanced across method families, so that the corpus remains representative of the full methodological landscape rather than dominated by the most recent architecture family. The retained candidates were then read at full text, and those whose experimental evaluation was insufficiently detailed to support comparison were excluded. One further report was excluded at this stage as a duplicate record of an already included study. The two stages jointly excluded 1408 reports and yielded 73 studies from the database route; because automated decisions were subject to manual override, per-stage exclusion counts were not retained. A further 94 records were identified through other methods, 70 from the authors’ prior research and 24 through backward citation searching, of which 71 were retained after assessment against the same eligibility criteria. Selection decisions and data extraction from the included full texts were performed by the first author; uncertain cases were resolved by discussion between the authors. The two routes jointly yielded the final corpus of 144 primary papers, listed in Supplementary Materials File S2 together with their identification route, method family, supervision regime, and application domain. Figure 5 presents the PRISMA flow diagram and Figure 1 the temporal distribution of the corpus.
The open-access constraint applied to the automated database search is a deliberate retrieval-scoping decision rather than a restriction on the corpus as a whole. Applied to the query grid, it keeps the volume of database records manageable and ensures that the reproducible, machine-executable component of the search returns full-text-available results, so that the executed queries can be re-run by any reader to reproduce the database arm exactly. The corpus itself is not access-restricted. It was assembled by first drawing on a substantial body of change detection literature compiled during the authors’ prior research, then applying the open-access-filtered database search to systematize and extend this base, and finally performing a backward citation-completeness pass over the reference lists of all retrieved studies to recover any influential work that the database filter alone would have missed. Studies published in subscription-access venues were included on the same footing as open-access ones wherever they were topically and methodologically eligible, their full texts being available through institutional subscriptions; citation impact, normalized by time since publication, was additionally considered when prioritizing candidate studies, so that highly cited and field-defining works were not omitted on account of access status. The residual effect of the database filter is therefore confined to the relative frequency with which methods appear in the automated arm and, hence, to the quantitative distributions reported in this review, not to the presence of any influential method in the corpus.
The effect of this filter is not uniform across the period covered by the review. It is most pronounced for the pre-2017 classical literature, which predates both the widespread adoption of open-access publishing in remote sensing and the routine deposition of preprints. The composition of the corpus makes this visible: of the 33 included studies published before 2017, only 11 (33%) were retrieved by the open-access-filtered database search, whereas 22 (67%) entered through backward citation searching or the authors’ prior research. For the 111 studies published from 2017 onward, the proportion is reversed, with 62 (56%) retrieved by the database search. The complementary identification route was introduced precisely to compensate for this asymmetry, and it recovers the canonical statistical and machine learning contributions that the open-access filter alone would have excluded: change vector analysis [28], multivariate alteration detection and its iteratively reweighted extension [29,30], automatic thresholding of the difference image [31], the polar and compressed formulations of change vector analysis [32,33], support vector machine [34] and principal component analysis [35] detection, the unified framework of Bruzzone and Bovolo [6], and the trajectory-based time-series methods LandTrendr [36], BFAST [37], and CCDC [38].
One form of residual conditioning nonetheless remains, and the quantitative distributions reported in this review should be read in its light: the frequency counts in Figure 1 and Table 2 are computed over the corpus as assembled and are therefore conditioned on both the automated open-access retrieval and the purposive balancing across method families described above. They indicate the relative prominence of methods, datasets, and supervision regimes within a reproducible sample and are not unbiased estimates of publication frequency in the field at large. This conditioning affects the frequency of representation rather than the presence of methods: every paradigm identified in recent change detection reviews [3,10,12,23] is represented by at least one included study, and the backward citation-completeness pass and citation-impact screening described above were introduced specifically to ensure that influential individual methods were not omitted on account of access status. Because the substantive conclusions synthesized in Section 10 rest on the convergence of several methodologically independent sub-corpora rather than on the exhaustive enumeration of any single family, they are robust to this conditioning; the review should be consulted as a structured synthesis of the methodological landscape, complete in its coverage of paradigms, rather than as a citation-complete enumeration of every published instance.
Likewise, because part of the corpus was assembled through citation searching and through purposive balancing across method families, the corpus constitutes a curated representative sample rather than the closed output of a single database query; the two identification routes are therefore reported separately in the flow diagram.
The corpus was closed at the point of synthesis. Works cited elsewhere in this review for context, comparison, or completeness, including reviews, foundation models not specific to change detection, and studies identified during revision, are not counted among the 144 primary papers and do not enter the quantitative distributions reported here; the distinction between the analyzed corpus and the wider citation list is maintained throughout.

4. Datasets and Benchmarks

Table 2 summarizes the major publicly available change detection benchmarks used across the 144-paper corpus. Within the deep learning papers, LEVIR-CD appears in 33 papers, CDD in 24, and WHU-CD in 18, confirming their status as the three primary evaluation standards for binary change detection. These high-resolution benchmarks, alongside the broader set of sensor-specific datasets and evaluation metrics, have been cataloged in detail by high-resolution-focused surveys [8].
  • LEVIR-CD [39]
Comprises 637 pairs of Google Earth images at 0.5 m ground sample distance (GSD) ( 1024 × 1024 pixels) covering American cities (2002–2018), with pixel-level binary building change annotations. The standard patch-level variant (LEVIR-CD+, 256 × 256 patches, 7120/1024/2048 train/val/test) is used in most contemporary benchmarking.
Season-varying change detection dataset of 11 very-high-resolution (VHR) image pairs ( 0.03 1 m / pixel ) from Google Earth, capturing building construction, vegetation growth, and general land use modification. Its semantic diversity makes it a complementary benchmark to the building-focused LEVIR-CD and WHU-CD.
  • WHU-CD [41]
Aerial imagery at 0.3 m GSD over Christchurch, New Zealand before and after the 2011 earthquake, with binary building change annotations over approximately 20.5 km2.
  • SYSU-CD [42]
Comprises 20,000 aerial image pairs at 0.5 m from Hong Kong (2007–2014) across six change scenario types: urban construction, suburban expansion, groundwork, vegetation change, road expansion, and sea construction.
  • DSIFN-CD [43]
Comprises 3940 pairs of 512 × 512 images from six Chinese cities (2 m GSD), providing a larger and more geographically diverse binary change detection benchmark than LEVIR-CD.
  • HRSCD [44]
Two large-format (10,000 × 10,000) aerial image pairs from Bordeaux and Caen, France, annotated with five land cover classes. As explicitly noted in [44], the scarcity of such annotated datasets constitutes a principal bottleneck limiting the development of deep supervised semantic change detection methods.
  • SECOND [26]
Comprises 4662 aerial image pairs (0.5–3 m) annotated with six land cover classes for from–to semantic change detection evaluation.
  • GZ-CD [45]
Comprises 19 season-varying VHR image pairs at 0.55 m GSD from Guangzhou, China (2006–2019), with binary building change annotations. The dataset exhibits substantial seasonal variation, making it a valuable complement to non-seasonal benchmarks.
Building damage assessment, a disaster-oriented variant of semantic change detection, is served by dedicated multi-disaster benchmarks rather than by the binary- and semantic-change datasets above. The most prominent is xBD [46], which pairs pre- and post-event satellite imagery from eight disaster types across fifteen countries with building polygons, ordinal damage-level labels, and damage–cause annotations over roughly 700,000 buildings, and underpins the xView2 building-damage challenge.
Table 2. Principal publicly available change detection benchmarks. Ground sample distance (GSD). Freq.: number of corpus papers using each dataset.
DatasetRelease YearModalityGSDPairsChange ClassesFreq.
LEVIR-CD [39]2020RGB (Google Earth)0.5 m6371 (building)33
CDD [40]2018RGB (Google Earth)0.03–1 m111 (binary)24
WHU-CD [41]2019Aerial RGB0.3 m1 large pair1 (building)18
SYSU-CD [42]2021Aerial RGB0.5 m20,0001 (6 scenarios)9
GZ-CD [45]2020RGB (Google Earth)0.55 m191 (binary)6
DSIFN-CD [43]2020RGB2 m39401 (binary)3
SECOND [26]2021Aerial RGB0.5–3 m46626 (semantic)2
HRSCD [44]2019Aerial RGB0.5 m2 large pairs5 (semantic)2
BTCDD [47]2020RGB (Google Earth)52811 (binary)3
S2Looking [48]2021Satellite0.5–0.8 m50001 (building)1
Air Change (AC) [49]2009Aerial1.5 m13 pairs1 (binary)3
OSCD [50]2018MS (S-2)10 m24 pairs1 (binary)2
Several benchmark limitations affect the interpretability of reported results. First, the three primary benchmarks disproportionately represent building change in East Asian and North American urban contexts. Second, train/test split definitions and patch extraction strategies differ across papers, even for the same nominal dataset. Third, all existing benchmarks provide point-in-time binary annotations and do not support multi-temporal sequence evaluation. Fourth, no benchmark encompasses diverse geographic regions, multiple sensor modalities, and multiple change type categories simultaneously.

5. Traditional Statistical Methods

Figure 6 gives a technical roadmap of the three methodological paradigms surveyed in this and the following two sections, tracing within each the progression of representative method families; the three tracks are developed in detail in Section 5, Section 6 and Section 7. Statistical approaches, dominant from the 1970s through the early 2010s, typically follow a three-stage pipeline: (1) generation of a change indicator image through algebraic or transform-based operators applied to the co-registered image pair; (2) statistical analysis and thresholding of the indicator image to produce a binary or multi-class change map; and (3) optional spatial post-processing for consistency enforcement.

5.1. Algebraic Difference and Index Methods

5.1.1. Image Differencing and Linear Operator Comparison

The earliest systematic evaluation of linear multi-temporal change detection operators compared multidate principal component analysis (PCA), Gram–Schmidt orthogonalization, and the Kauth–Thomas transformation for forest mortality mapping on Landsat thematic mapper (TM) imagery. PCA and the Kauth–Thomas wetness component were identified as the most reliable indicators, and the studies found that preprocessing beyond minimal radiometric alignment provided no consistent benefit [51]. Subsequent work generalized the linear-operator approach along two directions. The first direction substitutes engineered spectral indices targeted at specific biophysical processes for the generic reflectance difference, with demonstrated effectiveness in burned-area mapping [52], vegetation dynamics [53], and forest health monitoring [54]. The second direction replaces the pixel-level comparison underlying all linear operators with a scale-invariant feature-matching pipeline, enabling direct comparison of images at heterogeneous spatial resolutions without the resampling artifacts that linear operators introduce [55].

5.1.2. Change Vector Analysis (CVA)

CVA, introduced by Malila [28] to distinguish forest harvesting from regrowth in multi-date Landsat data, decomposes the per-pixel spectral change vector Δ x i = x 2 , i x 1 , i into magnitude and direction components [25,32,56], enabling simultaneous binary detection and change type identification.
Bovolo et al. [33] generalized this principle into a framework for the automatic and unsupervised detection of multiple changes. Rather than discarding spectral information by operating in a reduced subspace, compressed change vector analysis ( C 2 VA) projects the full B-band change vector onto a single magnitude–direction plane that preserves the distinct directions associated with different change types. A two-step Bayesian decision strategy then first separates changed from unchanged pixels and subsequently partitions the changed pixels into multiple change classes. This unsupervised multiple-change baseline was later carried into deep-feature space by the deep change vector analysis of Saha et al. [57].
Yang et al. [58] applied harmonic Landsat time-series modeling with CVA-based change characterization for coastal tidal wetland monitoring across 17 tiles of the northeastern US (1984–2021), achieving land cover classification accuracy of 95.8% and change detection accuracy of 99.8%, while importantly distinguishing between cover change and condition change. CVA also forms the initial change-detection step in the method of Lu et al. [59] for multi-sensor landslide mapping, achieving kappa of 0.82–0.90 across four disaster events. Tsai et al. [60] applied Normalized Difference Vegetation Index (NDVI) filtering with CVA to Formosat-2 imagery for Typhoon Morakot landslide inventory, detecting 9333 landslides over 22,590 ha with approximately 9% omission and 16% commission error.
The algebraic family endures because it substitutes a targeted physical prior for a learned representation: indices engineered against a specific biophysical process [52,53,54] outperform generic reflectance differencing while preserving a decision surface that is interpretable and transferable across sensors without retraining, and CVA extends the same logic by encoding change type as the direction of the spectral difference vector and change intensity as its magnitude [28,32,56,58]. The principal limitation is that these operators act directly on radiometric values. This leaves them sensitive to residual illumination, atmospheric, and phenological differences between acquisitions and forces an arbitrary choice of decision threshold. The transformation-based methods of Section 5.2 address precisely this weakness, mapping the bi-temporal data into a feature space in which legitimate change is separated from acquisition-induced variability by construction.

5.2. Transformation-Based Methods

5.2.1. Principal Component Analysis

Applied to the stacked bi-temporal image, PCA concentrates change information into higher-order components. Deng et al. [61] demonstrated the canonical multi-date variant on a stacked multi-temporal, multi-sensor image (SPOT-5 with Landsat-Enhanced Thematic Mapper Plus (ETM+)): standardized PCA on the combined-date bands concentrates genuine land use change into a small number of components by exploiting the high inter-date correlation of unchanged areas, after which a hybrid unsupervised–supervised classifier labels the enhanced image into from–to transitions; the pipeline reported higher overall accuracy than the post-classification comparison baseline on the same scene.
Al-Khudhairy et al. [62] employed PCA alongside image differencing, object-oriented eCognition classification, and mathematical morphology for structural damage assessment from Ikonos data following conflict events in Jenin and Brest, North Macedonia. Standardized PCA achieved 12% omission and only 3% commission error on the Brest dataset. The unsupervised PCA + k-means pipeline [35] remains among the most widely cited baseline methods for unsupervised change detection, providing a transparent, parameter-light reference point against which more complex methods are evaluated.

5.2.2. Multivariate Alteration Detection (MAD) and Iteratively Reweighted (IR)-MAD

Nielsen’s iteratively reweighted MAD transform [29,30] applies canonical correlation analysis in successive iterations, down-weighting likely changed pixels to progressively refine the change-free correlation structure. IR-MAD is affine-invariant, making it robust to differential radiometric calibration between acquisitions. Within the current corpus, IR-MAD is exploited as a pre-detection strategy in a hybrid unsupervised Transformer-based framework [63], where IR-MAD and compressed CVA [33] jointly generate pseudo-training samples from VHR imagery of Guangzhou and Nanjing without manual annotation, subsequently initializing a Transformer network that surpasses standalone IR-MAD performance. A direct comparison with deep learning on shared benchmarks clarifies where this affine-invariance is decisive. Because IR-MAD is fully unsupervised, its natural point of comparison is the label-scarce regime, and there it remains a strong baseline: on the hyperspectral Farmland scene it attains 96.04% overall accuracy and 0.923 kappa [64], exceeding a patch-based CNN trained on the same data (93.47%, 0.850) and matching the change-class F 1 of the best classical transforms (93.14%, against 91.97% for CVA) [65]. The advantage does not extend to supervised deep architectures or to more heterogeneous scenes: on the River and Hermiston benchmarks, the change-class F 1 of IR-MAD falls to 66.21% and 65.80%, against 89.01% and 94.61% for the multiscale network MSDFFN evaluated under the same protocol [65]. This pattern, competitive without supervision, surpassed once labels and architectural capacity are available, is precisely what motivates the hybrid use of IR-MAD noted above, in which it supplies label-free pseudo-training samples that a Transformer subsequently refines [63], rather than serving as a standalone detector on modern high-resolution benchmarks.

5.2.3. Time-Series Decomposition

For vegetation and land cover monitoring, spectral time-series decomposition separates a noisy signal into trend, seasonal, and disturbance components, enabling detection of both gradual changes (slow shifts in the trend term) and jumps, abrupt step-like discontinuities in the series level that mark events such as fires, harvests, or floods.
The foundational method of this family is Breaks For Additive Season and Trend (BFAST) [37]. It couples the decomposition of a time series into trend, seasonal, and remainder components with breakpoint detection inside each, iteratively estimating the number and timing of breaks and characterizing each by magnitude and direction. Breaks in the trend component flag disturbances such as fires or insect outbreaks, while breaks in the seasonal component flag phenological or land cover transitions. The procedure requires no change-free reference period.
Ghaderpour and Vujadinovic [66] proposed Jumps Upon Spectrum and Trend (JUST), a weighted least-squares method operating on unequally spaced, noisy satellite time series to simultaneously estimate jump location, direction, and magnitude. Applied to MODIS time series of the NDVI, JUST correctly detected 94% of wildfire-related negative-magnitude jumps within one month of occurrence versus 86% for ordinary least-squares baselines. Ben Abbes et al. [67] systematically compared three classical decomposition methods on simulated NDVI series, finding the Breaks For Additive Season and Trend algorithm to deliver the lowest trend reconstruction error (root mean square error 0.015 versus 0.037 for the next-best alternative) and demonstrating that method selection should reflect the expected change dynamics of the target ecosystem. Winsvold et al. [68] applied red and short-wave infrared band-ratio time-series stacking to Landsat imagery for regional glacier mapping, demonstrating that temporal stacks provide more robust delineation than single optimal-date selections. Hughes et al. [69] introduced a patch-based total variation regularization method for Landsat time-series forest disturbance detection, classifying temporal segments as disturbed, stable, or regenerating (overall error ≈ 23%, with omission varying from 22% for wildfire to 78% for physiological stress).

5.3. Probabilistic and Markov Random Field Methods

Markov random field (MRF) regularization reduces false positive rates by modeling spatial label dependencies within the change map. The foundational probabilistic framework for unsupervised change detection was established by Bruzzone and Fernández Prieto [31], who formulated the problem as binary hypothesis testing over the difference image using a Gaussian mixture model with expectation–maximization (EM) parameter estimation for automatic threshold selection. Lu et al. [59] proposed the change detection Markov random field (CDMRF) framework for multi-sensor landslide mapping, comparing several change-indicator alternatives (CVA, δ NDVI, and PCA) and achieving kappa of 0.90 for the Jiuzhaigou earthquake scenario using pre-event Landsat-8 combined with post-event Sentinel-2 imagery. Byun et al. [70] proposed an unsupervised flood extent extraction method exploiting spectral distortion during cross-fusion of bi-temporal KOMPSAT-2 very-high-resolution imagery. The pre-flood MS image is fused with the normalized post-flood near-infrared image, and a local distortion measure with automatic thresholding separates flooded from non-flooded pixels. The method achieves an overall accuracy of 75.04%, comparable to a supervised support vector machine (SVM) and substantially outperforming CVA and MAD, while requiring no training data. Luo et al. [71] applied Dempster–Shafer evidence theory to multi-temporal VHR imagery for urban change detection, fusing spectral, textural, and structural evidence sources under an uncertainty-aware framework.
The probabilistic family contributes two architectural commitments that the deep learning literature has only partially recovered: an explicit Markov random field prior absorbs the salt-and-pepper artifact of every per-pixel decision function in a principled rather than heuristic manner [31,59], and expectation–maximization inference over a Gaussian mixture supplies the threshold that algebraic and transformation methods leave to the practitioner. Its principal cost is dependence on distributional assumptions that break down under genuine scene heterogeneity. A further limitation is that the unit of inference remains a binary change/no-change label, rather than the from–to transition required by most operational land monitoring applications. The post-classification comparison methods of Section 5.4 address this second limitation directly, reformulating the problem as a difference between two independent classifications rather than as a label assigned to a difference image.

5.4. Post-Classification Comparison

Post-classification comparison (PCC) independently classifies each date and identifies change as label discrepancies [2,24]. PCC constitutes the dominant approach for long-term land use/land cover (LULC) change analysis in the corpus, consistent with its standing as one of the most widely used comparison methods in the broader literature [25].
In one of the earliest quantitative comparisons of the major change-detection families, Mas [72] evaluated six procedures on bi-temporal Landsat MS Scanner imagery of a tropical coastal zone: image differencing, vegetation-index differencing, selective principal component analysis, direct multi-date classification, and two post-classification variants. Post-classification comparison proved both the most accurate and the only family to recover the nature of the transitions, while the image-enhancement methods were degraded by phenological and soil-moisture differences between acquisition dates. This established early the now-canonical observation that classification-based detection is more robust than image-arithmetic methods to seasonal and radiometric variation.
Rawat et al. [73] documented built-up expansion of 8.88% in Ramnagar town. Rawat and Kumar [74] reported vegetation increase and barren land decrease in Hawalbagh block. Tewabe and Fentahun [75] quantified a 13–15% cultivated land increase in the Lake Tana Basin, Ethiopia. Hassan et al. [76] documented the urban expansion of Islamabad from roughly 18% to 57% built-up cover. Tran et al. [77] reconstructed LULC transitions across nearly 40 years of the Mekong Delta, documenting the conversion from rice cultivation to aquaculture.
Fan et al. [78] applied post-classification comparison to bi-temporal Landsat TM/ETM+ imagery of Guangzhou, producing per-county land cover conversion matrices that quantified rapid urban expansion at the expense of cropland across the five counties of the municipality between 1998 and 2003.
Xiao and Weng [79] extended post-classification LULC analysis to its thermal consequences in a karst region of Guizhou, deriving land surface temperature and NDVI per land cover class across three Landsat TM dates and showing that the conversion of agricultural land to urban surfaces widened the urban–rural temperature difference while reforestation moderated it.
CA-Markov frameworks extend PCC by training transition probability matrices on detected historical changes to simulate future land cover states. An early and widely cited instance of this combination is Weng [80]. That study paired post-classification comparison of multi-date Landsat imagery with a Markov-chain transition model, both quantifying and projecting the rapid, urbanization-driven land use change of the Zhujiang (Pearl River) Delta. The remote-sensing change map was integrated with Geographic Information Systems (GIS) overlays of physical and socioeconomic variables, in order to interpret the drivers behind the observed transitions. Koko et al. [81] applied this approach to Zaria city, projecting future built-up expansion for 2035 and 2050. Belay et al. [82] contrasted business-as-usual (BAU) versus governance scenarios in the Gumara Watershed, Ethiopia, projecting cultivated land expansion to 89% under BAU versus stabilization under the governance pathway. Lyons et al. [83] combined empirical bathymetry retrieval with maximum likelihood seagrass classification on bi-temporal QuickBird-2 imagery of Moreton Bay. Mas et al. [84] demonstrated a semi-automatic map-updating workflow combining automatic segmentation, discrepancy detection, an auxiliary decision tree, and visual interpretation for Michoacán, Mexico.
Post-classification comparison delivers what policy and land-management applications actually need: a from–to transition map at the native land cover ontology. A binary change indicator, by contrast, must be enriched through a separate classification step to become operationally useful [2,75].
The cost of the approach is that the change accuracy is bounded by the product of two independent per-date classification accuracies. This is a stricter regime than bi-temporal direct detection but also a more diagnosable one: errors localize to the specific date and class at which they occurred. The structural limitation of the family in its classical form, and of the broader statistical paradigm reviewed in this section, is that the per-date classifier is typically a simple maximum-likelihood or threshold rule: its decision boundary is not optimized for the change-detection objective, and its features are fixed in advance by the practitioner. The discriminative supervised classifiers of Section 6 are designed to close this gap, replacing fixed plug-in classifiers and hand-engineered indices with margin-maximizing and ensemble-based decision functions trained from labeled examples.

6. Machine Learning Methods

Machine learning methods introduce discriminative classifiers trained from labeled examples, learning change-discriminative functions from feature vectors derived from bi-temporal image pairs. An early and influential application of SVMs to change detection was proposed by Bovolo et al. [34], who demonstrated SVM classification of the difference image for binary change detection from multi-temporal remote sensing data.

6.1. Support Vector Machines

Tan et al. [85] compared random forest and SVM classifiers on Sentinel-2A imagery for post-wildfire land cover change in Serra da Estrela Natural Park, Portugal, finding random forest applied at the segment level to deliver the highest overall accuracy, with burn-sensitive spectral indices identified as the most discriminative variables. An important practical observation was the divergence between numerical metrics and visual plausibility: pixel-level SVM maps matched reference data better visually in some heterogeneous burned areas despite lower overall accuracy scores, suggesting that segment-based aggregation can mask within-object heterogeneity that the pixel-level classifier preserves. Azzouzi et al. [86] applied object-based SVM to a Landsat-5 TM series for desertification monitoring in Biskra, Algeria, with sand area gain of roughly 21% identified as the dominant change type. Atef et al. [87] compared SVM, random forest, and maximum-likelihood classifiers on Landsat data for El-Fayoum Governorate, Egypt, finding SVM to perform best and documenting urban land expansion from 3.43% to 5.99%. Dammalage and Jayasinghe [88] applied SVM to Landsat imagery of Colombo District, directly linking the growth of urban area from 10% to 36% between 1989 and 2016 to a corresponding increase in flood inundation extent from 63.0 km2 to 74.7 km2 despite lower total rainfall in 2016.
Hou et al. [89] proposed a semi-supervised building change detection framework combining spectral–spatial features, superpixel segmentation, saliency-guided pseudo-label generation, and random forest classification, achieving kappa of 0.52–0.75 across QuickBird and Google Earth image pairs while requiring no pixel-level manual annotation. This approach constitutes a conceptual bridge between unsupervised classical analysis and label-intensive deep supervised learning.
The support vector machine remains the appropriate classifier for feature-engineered, small-sample, severely imbalanced, and high-dimensional change detection problems. Margin maximization provides a structural robustness to the rare-positive regime, in which changed pixels comprise less than five percent of the image. The kernel trick exploits engineered spectral, textural, and ancillary descriptors at sample-complexity costs that explicit high-dimensional representations would not permit [34,90]. The principal limitations are operational rather than representational: training cost scales quadratically with the number of support vectors, the multi-class extension proceeds through awkward one-versus-rest or one-versus-one combination, and the output is a margin score rather than a calibrated probability. Each of these costs is precisely what the random forest and ensemble methods reviewed next address by construction, with native multi-class capability, near-linear scaling in the training set size, and a probabilistic output that supports operational triage between high- and low-confidence predictions.

6.2. Random Forests and Ensemble Methods

Within the tree-based family, the single decision tree was established for change detection by Im and Jensen [91]. They classified bi-temporal imagery with a C5.0 tree fed both the stacked two-date bands and three engineered neighborhood-correlation-image features: the per-pixel correlation, slope, and intercept of the regression between the dates over a local window. Contextual evidence, rather than the isolated spectral pixel, therefore drives a from–to classification. Unchanged areas yield high correlation with near-unit slope and near-zero intercept, while the slope and intercept disambiguate the changed pixels that correlation alone leaves indistinguishable.
Rash et al. [92] compared SVM, random forests (RF), artificial neural network, K-nearest neighbors (KNN), and XGBoost for LULC change detection in the Kurdistan region of Iraq using Landsat data, finding RF consistently best, with agricultural land increase of 13.54% (+480 km2) and rangeland decrease of 11.33% over 30 years. Hu and Hu [93] applied annual RF classification via Google Earth Engine (GEE) to Landsat data across Central Asia, achieving overall accuracy of 0.90 ± 0.01 and identifying precipitation and drought as dominant drivers of natural vegetation change through multiple stepwise regression. Scharsich et al. [94] addressed missing historical ground truth by transferring recent RF class labels backward via CVA-identified stable pixels, achieving cross-validation consistency of 94.11–99.60% across three Landsat dates. Seydi et al. [95] applied Harris hawks optimization (HHO) feature selection across 121 candidate features from Sentinel-2 MS imagery for Australian wildfire damage assessment.
Seo et al. [96] proposed RF regression for radiometric and phenological normalization as a preprocessing step for change detection. Chen et al. [97] demonstrated RF-based one-class classification for earthquake-induced landslide susceptibility mapping using an incomplete inventory, addressing the practical constraint that post-disaster reference data are often spatially incomplete.
The RF and broader tree-ensemble family acts as the default operational classifier because three properties hold simultaneously: competitive performance with hundreds to thousands of labeled pixels, a regime in which supervised deep architectures do not converge [96,97]; native feature-importance ranking that supports the introspection requirements of regulatory and scientific deployments; and a pipeline pattern in which classical signal-processing components handle radiometric normalization before the ensemble classifier handles the semantic decision. The structural limitation, shared with every per-pixel discriminative classifier, is the salt-and-pepper artifact. It arises when independently classified neighboring pixels disagree under noise that the local feature vector cannot resolve. The object-based image analysis methods discussed next address this artifact at its source, promoting the spatially coherent segment rather than the pixel to the atomic unit of classification. Spectral, textural, and shape descriptors are thereby aggregated over a region whose internal coherence is enforced before any decision function is applied.

6.3. Object-Based Image Analysis

Object-based image analysis (OBIA) shifts the unit of analysis from the individual pixel to the image segment, a paradigm consolidated in the influential review of Blaschke [98], whose synthesis of several hundred studies established segmentation-then-classification as the dominant workflow for very-high-resolution imagery and motivated its adoption for change detection.
Building on this paradigm, Chen et al. [99] synthesized the OBCD literature into a working taxonomy of image-object, class-object, multi-temporal-object, and hybrid schemes. These are distinguished by whether change is sought between segmented objects, between their per-date classifications, or within objects derived from a stacked multi-date image. The same work isolated the challenges that set OBCD apart from its pixel-based counterpart, chiefly the comparison of non-coincident image-objects across dates and the sliver polygons that arise when independent segmentation of the two acquisitions fails to align.
An early and influential instantiation of this paradigm is the work of Walter [100], who detected change without segmenting the imagery afresh. Instead, groups of pixels delineated by the objects of an existing GIS database were classified directly. A supervised maximum-likelihood classifier, operating on per-object MS and derived-feature statistics with training samples drawn automatically from the database, flags objects whose current land cover departs from their recorded class. This is a database-driven route to object-based change detection, naturally suited to map updating.
Wang et al. [90] demonstrated urban change detection from bi-temporal very-high-resolution imagery using spectral, shape, and texture features combined via ensemble voting across several classical classifiers. Tan et al. [101] simultaneously addressed salt-and-pepper noise, segmentation-scale sensitivity, and single-classifier instability through multiscale CVA-guided sample generation, multi-classifier prediction, and Dempster–Shafer fusion of the resulting evidence. Zhou et al. [102] evaluated object-based versus pixel-based paradigms for coral reef change detection on four Spratly Islands sites, finding object-based change detection to deliver an average overall accuracy roughly twenty percentage points higher than its pixel-based counterpart.
Object-based image analysis resolves the salt-and-pepper artifact at its source by replacing the pixel with a spatially coherent segment as the atomic unit of classification [24], with a corpus-supported accuracy advantage of roughly twenty percentage points over pixel-based classification in the very-high-resolution regime [102]. The principal cost is sensitivity to the segmentation scale parameter, which the multiscale segmentation ensemble [101] mitigates by trading scale tuning for scale integration through voting or evidence fusion. The modeling assumption shared with the preceding machine learning methods, however, is the bi-temporal pair: two acquisitions are compared and the temporal axis is collapsed to a single difference. This formulation is structurally inadequate for the dense, multi-decadal records over which gradual, seasonal, and regime-shift changes unfold, and the temporal-modeling and hybrid methods of Section 6.4 address it by treating the satellite record as a time series rather than as a pair of images.

6.4. Temporal Modeling and Hybrid Approaches

The opening of the Landsat archive in 2008 transformed change detection from a bi-temporal comparison into the analysis of dense temporal trajectories. This shift is synthesized in the review of Zhu [103], which organized time-series change-detection algorithms into six families: thresholding, differencing, segmentation, trajectory classification, statistical boundary, and regression. Each family is characterized along axes that the bi-temporal formulation cannot express, most importantly the distinction between abrupt and gradual change and between online and offline detection.
The canonical realization of this continuous paradigm is the continuous change detection and classification (CCDC) algorithm of Zhu and Woodcock [38]. CCDC fits a time-series model of seasonality, trend, and breaks to every available Landsat observation at each pixel, flagging change when the difference between observed and model-predicted reflectance exceeds a multi-band threshold on three consecutive observations. The model is updated online as new acquisitions arrive, and its fitted coefficients then feed a random-forest classifier that assigns land cover. The result is a single framework that both monitors change continuously and maps land cover at any chosen date.
A complementary trajectory-based formulation is LandTrendr [36], which fits piecewise-linear segments to each pixel’s yearly spectral trajectory. This captures abrupt disturbance events and slow recovery trends within a single temporal segmentation, while suppressing the ephemeral variation introduced by illumination, phenology, atmosphere, and misregistration. Where CCDC monitors continuously from all available observations, LandTrendr summarizes the full disturbance–recovery history as an interpretable sequence of linear segments.
A representative application of this continuous machinery is Fu and Weng [104]. They processed 507 Landsat TM/ETM+ images of metropolitan Atlanta from 1984 to 2011 with CCDC to detect urban land cover change, then decomposed the co-registered land-surface-temperature series into seasonal and trend components. This quantified how specific transitions, notably the conversion of evergreen forest to medium-intensity urban land, reshape the local thermal regime, thereby coupling time-series change detection to its biophysical consequences.
Hu et al. [105] combined classification and regression tree (CART) classification with change vector analysis in posterior probability space (CVAPS) and NDVI timing analysis for large-scale land map updating over 6.86 million km2 of western China via GEE. CVAPS is a variant of CVA that operates on per-class posterior probabilities rather than on raw reflectance values; change is therefore measured as a shift in the distribution of class membership rather than as a shift in spectral signal. The addition of NDVI timing analysis increased change-detection accuracy from 82.00% to 88.20%. Francini et al. [106] applied a reinforcement-learning-inspired temporal decision algorithm to PlanetScope RGB imagery for near-real-time forest clearcut detection in Tuscany, achieving user’s accuracy = 86% and producer’s accuracy = 92% with detection latency of weeks rather than months. Roy and Inamdar [107] demonstrated that multi-sensor radiometric calibration is the key enabler for reliable long-term change analysis, achieving OA = 91.36% across six Landsat dates over the Shivna River Basin. Viana et al. [108] applied time-weighted dynamic time warping to long-term satellite image time series for LULC change detection, demonstrating the value of temporally adaptive similarity measures for phenologically complex landscapes. Patel et al. [109] combined GIS and Google Earth Engine for spatiotemporal LULC analysis of Ahmedabad city, illustrating the growing role of cloud-based platforms in enabling large-scale change detection workflows.
The operational reach of the time-series paradigm is exemplified by the global forest-change product of Hansen et al. [110]. That work applied a bagged decision-tree classifier to the full Landsat record on a cloud-computing platform, mapping annual gross forest loss and gain worldwide at 30 m resolution over 2000–2012. The result is a globally consistent yet locally resolved disturbance record, which has become a standard reference layer for forest monitoring well beyond the remote-sensing community.
The temporal-modeling and hybrid sub-corpus addresses what the bi-temporal formulation does not. Phenologically adaptive similarity [108], posterior-probability classification of dense time series [105], and reinforcement-style temporal decision algorithms [106] together deliver near-real-time monitoring at continental scale. The bottleneck has shifted from computation to algorithm design as cloud platforms absorbed the throughput cost. Across the entire machine learning section, however, the binding constraint has remained the hand-engineered feature vector: the discriminative classifier operates on a representation the practitioner constructs in advance, and generalization to a new sensor or geographic domain is bounded by the transferability of those features rather than by the capacity of the classifier itself. The deep learning methods of Section 7 reformulate the problem to remove this constraint. They replace engineered descriptors with hierarchical features learned end-to-end from raw imagery and pixel-level supervision. This supplies the element that the machine learning generation could not deliver: a representation jointly optimized with the change-detection objective within a single trainable pipeline.

7. Deep Learning Methods

Deep learning methods have transformed change detection since approximately 2016, driven by the convergence of large annotated benchmarks, increased computational resources, and architectural innovations centered on the convolutional neural network (CNN) and its descendants [7].
The performance advantage of these methods over their statistical and machine-learning predecessors has been attributed to improved information representation, more flexible network configurations, and the resulting accuracy gains [10].

7.1. Fully Convolutional Networks and Foundational Siamese Designs

Caye Daudt et al. [111] introduced three fully convolutional network (FCN) architectures (FC-EF early fusion, FC-Siam-conc, and FC-Siam-diff Siamese middle fusion), all built on U-Net with skip connections. The Siamese middle-fusion configurations substantially outperformed early fusion, establishing the dual-branch weight-sharing paradigm as the dominant baseline. Siamese middle fusion is the dominant strategy among the deep learning papers in the combined corpus.
Peng et al. [112] extended this to UNet++ with nested dense skip connections and multiscale output fusion (MSOF), using a combined balanced binary cross-entropy and dice coefficient loss. Fang et al. [113] introduced SNUNet-CD combining NestedUNet with the ensemble channel attention module (ECAM), preserving shallow-layer high-resolution features to address localization loss in deep encoders. Mou et al. [114] introduced ReCNN for joint spectral–spatial–temporal modeling on Landsat ETM+ and demonstrated that recurrent temporal modeling substantially improves detection of gradual changes relative to single bi-temporal comparison. de Bem et al. [115] evaluated U-Net, SharpMask, and ResUNet for annual Amazon deforestation mapping on Landsat-8 Operational Land Imager (OLI).
The deeply supervised image fusion network for DSIFN-CD [43] introduced a six-branch architecture integrating deep supervision at multiple decoder levels, evaluated on the six-city DSIFN-CD benchmark. Shi et al. [42] presented the SYSU-CD dataset alongside a deeply supervised attention metric-based network achieving competitive binary change detection results. Peng et al. [45] proposed SemiCDNet, a semi-supervised generative adversarial network (GAN)-based architecture exploiting both labeled and unlabeled data through dual discriminators enforcing segmentation and entropy map consistency, introducing the GZ-CD dataset of 19 season-varying VHR image pairs from Guangzhou. Bai et al. [116] introduced an edge-guided recurrent CNN that explicitly models building boundary information across temporal sequences, improving the delineation of fine-grained structural changes in multi-temporal VHR imagery.
In contrast to these supervised designs, Saha et al. [57] demonstrated an unsupervised, training-free alternative. A frozen pretrained segmentation CNN is applied in a pseudo-Siamese fashion to both acquisitions, and the resulting multi-layer deep-feature hyper-vectors are compared through the classical change-vector-analysis decomposition: magnitude for binary detection and binarized direction for multiple-change clustering. This carries the CVA paradigm of Section 5.1 into deep-feature space without any change-specific annotation.
The foundational generation of deep change detection establishes the minimum viable recipe that every subsequent architectural family extends rather than replaces: a Siamese middle-fusion topology with weight-shared encoders, an encoder–decoder backbone with dense skip connections, and a combined binary cross-entropy and Dice loss [111,112,113]. The Siamese inductive bias, that bi-temporal images traverse identical feature extractors before being compared, produces a measurable five- to ten-point F 1 effect that no later generation has relaxed. The structural limitation of these foundational designs is the symmetric, undirected treatment of the two encoder streams. Features are extracted in parallel and combined through a generic operation, with no mechanism to amplify the spatial and channel regions in which inter-temporal difference is informative or to suppress those in which it reflects nuisance variability. The attention-augmented Siamese architectures of Section 7.2 address precisely this asymmetry, inserting explicit difference-enhancement, change-guidance, and spatial-channel attention pathways into the otherwise unchanged Siamese backbone.

7.2. Attention-Augmented Siamese Networks

The architectures grouped in this subsection augment the Siamese backbone with attention, but they are more usefully compared along three orthogonal axes than enumerated in isolation. The first axis is what is attended: channel attention reweights feature maps by their informativeness [113,117], spatial attention localizes where change is concentrated [117,118], joint spatial–spectral cooperation generates three-dimensional weights that couple the two [119], and cross-temporal or difference attention operates between the two dates rather than within one [120,121,122]. The second axis is the receptive scope over which attention is computed: local convolutional attention, bounded by the convolutional receptive field and therefore linear in cost [113,123]; factorized axial attention, which attends along rows and then columns to approximate global context at near-local cost [124]; and full nonlocal or self-attention, which models every pairwise interaction and is quadratic in the number of pixels [121]. The third axis is the design objective: difference enhancement and pseudo-change suppression [120,121], boundary and high-frequency integrity [122,125,126], and parameter efficiency for constrained deployment [119,123,127,128]. Read against these axes, the methods below are variations in the placement and scope of a small set of recurring attention primitives rather than independent inventions.
The receptive-scope axis also answers why local convolutional attention is retained once global self-attention is available, rather than superseded by it: the two are complementary rather than substitutable. Global nonlocal attention captures the long-range and cross-temporal context needed to separate real change from correlated nuisance variation, but its cost grows quadratically with resolution and becomes prohibitive on VHR imagery, and applied alone, it tends to blur the edge integrity and internal tightness of small changed objects [121]. Local convolutional attention is inexpensive, preserves the fine boundary detail on which change delineation depends, and supplies the locality and translation-equivariance bias appropriate to a task dominated by small, boundary-defined objects. Corpus designs therefore keep both: DESSN pairs a local difference-enhancement module with a resolution-aware nonlocal module so that boundary precision and long-range correlation are recovered together [121], and HANet replaces full self-attention with axial attention precisely to retain most of its reach at a computational cost close to that of local attention [124]. The empirical corollary, developed in the synthesis below, is that well-designed local-attention architectures remain within a narrow margin of the heaviest global models on current benchmarks [119,123,127].
Chen et al. [117] introduced DASNet to address pseudo-change sensitivity through dual spatial and channel attention augmenting a VGG-16 Siamese backbone, combined with a weighted double-margin contrastive (WDMC) loss for class imbalance.
Liu et al. [118] proposed DTCDSCN, which augments a weight-shared Siamese change branch with a dual attention module coupling channel and spatial attention and, distinctively, with two auxiliary semantic-segmentation sub-networks that share the encoder, so that the building-extraction task constrains the shared representation toward object-level discriminability; sample imbalance is handled by a change-detection loss that reweights the focal-loss terms non-linearly between the changed and unchanged classes.
Song and Jiang [129] contributed the important demonstration that early-fusion single-stream architectures can match Siamese middle-fusion performance: AGCDetNet with DilatedResNet50 backbone.
Song et al. [120] introduced SUACDNet with three explicit interaction branches (difference, similarity, global) between Siamese streams via multiple attention modules. Fang et al. [130] generalized this interaction principle into MetaChanger, a backbone-agnostic Siamese framework in which inter-temporal feature interaction is applied during encoding rather than deferred to fusion; its most striking instance, feature exchange, swaps a fraction of the bi-temporal feature channels or spatial positions in a parameter-free operation that nonetheless rivals far heavier attention designs, while a flow-based dual-alignment fusion module additionally corrects the residual misregistration and side-looking parallax that bi-temporal pairs exhibit. Ding et al. [131] proposed DSA-Net with the crucial architectural variant of independent weights in the two encoder branches (pseudo-Siamese), allowing per-date appearance specialization. Wang et al. [132] proposed ADS-Net with multilevel attention-guided fusion and four-branch deep supervision.
Han et al. [124] introduced HANet with progressive foreground-balanced sampling (PFBS) to address extreme class imbalance (4.26–4.65% changed pixels in WHU-CD and LEVIR-CD). It combines hierarchical axial (row + column) attention with a hybrid weighted cross-entropy and Dice loss, using only 3.03 M parameters. Han et al. [126] introduced CGNet where a deep change guiding map derived from semantic features explicitly guides subsequent multiscale feature fusion through three change guiding modules (CGM), targeting broken edges and internal holes in change maps.
Lei et al. [121] proposed DESSN with difference enhancement (DE), spatial–spectral nonlocal (SSN), and asymmetric Ghost convolution modules. Lei et al. [119] introduced USSFC-Net, an ultralightweight pseudo-Siamese design using only 1.52M parameters and 4.86G FLOPs, with multiscale dilated convolution (MSDConv) multiscale extraction and spatial–spectral feature cooperation attention.
The HFA-Net architecture [125] introduced a high frequency attention block (HFAB) for building boundary detection, decomposing features into high- and low-frequency components, and applying attention selectively to the high-frequency component. The AERNet [133] paper simultaneously introduced the HRCUS-CD dataset of high-resolution urban change detection images, expanding benchmark diversity beyond Google Earth sources.
ADHR-CDNet [134] combined a high-resolution backbone with a differential pyramid module (DPM) and multiscale spatial feature attention module (MSSAM) for simultaneous multiscale feature extraction and small-object detection. Wang et al. [135] applied a deep Siamese network with hybrid convolutional feature extraction module (HCFEM) incorporating dilated multi-branch convolution to multi-sensor change detection, with object-based post-processing. Xu et al. [136] proposed a hybrid framework combining RF pixel-level classification with improved U-Net semantic segmentation.
The LightCDNet architecture [128] addressed efficiency through a lightweight design retaining competitive accuracy on VHR images. LSNET [127] proposed an extremely lightweight Siamese network, establishing the lightest competitive baseline for resource-constrained deployment. TINYCD [123] introduced the mix and attention mask block (MAMB) combining space–time domain feature mixing with multi-layer perceptron (MLP)-based semantic attention, achieving performance competitive with substantially larger architectures.
WRICNet [137] proposed a weighted rich-scale inception coder for multiscale feature extraction. ISNet [138] introduced margin maximization to improve semantic boundary separability in high-resolution images. Li et al. [139] proposed a lightweight architecture with progressive feature aggregation and supervised attention for efficient change detection. More recent attention-based methods continue to refine multiscale feature fusion. Ren et al. [140] introduced dual-attention-guided multiscale feature aggregation, combining spatial and channel attention at multiple encoder levels. Zhan et al. [141] proposed AMFNet, with attention-guided multiscale fusion for bi-temporal imagery. Jiang et al. [47] combined difference and attention mechanisms under multiscale feature fusion for high-resolution city change detection. Zhang et al. [122] introduced B2CNet, a progressive boundary-to-center refinement network that explicitly models change boundary localization before interior region filling.
The attention-augmented Siamese family established that the most productive architectural investment of this generation was the explicit difference-modeling pathway: difference-enhancement branches, change-guiding maps, and spatial-channel interaction modules [120,121,122,126]. A complementary lesson is that progress under extreme class imbalance is loss-bound rather than capacity-bound. Foreground-balanced sampling with Dice or weighted cross-entropy [118,124] outperforms most architectural refinements, and ultralightweight designs of one to two million parameters reach within one F 1 point of the heaviest models [119,123,127,128]. The structural limitation of the family is the receptive field. Attention here operates over the bounded receptive field of the convolutional backbone, so long-range and cross-temporal dependencies must be approximated through depth and skip connections. The CNN–Transformer hybrids discussed next remove this constraint by inserting explicit Transformer modules over tokens abstracted from convolutional features, where global self-attention is computationally tractable and cross-temporal context is modeled directly.

7.3. CNN–Transformer Hybrid Architectures

A hybrid architecture in this context combines convolutional and Transformer components within a single network, typically using a CNN backbone for local spatial feature extraction and Transformer modules, operating on tokens abstracted from the convolutional features, for global context and long-range dependency modeling. Chen et al. [142] established the bitemporal image Transformer (BIT) as a landmark hybrid architecture, using ResNet feature extraction followed by a compact Transformer for spatiotemporal context modeling. Wang et al. [143] proposed MTCNet combining ResNet18 with a spatial attention module, a four-scale Transformer, and a channel attention module. Song et al. [144] introduced ACABFNet with parallel CNN and Transformer branches connected via axial cross-attention, using early fusion (concatenated bi-temporal input).
The dual-branch multilevel intertemporal network [145] addresses unbalanced variations under seasonal turnover and illumination change through unified self-attention (within-date) and cross-attention (across dates) mechanisms. ChangeFormer [146] presented a hierarchical Transformer-based Siamese network with overlapping patch embedding for rich feature representation. ConvTransNet [147] addressed small changed area limitations in existing cascaded CNN–Transformer designs through a parallel ConvTrans block generating multiscale global–local features simultaneously. VcT [148] emphasized the role of unchanged background context information in change feature learning. The asymmetric cross-attention hierarchical network [149] introduced asymmetric multi cross attention (AMCA) bidirectional information exchange between CNN and Transformer components, reducing computational redundancy.
WNet [150] proposed a W-shaped hierarchical network for multiscale feature extraction in change detection. TransY-Net [151] introduced a fully Transformer network with Y-shaped design for comprehensive change detection. The triple change detection network [152] exploited joint multifrequency and full-scale Swin Transformer processing. MISGNet [153] introduced multilevel intertemporal semantic guidance for improved temporal correlation modeling.
ICIF-Net [154] introduced intra-scale cross-interaction at each encoder scale, enabling bidirectional temporal information flow at every resolution level. MSFF-CDNet [155] proposed multiscale feature fusion for bi-temporal high-resolution change detection. Chen et al. [156] proposed Siamese_AUNet combining atrous spatial pyramid pooling (ASPP) and feature attention module (FAM). MSTDSNet-CD [157] combined multiscale Swin Transformer with deep supervision, targeting urban LULC change in VHR images. Peng et al. [158] introduced SCDNet for semantic change detection with Siamese UNet, pretrained ResNet34, multi-attention context (MAC) modules, and three auxiliary classifiers. Sefrin et al. [159] applied FCN + ConvLSTM to 13-band Sentinel-2 data over Saxony, Germany, demonstrating that temporal sequence modeling improves land cover classification kappa by 3–5 percentage points versus monotemporal FCN. Yin et al. [160] applied U-Net-long short-term memory (LSTM) for lake boundary prediction from annual Google Earth imagery of Lake Urmia. The FTN [161] demonstrated a fully Transformer network for change detection. Chen et al. [162] presented FD-MCD for unsupervised multimodal change detection using Fourier-domain structural relationship analysis. Sublime and Kalinicheva [163] proposed an unsupervised deep learning pipeline for post-disaster mapping on ASTER Tohoku tsunami imagery, using joint convolutional autoencoder cross-reconstruction. Liu et al. [164] applied a CNN–Transformer network with multiscale context aggregation to fine-grained cropland change detection, demonstrating that Transformer-enhanced contextual reasoning improves discrimination of subtle agricultural transitions. Wang et al. [165] proposed a dual-branch network combining Transformer global modeling with CNN local feature extraction for complementary bi-temporal representation. Long et al. [166] addressed semantic change detection through a hierarchical semantic graph interaction network that models inter-class relationships from high-resolution imagery.
The essential difference between the CNN–Transformer hybrids of this subsection and the attention-augmented Siamese family of Section 7.2 lies not in the presence of attention but in the role attention plays in the bi-temporal feature interaction, and this distinction is more instructive than any per-method accuracy ranking. In the attention-augmented Siamese family, attention acts as a saliency gate: it reweights convolutional features by channel or spatial importance, applied either to each temporal image separately or to the already-fused bi-temporal representation, while the cross-temporal comparison itself is carried by a fixed algebraic operator, subtraction or concatenation, that attention only sharpens [142]. Cross-temporal information is therefore mediated by a predetermined difference operation and remains bounded by the convolutional receptive field. In the hybrid family, attention is instead the relational operator itself: self- and cross-attention compute content-adaptive relations among all tokens across both space and time, so the two dates are related in a learned shared token space rather than by a fixed subtraction [142,145]. A second axis of the same distinction is the locus of interaction. The Siamese-attention encoders run largely in parallel and defer inter-temporal interaction to a late fusion stage, whereas the hybrids inject it earlier and at multiple scales: BIT couples the two token sets in a Transformer encoder before differencing [142], DMINet applies a joint self/cross-attention block to the two streams before any difference is computed [145], and ICIF-Net exchanges local and global representations at every scale [154]. Between these poles sit hybridizing Siamese designs such as MetaChanger, which relocates interaction into the encoder through a parameter-free feature exchange rather than through attention [130], indicating that the productive variable is the placement and richness of the interaction, not the specific operator. The practical consequence is that the hybrid’s relational, early, multiscale interaction buys direct long-range cross-temporal modeling at quadratic cost, tokenization notwithstanding, whereas the Siamese-attention family retains boundary precision and linear cost but a comparatively shallow cross-temporal coupling; as the re-evaluated results of Section 9 show, this richer interaction does not translate into a decisive accuracy advantage at present benchmark scales.
The CNN–Transformer hybrid generation was motivated by a functional complementarity that neither parent paradigm provides alone. Convolutional backbones supply the locality bias and translation equivariance appropriate to bi-temporal spatial structure. Transformer modules, operating over tokens abstracted from high-level convolutional features, capture the long-range and cross-temporal dependencies that bounded receptive fields cannot [142,146,147]. The consistently re-evaluated results of Section 9 do not, however, show this complementarity converting into an accuracy advantage over the pure-Transformer alternative: BIT and ChangeFormer reach 82.53% and 80.65% F 1 on LEVIR-CD+ against 85.60% for SwinSUNet, with the same ordering on WHU-CD. The case for the hybrid on current benchmarks therefore rests on efficiency and on the smaller supervision budget implied by the convolutional prior, rather than on accuracy. Its principal cost is architectural complexity. The hybrid roughly doubles the design surface of either parent, making backbone configuration, token extraction, attention placement, and cross-attention bidirectionality all distinct hyperparameters. The pure-Transformer architectures of Section 7.4 represent the limiting case, in which the convolutional component is removed entirely and global self-attention is applied from the input patch onward.

7.4. Pure Transformer and Full-Scale Architectures

Zhang et al. [167] introduced SwinSUNet, the first pure Swin Transformer architecture for change detection, with hierarchical shifted-window self-attention providing global context. Zheng et al. [168] implemented ChangeMask for semantic change detection with two inductive biases (semantic-change causality and temporal symmetry), jointly predicting binary change maps and per-date semantic segmentation.
Zheng et al. [169] proposed ChangeOS for building damage assessment, a deep object-based semantic change detection framework that reconciles the semantic consistency of object-based analysis with the feature strength of Siamese fully convolutional networks: a deep object-localization network replaces superpixel segmentation to generate building objects, which are fused end-to-end with a damage-classification network and an object-based post-processing step so that each building receives a single internally consistent ordinal damage label, with cross-disaster generalization demonstrated from natural to man-made events on the xBD benchmark [46].
Lu et al. [170] proposed a bi-temporal attention Transformer that jointly addresses building change detection and building damage assessment within a unified architecture, extending the pure Transformer paradigm to multi-task change analysis.
The pure-Transformer family is the least populated architectural generation in this review, but the corpus does not support attributing this to weak performance. Under the consistent evaluation protocol of Section 9, SwinSUNet is the strongest non-SSM architecture on both LEVIR-CD+ (85.60% F 1 ) and WHU-CD (93.04%), ahead of every attention-augmented Siamese and hybrid method re-evaluated alongside it. This ordering is the reverse of the one suggested by cross-paper comparison of original-publication scores, and it illustrates the protocol effect discussed in Section 9. The caveat is that a single method represents the family in the re-evaluated set, so paradigm-level conclusions drawn from it are correspondingly weak. What can be said is that the absent convolutional inductive bias does not visibly cost accuracy at the annotation scale of current benchmarks and that the small size of the family more plausibly reflects the rapid absorption of attention into hybrid designs than any measured shortfall.
A separate constraint on the family is binding at scale and is not a matter of accuracy: the quadratic complexity of self-attention in the input length. This becomes prohibitive on the very-high-resolution and long-temporal-sequence workloads that operational change detection increasingly requires. The Mamba and state space architectures of Section 7.5 address this limitation directly, replacing quadratic attention with a selective state space mechanism whose scan complexity is linear in sequence length.

7.5. Mamba and State Space Model Architectures

Chen et al. [171] introduced ChangeMamba, applying the selective state space model (SSM) Mamba architecture to change detection. The linear O ( n ) computational complexity of SSM provides a fundamental advantage over the quadratic O ( n 2 ) complexity of Transformer self-attention. The VMamba encoder employs a cross-scan module (CSM) unfolding 2D patches into four directional 1D sequences, and three spatio-temporal relationship modeling mechanisms combine global Mamba representations with explicit bi-temporal comparison. Widely cited since its release, this work has brought state space models to prominence as a competitive architectural direction for change detection, though it has not yet displaced established paradigms on standard benchmarks.
ChangeMamba is one instance of a rapidly expanding body of state space work in remote sensing. A dedicated survey catalogs on the order of a hundred such studies and identifies bi-temporal change detection as one of its principal application axes [21]. That synthesis groups the mechanisms by which state space models are adapted to two-dimensional, multi-temporal data into three recurring choices. Interaction may be encoded directly in the SSM recurrence, through scan-strategy pre- and post-processing that interleaves the bi-temporal sequences around the one-dimensional unfolding or through gated mechanisms that inject the bi-temporal difference into the selective-scan activation. ChangeMamba’s cross-scan module and spatio-temporal relationship modeling occupy the scan-strategy and formula-level positions within this space, and subsequent methods extend the same principles to hybridizations with convolutional, Transformer, and diffusion backbones. The finding recurring across this literature is the one ChangeMamba exhibits alone here: state space interaction is an efficient alternative to attention-heavy fusion, with its advantage concentrated in computational cost rather than a decisive accuracy margin on current benchmarks.
The arrival of state space models in change detection is best understood as a computational rather than representational advance: the linear O ( n ) complexity of selective SSMs relative to the O ( n 2 ) cost of attention is the family’s genuine contribution, with the cross-scan module adapting an intrinsically one-dimensional sequence model to two-dimensional spatial data through directional unfolding [171]. The advantage does not at present translate into decisive accuracy on standard benchmarks. The computational advantage becomes decisive at the scales current benchmarks do not exercise: large image tiles, dense temporal stacks, and high operational throughput. State space models do not, however, address the binding annotation constraint that every fully supervised architecture in this section shares. Neither attention nor convolution has resolved this constraint either; the diffusion-based methods of Section 7.6 approach it from a different direction, exploiting the multi-timestep representations of a denoising network pretrained on unlabeled imagery as a substitute for a portion of the pixel-level supervision otherwise required.

7.6. Diffusion Model Approaches

A denoising diffusion probabilistic model (DDPM) is a generative model that learns to invert a fixed, gradual noise-corruption process, producing images by iteratively denoising pure Gaussian noise. Bandara et al. [172] pretrained a DDPM on large collections of unlabeled remote sensing images. They then extracted multi-timestep feature representations from the frozen denoising network and used them as inputs to a lightweight hierarchical change classifier. Features at early timesteps encode fine-grained spatial detail, while later timesteps provide semantic abstraction, constituting a multiscale feature pyramid learned without change annotations.
Beyond this representational use, a parallel line of work employs diffusion generatively, synthesizing the change map itself through conditional denoising rather than extracting features from a frozen network. GCD-DDPM generates the change map end-to-end from a difference-conditional encoder that injects multi-level bi-temporal difference features into the denoising process, refined across iterations by a noise-suppression semantic enhancer, and reports competitive accuracy on the standard LEVIR-CD, WHU-CD, and CDD benchmarks [173]. TransC-GD-CD couples the same conditional-generation principle with a frequency cross-Transformer that fuses the change condition with the diffusion noise [174]. Diffusion has since been further extended to hyperspectral change detection and to hybridizations with state space backbones, within a rapidly growing body of diffusion-for-remote-sensing research surveyed by Liu et al. [175].
The two routes differ sharply in inference cost, and this difference is the principal practical constraint on the paradigm. A generative diffusion detector produces its output by iterating the denoising network over many sampling steps, so both memory consumption and latency scale with the number of steps; the authors of GCD-DDPM note explicitly that this iterative inference is memory- and time-intensive and ill-suited to applications requiring a real-time response and propose non-Markovian sampling in fewer steps as a remedy [173]. The standard mitigations carry over from generative modeling at large, deterministic accelerated samplers such as DDIM, which reduce the number of denoising steps required at inference, and latent-space diffusion, which moves the process to a lower-dimensional space, but these trade sampling fidelity for speed and do not always transfer cleanly to other remote sensing modalities such as SAR [175]. The representational route of DDPM-CD largely sidesteps this cost, since it performs no iterative sampling at inference: the pretrained denoiser is run in a small number of single forward passes at selected timesteps to extract features, shifting the computational burden to a one-time unsupervised pretraining stage rather than to per-image inference [172]. This asymmetry, rather than accuracy, currently governs the operational applicability of diffusion-based change detection: the generative formulation is the more expressive but is for now largely confined to offline analysis, whereas the representational formulation runs at the cost of only a few network evaluations per image but forgoes end-to-end change-map generation.
Within the reviewed corpus, the diffusion paradigm enters change detection through a representational rather than generative doorway: the multi-timestep feature hierarchy of a pretrained denoising network supplies a multiscale representation learned from unlabeled imagery, with early timesteps encoding fine-grained spatial structure and later timesteps encoding semantic abstraction [172]. This addresses the annotation-scarcity bottleneck from a direction orthogonal to every supervised architecture preceding it in the section: the supervision budget is not relaxed in form but partially substituted, with a portion of the representation now learned from data that require no change annotation. The principle established by this generation is that annotation scarcity admits at least two independent remedies: substituting unsupervised pretext-task pretraining for part of the supervision budget and reducing the granularity of the supervision itself. The two are complementary rather than competing. The weakly supervised methods of Section 7.7 take up the second remedy directly, replacing pixel-level annotation with image-level binary labels and bridging the resulting localization gap through class-activation refinement and foundation-model integration.

7.7. Weakly Supervised Change Detection

Weakly supervised change detection (WSCD) operates under image-level binary annotation rather than pixel-level labels, providing a practically important middle ground between annotation-free unsupervised methods and annotation-intensive fully supervised training. Flagged as a key emerging research direction by Khelifi and Mignotte [3], the paradigm has since matured into an established subfield: nine WSCD papers were identified in the reviewed corpus.
Andermatt and Timofte [176] introduced the foundational WSCD framework using a weakly supervised convolutional network for change segmentation and classification from image-level labels. Wang et al. [177] developed CS-WSCDNet integrating class activation mapping (CAM) with the segment anything model (SAM) [178] for zero-shot pseudo-label refinement, demonstrating that foundation model integration substantially improves weakly supervised pseudo-label boundary quality. Zhao et al. [179] addressed the instance-lumping failure mode via Plug-and-Play DISep: a three-step iterative procedure of high-pass CAM localization, connectivity-based instance retrieval, and intra-instance separation loss to better delineate individual changed objects. Zhao et al. [180] identified change-missing and change-fabricating as two distinct WSCD failure modes, addressing them via dilated-prior decoders and label-gated constraints.
Lu et al. [181] framed WSCD as knowledge distillation from a Siamese teacher to a student network, with multiscale sigmoid inference (MSI) post-processing refinement. Li et al. [182] introduced MS-Former exploiting patch-level labels through a memory-supported Transformer with bidirectional attention block (BAB) for prototype-based temporal difference enhancement. Wu et al. [183] presented a unified framework accommodating unsupervised, weakly supervised, regional supervised, and fully supervised change detection within a single GAN-based architecture. Liu et al. [184] proposed SSCMNet combining multiscale self-supervised constraints and change-mask guidance. Liu et al. [185] introduced ACWCD exploiting inherent Transformer attention maps via attention refinement (AR) and a change prior (CP) constraint. You et al. [186] proposed Rcnet using reliable co-training between two networks with different initialization. Zhao et al. [187] introduced TransWCD, a scene-adaptive joint constrained framework operating under image-level supervision. A complementary route to label efficiency dispenses with paired bi-temporal annotation altogether. Zheng et al. [188] introduced single-temporal supervised learning, training a detector from unpaired single-date semantic-segmentation labels: object differences between arbitrary same-batch images serve as the change signal, regularized with a temporal-symmetry inductive bias. The accompanying ChangeStar model realizes this through a ChangeMixin module, which converts any off-the-shelf segmentation backbone into a change detector.
The weakly supervised corpus is distinguished by the nature of its justification: the paradigm is motivated by deployment economics rather than by research-benchmark performance. The productive technical pattern is the generation of pseudo-pixel-labels from image-level annotations through class activation maps, followed by a spatial-coherence refinement step that recent foundation-model integration [177,178] substantially improves; Section 7.8 treats this pattern in its own right. The two failure modes named explicitly in the literature [180], change-missing and change-fabricating, frame the design space of the family as a dual constraint on pseudo-label completeness and tightness. The performance gap to fully supervised models is closing but remains material. Peng et al. [15] reach a compatible conclusion in a review dedicated to label-efficient change detection, organizing the semi-supervised, weakly supervised, and self-supervised families as complementary responses to a single annotation constraint. The rational interpretation is not that weak supervision substitutes for pixel-level labels where they exist but that it is the correct default for any deployment in which they would otherwise have to be produced ex novo. A separate question, set aside throughout the deep learning section, is whether any of these architectures transfer to sensor modalities for which the implicit optical MS input assumption no longer holds; Section 8 takes up this question directly, reviewing the methodological adjustments that synthetic aperture radar, HS, and heterogeneous multi-modal change detection require.

7.8. Foundation Model Approaches

The SAM-based pseudo-label refinement of Section 7.7 is one instance of a broader pattern: the use of a model pretrained outside the change detection task as an exogenous prior substituting for annotation the task would otherwise require. This pattern has developed rapidly enough to warrant a dedicated survey [14], which organizes the emerging literature by data modality and by the position at which foundation-model features are injected into the network. Two families of pretrained model are relevant here, and they enter change detection by different routes. General-purpose vision foundation models, trained on natural imagery, supply class-agnostic spatial priors; geospatial foundation models (GFMs), pretrained on large collections of unlabeled satellite imagery and supply domain-appropriate spectral and temporal representations.
The first route is exemplified by the promptable segmentation of SAM [178], which Wang et al. [177] employ for zero-shot refinement of CAM-derived pseudo-labels, and by adapter-based side-tuning. Li et al. [189] propose the bi-temporal adapter network (BAN), which holds a foundation model such as CLIP frozen and injects its general features into an arbitrary bi-temporal change detection backbone through lightweight bridging modules. The design is deliberately model-agnostic: the adapted branch may be any existing change detection architecture, and the reported gains of up to 4.08% IoU are obtained with only a small number of additional learnable parameters. This is a materially different proposition from the architectural families of Section 7.1, Section 7.2, Section 7.3, Section 7.4 and Section 7.5, which improve accuracy by redesigning the backbone; side-tuning instead treats the backbone as fixed and imports capability from outside the task.
The second route rests on models whose pretext tasks are constructed around precisely the structure change detection depends upon. SatMAE [190] extends masked autoencoding to satellite data through a temporal embedding with independent masking across acquisition dates and through spectral band grouping with distinct positional encodings so that temporal and multi-spectral structure is represented explicitly rather than collapsed into RGB channels. Prithvi [191] applies a temporal vision Transformer to more than one terabyte of harmonized Landsat–Sentinel-2 imagery over six spectral bands, yielding a backbone whose pretraining distribution matches the operational sensors from which change detection inputs are drawn. Within change detection, this route has so far been instantiated in the unsupervised rather than the weakly supervised branch: Leonardi et al. [192] incorporate the SSL4EO DINO GFM as a feature extractor into a metric-learning unsupervised detector for landslide identification, evaluated on a purpose-built global dataset of 174 bi-temporal Sentinel-2 pairs. Their results are instructive precisely because they are mixed: the GFM-based detector ( F 1 31.68%) substantially outperforms fully automatic differential thresholding over the full spectral range (19.33%) and an RGB-based reconstruction-loss method (19.66%), yet is itself outperformed by domain-guided single-band thresholding (48.41%). Geospatial pretraining is thus demonstrably informative in the annotation-free regime but does not yet displace task-specific spectral knowledge.
The combination the corpus does not contain is the direct one: image-level weak supervision paired with a geospatial foundation model backbone. The two routes are complementary in principle, since side-tuning supplies the adaptation mechanism while geospatial pretraining supplies a domain-appropriate representation to adapt, and both act on the annotation bottleneck rather than on architectural capacity. The absence of this combination is consistent with the timing of the relevant model releases rather than with evidence against it, and we identify it in Section 10.5 as the most concrete near-term opportunity of the supervision-efficiency family, alongside the diffusion-based pretraining of Section 7.6 with which it shares an objective.

8. Change Detection in Other Sensor Modalities

Change detection in non-optical and multi-modal data has been surveyed comprehensively, organized by data type, by Shafique et al. [9]. More recent surveys treat multisource change detection [18] and deep multi-modal fusion [19] specifically. This section summarizes representative methods in each modality.

8.1. SAR

Gong et al. [193] combined wavelet-based fusion of log-ratio and mean-ratio difference images with RFLICM clustering, incorporating a local coefficient of variation model for speckle noise. The deep learning extension [194] applied deep belief networks for unsupervised feature pretraining. Later deep methods confront the speckle and labeled-data obstacles more directly. PCANet-based detection learns representative neighborhood features through PCA convolutional filters, with Gabor-wavelet and fuzzy-c-means pre-classification, yielding change maps robust to speckle [195]. To circumvent the scarcity of labeled SAR data, Saha et al. [196] train a cycle-consistent GAN that transcodes very-high-resolution SAR into the optical domain and reuse the transcoder as a bi-temporal feature extractor feeding deep change vector analysis for unsupervised building change detection. This deep, largely unsupervised turn typifies the recent SAR change detection literature.

8.2. Hyperspectral

HS change detection exploits the fine spectral sampling of HS sensors to resolve subtle, material-level changes that the coarser bands of MS imagery cannot capture. Liu et al. [197], in a dedicated review, organized the field by application purpose, anomalous, binary, multiclass, and time-series change detection, crossed with the level of supervision, and identified anomalous change detection, the unsupervised flagging of rare spectral departures, as the problem most distinctive to the HS setting. A more recent dedicated survey organizes hyperspectral change detection around pseudo-invariant feature extraction and change-magnitude metric design [20]. IR-MAD [30] provides the standard classical baseline. GETNET [64] established the deep learning baseline through 2D CNN processing of mixed-affinity matrices. MSDFFN [65] achieves state-of-the-art through multiscale difference feature representation.

8.3. Heterogeneous Multi-Modal

Heterogeneous-data change detection, in which the two acquisitions occupy different feature spaces and pixel-wise comparison is no longer meaningful, has become a particularly active branch and was systematized as a distinct AI framework by Shi et al. [7]. Two broad unsupervised strategies have emerged. The first brings the modalities into a common domain by learning a transformation between them. Luppino et al. [198] derive an affinity-matrix change prior to flag likely-unchanged pixels and use them as pseudo-training data for image regression that maps each image into the other’s domain. Luppino et al. [199] deepen this into two image-translation networks, an X-Net of fully convolutional branches and an adversarial cyclic encoder (ACE-Net), whose losses are weighted by the same affinity-based prior so that changed pixels do not corrupt the learned translation. SCCN [200] and the code-aligned autoencoders of Luppino et al. [201] realize the shared-space idea at the level of latent codes, the latter aligning two modality-specific autoencoders through an affinity-based domain-adaptation loss so that change is measured in a common code space without labels. The second strategy compares modality-invariant structure rather than translating appearance. Sun et al. [202] represent each image by a robust K-nearest-neighbor graph of self-similarity and map the graphs across domains to form forward and backward difference images, fused in an iterative Markovian co-segmentation that feeds detected changes back to refine the graph. FD-MCD [162] compares structure through a modality-agnostic Fourier-domain representation of SAR–optical pairs.

8.4. 3D and LiDAR

Three-dimensional change detection augments the spectral signal with height or full geometric information from LiDAR, photogrammetric point clouds, and digital surface models. Qin et al. [203], in a foundational review, organized the field into two families, purely geometric comparison and combined geometric–spectral analysis that fuses elevation change with radiometric evidence, and argued that the additional dimension moves change detection beyond top-view pixel- and object-based reasoning toward oblique- and voxel-based geometric analysis. Girardeau-Montaut et al. [204] established cloud-to-cloud (C2C) and cloud-to-mesh (C2M) distance comparison paradigms. Stilla and Xu [205] review 3D change detection across five urban application domains. Siamese KPConv [206] operates on raw point clouds achieving up to 80% mIoU on multi-class urban change detection, with pretraining on simulated data reducing annotation requirements by over 3000×.

9. Quantitative Benchmark Comparison

Table 3, Table 4, Table 5, Table 6, Table 7 and Table 8 present quantitative performance comparisons on LEVIR-CD, WHU-CD, CDD, SYSU-CD, S2Looking, and GZ-CD. Figure 7 traces the LEVIR-CD+ performance trajectory by architectural paradigm.
Throughout, the Source column records the provenance of each score: OP denotes a value reported in the original publication of the method, and RE denotes a value obtained by a subsequent study that re-evaluated the method, with the re-evaluating study cited. Wherever a single study re-evaluated multiple methods under one protocol, we report that study in preference to scores collected across publications, so that the values within a table are mutually comparable. This was achievable for LEVIR-CD+ and WHU-CD, both of which are reported entirely from Chen et al. [171]; indeed, no method in Table 3 other than MambaBCD is evaluated on LEVIR-CD+ by its own authors, so no alternative source exists for that benchmark. For CDD, no comparable multi-method re-evaluation was available, and Table 5 therefore aggregates scores of mixed provenance; this is recorded per row and limits that table to an indicative reading.
Table 3 is accordingly divided into two blocks. The upper block reports the methods re-evaluated by Chen et al. [171] on LEVIR-CD+ under a single training and evaluation protocol; these rows are directly comparable with one another, and best values are marked in bold. The lower block reports original-publication scores on LEVIR-CD, which uses a different image partitioning and a different test set; these rows are not comparable with the upper block, nor necessarily with each other, and are included solely to document methods for which no consistent re-evaluation is available. HANet and CGNet appear in both blocks, at their re-evaluated and original-publication values, respectively, which makes the magnitude of the protocol effect directly visible: the same method differs by 12.7 and 8.3 F 1 points between the two settings. This gap exceeds the spread between most architectural families and is the principal reason why cross-paper numerical comparison in change detection is unreliable, as already noted in Section 2.
Read under the consistent LEVIR-CD+ protocol of the upper block of Table 3, the corpus exhibits a broadly monotone architectural progression: fully convolutional baselines achieve F 1 ≈ 70–78%; attention-augmented CNN Siamese methods reach 74–84%; CNN–Transformer hybrids attain 80–83%; the pure Swin Transformer reaches 85.60%; and the Mamba state space models span 83.61–88.39%. Table 4, drawn from the same re-evaluation, reproduces this ordering with absolute values 5–10 points higher, indicating that the ordering is a property of the architectures rather than of a single benchmark. The fusion DSIFN (84.07%) nonetheless remains competitive with several Siamese middle-fusion architectures, showing that the fusion strategy alone does not determine performance, and the margins separating the leading methods within each family are small relative to the spread introduced by evaluation protocol, consistent with the saturation observed in Section 10.
The comparison between the two blocks of Table 3 is itself instructive, and warrants caution when reading the many cross-paper comparisons in the change detection literature. The original-publication scores in the lower block cluster tightly between 90 and 92% F 1 , some 7–13 points above the re-evaluated scores of the same architectural families, and they invert the ordering. CGNet and HANet report 92.01 and 90.28 on LEVIR-CD, which would place them above the pure Transformer SwinSUNet at 85.60. Under the consistent LEVIR-CD+ protocol, however, the same two methods obtain 83.68 and 77.56 and fall below it. The apparent advantage of attention-augmented CNN Siamese designs over pure Transformer architectures, which is frequently asserted on the basis of such cross-paper tabulations, is therefore not supported once evaluation protocol is held fixed. We report both blocks rather than the re-evaluated block alone precisely so that this effect is visible, and we caution that any ranking assembled from scores taken across publications, including rankings appearing in earlier surveys, is likely to reflect protocol heterogeneity at least as strongly as architectural merit.
The three additional benchmarks qualify the picture drawn from LEVIR-CD+ and WHU-CD. SYSU-CD (Table 6) preserves the paradigm ordering but compresses it: the spread between the weakest and strongest methods narrows to roughly ten F 1 points against eighteen on LEVIR-CD+, and the leading CNN Siamese and CNN–Transformer designs sit within two points of the pure Transformer. GZ-CD (Table 8) retains a spread comparable to LEVIR-CD+, at roughly sixteen points, with the CNN–Transformer ICIF-Net ahead of every convolutional design. S2Looking (Table 7) is the informative outlier: the best method evaluated under a common protocol reaches only 64.33% F 1 , more than twenty points below the corresponding figure on LEVIR-CD+, and the weakest methods fall below 27%. The saturation reported in Section 10 is therefore a property of the established benchmarks rather than of the change detection problem, and the margin available on a deliberately harder benchmark remains substantial.

10. Open Issues and Research Directions

The preceding sections have traced the methodological arc of change detection in remote sensing from the algebraic operators of the pre-AI era through the ensemble and kernel-based classifiers of the machine learning period and into the successive architectural generations of the deep learning era. The synthesis paragraphs distributed across those sections have identified the productive innovations, the persistent failure modes, and the design principles that survive each generation. This section integrates those observations into a coherent account of the field’s current position and likely trajectory. It is organized around six substantive subsections: the cross-cutting observations that emerge only at the corpus level; the data-related constraints that bound the practical impact of the field; the methodological limitations that affect the interpretability of reported results; the supervision-cost frontier that unifies several apparently distinct research directions; the promising technical opportunities that have sufficient empirical support to warrant prioritization; and a compact practitioner’s decision guide summarizing the operational implications of the preceding five subsections.

10.1. Cross-Cutting Observations from the Corpus

Five observations about the change detection literature become visible only at the corpus level and have, to the present authors’ knowledge, not previously been articulated in a single survey context.

10.1.1. Observation 1: Architectural Saturation on Current Benchmarks

The performance trajectory on LEVIR-CD+, traced in Figure 7 and analyzed in Section 9, spans approximately 18 percentage points of F 1 score between the 2018 FCN baseline and the current state of the art. The trajectory, however, is not uniformly distributed across this interval: the first improvements were seen 2018 and 2021 through the introduction of attention-augmented Siamese architectures, while the subsequent points have been recovered across three full architectural generations (CNN–Transformer hybrids, pure Transformers, and state space models) without a single generation establishing a decisive advantage over its predecessor. The empirical pattern is compatible with the hypothesis, supported by the parameter-efficiency evidence adduced in Section 7.2, that the remaining performance gap on moderate-resolution benchmarks is dominated by data quality, label imbalance, and evaluation-protocol heterogeneity rather than by the expressive capacity of the architecture. The practical implication is that continued architectural refinement against the existing benchmark set is unlikely to produce benchmark-level improvements commensurate with the research effort required.

10.1.2. Observation 2: The Two-Axis Character of the Change Detection Problem

The change detection problem presents two distinct axes of variation: a semantic axis of interest, comprising the genuine surface changes the method is required to identify, and a nuisance axis of confounding factors, comprising radiometric drift, atmospheric variability, phenological cycling, illumination differences, and co-registration error. The corpus evidence reviewed in Section 5 and Section 6 supports the conclusion that methodologically successful families address both axes rather than either one in isolation. The deep learning literature, by comparison, has frequently relied on the assumption that a sufficiently expressive feature extractor will learn the required invariance from data, an assumption that becomes increasingly strained as the scale of available annotated training data is exceeded by the scale of deployment variation. The productive pipeline pattern that emerges from the classical literature, in which explicit radiometric and phenological normalization is applied upstream of the classifier rather than expected of it, is underdeveloped in contemporary deep learning practice.

10.1.3. Observation 3: Diminishing Returns of Representational Capacity Relative to Annotation Quality

The weakly supervised, self-supervised, and diffusion-based subsections of Section 7 converge on a single conclusion from three methodologically distinct directions: the binding constraint on change detection performance in the current regime is the cost and coverage of pixel-level annotation rather than the expressive capacity of the model. This observation is consistent with the architectural-saturation evidence of Observation 1 and with the corpus-level distribution of research effort, in which the weakly supervised sub-corpus has grown from negligible to more than 11 % of the deep learning corpus within the five-year window covered by this review. The quantitative economics of annotation reinforce this. Semi-supervised methods reach accuracy competitive with full supervision while labeling only 5–10% of the pixels used by their fully supervised counterparts, and self-supervised pretraining reduces the labeled fraction required for fine-tuning to on the order of 1% [12]. Adapter-based side-tuning, in turn, imports foundation-model capability for gains of up to 4.08% IoU with only a small number of additional trainable parameters [189]. That comparable accuracy is recoverable from a small fraction of the annotation, whereas an order-of-magnitude increase in parameter count is not, is the quantitative core of the claim that annotation, not capacity, is the binding constraint.

10.1.4. Observation 4: The Bi-Temporal Formulation Is a Modeling Choice, Not a Property of the Problem

The dominant bi-temporal pair formulation inherited from Equation (1) and employed by the vast majority of deep learning methods reviewed in Section 7 is a simplification of the underlying monitoring problem rather than a faithful representation of it. Operational satellite monitoring increasingly provides dense, irregularly sampled, multi-year time series, and the quantity of interest is often a temporally localized event within such a series rather than a difference between two specifically selected acquisitions. The classical time-series decomposition and hybrid temporal methods reviewed in Section 5.2 and Section 6.4 address this formulation natively, while the deep learning literature addresses it as a specialized subcase through recurrent and convolutional-recurrent architectures that have not achieved the benchmark-level prominence of their bi-temporal counterparts. The asymmetry reflects the availability of bi-temporal benchmarks rather than the relative importance of the two formulations in operational deployment.

10.1.5. Observation 5: Geographic and Thematic Concentration of Evaluation Evidence

The three dominant benchmarks that underpin the quantitative comparisons of Section 9 collectively over-represent building change in East Asian and North American urban contexts. The broader corpus of land use and land cover studies reviewed in Section 5.4 spans South Asian, African, Middle Eastern, Central Asian, and Southeast Asian geographies with ecological and sensor conditions substantially distinct from those of the deep learning benchmark set. The implication is that performance figures reported on the three primary benchmarks constitute evidence about a narrow slice of the operational deployment space and that claims of field-wide progress grounded in benchmark improvements are subject to a domain-generalization caveat that the current literature does not systematically address.

10.2. Data-Related Challenges

10.2.1. Absence of a Universal Benchmark

The three dominant benchmarks disproportionately represent building change in East Asian and North American urban contexts. The diverse geographic and ecological coverage of the statistical land use and land cover papers reviewed in Section 5 and Section 6 demonstrates the breadth of scenarios that a genuinely universal benchmark would need to accommodate. Such a benchmark would require, at minimum, diverse geographic regions and ecosystems; multiple sensor modalities and spatial resolutions; multiple change-type categories including building, forest, agricultural, wetland, and disaster-induced change; and multi-temporal sequences rather than isolated bi-temporal pairs. No existing benchmark satisfies more than two of these four requirements simultaneously.

10.2.2. Class Imbalance

Changed pixels comprise approximately four to five percent of the most widely used benchmarks. A minority of the reviewed papers address this explicitly through foreground-balanced sampling or imbalance-aware loss functions; the majority apply focal loss or weighted cross-entropy without systematic ablation of the imbalance-mitigation strategy. The synthesis of Section 7.2 established that the quantitative impact of the imbalance-mitigation choice is comparable in magnitude to that of the architectural choice, suggesting that the systematic under-reporting of this component in comparative evaluations confounds interpretation of architectural contributions.

10.2.3. Dataset Opacity

A substantial number of the reviewed papers employ custom, unreleased datasets for their primary evaluation. While such datasets are frequently scientifically motivated by the limitations of public benchmarks identified above, their unreleased status prevents replication, independent comparative evaluation, and cumulative methodological progress.

10.2.4. Annotation Heterogeneity Across Granularities

The bi-temporal binary annotation convention that dominates the deep learning benchmark set does not admit direct comparison with the semantic change detection benchmarks of Section 4 or with the time-series change-point annotations implicit in the classical literature of Section 5. The resulting fragmentation of the evaluation landscape precludes the cross-family performance comparisons that would be necessary to assess, for example, the relative performance of a bi-temporal deep learning method and a time-series decomposition method on a shared monitoring problem.

10.3. Methodological Limitations

10.3.1. Benchmarking Inconsistency

Different papers reporting on the same nominal dataset differ in train–test split strategy, patch extraction parameters, and data augmentation configuration, with the consequence that the numerical results in Table 3, Table 4 and Table 5 constitute approximate rather than exact cross-paper comparisons. The absence of a standardized reporting protocol, including at minimum the specification of split indices, patch coordinates, and augmentation hyperparameters, is a structural impediment to the interpretability of reported performance differentials, particularly in the regime of architectural saturation identified in Section 10.1.

10.3.2. Computational Cost Asymmetry

Transformer and state space model architectures impose substantial training and inference costs relative to the attention-augmented convolutional alternatives reviewed in Section 7.2. The parameter-efficiency evidence established in that section, together with the architectural-saturation evidence of Section 10.1, indicates that the computational cost of the heavier architectures is not recovered in benchmark accuracy at the moderate image scales characteristic of the current benchmark set. The computational advantages of the linear-complexity state space paradigm are structurally invisible at such scales, as discussed in the synthesis paragraph of Section 7.5, and become decisive only at the large-tile and long-sequence regimes that current benchmarks do not exercise.
Table 9 quantifies this asymmetry. Across the LEVIR-CD+ architectures, parameter count ranges over roughly a factor of sixty (1.35–84.70M) and computational cost over a factor of about twenty-five in GFLOPs, yet F 1 spans only some eighteen points and rises monotonically with neither. SwinSUNet reaches 85.60% F 1 at 43.50 GFLOPs, exceeding both CGNet (83.68%, 329.58 GFLOPs) and DSIFN (84.07%, 329.03 GFLOPs) at roughly one-seventh of their computational cost, while the 2.61M-parameter HANet trails the far larger DSIFN and CGNet by only about six F 1 points despite an order-of-magnitude difference in parameter count.

10.3.3. Multi-Temporal Generalization

The bi-temporal pair formulation dominates the deep learning literature, with the consequence that the methods best suited to operational dense-time-series monitoring are drawn disproportionately from the classical and hybrid literature reviewed in Section 6.4. The architectural extensions required to support arbitrary-length multi-temporal input in the deep learning paradigm are available in principle through recurrent, convolutional-recurrent, and sequence-model architectures but have not achieved the benchmark-level prominence of their bi-temporal counterparts, as documented in Observation 4 of Section 10.1.

10.3.4. Underdevelopment of Uncertainty Quantification

The posterior-uncertainty argument established in the Section 5.3 synthesis identifies a capacity that classical probabilistic methods provide natively and that the deep learning literature has underdeveloped. Operational deployment of change detection systems in which a subset of high-uncertainty predictions is routed to human verification while the remainder is accepted automatically requires calibrated posterior estimates; the deep learning literature addresses this requirement, where it addresses it at all, through Monte Carlo dropout, deep ensembling, and conformal prediction methods that remain substantially less developed in the change detection subfield than in adjacent computer vision subfields.

10.4. The Supervision-Cost Frontier

The weakly supervised, semi-supervised, self-supervised, and foundation-model-based research directions are frequently presented as methodologically independent but are more productively understood as distinct approaches to a shared problem: the reduction of the per deployment cost of pixel-level supervision. The corpus evidence reviewed in supports the identification of four independent reduction strategies, each addressing the supervision-cost bottleneck from a different direction.

10.4.1. Reduction of Supervision Granularity

The weakly supervised paradigm reviewed in the Section 7.7 synthesis addresses the supervision-cost bottleneck by substituting image-level for pixel-level annotation, with class activation map refinement and foundation segmentation model integration providing the mechanisms by which coarse labels are converted to pixel-level training signal. The performance gap to full supervision is closing but remains material; the rational interpretation established in that section is that weak supervision is the correct default choice for any deployment in which pixel-level labels would have to be produced de novo for a new domain.
Concrete instances in the corpus include CS-WSCDNet, which refines class-activation pseudo-labels with the segment anything model [177]; the effective-prior decoders of Zhao et al. [180], designed to counter the change-missing and change-fabricating failure modes; and TransWCD, a scene-adaptive framework operating under image-level supervision [187].

10.4.2. Substitution of Unlabeled Data for Labeled Data

The self-supervised and diffusion-based directions reviewed in Section 7 address the bottleneck by extracting representational capacity from unlabeled imagery through pretext tasks that do not require change annotation. The contribution of the diffusion paradigm, as established in the Section 7.6 synthesis, is specifically representational rather than generative: the multi-timestep feature hierarchy of a pretrained denoising network provides a multiscale representation learned from unlabeled remote sensing imagery, directly substituting for a portion of the supervision budget that would otherwise be required of a fully supervised training procedure.
Concrete instances include DDPM-CD, which extracts a multi-timestep feature hierarchy from a denoising diffusion model pretrained on unlabeled imagery [172]; the multiscale self-supervised constraints of SSCMNet [184]; and on the generative side, GCD-DDPM [173].

10.4.3. Transfer from Foundation Model Pretraining

Geospatial foundation models pretrained on harmonized multi-sensor imagery collections at scales substantially exceeding those of any single change detection benchmark offer domain-appropriate pretraining that addresses the annotation bottleneck through transfer. The pure-Transformer synthesis of the Section 7.4 subsection identified foundation-model pretraining as the exogenous resource on which the viability of the inductive-bias-free attention family is conditional, and the diffusion-based synthesis of Section 7.6 identified the combination of foundation-model pretraining with diffusion-based representation learning as a near-term research opportunity.The convergence of these routes on a common constraint is itself the organizing observation of Peng et al. [15].
Concrete instances include the bi-temporal adapter network BAN, which side-tunes a frozen foundation model for gains of up to 4.08% IoU [189]; the satellite masked autoencoder SatMAE [190] and the Prithvi geospatial backbone [191]; and the SSL4EO-pretrained DINO detector of Leonardi et al. [192].

10.4.4. Propagation of Labels Through Spatial and Temporal Structure

Semi-supervised methods exploiting the spatial and temporal coherence of remote sensing imagery to propagate a small labeled subset over a larger unlabeled corpus constitute the fourth reduction strategy, addressed partially by the generative adversarial and consistency-regularization methods reviewed in Section 7. The integration of this strategy with the preceding three, particularly in the form of foundation-model feature spaces within which spatial-temporal label propagation operates, is a combinatorial research opportunity that the current literature has not systematically explored.
Concrete instances include SemiCDNet, which propagates a small labeled subset through adversarial regularization that aligns predictions on labeled and unlabeled images [45]; the semi-supervised binary change detection framework of Hou et al. [89]; and the unified GAN of Wu et al. [183], which spans the unsupervised-to-fully-supervised range within a single architecture.
The four strategies are complementary rather than competing. The combinatorial space of their integrations substantially exceeds the coverage of the current literature, and we regard it as one of the most substantial underexplored research opportunities in the change detection subfield.

10.5. Promising Research Directions

The observations assembled in the preceding four subsections support the identification of five research directions as particularly promising on grounds of both empirical support and potential impact.

10.5.1. Foundation Model Integration

The integration of geospatial foundation models with change detection architectures, addressed partially through segment anything model integration in weakly supervised pseudo-label refinement, through diffusion-based representation learning, and through the adapter-based side-tuning and geospatial pretraining reviewed in Section 7.8, offers a pathway to annotation efficiency that the corpus evidence supports as material. Foundation models pretrained on harmonized multi-sensor collections at scales of millions of image-years provide the domain-appropriate pretraining that the pure-Transformer and data-hungry architectural families require to reach their representational potential and that the annotation-constrained deployment settings characteristic of operational change detection require to remain tractable.

10.5.2. Large Multimodal and Language-Interfaced Models

The direction above treats large pretrained models as feature extractors that reduce annotation cost. A distinct and, within the corpus, essentially unexplored prospect is their use as the interface and reasoning layer of change detection. Three roles are anticipated. First, open-vocabulary, text-promptable detection would let a user specify the change of interest in natural language, directly operationalizing the application-dependent boundary between relevant, irrelevant, and apparent change noted in Section 2 [11], so that one model can be queried for different change types without retraining. Second, change captioning and change-oriented visual question answering would move the output beyond a binary mask toward the interpretable, from–to descriptions and report-style summaries that operational users require. Third, large language models could act as a reasoning layer over detector outputs, fusing them with auxiliary geospatial context for triage and automated reporting. These prospects remain anticipated rather than demonstrated. The corpus contains no dedicated multimodal change benchmark, current vision–language models exhibit limited spatial grounding and a propensity to hallucinate, and the inference-cost and latency burden analyzed in Section 10.3 are most acute for the largest models, whose real-time deployment in operational monitoring is correspondingly constrained. The role of large models in change detection is therefore best read as a high-potential frontier whose realization is gated by benchmarking and efficiency advances rather than by model capability alone.

10.5.3. Uncertainty Quantification for Operational Triage

The posterior-uncertainty argument developed in Section 5.3 identifies a capacity that is operationally valuable and methodologically underdeveloped in the deep learning change detection literature. The research direction is particularly well-aligned with the deployment pattern, common in operational monitoring, in which a small budget of human verification effort is allocated to the predictions most likely to be in error. Bayesian deep learning, conformal prediction, Monte Carlo dropout, and deep ensembling methods adapted to the bi-temporal change detection formulation constitute a focused research program of clear operational value.

10.5.4. Multi-Modal and Heterogeneous Fusion

The Fourier-domain structural comparison methods reviewed in Section 8 demonstrate the feasibility of modality-agnostic structural comparison across synthetic aperture radar and optical image pairs in the unsupervised setting. The gap to same-sensor performance under supervised learning remains substantial, but the theoretical feasibility of modality-agnostic comparison is established, and the practical importance of heterogeneous fusion for applications in which a single sensor modality cannot provide sufficient coverage, cloud-affected optical monitoring supplemented by synthetic aperture radar, or multi-resolution harmonization across sensor generations, is direct.

10.5.5. Multi-Temporal Native Architectures

The bi-temporal formulation limitation identified in Observation 4 of Section 10.1 motivates the development of deep architectures natively supporting arbitrary-length multi-temporal input, with outputs indexing the temporal location of detected change within the input sequence rather than the presence of change between two fixed dates. The computational efficiency of the state space model paradigm, established in the Section 7.5 synthesis, is structurally well-matched to the long-sequence requirements of this research direction, and the convergence of the two methodological threads is a near-term research opportunity supported by the linear-complexity arithmetic of the state space family.

10.6. Practitioner’s Decision Guide

The preceding five subsections have characterized the state of the change detection literature in terms intended to support methodological research. The present subsection inverts the perspective, providing a compact decision guide for practitioners selecting a methodological approach for a specific deployment. The guidance is organized around the binding constraints identified at the corpus level in Section 10.1 and draws upon the design principles established in the synthesis paragraphs distributed throughout Section 5, Section 6 and Section 7. No specific methods or architectures are recommended; the guidance is expressed at the level of the architectural principles and pipeline patterns that the corpus evidence supports.

10.6.1. Sample-Size Regime

For deployments in which labeled training pixels number in the hundreds to low thousands, the sample-complexity profile of end-to-end deep architectures trained from scratch is structurally unfavorable; the corpus evidence supports the tree-ensemble family as the rational default choice in this regime, with the feature-engineered pipeline pattern reviewed in Section 6 providing the operational scaffolding. The binding upstream question is not the choice of classifier family but the sufficiency of the engineered feature representation; the allocation of domain-expert effort is more productively directed at this question than at classifier selection.

10.6.2. Annotation-Cost Regime

For deployments in which pixel-level labels would have to be produced ex novo for a new geographic or sensor domain, the weakly supervised paradigm established in the Section 7.7 synthesis is the correct default. The productive architectural pattern combines image-level supervision with pseudo-label refinement through a foundation segmentation model, with the performance gap to full supervision narrowing as foundation-model pseudo-label refinement matures.

10.6.3. Class-Imbalance Regime

For deployments in which the changed class comprises a small fraction of the image, the dominant case in operational monitoring, the evidence established in the Section 7.2 synthesis supports the allocation of design effort to the imbalance-mitigation component of the training procedure rather than to the architectural choice. Foreground-balanced sampling combined with a dual-term pixel-and-region loss is the pipeline pattern with the strongest empirical support in this regime, with the specific architectural choice of second-order importance.

10.6.4. Radiometric-Variability Regime

For deployments in which the acquisition conditions of the bi-temporal or multi-temporal image stack vary substantially, across seasons, sensor generations, or atmospheric conditions, the two-axis framing established in Observation 2 of Section 10.1 supports a pipeline pattern in which explicit radiometric and phenological normalization is applied upstream of the classifier rather than expected of it. The normalization step is appropriately implemented through the classical methods reviewed in Section 5.1 and Section 5.2, with the classifier implemented through the architectural family appropriate to the sample-size and annotation-cost regimes.

10.6.5. Computational-Budget Regime

For deployments requiring operational throughput on large image tiles or dense temporal sequences, the lightweight architectural family is the appropriate default. Two lines of evidence support this choice: the computational asymmetry analysis in Section 10.3 and the parameter-efficiency results discussed in Section 7.2. Lightweight models in the one-to-two-million-parameter range recover within one F 1 point of the heaviest contemporary architectures on moderate-resolution benchmarks. The linear-complexity state space paradigm is the appropriate choice in the specific regime of large-tile or long-sequence inference, where its computational advantage becomes decisive.

10.6.6. Information-Product Regime

For deployments in which the required output is a from–to transition map at the native land cover ontology rather than a bi-temporal binary change map, the post-classification comparison paradigm reviewed in Section 5.4 remains the methodologically appropriate choice. The architectural implication is that the choice between post-classification comparison and bi-temporal direct detection is prior to the choice of classifier family and is determined by the information product required of the deployment rather than by the recency of the method.
The seven regimes above are not mutually exclusive; a specific deployment typically falls within several simultaneously, and the appropriate methodological choice combines the guidance of the relevant regimes. The underlying principle, recurrent throughout the preceding synthesis paragraphs and integrated in Section 10.1, is that the selection of a change detection methodology is determined by the binding constraint of the deployment rather than by the recency or representational expressivity of the method in the abstract. The corpus evidence reviewed in this review supports this principle across all three methodological epochs and across the full range of application domains represented in the reviewed literature.

11. Conclusions

This systematic review has examined change detection methods for remote sensing imagery, covering 144 primary papers identified through a systematic literature search and spanning the full methodological arc from classical statistical operators through machine learning to the latest deep learning architectures. The analysis reveals a field that has undergone dramatic performance improvements driven by successive architectural innovations.
On the LEVIR-CD+ benchmark, evaluated under a consistent protocol, the performance trajectory spans approximately 18 percentage points in F 1 score between the FCN baseline of 2018 (70.42%) and the current state of the art (88.39%), achieved through a sequence of architectural innovations: FCN/Siamese-CNN, attention-augmented Siamese, CNN–Transformer hybrid, pure Transformer, and Mamba SSM. The concurrent development of weakly supervised approaches, progressing from the foundational work of Andermatt and Timofte [176] through the CAM-SAM integration of Wang et al. [177] and the knowledge distillation framework of Lu et al. [181], has substantially reduced annotation requirements while maintaining competitive performance.
Persistent challenges constrain the practical impact of the field. The absence of a universal benchmark, the proliferation of inconsistent evaluation protocols, and the geographic concentration of evaluation data in East Asian and North American urban settings limit the interpretability and generalizability of reported results. Among the most promising near-term research directions are those at the intersection of change detection with large-scale pretraining, including adaptation of geospatial foundation models, diffusion-based feature learning, and vision-language models, which promise to substantially reduce annotation requirements while improving cross-domain generalization.

Supplementary Materials

The following supporting information can be downloaded at: https://www.mdpi.com/article/10.3390/rs18152573/s1, File S1: PRISMA 2020 checklist; File S2: list of the 144 included primary studies with identification route, method family, supervision regime, and application domain.

Author Contributions

Conceptualization, M.J. and P.F.; methodology, M.J.; investigation, M.J.; data curation, M.J.; formal analysis, M.J.; visualization, M.J.; writing—original draft preparation, M.J.; writing—review and editing, P.F.; supervision, P.F.; project administration, P.F. All authors have read and agreed to the published version of the manuscript.

Funding

This work was supported by the ALP-AI project within the framework of the Interreg VI-A Italia-Svizzera Program, co-funded by the European Union (ID: 0300290).

Data Availability Statement

No primary data were generated or analyzed in this study. The literature-search protocol is reported in Section 3, and the executed Scopus query grid is reproduced in Appendix A; the complete list of included studies with their characteristics is provided in Supplementary Materials File S2, and the completed PRISMA 2020 checklist in Supplementary Materials File S1. A preprint and the assembled reference list are available at https://doi.org/10.5281/zenodo.19629517 and https://github.com/arshyajabbari/CD-Survey (accessed on 15 April 2026).

Acknowledgments

During the preparation of this manuscript, the authors used Anthropic’s Claude Opus 4 and 5 models and OpenAI’s ChatGPT-5 for the purposes of improving the language and readability of the text and assisting with consistency, formatting, and reference checks. The authors have reviewed and edited the output and take full responsibility for the content of this publication.

Conflicts of Interest

The authors declare no conflicts of interest.

Appendix A. Executed Scopus Query Grid

The database search was executed as a grid of forty queries, each instantiating the template
"<source>" AND "change detection" AND "<method>" AND LANGUAGE(english) AND (SRCTYPE(j) OR SRCTYPE(p)) AND OPENACCESS(1)
over the default Scopus search fields, with <source> ranging over the eight phrases {satellite images, satellite imagery, remote sensing images, remote sensing imagery, aerial images, aerial imagery, UAV images, UAV imagery} and <method> over the five terms {method, approach, technique, model, framework}. Duplicate records returned by multiple sub-queries were removed prior to screening, as reported in Section 3.

References

  1. Singh, A. Digital change detection techniques using remotely-sensed data. Int. J. Remote Sens. 1989, 10, 989–1003. [Google Scholar] [CrossRef] [Scilit]
  2. Lu, D.; Mausel, P.; Broondizio, E.; Moran, E. Change detection techniques. Int. J. Remote Sens. 2004, 25, 2365–2407. [Google Scholar] [CrossRef] [Scilit]
  3. Khelifi, L.; Mignotte, M. Deep learning for change detection in remote sensing images: Comprehensive review and meta-analysis. IEEE Access 2020, 8, 126385–126400. [Google Scholar] [CrossRef] [Scilit]
  4. Coppin, P.; Jonckheere, I.; Nackaerts, K.; Muys, B.; Lambin, E. Digital change detection methods in ecosystem monitoring: A review. Int. J. Remote Sens. 2004, 25, 1565–1596. [Google Scholar] [CrossRef] [Scilit]
  5. Radke, R.J.; Andra, S.; Al-Kofahi, O.; Roysam, B. Image change detection algorithms: A systematic survey. IEEE Trans. Image Process. 2005, 14, 294–307. [Google Scholar] [CrossRef] [Scilit] [PubMed]
  6. Bruzzone, L.; Bovolo, F. A novel framework for the design of change-detection systems for very-high-resolution remote sensing images. Proc. IEEE 2013, 101, 609–630. [Google Scholar] [CrossRef] [Scilit]
  7. Shi, W.; Zhang, M.; Zhang, R.; Chen, S.; Zhan, Z. Change detection based on artificial intelligence: State-of-the-art and challenges. Remote Sens. 2020, 12, 1688. [Google Scholar] [CrossRef] [Scilit]
  8. Jiang, H.; Peng, M.; Zhong, Y.; Xie, H.; Hao, Z.; Lin, J.; Ma, X.; Hu, X. A survey on deep learning-based change detection from high-resolution remote sensing images. Remote Sens. 2022, 14, 1552. [Google Scholar] [CrossRef] [Scilit]
  9. Shafique, A.; Cao, G.; Khan, Z.; Asad, M.; Aslam, M. Deep learning-based change detection in remote sensing images: A review. Remote Sens. 2022, 14, 871. [Google Scholar] [CrossRef] [Scilit]
  10. Bai, T.; Wang, L.; Yin, D.; Sun, K.; Chen, Y.; Li, W.; Li, D. Deep learning for change detection in remote sensing: A review. Geo-Spat. Inf. Sci. 2023, 26, 262–288. [Google Scholar] [CrossRef] [Scilit]
  11. Parelius, E. A review of deep-learning methods for change detection in multispectral remote sensing images. Remote Sens. 2023, 15, 2092. [Google Scholar] [CrossRef] [Scilit]
  12. Wang, L.; Zhang, M.; Gao, X.; Shi, W. Advances and challenges in deep learning-based change detection for remote sensing images: A review through various learning paradigms. Remote Sens. 2024, 16, 804. [Google Scholar] [CrossRef] [Scilit]
  13. Lv, Z.; Huang, H.; Li, X.; Zhao, M.; Benediktsson, J.A.; Sun, W.; Falco, N. Land cover change detection with heterogeneous remote sensing images: Review, progress, challenges, and prospects. Proc. IEEE 2022, 110, 1976–1991. [Google Scholar] [CrossRef] [Scilit]
  14. Yu, Z.; Li, T.; Zhu, Y.; Pan, R. Exploring foundation models in remote sensing image change detection: A comprehensive survey. arXiv 2024, arXiv:2410.07824. [Google Scholar]
  15. Peng, D.; Liu, M.; Zhang, Y.; Guan, H. Toward label-efficient deep learning change detection for remote sensing imagery: A comprehensive review. Photogramm. Rec. 2025, 40, e70021. [Google Scholar] [CrossRef] [Scilit]
  16. Yu, C.; Yang, H.; Ma, L.; Yang, J.; Jin, Y.; Zhang, W.; Wang, K.; Zhao, Q. Deep learning-based change detection in remote sensing: A comprehensive review. IEEE J. Sel. Top. Appl. Earth Obs. Remote Sens. 2025, 18, 24415–24437. [Google Scholar] [CrossRef] [Scilit]
  17. Lei, T.; Zhang, S.; Lin, S.; Liu, T.; Lv, Z.; Gao, T.; Gong, M.; Nandi, A.K. Remote sensing image change detection using deep learning techniques: A comprehensive survey. Artif. Intell. Rev. 2026, 59, 102. [Google Scholar] [CrossRef] [Scilit]
  18. Jiang, W.; Sun, Y.; Lei, L.; Kuang, G.; Ji, K. Change detection of multisource remote sensing images: A review. Int. J. Digit. Earth 2024, 17, 2398051. [Google Scholar] [CrossRef] [Scilit]
  19. Saidi, S.; Idbraim, S.; Karmoude, Y.; Masse, A.; Arbelo, M. Deep-learning for change detection using multi-modal fusion of remote sensing images: A review. Remote Sens. 2024, 16, 3852. [Google Scholar] [CrossRef] [Scilit]
  20. Lv, Z.; Zhang, M.; Sun, W.; Lei, T.; Benediktsson, J.; Liu, T. Land cover change detection with hyperspectral remote sensing images: A survey. Inf. Fusion 2025, 123, 103257. [Google Scholar] [CrossRef] [Scilit]
  21. Bao, M.; Lyu, S.; Xu, Z.; Zhou, H.; Ren, J.; Xiang, S.; Li, X.; Cheng, G. Vision mamba in remote sensing: A comprehensive survey of techniques, applications and outlook. Remote Sens. 2026, 18, 594. [Google Scholar] [CrossRef] [Scilit]
  22. Zou, S.; Wei, Y.; Xie, Y.; Lao, M.; Luan, X. Remote sensing image change captioning: A comprehensive review. Int. J. Multimed. Inf. Retr. 2025, 14, 26. [Google Scholar] [CrossRef] [Scilit]
  23. Ma, L.; Liu, Y.; Zhang, X.; Ye, Y.; Yin, G.; Johnson, B. Deep learning in remote sensing applications: A meta-analysis and review. ISPRS J. Photogramm. Remote Sens. 2019, 152, 166–177. [Google Scholar] [CrossRef] [Scilit]
  24. Hussain, M.; Chen, D.; Cheng, A.; Wei, H.; Stanley, D. Change detection from remotely sensed images: From pixel-based to object-based approaches. ISPRS J. Photogramm. Remote Sens. 2013, 80, 91–106. [Google Scholar] [CrossRef] [Scilit]
  25. Tewkesbury, A.; Comber, A.; Tate, N.; Lamb, A.; Fisher, P. A critical synthesis of remotely sensed optical image change detection techniques. Remote Sens. Environ. 2015, 160, 1–14. [Google Scholar] [CrossRef] [Scilit]
  26. Yang, K.; Xia, G.S.; Liu, Z.; Du, B.; Yang, W.; Pelillo, M.; Zhang, L. Asymmetric siamese networks for semantic change detection in aerial images. IEEE Trans. Geosci. Remote Sens. 2022, 60, 5609818. [Google Scholar] [CrossRef] [Scilit]
  27. Page, M.J.; McKenzie, J.E.; Bossuyt, P.M.; Boutron, I.; Hoffmann, T.C.; Mulrow, C.D.; Shamseer, L.; Tetzlaff, J.M.; Akl, E.A.; Brennan, S.E.; et al. The PRISMA 2020 statement: An updated guideline for reporting systematic reviews. Int. J. Surg. 2021, 372, n71. [Google Scholar] [CrossRef] [Scilit] [PubMed]
  28. Malila, W. Change vector analysis: An approach for detecting forest changes with landsat. In Proceedings of the Symposium on Machine Processing of Remotely Sensed Data (LARS), West Lafayette, IN, USA, 3–6 June 1980; pp. 326–335. [Google Scholar]
  29. Nielsen, A.A.; Conradsen, K.; Simpson, J.J. Multivariate alteration detection (MAD) and MAF postprocessing in multispectral, bitemporal image data. Remote Sens. Environ. 1998, 64, 1–19. [Google Scholar] [CrossRef] [Scilit]
  30. Nielsen, A.A. The regularized iteratively reweighted MAD method for change detection in multi- and hyperspectral data. IEEE Trans. Image Process. 2007, 16, 463–478. [Google Scholar] [CrossRef] [Scilit] [PubMed]
  31. Bruzzone, L.; Fernández Prieto, D. Automatic analysis of the difference image for unsupervised change detection. IEEE Trans. Geosci. Remote Sens. 2000, 38, 1171–1182. [Google Scholar] [CrossRef] [Scilit]
  32. Bovolo, F.; Bruzzone, L. A theoretical framework for unsupervised change detection based on change vector analysis in the polar domain. IEEE Trans. Geosci. Remote Sens. 2007, 45, 218–236. [Google Scholar] [CrossRef] [Scilit]
  33. Bovolo, F.; Marchesi, S.; Bruzzone, L. A framework for automatic and unsupervised detection of multiple changes in multitemporal images. IEEE Trans. Geosci. Remote Sens. 2012, 50, 2196–2212. [Google Scholar] [CrossRef] [Scilit]
  34. Bovolo, F.; Bruzzone, L.; Marconcini, M. A novel approach to unsupervised change detection based on a semisupervised SVM and a similarity measure. IEEE Trans. Geosci. Remote Sens. 2008, 46, 2070–2082. [Google Scholar] [CrossRef] [Scilit]
  35. Celik, T. Unsupervised change detection in satellite images using principal component analysis and k-means clustering. IEEE Geosci. Remote Sens. Lett. 2009, 6, 772–776. [Google Scholar] [CrossRef] [Scilit]
  36. Kennedy, R.; Yang, Z.; Cohen, W. Detecting trends in forest disturbance and recovery using yearly Landsat time series: 1. LandTrendr—Temporal segmentation algorithms. Remote Sens. Environ. 2010, 114, 2897–2910. [Google Scholar] [CrossRef] [Scilit]
  37. Verbesselt, J.; Hyndman, R.; Newnham, G.; Culvenor, D. Detecting trend and seasonal changes in satellite image time series. Remote Sens. Environ. 2010, 114, 106–115. [Google Scholar] [CrossRef] [Scilit]
  38. Zhu, Z.; Woodcock, C. Continuous change detection and classification of land cover using all available Landsat data. Remote Sens. Environ. 2014, 144, 152–171. [Google Scholar] [CrossRef] [Scilit]
  39. Chen, H.; Shi, Z. A spatial-temporal attention-based method and a new dataset for remote sensing image change detection. Remote Sens. 2020, 12, 1662. [Google Scholar] [CrossRef] [Scilit]
  40. Lebedev, M.A.; Vizilter, Y.V.; Vygolov, O.V.; Knyaz, V.A.; Rubis, A.Y. Change detection in remote sensing images using conditional adversarial networks. ISPRS–Int. Arch. Photogramm. Remote Sens. Spat. Inf. Sci. 2018, XLII-2, 565–571. [Google Scholar] [CrossRef] [Scilit]
  41. Ji, S.; Wei, S.; Lu, M. Fully convolutional networks for multisource building extraction from an open aerial and satellite imagery data set. IEEE Trans. Geosci. Remote Sens. 2019, 57, 574–586. [Google Scholar] [CrossRef] [Scilit]
  42. Shi, Q.; Liu, M.; Li, S.; Liu, X.; Wang, F.; Zhang, L. A deeply supervised attention metric-based network and an open aerial image dataset for remote sensing change detection. IEEE Trans. Geosci. Remote Sens. 2022, 60, 5604816. [Google Scholar] [CrossRef] [Scilit]
  43. Zhang, C.; Yue, P.; Tapete, D.; Jiang, L.; Shangguan, B.; Huang, L.; Liu, G. A deeply supervised image fusion network for change detection in high resolution bi-temporal remote sensing images. ISPRS J. Photogramm. Remote Sens. 2020, 166, 183–200. [Google Scholar] [CrossRef] [Scilit]
  44. Daudt, R.C.; Le Saux, B.; Boulch, A.; Gousseau, Y. Multitask learning for large-scale semantic change detection. Comput. Vis. Image Underst. 2019, 187, 102783. [Google Scholar] [CrossRef] [Scilit]
  45. Peng, D.; Bruzzone, L.; Zhang, Y.; Guan, H.; Ding, H.; Huang, X. SemiCDNet: A semisupervised convolutional neural network for change detection in high resolution remote-sensing images. IEEE Trans. Geosci. Remote Sens. 2021, 59, 5891–5906. [Google Scholar] [CrossRef] [Scilit]
  46. Gupta, R.; Hosfelt, R.; Sajeev, S.; Patel, N.; Goodman, B.; Doshi, J.; Heim, E.; Choset, H.; Gaston, M. xBD: A dataset for assessing building damage from satellite imagery. arXiv 2019, arXiv:1911.09296. [Google Scholar]
  47. Jiang, S.; Lin, H.; Ren, H.; Hu, Z.; Weng, L.; Xia, M. MDANet: A high-resolution city change detection network based on difference and attention mnechanisms under multi-scale feature fusion. Remote Sens. 2024, 16, 1387. [Google Scholar] [CrossRef] [Scilit]
  48. Shen, L.; Lu, Y.; Chen, H.; Wei, H.; Xie, D.; Yue, J.; Chen, R.; Lv, S.; Jiang, B. S2Looking: A satellite side-looking dataset for building change detection. Remote Sens. 2021, 13, 5094. [Google Scholar] [CrossRef] [Scilit]
  49. Benedek, C.; Szirányi, T. Change detection in optical aerial images by a multilayer conditional mixed markov model. IEEE Trans. Geosci. Remote Sens. 2009, 47, 3416–3430. [Google Scholar] [CrossRef] [Scilit]
  50. Daudt, R.C.; Le Saux, B.; Boulch, A.; Gousseau, Y. Urban change detection for multispectral earth observation using convolutional neural networks. In Proceedings of the IEEE International Geoscience and Remote Sensing Symposium (IGARSS); IEEE: Piscataway, NJ, USA, 2018; pp. 2115–2118. [Google Scholar] [CrossRef] [Scilit]
  51. Collins, J.B.; Woodcock, C.E. An assessment of several linear change detection techniques for mapping forest mortality using multitemporal Landsat TM data. Remote Sens. Environ. 1996, 56, 66–77. [Google Scholar] [CrossRef] [Scilit]
  52. Liu, S.; Zheng, Y.; Dalponte, M.; Tong, X. A novel fire index-based burned area change detection approach using Landsat-8 OLI data. Eur. J. Remote Sens. 2020, 53, 104–112. [Google Scholar] [CrossRef] [Scilit]
  53. Meera Gandhi, G.; Parthiban, S.; Nagaraj, T.; Christy, A. NDVI: Vegetation change detection using remote sensing and GIS—A case study of Vellore District. Procedia Comput. Sci. 2015, 57, 1199–1210. [Google Scholar] [CrossRef] [Scilit]
  54. Zhang, B.; Ye, H.; Lu, W.; Huang, W.; Wu, B.; Hao, Z.; Sun, H. A spatiotemporal change detection method for monitoring pine wilt disease in a complex landscape using high-resolution remote sensing imagery. Remote Sens. 2021, 13, 2083. [Google Scholar] [CrossRef] [Scilit]
  55. Xing, J.; Sieber, R.; Caelli, T. A scale-invariant change detection method for land use/cover change research. ISPRS J. Photogramm. Remote Sens. 2018, 141, 252–264. [Google Scholar] [CrossRef] [Scilit]
  56. Johnson, R.D.; Kasischke, E.S. Change vector analysis: A technique for the multispectral monitoring of land cover and condition. Int. J. Remote Sens. 1998, 19, 411–426. [Google Scholar] [CrossRef] [Scilit]
  57. Saha, S.; Bovolo, F.; Bruzzone, L. Unsupervised deep change vector analysis for multiple-change detection in VHR images. IEEE Trans. Geosci. Remote Sens. 2019, 57, 3677–3693. [Google Scholar] [CrossRef] [Scilit]
  58. Yang, X.; Zhu, Z.; Qiu, S.; Kroeger, K.D.; Zhu, Z.; Covington, S. Detection and characterization of coastal tidal wetland change in the northeastern US using Landsat time series. Remote Sens. Environ. 2022, 276, 113047. [Google Scholar] [CrossRef] [Scilit]
  59. Lu, P.; Qin, Y.; Li, Z.; Mondini, A.C.; Casagli, N. Landslide mapping from multi-sensor data through improved change detection-based Markov random field. Remote Sens. Environ. 2019, 231, 111235. [Google Scholar] [CrossRef] [Scilit]
  60. Tsai, F.; Hwang, J.H.; Chen, L.C.; Lin, T.H. Post-disaster assessment of landslides in southern Taiwan after 2009 Typhoon Morakot using remote sensing and spatial analysis. Nat. Hazards Earth Syst. Sci. 2010, 10, 2179–2190. [Google Scholar] [CrossRef] [Scilit]
  61. Deng, J.S.; Wang, K.; Deng, Y.H.; Qi, G.J. PCA-based land-use change detection and analysis using multitemporal and multisensor satellite data. Int. J. Remote Sens. 2008, 29, 4823–4838. [Google Scholar] [CrossRef] [Scilit]
  62. Al-Khudhairy, D.H.A.; Caravaggi, I.; Giada, S. Structural damage assessments from Ikonos data using change detection, object-oriented segmentation, and classification techniques. Photogramm. Eng. Remote Sens. 2005, 71, 825–837. [Google Scholar] [CrossRef] [Scilit]
  63. Lin, Y.; Liu, S.; Zheng, Y.; Tong, X.; Xie, H.; Zhu, H.; Du, K.; Zhao, H.; Zhang, J. An unsupervised transformer-based multivariate alteration detection approach for change detection in VHR remote sensing images. IEEE J. Sel. Top. Appl. Earth Obs. Remote Sens. 2024, 17, 3251–3261. [Google Scholar] [CrossRef] [Scilit]
  64. Wang, Q.; Yuan, Z.; Du, Q.; Li, X. GETNET: A general end-to-end 2-D CNN framework for hyperspectral image change detection. IEEE Trans. Geosci. Remote Sens. 2019, 57, 3–13. [Google Scholar] [CrossRef] [Scilit]
  65. Luo, F.; Zhou, T.; Liu, J.; Guo, T.; Gong, X.; Ren, J. Multiscale diff-changed feature fusion network for hyperspectral image change detection. IEEE Trans. Geosci. Remote Sens. 2023, 61, 5502713. [Google Scholar] [CrossRef] [Scilit]
  66. Ghaderpour, E.; Vujadinovic, T. Change detection within remotely sensed satellite image time series via spectral analysis. Remote Sens. 2020, 12, 4001. [Google Scholar] [CrossRef] [Scilit]
  67. Ben Abbes, A.; Bounouh, O.; Farah, I.R.; de Jong, R.; Martínez, B. Comparative study of three satellite image time-series decomposition methods for vegetation change detection. Eur. J. Remote Sens. 2018, 51, 607–615. [Google Scholar] [CrossRef] [Scilit]
  68. Winsvold, S.H.; Kääb, A.; Nuth, C. Regional glacier mapping using optical satellite data time series. IEEE J. Sel. Top. Appl. Earth Obs. Remote Sens. 2016, 9, 3698–3711. [Google Scholar] [CrossRef] [Scilit]
  69. Hughes, M.J.; Kaylor, S.D.; Hayes, D.J. Patch-based forest change detection from Landsat time series. Forests 2017, 8, 166. [Google Scholar] [CrossRef] [Scilit]
  70. Byun, Y.; Han, Y.; Chae, T. Image fusion-based change detection for flood extent extraction using bi-temporal very high-resolution satellite images. Remote Sens. 2015, 7, 10347–10363. [Google Scholar] [CrossRef] [Scilit]
  71. Luo, H.; Liu, C.; Wu, C.; Guo, X. Urban change detection based on Dempster–Shafer theory for multitemporal very high-resolution imagery. Remote Sens. 2018, 10, 980. [Google Scholar] [CrossRef] [Scilit]
  72. Mas, J.F. Monitoring land-cover changes: A comparison of change detection techniques. Int. J. Remote Sens. 1999, 20, 139–152. [Google Scholar] [CrossRef] [Scilit]
  73. Rawat, J.S.; Biswas, V.; Kumar, M. Changes in land use/cover using geospatial techniques: A case study of Ramnagar town area, district Nainital, Uttarakhand, India. Egypt. J. Remote Sens. Space Sci. 2013, 16, 111–117. [Google Scholar] [CrossRef] [Scilit]
  74. Rawat, J.S.; Kumar, M. Monitoring land use/cover change using remote sensing and GIS techniques: A case study of Hawalbagh block, district Almora, Uttarakhand, India. Egypt. J. Remote Sens. Space Sci. 2015, 18, 77–84. [Google Scholar] [CrossRef] [Scilit]
  75. Tewabe, D.; Fentahun, T. Assessing land use and land cover change detection using remote sensing in the Lake Tana Basin, Northwest Ethiopia. Cogent Environ. Sci. 2020, 6, 1778998. [Google Scholar] [CrossRef] [Scilit]
  76. Hassan, Z.; Shabbir, R.; Ahmad, S.S.; Malik, A.H.; Aziz, N.; Butt, A.; Erum, S. Dynamics of land use and land cover change (LULCC) using geospatial techniques: A case study of Islamabad Pakistan. SpringerPlus 2016, 5, 812. [Google Scholar] [CrossRef] [Scilit] [PubMed]
  77. Tran, H.; Tran, T.; Kervyn, M. Dynamics of land cover/land use changes in the Mekong Delta, 1973–2011: A remote sensing analysis. Remote Sens. 2015, 7, 2899–2925. [Google Scholar] [CrossRef] [Scilit]
  78. Fan, F.; Weng, Q.; Wang, Y. Land use and land cover change in Guangzhou, China, from 1998 to 2003, based on Landsat TM /ETM+ imagery. Sensors 2007, 7, 1323–1342. [Google Scholar] [CrossRef] [Scilit]
  79. Xiao, H.; Weng, Q. The impact of land use and land cover changes on land surface temperature in a karst area of China. J. Environ. Manag. 2007, 85, 245–257. [Google Scholar] [CrossRef] [Scilit] [PubMed]
  80. Weng, Q. Land use change analysis in the Zhujiang Delta of China using satellite remote sensing, GIS and stochastic modelling. J. Environ. Manag. 2002, 64, 273–284. [Google Scholar] [CrossRef] [Scilit] [PubMed]
  81. Koko, A.F.; Yue, W.; Abubakar, G.A.; Hamed, R.; Alabsi, A.A.N. Monitoring and predicting spatio-temporal land use/land cover changes in Zaria City, Nigeria, through an integrated cellular automata and Markov chain model (CA-Markov). Sustainability 2020, 12, 10452. [Google Scholar] [CrossRef] [Scilit]
  82. Belay, H.; Melesse, A.M.; Tegegne, G. Scenario-based land use and land cover change detection and prediction using the cellular automata–Markov model in the Gumara watershed, upper Blue Nile Basin, Ethiopia. Land 2024, 13, 396. [Google Scholar] [CrossRef] [Scilit]
  83. Lyons, M.; Phinn, S.; Roelfsema, C. Integrating Quickbird multi-spectral satellite and field data: Mapping bathymetry, seagrass cover, seagrass species and change in Moreton Bay, Australia in 2004 and 2007. Remote Sens. 2011, 3, 42–64. [Google Scholar] [CrossRef] [Scilit]
  84. Mas, J.F.; Lemoine-Rodríguez, R.; González-López, R.; López-Sánchez, J.; Piña-Garduño, A.; Herrera-Flores, E. Land use/land cover change detection combining automatic processing and visual interpretation. Eur. J. Remote Sens. 2017, 50, 626–635. [Google Scholar] [CrossRef] [Scilit]
  85. Tan, Y.C.; Duarte, L.; Teodoro, A.C. Comparative study of random forest and support vector machine for land cover classification and post-wildfire change detection. Land 2024, 13, 1878. [Google Scholar] [CrossRef] [Scilit]
  86. Azzouzi, S.A.; Vidal-Pantaleoni, A.; Bentounes, H.A. Desertification monitoring in Biskra, Algeria, with Landsat imagery by means of supervised classification and change detection methods. IEEE Access 2017, 5, 9065–9072. [Google Scholar] [CrossRef] [Scilit]
  87. Atef, I.; Ahmed, W.; Abdel-Maguid, R.H. Modelling of land use land cover changes using machine learning and GIS techniques: A case study in El-Fayoum Governorate, Egypt. Environ. Monit. Assess. 2023, 195, 637. [Google Scholar] [CrossRef] [Scilit] [PubMed]
  88. Dammalage, T.L.; Jayasinghe, N.T. Land-use change and its impact on urban flooding: A case study on Colombo district flood on May 2016. Eng. Technol. Appl. Sci. Res. 2019, 9, 3887–3891. [Google Scholar] [CrossRef] [Scilit]
  89. Hou, B.; Wang, Y.; Liu, Q. A saliency guided semi-supervised building change detection method for high resolution remote sensing images. Sensors 2016, 16, 1377. [Google Scholar] [CrossRef] [Scilit] [PubMed]
  90. Wang, X.; Liu, S.; Du, P.; Liang, H.; Xia, J.; Li, Y. Object-based change detection in urban areas from high spatial resolution images based on multiple features and ensemble learning. Remote Sens. 2018, 10, 276. [Google Scholar] [CrossRef] [Scilit]
  91. Im, J.; Jensen, J. A change detection model based on neighborhood correlation image analysis and decision tree classification. Remote Sens. Environ. 2005, 99, 326–340. [Google Scholar] [CrossRef] [Scilit]
  92. Rash, A.; Mustafa, Y.; Hamad, R. Quantitative assessment of land use/land cover changes in a developing region using machine learning algorithms: A case study in the Kurdistan Region, Iraq. Heliyon 2023, 9, e21253. [Google Scholar] [CrossRef] [Scilit] [PubMed]
  93. Hu, Y.; Hu, Y. Land cover changes and their driving mechanisms in Central Asia from 2001 to 2017 supported by Google Earth Engine. Remote Sens. 2019, 11, 554. [Google Scholar] [CrossRef] [Scilit]
  94. Scharsich, V.; Mtata, K.; Hauhs, M.; Lange, H.; Bogner, C. Analysing land cover and land use change in the Matobo National Park and surroundings in Zimbabwe. Remote Sens. Environ. 2017, 194, 278–286. [Google Scholar] [CrossRef] [Scilit]
  95. Seydi, S.T.; Akhoondzadeh, M.; Amani, M.; Mahdavi, S. Wildfire damage assessment over Australia using Sentinel-2 imagery and MODIS land cover product within the Google Earth Engine cloud platform. Remote Sens. 2021, 13, 220. [Google Scholar] [CrossRef] [Scilit]
  96. Seo, D.K.; Kim, Y.H.; Eo, Y.D.; Park, W.Y.; Park, H.C. Generation of radiometric, phenological normalized image based on random forest regression for change detection. Remote Sens. 2017, 9, 1163. [Google Scholar] [CrossRef] [Scilit]
  97. Chen, S.; Miao, Z.; Wu, L.; He, Y. Application of an incomplete landslide inventory and one class classifier to earthquake-induced landslide susceptibility mapping. IEEE J. Sel. Top. Appl. Earth Obs. Remote Sens. 2020, 13, 4773–4788. [Google Scholar] [CrossRef] [Scilit]
  98. Blaschke, T. Object based image analysis for remote sensing. ISPRS J. Photogramm. Remote Sens. 2010, 65, 2–16. [Google Scholar] [CrossRef] [Scilit]
  99. Chen, G.; Hay, G.; Carvalho, L.; Wulder, M. Object-based change detection. Int. J. Remote Sens. 2012, 33, 4434–4457. [Google Scholar] [CrossRef] [Scilit]
  100. Walter, V. Object-based classification of remote sensing data for change detection. ISPRS J. Photogramm. Remote Sens. 2004, 58, 225–238. [Google Scholar] [CrossRef] [Scilit]
  101. Tan, K.; Zhang, Y.; Wang, X.; Chen, Y. Object-based change detection using multiple classifiers and multi-scale uncertainty analysis. Remote Sens. 2019, 11, 359. [Google Scholar] [CrossRef] [Scilit]
  102. Zhou, Z.; Ma, L.; Fu, T.; Zhang, G.; Yao, M.; Li, M. Change detection in coral reef environment using high-resolution images: Comparison of object-based and pixel-based paradigms. ISPRS Int. J. Geo-Inf. 2018, 7, 441. [Google Scholar] [CrossRef] [Scilit]
  103. Zhu, Z. Change detection using landsat time series: A review of frequencies, preprocessing, algorithms, and applications. ISPRS J. Photogramm. Remote Sens. 2017, 130, 370–384. [Google Scholar] [CrossRef] [Scilit]
  104. Fu, P.; Weng, Q. A time series analysis of urbanization induced land use and land cover change and its impact on land surface temperature with Landsat imagery. Remote Sens. Environ. 2016, 175, 205–214. [Google Scholar] [CrossRef] [Scilit]
  105. Hu, Y.; Dong, Y.; Batunacun. An automatic approach for land-change detection and land updates based on integrated NDVI timing analysis and the CVAPS method with GEE support. ISPRS J. Photogramm. Remote Sens. 2018, 146, 347–359. [Google Scholar] [CrossRef] [Scilit]
  106. Francini, S.; McRoberts, R.E.; Giannetti, F.; Mencucci, M.; Marchetti, M.; Scarascia Mugnozza, G.; Chirici, G. Near-real time forest change detection using PlanetScope imagery. Eur. J. Remote Sens. 2020, 53, 233–244. [Google Scholar] [CrossRef] [Scilit]
  107. Roy, A.; Inamdar, A.B. Multi-temporal LULC change analysis of a dry semi-arid river basin in western India following a robust multi-sensor satellite image calibration strategy. Heliyon 2019, 5, e01478. [Google Scholar] [CrossRef] [Scilit] [PubMed]
  108. Viana, C.M.; Girão, I.; Rocha, J. Long-term satellite image time-series for land use/land cover change detection using refined open source data in a rural region. Remote Sens. 2019, 11, 1104. [Google Scholar] [CrossRef] [Scilit]
  109. Patel, A.; Vyas, D.; Chaudhari, N.; Patel, R.; Patel, K.; Mehta, D. Novel approach for the LULC change detection using GIS and Google Earth Engine through spatiotemporal analysis to evaluate the urbanization growth of Ahmedabad city. Results Eng. 2024, 21, 101788. [Google Scholar] [CrossRef] [Scilit]
  110. Hansen, M.; Potapov, P.; Moore, R.; Hancher, M.; Turubanova, S.; Tyukavina, A.; Thau, D.; Stehman, S.; Goetz, S.; Loveland, T.; et al. High-resolution global maps of 21st-century forest cover change. Science 2013, 342, 850–853. [Google Scholar] [CrossRef] [Scilit] [PubMed]
  111. Caye Daudt, R.; Le Saux, B.; Boulch, A. Fully convolutional Siamese networks for change detection. In Proceedings of the IEEE International Conference on Image Processing (ICIP); IEEE: Piscataway, NJ, USA, 2018; pp. 4063–4067. [Google Scholar] [CrossRef] [Scilit]
  112. Peng, D.; Zhang, Y.; Guan, H. End-to-end change detection for high resolution satellite images using improved Unet++. Remote Sens. 2019, 11, 1382. [Google Scholar] [CrossRef] [Scilit]
  113. Fang, S.; Li, K.; Shao, J.; Li, Z. SNUNet-CD: A densely connected Siamese network for change detection of VHR images. IEEE Geosci. Remote Sens. Lett. 2022, 19, 8007805. [Google Scholar] [CrossRef] [Scilit]
  114. Mou, L.; Bruzzone, L.; Zhu, X.X. Learning spectral-spatial-temporal features via a recurrent convolutional neural network for change detection in multispectral imagery. IEEE Trans. Geosci. Remote Sens. 2019, 57, 924–935. [Google Scholar] [CrossRef] [Scilit]
  115. de Bem, P.P.; de Carvalho Júnior, O.A.; Guimarães, R.F.; Gomes, R.A.T. Change detection of deforestation in the Brazilian Amazon using Landsat data and convolutional neural networks. Remote Sens. 2020, 12, 901. [Google Scholar] [CrossRef] [Scilit]
  116. Bai, B.; Fu, W.; Lu, T.; Li, S. Edge-guided recurrent convolutional neural network for multitemporal remote sensing image building change detection. IEEE Trans. Geosci. Remote Sens. 2022, 60, 5610613. [Google Scholar] [CrossRef] [Scilit]
  117. Chen, J.; Yuan, Z.; Peng, J.; Chen, L.; Huang, H.; Zhu, J. DASnet: Dual attentive fully convolutional Siamese networks for change detection of high-resolution satellite images. IEEE J. Sel. Top. Appl. Earth Obs. Remote Sens. 2021, 14, 1194–1206. [Google Scholar] [CrossRef] [Scilit]
  118. Liu, Y.; Pang, C.; Zhan, Z.; Zhang, X.; Yang, X. Building change detection for remote sensing images using a dual-task constrained deep siamese convolutional network model. IEEE Geosci. Remote Sens. Lett. 2021, 18, 811–815. [Google Scholar] [CrossRef] [Scilit]
  119. Lei, T.; Geng, X.; Ning, H.; Lv, Z.; Gong, M.; Jin, Y.; Nandi, A.K. Ultralightweight spatial–spectral feature cooperation network for change detection in remote sensing images. IEEE Trans. Geosci. Remote Sens. 2023, 61, 4402114. [Google Scholar] [CrossRef] [Scilit]
  120. Song, L.; Xia, M.; Jin, J.; Qian, M.; Zhang, Y. SUACDNet: Attentional change detection network based on Siamese U-shaped structure. Int. J. Appl. Earth Obs. Geoinf. 2021, 105, 102597. [Google Scholar] [CrossRef] [Scilit]
  121. Lei, T.; Wang, J.; Ning, H.; Wang, X.; Xue, D.; Wang, Q.; Nandi, A.K. Difference enhancement and spatial–spectral nonlocal network for change detection in VHR remote sensing images. IEEE Trans. Geosci. Remote Sens. 2022, 60, 4507013. [Google Scholar] [CrossRef] [Scilit]
  122. Zhang, Z.; Bao, L.; Xiang, S.; Xie, G.; Gao, R. B2CNet: A progressive change boundary-to-center refinement network for multitemporal remote sensing images change detection. IEEE J. Sel. Top. Appl. Earth Obs. Remote Sens. 2024, 17, 4956–4969. [Google Scholar] [CrossRef] [Scilit]
  123. Codegoni, A.; Lombardi, G.; Ferrari, A. TINYCD: A (not so) deep learning model for change detection. Neural Comput. Appl. 2023, 35, 8471–8486. [Google Scholar] [CrossRef] [Scilit]
  124. Han, C.; Wu, C.; Guo, H.; Hu, M.; Chen, H. HAnet: A hierarchical attention network for change detection with bitemporal very-high-resolution remote sensing images. IEEE J. Sel. Top. Appl. Earth Obs. Remote Sens. 2023, 16, 3867–3878. [Google Scholar] [CrossRef] [Scilit]
  125. Zheng, H.; Gong, M.; Liu, T.; Jiang, F.; Zhan, T.; Lu, D.; Zhang, M. HFA-Net: High frequency attention siamese network for building change detection in VHR remote sensing images. Pattern Recognit. 2022, 129, 108717. [Google Scholar] [CrossRef] [Scilit]
  126. Han, C.; Wu, C.; Guo, H.; Hu, M.; Li, J.; Chen, H. Change guiding network: Incorporating change prior to guide change detection in remote sensing imagery. IEEE J. Sel. Top. Appl. Earth Obs. Remote Sens. 2023, 16, 8395–8407. [Google Scholar] [CrossRef] [Scilit]
  127. Liu, B.; Chen, H.; Wang, Z.; Xie, W.; Shuai, L. LSNET: Extremely light-weight Siamese network for change detection of remote sensing images. In Proceedings of the IGARSS 2022—2022 IEEE International Geoscience and Remote Sensing Symposium; IEEE: Piscataway, NJ, USA, 2022; pp. 2358–2361. [Google Scholar] [CrossRef] [Scilit]
  128. Xing, Y.; Jiang, J.; Xiang, J.; Yan, E.; Song, Y.; Mo, D. LightCDNet: Lightweight change detection network based on VHR images. IEEE Geosci. Remote Sens. Lett. 2023, 20, 2504105. [Google Scholar] [CrossRef] [Scilit]
  129. Song, K.; Jiang, J. AGCDetNet: An attention-guided network for building change detection in high-resolution remote sensing images. IEEE J. Sel. Top. Appl. Earth Obs. Remote Sens. 2021, 14, 4816–4831. [Google Scholar] [CrossRef] [Scilit]
  130. Fang, S.; Li, K.; Li, Z. Changer: Feature interaction is what you need for change detection. IEEE Trans. Geosci. Remote Sens. 2023, 61, 5610111. [Google Scholar] [CrossRef] [Scilit]
  131. Ding, Q.; Shao, Z.; Huang, X.; Altan, O. DSA-Net: A novel deeply supervised attention-guided network for building change detection in high-resolution remote sensing images. Int. J. Appl. Earth Obs. Geoinf. 2021, 105, 102591. [Google Scholar] [CrossRef] [Scilit]
  132. Wang, D.; Chen, X.; Jiang, M.; Du, S.; Xu, B.; Wang, J. ADS-Net: An attention-based deeply supervised network for remote sensing image change detection. Int. J. Appl. Earth Obs. Geoinf. 2021, 101, 102348. [Google Scholar] [CrossRef] [Scilit]
  133. Zhang, J.; Shao, Z.; Ding, Q.; Huang, X.; Wang, Y.; Zhou, X.; Li, D. AERNet: An attention-guided edge refinement network and a dataset for remote sensing building change detection. IEEE Trans. Geosci. Remote Sens. 2023, 61, 5617116. [Google Scholar] [CrossRef] [Scilit]
  134. Zhang, X.; Tian, M.; Xing, Y.; Yue, Y.; Li, Y.; Yin, H.; Xia, R.; Jin, J.; Zhang, Y. ADHR-CDNet: Attentive differential high-resolution change detection network for remote sensing images. IEEE Trans. Geosci. Remote Sens. 2022, 60, 5634013. [Google Scholar] [CrossRef] [Scilit]
  135. Wang, M.; Tan, K.; Jia, X.; Wang, X.; Chen, Y. A deep Siamese network with hybrid convolutional feature extraction module for change detection based on multi-sensor remote sensing images. Remote Sens. 2020, 12, 205. [Google Scholar] [CrossRef] [Scilit]
  136. Xu, L.; Jing, W.; Song, H.; Chen, G. High-resolution remote sensing image change detection combined with pixel-level and object-level. IEEE Access 2019, 7, 78763–78773. [Google Scholar] [CrossRef] [Scilit]
  137. Jiang, Y.; Hu, L.; Zhang, Y.; Yang, X. WRICNet: A weighted rich-scale inception coder network for remote sensing image change detection. IEEE Trans. Geosci. Remote Sens. 2022, 60, 4705313. [Google Scholar] [CrossRef] [Scilit]
  138. Cheng, G.; Wang, G.; Han, J. ISNet: Towards improving separability for remote sensing image change detection. IEEE Trans. Geosci. Remote Sens. 2022, 60, 5623811. [Google Scholar] [CrossRef] [Scilit]
  139. Li, Z.; Tang, C.; Liu, X.; Zhang, W.; Dou, J.; Wang, L.; Zomaya, A.Y. Lightweight remote sensing change detection with progressive feature aggregation and supervised attention. IEEE Trans. Geosci. Remote Sens. 2023, 61, 5602812. [Google Scholar] [CrossRef] [Scilit]
  140. Ren, H.; Xia, M.; Weng, L.; Hu, K.; Lin, H. Dual-attention-guided multiscale feature aggregation network for remote sensing image change detection. IEEE J. Sel. Top. Appl. Earth Obs. Remote Sens. 2024, 17, 4867–4879. [Google Scholar] [CrossRef] [Scilit]
  141. Zhan, Z.; Ren, H.; Xia, M.; Lin, H.; Wang, X.; Li, X. AMFNet: Attention-guided multi-scale fusion network for bi-temporal change detection in remote sensing images. Remote Sens. 2024, 16, 1765. [Google Scholar] [CrossRef] [Scilit]
  142. Chen, H.; Qi, Z.; Shi, Z. Remote sensing image change detection with transformers. IEEE Trans. Geosci. Remote Sens. 2022, 60, 5607514. [Google Scholar] [CrossRef] [Scilit]
  143. Wang, W.; Tan, X.; Zhang, P.; Wang, X. A CBAM-based multiscale transformer fusion approach for remote sensing image change detection. IEEE J. Sel. Top. Appl. Earth Obs. Remote Sens. 2022, 15, 6817–6825. [Google Scholar] [CrossRef] [Scilit]
  144. Song, L.; Xia, M.; Weng, L.; Lin, H.; Qian, M.; Chen, B. Axial cross attention meets CNN: Bibranch fusion network for change detection. IEEE J. Sel. Top. Appl. Earth Obs. Remote Sens. 2022, 16, 21–32. [Google Scholar] [CrossRef] [Scilit]
  145. Feng, Y.; Jiang, J.; Xu, H.; Zheng, J. Change detection on remote sensing images using dual-branch multilevel intertemporal network. IEEE Trans. Geosci. Remote Sens. 2023, 61, 4401015. [Google Scholar] [CrossRef] [Scilit]
  146. Bandara, W.G.C.; Patel, V.M. A transformer-based Siamese network for change detection. arXiv 2022, arXiv:2201.01293. [Google Scholar] [CrossRef] [Scilit]
  147. Li, W.; Xue, L.; Wang, X.; Li, G. ConvTransNet: A CNN–transformer network for change detection with multiscale global–local representation. IEEE Trans. Geosci. Remote Sens. 2023, 61, 5610315. [Google Scholar] [CrossRef] [Scilit]
  148. Jiang, B.; Wang, Z.; Wang, X.; Zhang, Z.; Chen, L.; Wang, X.; Luo, B. VcT: Visual change transformer for remote sensing image change detection. IEEE Trans. Geosci. Remote Sens. 2023, 61, 2005214. [Google Scholar] [CrossRef] [Scilit]
  149. Zhang, X.; Cheng, S.; Wang, L.; Li, H. Asymmetric cross-attention hierarchical network based on CNN and transformer for bitemporal remote sensing image change detection. IEEE Trans. Geosci. Remote Sens. 2023, 61, 2000415. [Google Scholar] [CrossRef] [Scilit]
  150. Tang, X.; Zhang, T.; Ma, J.; Zhang, X.; Liu, F.; Jiao, L. WNet: W-shaped hierarchical network for remote-sensing image change detection. IEEE Trans. Geosci. Remote Sens. 2023, 61, 5615814. [Google Scholar] [CrossRef] [Scilit]
  151. Yan, T.; Wan, Z.; Zhang, P.; Cheng, G.; Lu, H. TransY-Net: Learning fully transformer networks for change detection of remote sensing images. IEEE Trans. Geosci. Remote Sens. 2023, 61, 4410012. [Google Scholar] [CrossRef] [Scilit]
  152. Xue, D.; Lei, T.; Yang, S.; Lv, Z.; Liu, T.; Jin, Y.; Nandi, A. Triple change detection network via joint multifrequency and full-scale Swin-transformer for remote sensing images. IEEE Trans. Geosci. Remote Sens. 2023, 61, 4408415. [Google Scholar] [CrossRef] [Scilit]
  153. Cui, B.; Liu, C.; Li, H.; Yu, J. MISGNet: A multilevel intertemporal semantic guidance network for remote sensing images change detection. IEEE J. Sel. Top. Appl. Earth Obs. Remote Sens. 2025, 18, 1827–1840. [Google Scholar] [CrossRef] [Scilit]
  154. Feng, Y.; Xu, H.; Jiang, J.; Liu, H.; Zheng, J. ICIF-Net: Intra-scale cross-interaction and inter-scale feature fusion network for bitemporal remote sensing image change detection. IEEE Trans. Geosci. Remote Sens. 2022, 60, 4410213. [Google Scholar] [CrossRef] [Scilit]
  155. Wang, L.; Li, Y.; Zhang, M.; Shen, X.; Peng, W.; Shi, W. MSFF-CDNet: A multiscale feature fusion change detection network for bi-temporal high-resolution remote sensing images. IEEE Geosci. Remote Sens. Lett. 2023, 20, 6009005. [Google Scholar] [CrossRef] [Scilit]
  156. Chen, T.; Lu, Z.; Yang, Y.; Zhang, Y.; Du, B.; Plaza, A. A Siamese network based U-Net for change detection in high resolution remote sensing images. IEEE J. Sel. Top. Appl. Earth Obs. Remote Sens. 2022, 15, 2357–2369. [Google Scholar] [CrossRef] [Scilit]
  157. Song, F.; Zhang, S.; Lei, T.; Song, Y.; Peng, Z. MSTDSNet-CD: Multiscale swin transformer and deeply supervised network for change detection of the Fast-Growing Urban Regions. IEEE J. Sel. Top. Appl. Earth Obs. Remote Sens. 2022, 19, 6508505. [Google Scholar] [CrossRef] [Scilit]
  158. Peng, D.; Bruzzone, L.; Zhang, Y.; Guan, H.; He, P. SCDNet: A novel convolutional network for semantic change detection in high resolution optical remote sensing imagery. Int. J. Appl. Earth Obs. Geoinf. 2021, 103, 102465. [Google Scholar] [CrossRef] [Scilit]
  159. Sefrin, O.; Riese, F.M.; Keller, S. Deep learning for land cover change detection. Remote Sens. 2021, 13, 78. [Google Scholar] [CrossRef] [Scilit]
  160. Yin, L.; Wang, L.; Li, T.; Lu, S.; Tian, J.; Yin, Z.; Li, X.; Zheng, W. U-Net-LSTM: Time series-enhanced lake boundary prediction model. Land 2023, 12, 1859. [Google Scholar] [CrossRef] [Scilit]
  161. Yan, T.; Wan, Z.; Zhang, P. Fully transformer network for change detection of remote sensing images. arXiv 2022. [Google Scholar] [CrossRef] [Scilit]
  162. Chen, H.; Yokoya, N.; Chini, M. Fourier domain structural relationship analysis for unsupervised multimodal change detection. ISPRS J. Photogramm. Remote Sens. 2023, 198, 99–114. [Google Scholar] [CrossRef] [Scilit]
  163. Sublime, J.; Kalinicheva, E. Automatic post-disaster damage mapping using deep-learning techniques for change detection: Case study of the Tohoku tsunami. Remote Sens. 2019, 11, 1123. [Google Scholar] [CrossRef] [Scilit]
  164. Liu, M.; Chai, Z.; Deng, H.; Liu, R. A CNN-transformer network with multiscale context aggregation for fine-grained cropland change detection. IEEE J. Sel. Top. Appl. Earth Obs. Remote Sens. 2022, 15, 4297–4306. [Google Scholar] [CrossRef] [Scilit]
  165. Wang, G.; Li, B.; Zhang, T.; Zhang, S. A network combining a transformer and a convolutional neural network for remote sensing image change detection. Remote Sens. 2022, 14, 2228. [Google Scholar] [CrossRef] [Scilit]
  166. Long, J.; Li, M.; Wang, X.; Stein, A. Semantic change detection using a hierarchical semantic graph interaction network from high-resolution remote sensing images. ISPRS J. Photogramm. Remote Sens. 2024, 207, 318–335. [Google Scholar] [CrossRef] [Scilit]
  167. Zhang, C.; Wang, L.; Cheng, S.; Li, Y. SwinSUNet: Pure transformer network for remote sensing image change detection. IEEE Trans. Geosci. Remote Sens. 2022, 60, 5224713. [Google Scholar] [CrossRef] [Scilit]
  168. Zheng, Z.; Ma, A.; Zhang, L.; Zhong, Y. ChangeMask: Deep multi-task encoder-transformer-decoder architecture for semantic change detection. ISPRS J. Photogramm. Remote Sens. 2022, 183, 228–239. [Google Scholar] [CrossRef] [Scilit]
  169. Zheng, Z.; Zhong, Y.; Wang, J.; Ma, A.; Zhang, L. Building damage assessment for rapid disaster response with a deep object-based semantic change detection framework: From natural disasters to man-made disasters. Remote Sens. Environ. 2021, 265, 112636. [Google Scholar] [CrossRef] [Scilit]
  170. Lu, W.; Wei, L.; Nguyen, M. Bitemporal attention transformer for building change detection and building damage assessment. IEEE J. Sel. Top. Appl. Earth Obs. Remote Sens. 2024, 17, 5765–5778. [Google Scholar] [CrossRef] [Scilit]
  171. Chen, H.; Song, J.; Han, C.; Xia, J.; Yokoya, N. ChangeMamba: Remote sensing change detection with spatio-temporal state space model. IEEE Trans. Geosci. Remote Sens. 2024, 62, 4409720. [Google Scholar] [CrossRef] [Scilit]
  172. Bandara, W.G.C.; Nair, N.G.; Patel, V.M. DDPM-CD: Denoising diffusion probabilistic models as feature extractors for unsupervised change detection. In Proceedings of the IEEE/CVF Winter Conference on Applications of Computer Vision (WACV); IEEE: Piscataway, NJ, USA, 2025; pp. 5250–5262. [Google Scholar] [CrossRef] [Scilit]
  173. Wen, Y.; Ma, X.; Zhang, X.; Pun, M. GCD-DDPM: A generative change detection model based on difference-feature-guided DDPM. IEEE Trans. Geosci. Remote Sens. 2024, 62, 5404416. [Google Scholar] [CrossRef] [Scilit]
  174. Wen, Y.; Zhang, Z.; Cao, Q.; Niu, G. TransC-GD-CD: Transformer-based conditional generative diffusion change detection model. IEEE J. Sel. Top. Appl. Earth Obs. Remote Sens. 2024, 17, 7144–7158. [Google Scholar] [CrossRef] [Scilit]
  175. Liu, Y.; Yue, J.; Xia, S.; Ghamisi, P.; Xie, W.; Fang, L. Diffusion models meet remote sensing: Principles, methods, and perspectives. IEEE Trans. Geosci. Remote Sens. 2024, 62, 4708322. [Google Scholar] [CrossRef] [Scilit]
  176. Andermatt, P.; Timofte, R. A weakly supervised convolutional network for change segmentation and classification. arXiv 2020, arXiv:2011.03577. [Google Scholar] [CrossRef] [Scilit]
  177. Wang, L.; Zhang, M.; Shi, W. CS-WSCDNet: Class activation mapping and segment anything model-based framework for weakly supervised change detection. IEEE Trans. Geosci. Remote Sens. 2023, 61, 5624812. [Google Scholar] [CrossRef] [Scilit]
  178. Kirillov, A.; Mintun, E.; Ravi, N.; Mao, H.; Rolland, C.; Gustafson, L. Segment anything. In Proceedings of the IEEE/CVF International Conference on Computer Vision (ICCV); IEEE: Piscataway, NJ, USA, 2023; pp. 4015–4026. [Google Scholar] [CrossRef] [Scilit]
  179. Zhao, Z.; Wu, C.; Ru, L.; Wang, D.; Chen, H.; Chen, C. Plug-and-play DISep: Separating dense instances for scene-to-pixel weakly-supervised change detection. arXiv 2025, arXiv:2501.04934. [Google Scholar] [CrossRef] [Scilit]
  180. Zhao, Z.; Ru, L.; Wu, C. Exploring effective priors and efficient models for weakly-supervised change detection. arXiv 2024, arXiv:2307.10853. [Google Scholar] [CrossRef] [Scilit]
  181. Lu, B.; Ding, C.; Bi, J.; Song, D. Weakly supervised change detection via knowledge distillation and multiscale sigmoid inference. arXiv 2024, arXiv:2403.05796. [Google Scholar]
  182. Li, Z.; Tang, C.; Liu, X.; Li, C.; Li, X.; Zhang, W. MS-Former: Memory-supported transformer for weakly supervised change detection with patch-level annotations. IEEE Trans. Geosci. Remote Sens. 2024, 62, 5625213. [Google Scholar] [CrossRef] [Scilit]
  183. Wu, C.; Du, B.; Zhang, L. Fully convolutional change detection framework with generative adversarial network for unsupervised, weakly supervised and regional supervised change detection. arXiv 2022, arXiv:2201.06030. [Google Scholar] [CrossRef] [Scilit]
  184. Liu, J.; Luo, H.; Zhang, W.; Liu, F.; Xiao, L. Multiscale self-supervised constraints and change-masks-guided network for weakly supervised change detection. IEEE Trans. Geosci. Remote Sens. 2025, 63, 4701415. [Google Scholar] [CrossRef] [Scilit]
  185. Liu, W.; Yu, Z.; Luo, B. ACWCD: Utilizing inherent transformer information and prior knowledge for weakly supervised change detection. IEEE Trans. Geosci. Remote Sens. 2025, 63, 4402614. [Google Scholar] [CrossRef] [Scilit]
  186. You, Z.H.; Chen, S.B.; Ding, C.; Huang, L.L.; Wang, J.X.; Tang, J.; Luo, B. RCNet: Reliable co-training network for weakly supervised change detection. IEEE Trans. Multimed. 2026, 28, 4956–4969. [Google Scholar] [CrossRef] [Scilit]
  187. Zhao, Z.; Ru, L.; Wu, C.; Wang, D. TransWCD: Scene-adaptive joint constrained framework for weakly supervised change detection. IEEE Trans. Geosci. Remote Sens. 2025, 63, 4702112. [Google Scholar] [CrossRef] [Scilit]
  188. Zheng, Z.; Ma, M.; Zhang, L.; Zhong, Y. Change is everywhere: Single-temporal supervised object change detection in remote sensing imagery. arXiv 2023, arXiv:2108.07002. [Google Scholar]
  189. Li, K.; Cao, X.; Meng, D. A new learning paradigm for foundation model-based remote-sensing change detection. IEEE Trans. Geosci. Remote Sens. 2024, 62, 5610112. [Google Scholar] [CrossRef] [Scilit]
  190. Cong, Y.; Khanna, S.; Meng, C.; Liu, P.; Rozi, E.; He, Y.; Burke, M.; Lobell, D.; Ermon, S. SatMAE: Pre-training transformers for temporal and multi-spectral satellite imagery. Adv. Neural Inf. Process. Syst. 2022, 35, 197–211. [Google Scholar] [CrossRef] [Scilit]
  191. Jakubik, J.; Roy, S.; Phillips, C.E.; Fraccaro, P.; Godwin, D.; Zadrozny, B.; Szwarcman, D.; Gomes, C.; Nyirjesy, G.; Edwards, B.; et al. Foundation models for generalist geospatial artificial intelligence. arXiv 2023, arXiv:2310.18660. [Google Scholar] [CrossRef] [Scilit]
  192. Leonardi, J.; Marsocci, V.; Yordanov, V.; Brovelli, M. Integration of geospatial foundation models in unsupervised change detection workflows for landslide identification. Int. J. Digit. Earth 2025, 18, 2547292. [Google Scholar] [CrossRef] [Scilit]
  193. Gong, M.; Zhou, Z.; Ma, J. Change detection in synthetic aperture radar images based on image fusion and fuzzy clustering. IEEE Trans. Image Process. 2012, 21, 2141–2151. [Google Scholar] [CrossRef] [Scilit] [PubMed]
  194. Gong, M.; Yang, H.; Zhang, P. Feature learning and change feature classification based on deep learning for ternary change detection in SAR images. ISPRS J. Photogramm. Remote Sens. 2017, 129, 212–225. [Google Scholar] [CrossRef] [Scilit]
  195. Gao, F.; Dong, J.; Li, B.; Xu, Q. Automatic change detection in synthetic aperture radar images based on PCANet. IEEE Geosci. Remote Sens. Lett. 2016, 13, 1792–1796. [Google Scholar] [CrossRef] [Scilit]
  196. Saha, S.; Bovolo, F.; Bruzzone, L. Building change detection in VHR SAR images via unsupervised deep transcoding. IEEE Trans. Geosci. Remote Sens. 2021, 59, 1917–1929. [Google Scholar] [CrossRef] [Scilit]
  197. Liu, S.; Marinelli, D.; Bruzzone, L.; Bovolo, F. A review of change detection in multitemporal hyperspectral images: Current techniques, applications, and challenges. IEEE Geosci. Remote Sens. Mag. 2019, 7, 140–158. [Google Scholar] [CrossRef] [Scilit]
  198. Luppino, L.; Bianchi, F.; Moser, G.; Anfinsen, S. Unsupervised image regression for heterogeneous change detection. IEEE Trans. Geosci. Remote Sens. 2019, 57, 9960–9975. [Google Scholar] [CrossRef] [Scilit]
  199. Luppino, L.; Kampffmeyer, M.; Bianchi, F.; Moser, G.; Serpico, S.; Jenssen, R.; Anfinsen, S. Deep image translation with an affinity-based change prior for unsupervised multimodal change detection. IEEE Trans. Geosci. Remote Sens. 2022, 60, 4700422. [Google Scholar] [CrossRef] [Scilit]
  200. Liu, J.; Gong, M.; Qin, K.; Zhang, P. A deep convolutional coupling network for change detection with heterogeneous optical and radar imagery. IEEE Trans. Neural Netw. Learn. Syst. 2018, 29, 545–559. [Google Scholar] [CrossRef] [Scilit] [PubMed]
  201. Luppino, L.T.; Hansen, M.A.; Kampffmeyer, M.; Bianchi, F.M.; Moser, G.; Jenssen, R.; Anfinsen, S.N. Code-aligned autoencoders for unsupervised change detection in multimodal remote sensing images. IEEE Trans. Neural Netw. Learn. Syst. 2024, 35, 60–72. [Google Scholar] [CrossRef] [Scilit] [PubMed]
  202. Sun, Y.; Lei, L.; Guan, D.; Kuang, G. Iterative robust graph for unsupervised change detection of heterogeneous remote sensing images. IEEE Trans. Image Process. 2021, 30, 6277–6291. [Google Scholar] [CrossRef] [Scilit] [PubMed]
  203. Qin, R.; Tian, J.; Reinartz, P. 3D change detection—Approaches and applications. ISPRS J. Photogramm. Remote Sens. 2016, 122, 41–56. [Google Scholar] [CrossRef] [Scilit]
  204. Girardeau-Montaut, D.; Roux, M.; Marc, R.; Thibault, G. Change detection on points cloud data acquired with a ground laser scanner. In Proceedings of the ISPRS Workshop on Object Extraction for 3D City Models, Vienna, Austria, 29–30 August 2005; pp. 30–35. [Google Scholar]
  205. Stilla, U.; Xu, Y. Change detection of urban objects using 3D point clouds: A review. ISPRS J. Photogramm. Remote Sens. 2023, 197, 228–255. [Google Scholar] [CrossRef] [Scilit]
  206. de Gélis, I.; Lefevre, S.; Corpetti, T. Siamese KPConv: 3D multiple change detection from raw point clouds using convolutional neural networks. ISPRS J. Photogramm. Remote Sens. 2023, 196, 274–291. [Google Scholar] [CrossRef] [Scilit]
Figure 1. Temporal distribution of the 144 primary papers reviewed (1980–2026), extracted as discussed in Section 3. An accelerating trend is evident from 2017, coinciding with the maturation of convolutional change detection benchmarks and the emergence of large scale annotated datasets, and peaks in 2022 with 24 papers. The lower counts in the most recent years partly reflect the corpus assembly period rather than a decline in field activity.
Remotesensing 18 02573 g001
Figure 2. Distribution of the 144 primary papers by (a) methodological category and (b) supervision paradigm within the deep learning sub-corpus of 80 papers. Method category follows the section of this review in which each paper is primarily discussed; datasets introducing papers are classified by the method they propose. Deep learning accounts for 56% of the corpus. Within the DL sub-corpus, supervised learning dominates, with the weakly supervised paradigm representing an emerging and practically important research direction.
Remotesensing 18 02573 g002
Figure 3. Distribution of the 144 primary papers by application domain, with each paper assigned a single primary domain; per-paper assignments are reported in Supplementary Materials File S2. “General” denotes papers evaluated on standard binary change detection benchmarks without a specific application focus. Land Use/Land Cover includes vegetation, agriculture, and desertification studies. Urban includes waste site detection. Disaster Assessment groups landslide, flood, wildfire, storm, and tsunami damage applications. Environmental Monitoring encompasses glacier, wetland, seagrass, coral reef, and water body change.
Remotesensing 18 02573 g003
Figure 4. Taxonomic overview of the dominant change detection method families covered in this review. The three top-level branches correspond to the three methodological epochs reviewed in Section 5, Section 6 and Section 7. For clarity, only the most representative leaf-level families are shown; additional architectures such as Mamba/SSM, diffusion models, patch-level weakly supervised methods, and object-based image analysis are discussed in the corresponding sections of the text. In the probabilistic branch, MRF and CRF denote Markov and conditional random fields, respectively.
Remotesensing 18 02573 g004
Figure 5. PRISMA 2020 flow diagram of the study identification and selection process. a Two-stage assessment: automated eligibility criteria (topical keyword match, non-zero citation count, exclusion of review articles and dataset-only descriptors, retention balanced across method families) followed by full-text reading; because automated decisions were verified manually and subject to override, exclusions are reported jointly (see text). No sought report was unretrievable (n = 0 in both arms): the open-access filter guaranteed full-text availability on the database route, and other-methods records were already in the authors’ possession.
Remotesensing 18 02573 g005
Figure 6. Technical roadmap of the three change detection paradigms reviewed. Each lane traces the internal methodological progression of one paradigm from left to right, with representative method families and example methods; the paradigms are developed in Section 5, Section 6 and Section 7. The dashed arrow marks the representational shift from hand-engineered features with a separate classifier to end-to-end learned representations, and the bottom axis summarizes the trend toward less hand-engineering, richer learned representations, and higher supervision cost.
Remotesensing 18 02573 g006
Figure 7. Performance progression on the LEVIR-CD+ benchmark by architectural paradigm, plotted from the mutually comparable single-protocol scores in the upper block of Table 3 [171]. The dashed line indicates the approximate linear trend.
Remotesensing 18 02573 g007
Table 1. Positioning of this review against the principal prior change detection surveys. ✓ substantive coverage; (✓) partial or in-isolation coverage; – not covered. Class.: classical statistical and machine-learning methods; DL gen.: FCN/Siamese, attention, and Transformer generations; Mamba/Diff.: state-space and diffusion architectures; Label-eff.: weakly-, semi-, and self-supervised paradigms treated as a primary subject; Quant.: cross-benchmark numerical comparison with source-provenance labeling; Syst.: PRISMA-conformant search protocol.
ReviewYearPrimary FocusClass.DL Gen.Mamba/Diff.Label-Eff.Quant.Syst.
Lu et al. [2]2004Pre-DL techniques
Hussain et al. [24]2013Pixel- versus object-based
Shi et al. [7]2020AI/DL-based CD(✓)
Khelifi and Mignotte [3]2020DL by supervision(✓)(✓)
Jiang et al. [8]2022High-resolution DL(✓)
Shafique et al. [9]2022DL by modality(✓)
Bai et al. [10]2023Why DL outperforms(✓)
Parelius [11]2023Multi-spectral DL(✓)
Wang et al. [12]2024DL by learning paradigm
Jiang et al. [18]2024Multisource CD(✓)(✓)
Saidi et al. [19]2024Multi-modal fusion(✓)
Yu et al. [14]2024Foundation models(✓)(✓)
Peng et al. [15]2025Label-efficient CD
Lv et al. [20]2025Hyperspectral CD(✓)(✓)
Yu et al. [16]2025Comprehensive DL CD(✓)(✓)
Lei et al. [17]2026Comprehensive DL CD(✓)(✓)
Bao et al. [21]2026Vision Mamba (RS-wide)
This review2026Full arc + synthesis
Table 3. Performance on the LEVIR-CD family. Upper block: methods re-evaluated by Chen et al. [171] on LEVIR-CD+ (985 pairs, 1024 × 1024 ) under a single protocol; Lower block: original-publication scores on LEVIR-CD ( 256 × 256 patches, 7120/1024/2048 train/val/test), not comparable with the upper block. Best values in bold. OP: original publication; RE: re-evaluation.
MethodParadigmPrec.Rec. F 1 OAIoUSource
LEVIR-CD+, consistent protocol [171]
FC-EF [111]CNN (early fusion)69.1271.7770.4297.5454.34RE
FC-Siam-Conc [111]CNN Siamese78.3978.4978.4498.2464.53RE
SNUNet [113]CNN Siamese71.0778.7374.7097.8359.62RE
HANet [124]CNN Siamese79.7075.5377.5698.2263.34RE
CGNet [126]CNN Siamese81.4686.0283.6898.6371.94RE
DSIFN [43]CNN (fusion)83.7884.3684.0798.7072.52RE
BIT-101 [142]CNN+Transformer83.9181.2082.5398.6070.26RE
ChangeFormerV3 [146]CNN+Transformer81.3479.9780.6598.4467.58RE
SwinSUNet [167]Pure Transformer85.3485.8585.6098.9274.82RE
MambaBCD-Tiny [171]Mamba/SSM85.5181.7983.6198.6971.83OP
MambaBCD-Small [171]Mamba/SSM89.1786.4987.8199.0278.27OP
MambaBCD-Base [171]Mamba/SSM89.2487.5788.3999.0679.20OP
LEVIR-CD, original-publication scores (not mutually comparable)
AGCDetNet [129]CNN (early fusion)92.1289.4590.7683.09OP
HANet [124]CNN Siamese91.2189.3690.2899.0282.27OP
CGNet [126]CNN Siamese93.1590.9092.0185.21OP
DESSN [121]CNN Siamese90.9991.7391.36OP
USSFC-Net [119]Lightweight CNN89.7092.4291.04OP
MTCNet [143]CNN+Transformer90.8589.6290.2497.0282.22OP
SUACDNet [120]CNN Siamese92.5891.4091.99OP
TinyCD [123]Lightweight CNN92.6889.4791.0599.1083.57OP
ChangeFormer [146]CNN+Transformer92.0588.8090.4099.0482.48OP
FTN [161]Pure Transformer92.7189.3791.0199.0683.51OP
UVACD [165]CNN+Transformer91.9090.7091.3099.1283.98OP
MDANet [47]CNN Siamese90.9990.3590.6782.94OP
AMFNet [141]CNN Siamese94.7791.1590.7999.0783.13OP
Table 4. Performance on WHU-CD. All scores are drawn from the single re-evaluation of Chen et al. [171], in which every method was trained and evaluated under one protocol. Best results in bold. OP: original publication; RE: re-evaluation.
MethodParadigmPrec.Rec. F 1 OAIoUSource
FC-EF [111]CNN (early fusion)83.5086.3384.8998.8773.74RE
SNUNet [113]CNN Siamese88.0487.3687.7099.1078.09RE
BIT [142]CNN+Transformer89.8390.2490.0499.2781.88RE
HANet [124]CNN Siamese88.3088.0188.1699.1678.82RE
SwinSUNet [167]Pure Transformer94.0892.0393.0499.5087.00RE
CGNet [126]CNN Siamese94.4790.7992.5999.4886.21RE
MambaBCD-Tiny [171]Mamba/SSM94.7691.9493.3399.5287.49OP
MambaBCD-Small [171]Mamba/SSM95.9092.2994.0699.5788.79OP
MambaBCD-Base [171]Mamba/SSM96.1892.2394.1999.5889.02OP
Table 5. Performance on CDD. Upper block: eight methods re-evaluated by Li et al. [147] under a single protocol, reported as mean ± standard deviation over repeated runs; these scores are mutually comparable. Lower block: original-publication scores reported by the authors of each method on CDD, obtained under their own protocols and therefore not mutually comparable nor comparable with the upper block. Best values are marked in bold. OP: original publication; RE: re-evaluation.
MethodParadigmPrec.Rec. F 1 OASource
Consistent protocol [147]
FC-Siam-Conc [111]CNN Siamese84.43 ± 1.2567.84 ± 1.2775.22 ± 0.6094.63 ± 0.12RE
FC-Siam-Diff [111]CNN Siamese87.51 ± 0.6959.83 ± 0.3471.07 ± 0.3094.15 ± 0.07RE
STANet [39]CNN Siamese (attn.)88.79 ± 0.1593.99 ± 0.4591.31 ± 0.1497.85 ± 0.03RE
DASNet [117]CNN Siamese (attn.)93.62 ± 0.1492.14 ± 0.0792.88 ± 0.0798.30 ± 0.02RE
BIT [142]CNN+Transformer95.89 ± 0.2092.48 ± 0.3894.16 ± 0.1398.62 ± 0.03RE
ICIF-Net [154]CNN+Transformer96.46 ± 0.2593.57 ± 0.4194.99 ± 0.0998.82 ± 0.02RE
SNUNet/32 [113]CNN Siamese96.97 ± 0.0894.16 ± 0.2295.54 ± 0.0898.94 ± 0.02RE
ConvTransNet [147]CNN+Transformer97.59 ± 0.1694.64 ± 0.1196.09 ± 0.0899.08 ± 0.02OP
Original-publication scores (not mutually comparable)
SNUNet-CD/16 [113]CNN Siamese94.3091.6092.90OP
DESSN [121]CNN Siamese95.0488.7791.80OP
SwinSUNet [167]Pure Transformer95.7092.3094.0098.50OP
MDANet [47]CNN Siamese (attn.)85.5994.0389.61OP
USSFC-Net [119]Lightweight CNN93.4596.0894.74OP
SUACDNet [120]CNN Siamese (attn.)97.8498.2398.04OP
Table 6. Performance on SYSU-CD. Upper block: methods re-evaluated by Chen et al. [171] under a single protocol; these rows are mutually comparable, and best values are marked in bold within this block only. Lower block: original-publication score obtained under a different protocol, not comparable with the upper block. OP: original publication; RE: re-evaluation.
MethodParadigmPrec.Rec. F 1 OAIoUSource
Consistent protocol [171]
FC-EF [111]CNN (early fusion)76.4775.1775.8188.6961.04RE
FC-Siam-Diff [111]CNN Siamese76.2875.3075.7988.6561.01RE
FC-Siam-Conc [111]CNN Siamese73.6776.7575.1888.0560.23RE
SNUNet [113]CNN Siamese74.0972.2173.1487.4957.66RE
HANet [124]CNN Siamese78.7176.1477.4189.5263.14RE
DSIFN [43]CNN (fusion)75.8382.0278.8089.5965.02RE
CGNet [126]CNN Siamese86.3774.3779.9291.1966.55RE
ChangeFormerV4 [146]CNN+Transformer79.7477.9078.8190.1265.03RE
BIT-18 [142]CNN+Transformer84.8576.4280.4191.2267.24RE
SwinSUNet [167]Pure Transformer83.5079.7581.5891.5168.89RE
MambaBCD-Tiny [171]Mamba/SSM83.0679.5981.2991.3668.48OP
MambaBCD-Small [171]Mamba/SSM87.9978.2582.8392.3570.70OP
MambaBCD-Base [171]Mamba/SSM86.1180.3183.1192.3071.10OP
Original-publication score (not mutually comparable)
AMFNet [141]CNN Siamese (attn.)88.2382.5182.2592.3069.85OP
Table 7. Performance on S2Looking. All methods are evaluated by Han et al. [126] under a single protocol; CGNet is the authors’ own method, marked OP. Best values in bold. OP: original publication; RE: re-evaluation.
MethodParadigmPrec.Rec. F 1 Source
IFNet/DSIFN [43]CNN (fusion)21.3933.3526.07RE
FC-Siam-Diff [111]CNN Siamese83.4932.3246.60RE
STANet-PAM [39]CNN Siamese (attn.)36.4068.2047.50RE
SNUNet [113]CNN Siamese45.2550.6047.78RE
HANet [124]CNN Siamese61.3855.9458.54RE
BIT [142]CNN+Transformer70.2656.5362.65RE
ChangeFormer [146]CNN+Transformer72.8256.1363.39RE
CGNet [126]CNN Siamese70.1859.3864.33OP
Table 8. Performance on GZ-CD. All scores are drawn from the comparison of Feng et al. [154], in which every method was trained and evaluated under one protocol; the values are therefore mutually comparable. Note that the best-performing method in the table is also the source of the comparison. Best results in bold. OP: original publication; RE: re-evaluation.
MethodParadigmPrec.Rec. F 1 IoUOASource
FC-EF [111]CNN (early fusion)81.2968.6174.4159.2595.74 RE
FC-Siam-Diff [111]CNN Siamese80.3661.8069.8753.6995.19RE
FC-Siam-Conc [111]CNN Siamese80.3768.9774.2359.0395.68RE
DSIFN [43]CNN (fusion)87.3964.5777.6563.4796.64RE
DTCDSCN [118]CNN Siamese (attn.)86.0873.8679.5166.0196.56RE
SNUNet [113]CNN Siamese85.8179.6383.3271.8897.19RE
BIT [142]CNN+Transformer86.0075.8580.6167.5296.71RE
ICIF-Net [154]CNN+Transformer90.1781.5785.6574.9197.53OP
Table 9. Parameter count and computational cost of the LEVIR-CD+ architectures of Table 3, reported under the single-source evaluation of Chen et al. [171]. F 1 (%) on LEVIR-CD+ is reproduced from Table 3 for reference. Type: C CNN-based, H CNN–Transformer hybrid, T pure Transformer, M Mamba/state space.
MethodTypeParams (M)GFLOPs F 1
FC-EFC1.3514.1370.42
FC-Siam-ConcC1.5421.0778.44
HANetC2.6170.6877.56
SNUNetC10.21176.3674.70
CGNetC33.68329.5883.68
DSIFNC35.73329.0384.07
ChangeFormerV3H24.3033.6880.65
BIT-101H43.27380.6282.53
SwinSUNetT39.2843.5085.60
MambaBCD-TinyM17.1345.7483.61
MambaBCD-SmallM49.94114.8287.81
MambaBCD-BaseM84.70179.3288.39
Disclaimer/Publisher’s Note: The statements, opinions and data contained in all publications are solely those of the individual author(s) and contributor(s) and not of MDPI and/or the editor(s). MDPI and/or the editor(s) disclaim responsibility for any injury to people or property resulting from any ideas, methods, instructions or products referred to in the content.