Article

Intensifying Drought Under a Warming–Wetting Climate: Multi-Scale Impacts on Vegetation Phenology and Productivity in Xinjiang, China


1
College of Grassland Science, Xinjiang Agricultural University, Urumqi 830052, China
2
Key Laboratory of Ecological Safety and Sustainable Development in Arid Lands, Xinjiang Institute of Ecology and Geography, Chinese Academy of Sciences, Urumqi 830011, China
3
University of Chinese Academy of Sciences, Beijing 100049, China
*
Author to whom correspondence should be addressed.
Remote Sens. 2026, 18(14), 2285; https://doi.org/10.3390/rs18142285
Submission received: 10 April 2026 / Revised: 30 June 2026 / Accepted: 3 July 2026 / Published: 8 July 2026
(This article belongs to the Special Issue Hydrometeorological Modelling Based on Remotely Sensed Data)

Highlights

What are the main findings?
  • Xinjiang exhibits a warming–wetting trend, while drought frequency and intensity have increased since 1997, with strong spatial heterogeneity in southern Xinjiang.
  • Vegetation phenology shows a marked shift, characterized by earlier spring onset and longer growing seasons, whereas intense drought conditions tend to delay green-up.
  • These interactions suggest that phenology acts as a key regulator linking climate variability and ecosystem functioning in arid regions.
What is the implication of the main finding?
  • The interactive mechanism between drought and vegetation phenology—where phenological shifts modify both carbon uptake windows and water consumption—represents a critical pathway linking climate variability to ecosystem carbon dynamics in arid regions.
  • These findings highlight the need for adaptive water and vegetation management that considers both direct drought impacts and phenologically mediated feedback on ecosystem productivity.

Abstract

Drought poses a major threat to ecosystem stability in arid regions. In Xinjiang, China, vegetation dynamics are highly sensitive to hydroclimatic variability, yet the evolution of drought and its ecological impacts remain insufficiently quantified. Using meteorological observations from 86 stations (1962–2021), drought dynamics were characterized using the Standardized Precipitation Evapotranspiration Index (SPEI) combined with run theory, while MODIS products (2001–2021) were used to quantify vegetation phenology and productivity. Results indicate that despite a regional warming–wetting trend, more than 97% of Xinjiang exhibits a significant increase in drought frequency and intensity after 1997, with pronounced spatial heterogeneity concentrated in southern Xinjiang. Vegetation phenology shows a significant shift, with spring onset advancing at a rate of −1.9 days decade−1 and growing season length increasing by +3.8 days decade−1. Vegetation productivity derived from MODIS shows strong spatial variability, with GPP and NPP exhibiting consistent increasing trends, particularly in northern Xinjiang. Multi-scale analysis reveals strong scale dependence in drought–vegetation interactions, where short-term drought (SPEI-3 and SPEI-6) exerts the strongest influence on vegetation dynamics, while long-term drought (SPEI-12) primarily controls ecosystem stability and post-drought recovery. Correlation and extreme-event analyses further indicate that seasonal drought and phenological shifts jointly regulate ecosystem productivity by altering water availability and carbon uptake periods. These results highlight a warming–wetting but drought-intensifying regime in Xinjiang and emphasize the dominant role of seasonal drought in regulating vegetation functioning under climate change.

1. Introduction

Drought is one of the most destructive climate hazards under global climate change, particularly in arid and semi-arid regions where increasing frequency and intensity pose severe threats to ecosystem stability and sustainable development [1,2]. Xinjiang, located in the arid core of Central Asia, is characterized by complex topography and highly heterogeneous hydrothermal conditions [3,4,5]. Precipitation is scarce and unevenly distributed, making the region highly sensitive to climate variability. In recent decades, despite a general warming accompanied by increased precipitation, the frequency and intensity of drought events have continued to rise [6,7]. This apparent contradiction not only affects regional water availability and agricultural production but also fundamentally alters vegetation growth and ecosystem carbon cycling [8,9]. However, the mechanisms linking multi-scale drought characteristics to vegetation responses remain insufficiently quantified in arid regions.
Conventional drought indices such as the Standardized Precipitation Index (SPI) primarily rely on precipitation variability and neglect the increasing atmospheric evaporative demand under warming conditions, potentially underestimating drought severity [10,11]. In contrast, the Standardized Precipitation Evapotranspiration Index (SPEI) integrates both precipitation and potential evapotranspiration, providing a more comprehensive representation of climatic water balance [12,13]. Moreover, its multi-scale structure enables the characterization of agricultural, ecological, and hydrological drought processes [14]. Although SPEI has been widely applied, most studies in Xinjiang focus on overall drought trends, with limited attention to systematic quantification of drought attributes such as duration, intensity, and severity across different time-scales [15,16,17,18,19].
Vegetation responses to drought constitute a key component of climate change impacts [20]. Drought stress reduces soil moisture availability, suppresses photosynthesis, alters phenological timing, and weakens carbon sequestration capacity [21,22]. Previous studies have demonstrated that drought impacts are strongly scale-dependent, with short-term drought affecting water-use efficiency and long-term drought exerting more persistent constraints on ecosystem productivity [23,24,25]. In addition, lagged and cumulative drought effects often exceed concurrent impacts, highlighting the importance of temporal dynamics [26,27]. Although extended growing seasons and increased productivity have been observed in many regions, ecosystem resilience under recurrent drought remains poorly understood in arid environments.
In this study, vegetation phenological shift is defined as the integrated change in the timing of vegetation development, including earlier start of season (SOS), delayed end of season (EOS), and consequent extension of length of season (LOS). This definition moves beyond representing phenological shift solely by changes in LOS and provides a more comprehensive framework for understanding vegetation responses to drought. Vegetation phenology was incorporated into this study because it represents a key intermediary process linking climate variability (especially drought) and ecosystem carbon cycling in arid and semi-arid regions. Phenological metrics directly regulate the duration and timing of photosynthetic activity, thereby controlling carbon uptake periods and ecosystem productivity. Incorporating phenology enables us to bridge climate variability (drought dynamics) and carbon flux responses (GPP and NPP), thereby providing a more mechanistic understanding of how drought influences ecosystem functioning through temporal restructuring of vegetation growth periods.
Xinjiang hosts diverse ecosystems, including forests, grasslands, deserts, and wetlands, which play a critical role in regional carbon cycling. However, existing studies often consider single climatic drivers or isolated vegetation indicators, lacking an integrated assessment of how multiple drought characteristics influence vegetation phenology and productivity [28,29]. In particular, the scale-dependent impacts of drought on key phenological metrics—start of season (SOS), end of season (EOS), and length of season (LOS)—as well as on carbon fluxes (GPP and NPP), remain unclear [30,31,32,33,34]. Furthermore, the cumulative effects of extreme drought events and their legacy impacts on vegetation recovery require further investigation.
To address these gaps, this study conducts a comprehensive multi-scale assessment of drought evolution and its ecological impacts in Xinjiang. Using long-term meteorological observations (1962–2021), SPEI and run theory are employed to quantify drought characteristics across multiple time-scales. Multi-source remote sensing data are further integrated to analyze vegetation phenology and productivity from 2000 to 2022. By coupling drought characteristics with vegetation responses, this study aims to (i) identify the warming–wetting yet drought-intensifying paradox, (ii) quantify the dominant role of seasonal drought in regulating vegetation dynamics, and (iii) provide a scientific basis for ecosystem management and climate adaptation in arid regions, and (iv) clarify the mechanistic interaction between drought and vegetation phenology, specifically how phenological shifts mediate drought impacts on carbon uptake.

2. Materials and Methods

2.1. Study Area

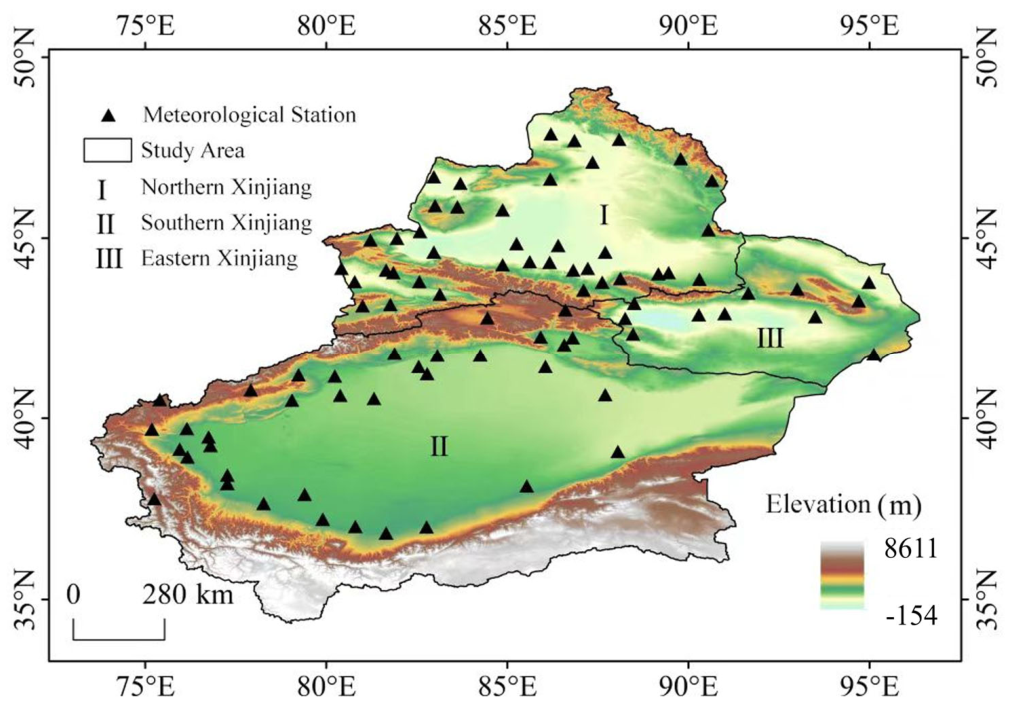
Xinjiang is located in the arid core of Central Asia, covering approximately 1.66 × 10⁶ km2 between 73–96°E and 34–49°N (Figure 1). It is one of the most typical inland arid regions in the world and exhibits a distinctive “three mountains and two basins” topographic pattern, consisting of the Altai Mountains in the north, the Tianshan Mountains in the center, and the Kunlun Mountains in the south, which enclose the Junggar Basin and the Tarim Basin. Elevation ranges from −154 m in the Turpan Depression to over 7000 m in high mountain regions, forming pronounced climatic and hydrological gradients.
The region is dominated by inland river systems, including the Tarim River, Ili River, Irtysh River, and several tributaries originating from mountainous areas. These rivers are primarily sustained by mountain precipitation, glacier meltwater, and seasonal snowmelt, supporting oasis ecosystems distributed along river corridors. Although oasis areas occupy a relatively small proportion of the total land area, they sustain the majority of regional population and economic activities, highlighting the critical role of water resources in this arid environment [35].
Climatically, Xinjiang is mainly controlled by the mid-latitude westerlies, with limited influence from the Asian monsoon system, resulting in scarce and unevenly distributed precipitation. Mean annual precipitation is generally below 200 mm in basin regions but can exceed 500 mm in mountainous areas, while potential evapotranspiration is extremely high (typically 1000–3000 mm yr−1). Mean annual temperature varies significantly with elevation and location, generally ranging from 5 to 14 °C. These conditions create a highly fragile eco-hydrological system characterized by strong spatial heterogeneity and high sensitivity to climate variability [36].
Over recent decades, Xinjiang has experienced significant climate change characterized by rapid warming and a slight increase in precipitation. However, the intensification of extreme drought events and increasing evaporative demand have offset the humidification effect, leading to enhanced drought risk across the region. The combination of complex terrain, limited water resources, and diverse ecosystems—including forests, grasslands, deserts, and wetlands—makes Xinjiang an ideal natural laboratory for investigating drought dynamics and their impacts on vegetation phenology and ecosystem productivity under climate change.

2.2. Datasets

Meteorological and remote sensing datasets were integrated to support the multi-scale analysis of drought evolution and vegetation responses in Xinjiang. Daily temperature and precipitation data from 1962 to 2021 were obtained from 86 national meteorological stations across Xinjiang, sourced from the China Meteorological Data Service Center (http://data.cma.cn/, accessed on 10 June 2025). Stations were selected based on data continuity and quality to ensure robust long-term analysis. Prior to analysis, standard quality-control procedures, including outlier screening and consistency checks, were applied to minimize uncertainties associated with observational errors. Based on the processed temperature and precipitation data, potential evapotranspiration (PET) was estimated using the Penman–Monteith method. The Standardized Precipitation Evapotranspiration Index (SPEI) was then calculated at multiple time-scales (1-, 3-, 6-, 12-, and 24-month) to characterize drought variability, intensity, and temporal evolution. In this study, SPEI was derived using the entire available observation period (1962–2021) to construct a consistent statistical baseline for standardization. This approach ensures that drought conditions are expressed as standardized anomalies relative to the long-term regional climatic distribution, and allows for direct comparability across different time scales and sub-periods. No separate baseline or truncated reference period was applied. Therefore, the resulting SPEI time series reflect relative wetness–dryness conditions under a unified climatological framework, rather than deviations from a predefined historical reference sub-period.
To quantify vegetation dynamics, multiple Moderate Resolution Imaging Spectroradiometer (MODIS) products were employed. Gross Primary Productivity (GPP) data were derived from the MOD17A2H product (500 m spatial resolution), provided by NASA’s Land Processes Distributed Active Archive Center (LP DAAC) (https://lpdaac.usgs.gov/products/mod17a2hv006/, accessed on 15 June 2025). Net Primary Productivity (NPP) was obtained from the MOD17A3HGF.061 product (500 m resolution) (https://developers.google.com/earth-engine/datasets/catalog/MODIS_061_MOD17A3HGF, accessed on 15 June 2025). Vegetation phenology metrics, including the start of season (SOS), end of season (EOS), and length of season (LOS), were extracted from the MCD12Q2.061 product (500 m resolution) (https://developers.google.com/earth-engine/datasets/catalog/MODIS_061_MCD12Q2, accessed on 15 June 2025). These datasets are derived from MODIS observations and have been widely validated for applications in ecosystem productivity, phenological dynamics, and climate–vegetation interaction studies.
Vegetation phenology was characterized using the MODIS MCD12Q2 Version 6.1 Land Cover Dynamics product at a spatial resolution of 500 m. Three phenological metrics were extracted: Start of Season (SOS, using the Greenup_DOY variable), End of Season (EOS, using the Dormancy_DOY variable), and Length of Season (LOS, calculated as EOS − SOS). Only the primary growing season was considered. Quality assurance (QA) information provided in the MCD12Q2 product was used to exclude low-quality observations and unreliable retrievals. Pixels were retained only if the QA flag indicated high or medium reliability. Pixels with invalid phenological records or poor-quality flags were removed prior to analysis. Extreme SOS/EOS values (>3 standard deviations from the regional mean) were discarded to reduce noise from spurious signals. For pixels with multiple growing seasons, only the main season with the largest NDVI amplitude was used. To minimize uncertainties associated with sparsely vegetated desert areas, only vegetated pixels (annual maximum NDVI ≥ 0.1) were retained for subsequent calculations. Annual SOS, EOS, and LOS maps were then aggregated to the regional scale, and temporal trends were quantified using Sen’s slope estimator and the Mann–Kendall significance test.

2.3. Calculation of Drought Indices

The Standardized Precipitation Evapotranspiration Index (SPEI) was employed to characterize drought conditions in Xinjiang due to its ability to incorporate both precipitation deficits and temperature-driven evaporative demand, making it particularly suitable under climate warming scenarios. Compared with the Standardized Precipitation Index (SPI), SPEI provides a more comprehensive representation of climatic water balance while retaining multi-scale characteristics [37,38].
The SPEI calculation process involves the following four steps:
(1)
Calculate the climatic water balance, with the climatic water balance ( D i ) being the difference between precipitation ( P i ) and potential evapotranspiration ( P E T i ):
D i = P i P E T i
(2)
Establish the cumulative series of climatic water balance at different time scales:
D n k = i = 0 k i (   P n i P E T n i ) , n k
where k is the time scale (usually month) and n is the number of calculations.
(3)
Build a data series using the log-logistic probability density function fitting:
f ( x ) = β α ( x γ α ) β 1 [ 1 + ( x γ α ) β ] 2
where α is the scale coefficient, β is the shape coefficient, and γ is the origin parameter, which can be obtained by the L-moment parameter estimation method.
(4)
Transform the cumulative probability density into a standard normal distribution to obtain the corresponding SPEI time change sequence:
S P E I = w c o + c 1 w + c 2 w 2 1 + d 1 w + d 2 w 2 + d 3 w 3
where w = [−2ln(P)]1/2, when P ≤ 0.5, P = 1 − F(x); when P > 0.5, P = 1 − P i , c o = 2.515517; c 1 = 0.802853; c 2 = 0.010380; d 1 = 1.432788; d 2 = 0.189 269; d 3 = 0.001308.

2.4. Identification and Feature Extraction of Drought Events

Drought events were identified based on SPEI thresholds and extracted using run theory. A drought event was defined as a period of at least two consecutive months with SPEI values below −0.5. Drought severity was classified into four levels: mild drought (SPEI ≤ −0.5), moderate drought (SPEI ≤ −1.0), severe drought (SPEI ≤ −1.5), and extreme drought (SPEI ≤ −2.0) [39]. Four key drought characteristics were quantified: (i) frequency, defined as the number of drought months per year; (ii) duration, defined as the number of consecutive months within a drought event; (iii) intensity, defined as the mean SPEI value during a drought event; and (iv) severity, defined as the cumulative SPEI deficit over the event period. To ensure spatial continuity, drought characteristics were interpolated using the inverse distance weighting (IDW) method for regional pattern analysis. This framework enables a comprehensive characterization of drought dynamics and facilitates the linkage between drought processes and vegetation responses across multiple temporal scales.

2.5. Statistical Analysis

Trend analysis: All temporal trends (temperature, precipitation, SPEI, GPP, and NPP) were quantified using the Mann–Kendall (MK) non-parametric test, and trend magnitudes were estimated using Sen’s slope estimator. Statistical significance was assessed at p < 0.05.
Change-point detection: Abrupt changes in hydroclimatic time series (e.g., the turning points around 1987 and 1997) were identified using a Bayesian change-point detection method, which allows probabilistic estimation of structural breaks in time series by evaluating the posterior probability of change points.
Correlation analysis: Relationships between drought, vegetation phenology, and productivity were quantified using Pearson correlation coefficients (after normality testing), with results verified using Spearman correlation to ensure robustness. Analyses were conducted at the pixel level and station-aggregated regional mean level to capture both spatial heterogeneity and regional response patterns. Monthly and seasonal SPEI values were matched with corresponding phenological and productivity metrics. Lagged correlations (0–12 months) were also tested to account for delayed vegetation responses to drought. Statistical significance was assessed at p < 0.05, with t-tests applied to correlation coefficients.

2.6. Quantification of Vegetation Resistance and Resilience to Drought

Following established frameworks, resistance (Rt) quantified as the difference between the spectral index value during the focal drought period (VIdrought, 2007–2008 average) and the pre-drought baseline (VIpre-drought, 2006 reference year):
Rt = VIdroughtVIpre-drought
Recovery ( R c ) Quantified as the difference between the spectral index in the i th post-drought recovery year ( V I r e c o v e r y , i , where i = 1, 2, 3 corresponds to 2009, 2010, 2011) and the drought-disturbed state, tracking ecosystem drought legacy effects that typically last 3 to 4 years:
R c , i   =   V I r e c o v e r y , i     V I d r o u g h t  

3. Results

3.1. Spatiotemporal Trends in Temperature and Precipitation

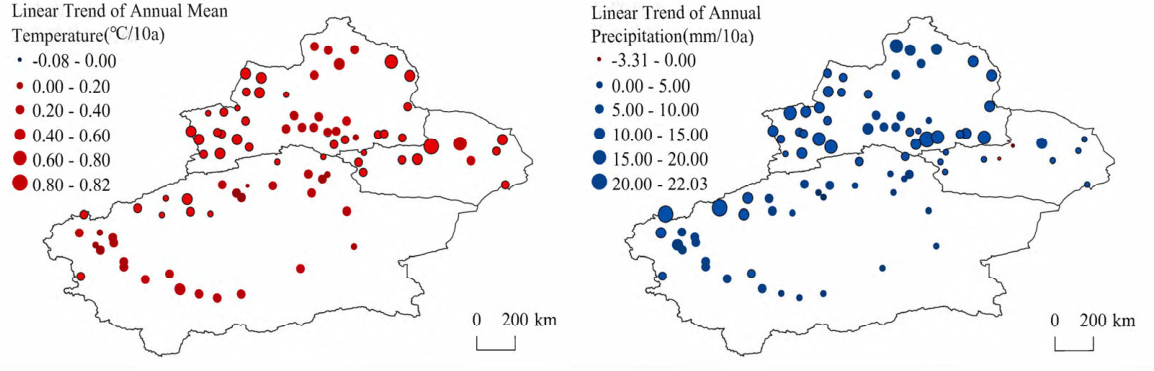
From 1962 to 2021, Xinjiang exhibited a significant warming and humidification trend. Annual mean temperature increased at a rate of 0.31 °C decade−1 (p < 0.01), while annual precipitation increased by 8.01 mm decade−1 (p < 0.01). More than 97% of meteorological stations showed increasing trends in both temperature and precipitation, indicating a consistent regional warming–wetting pattern (Figure 2). Spatially, warming displayed pronounced heterogeneity. The most significant temperature increases were observed in northern and eastern Xinjiang, with the highest warming rate recorded at Shisanjianfang station (0.82 °C decade−1). In contrast, only a few stations exhibited slight cooling trends, such as Kuqa station in southern Xinjiang (−0.08 °C decade−1), which did not alter the overall warming pattern.
Precipitation changes also exhibited strong spatial variability. Significant increases were concentrated in northern Xinjiang and the western part of southern Xinjiang, with Ürümqi station showing the largest increase (22.03 mm decade−1). In contrast, eastern Xinjiang experienced decreasing precipitation trends, particularly at Shisanjianfang and Turpan stations (−3.31 and −0.24 mm decade−1, respectively), revealing a distinct spatial pattern characterized by “increase in the north and west, and decrease in the east”. Further analysis revealed notable phase shifts in hydrothermal conditions. Change-point detection identified a significant increase in precipitation around 1987, followed by an abrupt temperature rise around 1997. This asynchronous evolution resulted in three distinct climatic regimes: a cold–dry period (1962–1987), a transitional cold–wet period (1988–1996), and a warm–wet period (1997–2021). These regime shifts highlight the nonlinear evolution of climate dynamics in Xinjiang.

3.2. Spatiotemporal Evolution of Drought Characteristics

Drought characteristics in Xinjiang exhibited strong dependence on temporal scale, as revealed by the multi-scale SPEI analysis combined with run theory. With increasing time-scale, drought duration and severity increased markedly, while drought frequency decreased. Specifically, the median drought severity and duration increased from −3.18 and 2.07 months at the SPEI-1 scale to −7.32 and 4.40 months at the SPEI-12 scale, respectively. This indicates a clear scale-dependent pattern, with long-term droughts characterized by greater severity and longer duration, whereas short-term droughts occur more frequently but with lower intensity.
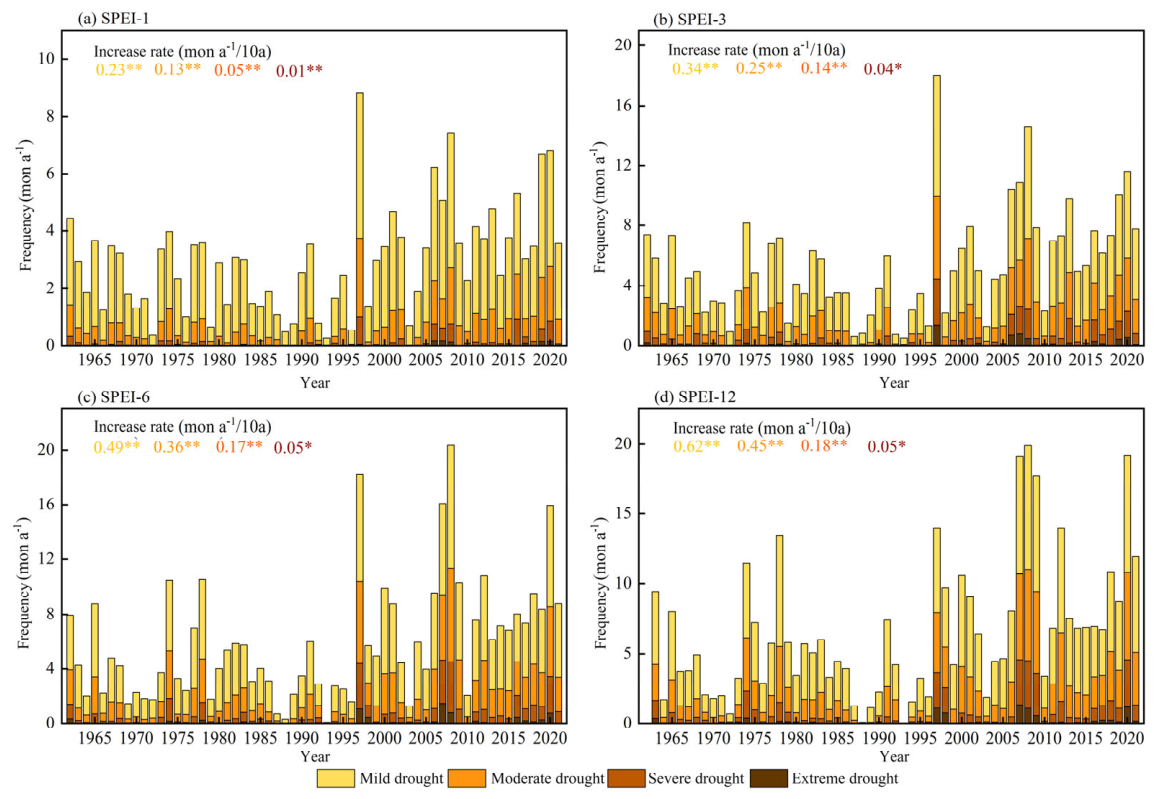
Over the period 1962–2021, drought characteristics exhibited pronounced interannual variability, with 1997 identified as a critical turning point. After 1997, Xinjiang entered a persistent drying phase, during which all drought metrics—including frequency, duration, intensity, and severity—showed significant increasing trends across multiple time-scales (Figure 3). This confirms a substantial intensification of drought conditions despite the overall warming–wetting background. From the perspective of drought severity classes, the occurrence frequency of mild, moderate, severe, and extreme droughts all increased significantly. The most pronounced increases were observed at the SPEI-12 scale, with growth rates of 0.62, 0.45, 0.18, and 0.05 months year−1 decade−1 for mild, moderate, severe, and extreme droughts, respectively, indicating a systematic intensification across all drought categories.
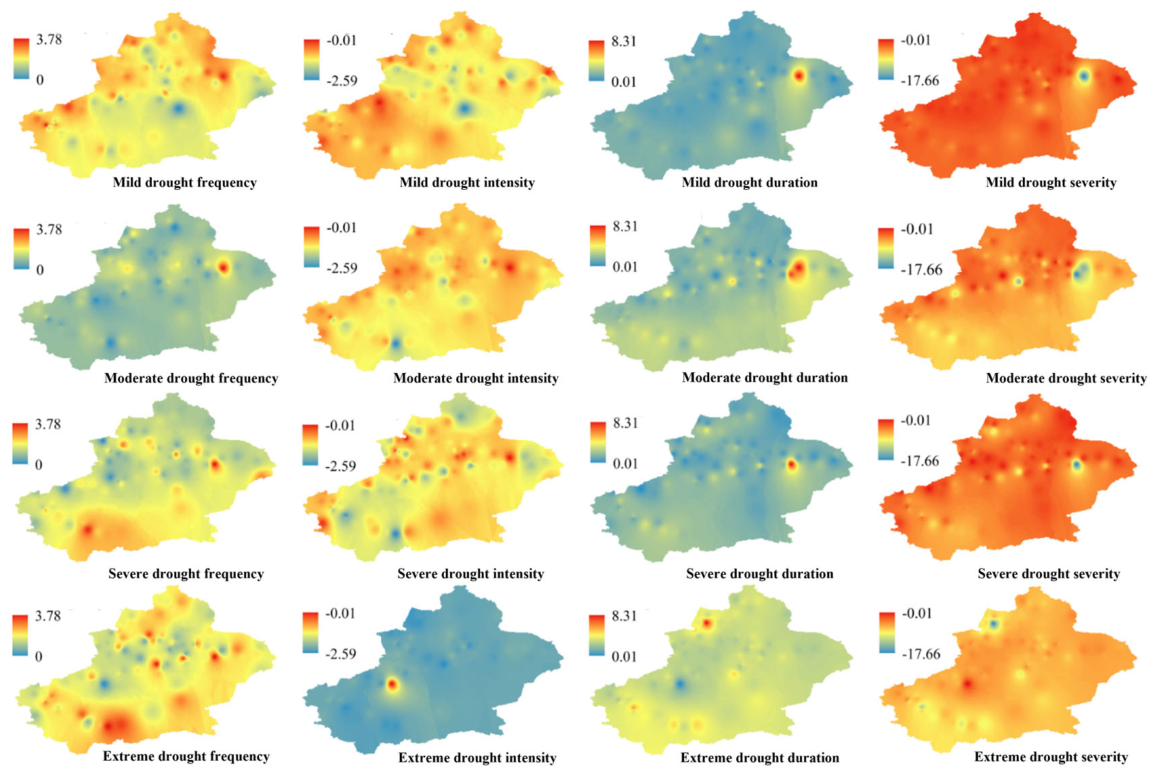
Spatially, drought stress was substantially stronger in southern Xinjiang. At the SPEI-3 scale, the annual frequencies of mild, moderate, severe, and extreme droughts reached 3.3, 1.5, 0.5, and 0.1 months year−1, respectively (Figure 4). High-frequency zones of severe and extreme drought were primarily concentrated in southern Xinjiang. In terms of intensity, average values for mild, moderate, severe, and extreme droughts were −1.1, −1.5, −1.9, and −2.3, respectively, with high-intensity regions mainly distributed in southwestern Xinjiang. Drought duration and severity further highlight the spatial concentration of drought stress. The average duration of mild, moderate, severe, and extreme droughts in southern Xinjiang was 4.0, 3.4, 2.9, and 2.8 months, respectively, while corresponding severity values were −4.7, −5.2, −5.5, and −6.6. The spatial patterns of duration and severity were highly consistent, with maximum values concentrated in southwestern Xinjiang, identifying this region as the core hotspot of drought stress in the study area.

3.3. Spatiotemporal Variations in Vegetation Phenology

Vegetation phenology in Xinjiang exhibited pronounced spatial heterogeneity and significant temporal shifts during 2001–2021, based on MODIS-derived phenological metrics (SOS, EOS, and LOS).
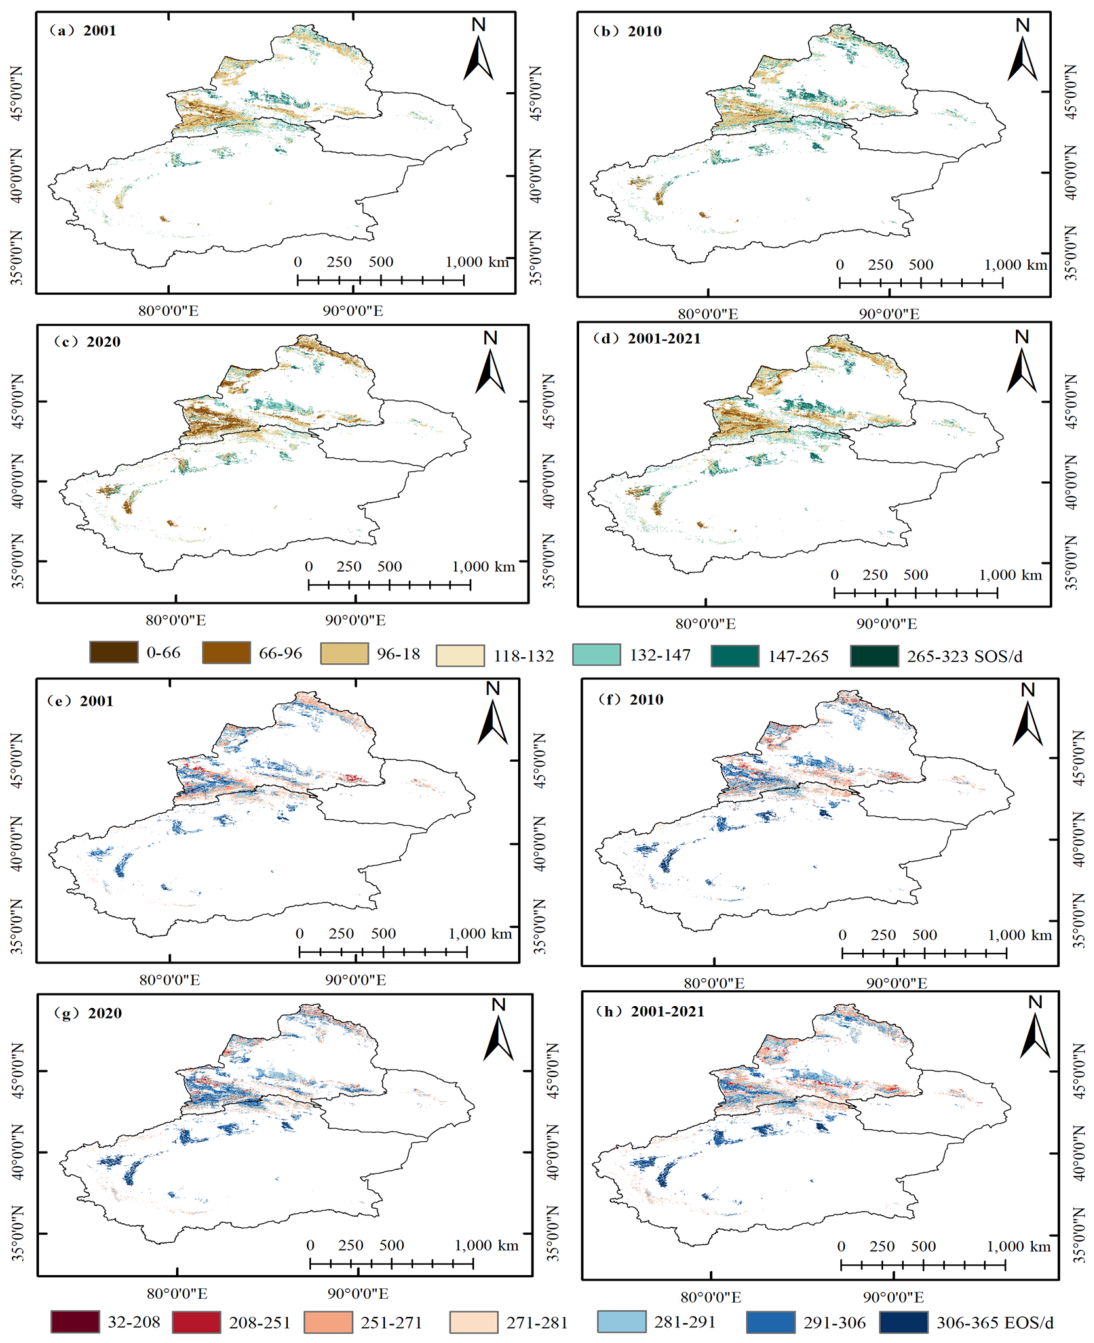
Spatially, the start of the growing season (SOS) showed clear regional differences. The earliest green-up occurred in the Ili River Valley and the headwater regions of the Tarim River Basin, where vegetation typically entered the growing season around day 80–90 (mid- to late March). In contrast, the regional mean SOS occurred around day 122 (early April). The spatial pattern of the end of the growing season (EOS) displayed an opposite trend, with later senescence generally observed in southern Xinjiang. The regional mean EOS occurred around day 282 (Figure 5).
Temporally, vegetation phenology exhibited a consistent shift over the past two decades. SOS advanced significantly at a rate of −1.9 days decade−1, while EOS was delayed at a rate of +1.7 days decade−1. As a combined effect, LOS increased by 3.8 days decade−1, indicating an extension of the vegetation growth period.

3.4. Spatiotemporal Variations in Vegetation Productivity in Xinjiang

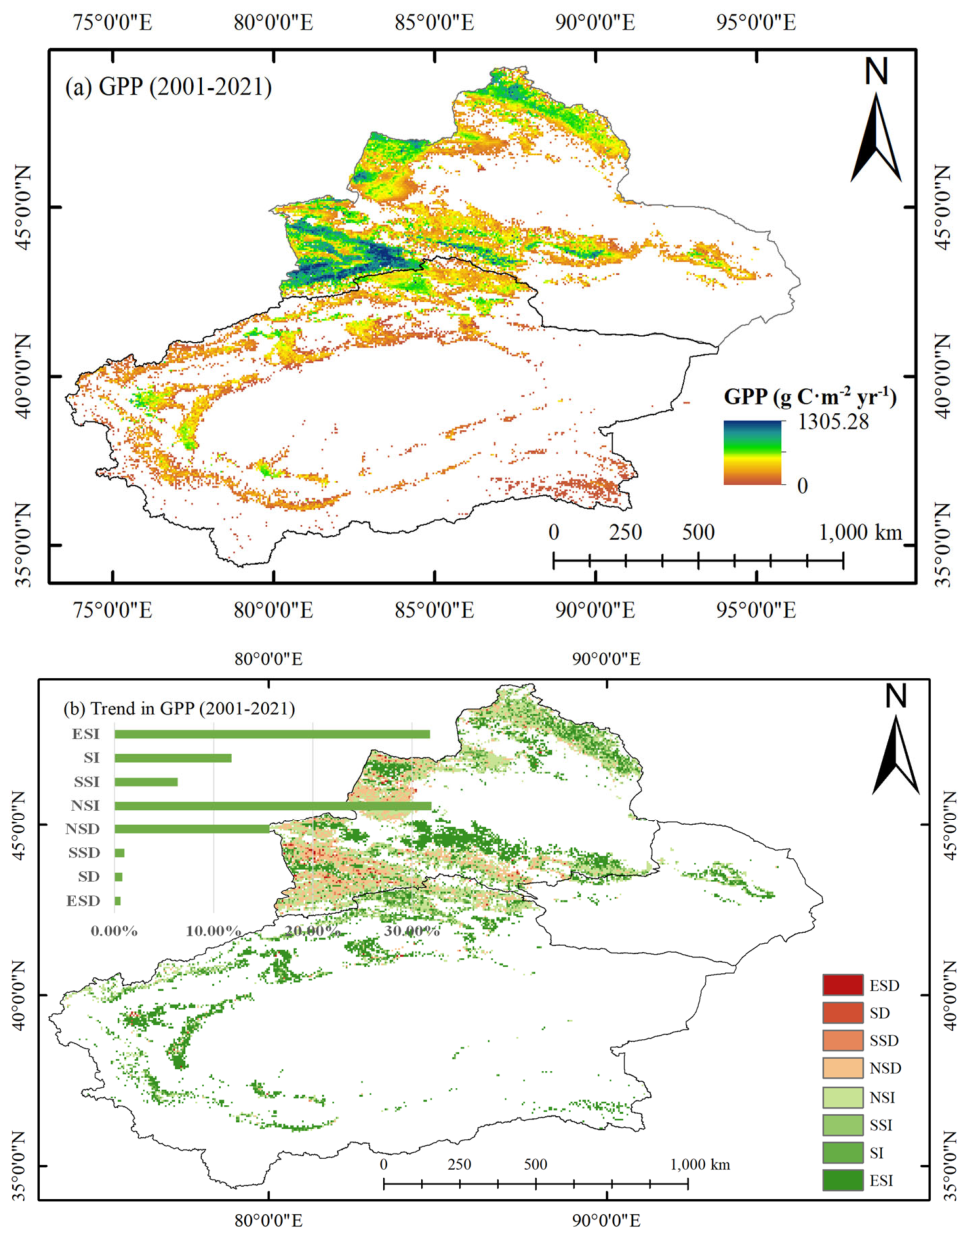
From 2001 to 2021, vegetation productivity in Xinjiang exhibited pronounced spatial heterogeneity, reflecting strong hydro-climatic controls on ecosystem carbon uptake. The multi-year mean gross primary productivity (GPP) was 285.20 g C·m−2, showing a distinct gradient characterized by higher values in relatively humid and energy-rich regions. Elevated GPP values were concentrated in the Ili River Valley, the Altai Mountains, and riparian corridors along major river systems, where water availability and vegetation density are comparatively high. In contrast, persistently low GPP values occurred in the Taklimakan Desert and the Gurbantunggut Desert, where extremely arid conditions severely constrain photosynthetic activity (Figure 6a). In southern Xinjiang, productivity hotspots were primarily distributed along oasis–river systems such as the Aksu, Kashgar, Yarkant, and Hotan Rivers, underscoring the dominant role of hydrological accessibility in sustaining carbon assimilation in hyper-arid environments.
Spatial trend analysis further revealed a widespread increase in vegetation productivity across the study region. More than 80% of Xinjiang exhibited positive GPP trends, among which 31.82% showed statistically significant increases (p < 0.05). Areas with declining trends accounted for 18.03%, most of which were weak and statistically insignificant, indicating limited spatial coherence of productivity reduction signals. These results suggest a general enhancement of ecosystem photosynthetic capacity over the study period, albeit with strong spatial variability driven by regional moisture gradients and vegetation distribution patterns (Figure 6b).
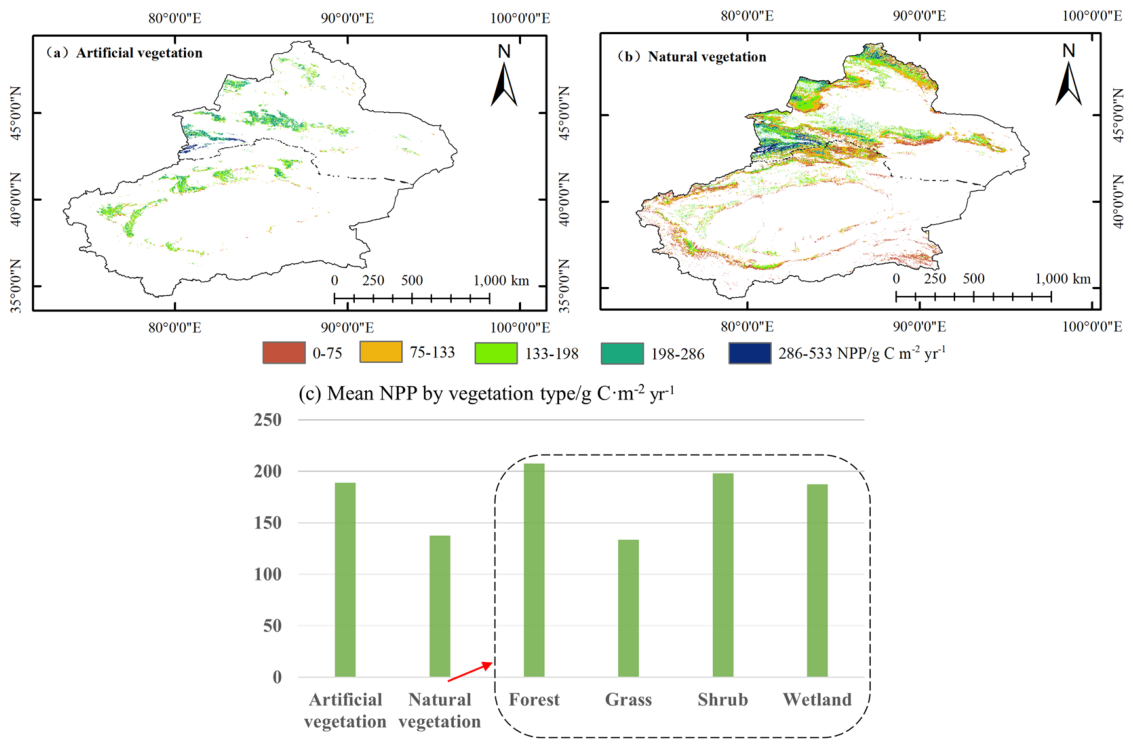
Marked differences were also observed among vegetation types. Natural vegetation (including forests, shrublands, and grasslands) and cropland both contributed substantially to regional productivity, with clear spatial clustering in ecologically favorable zones such as the Ili River Valley. The multi-year mean net primary productivity (NPP) of natural vegetation was 137.52 g C·m−2, with peak values reaching 533.11 g C·m−2, reflecting substantial heterogeneity within natural ecosystems. Cropland exhibited a higher mean NPP of 188.98 g C·m−2, indicating relatively high carbon assimilation efficiency under managed conditions and irrigation support. Among natural vegetation types, forests displayed the highest carbon fixation capacity (207.68 g C·m−2), followed closely by shrublands (198.13 g C·m−2), while grasslands showed the lowest productivity (133.44 g C·m−2), consistent with their limited water-use efficiency and sparse canopy structure (Figure 7).

3.5. Impacts of Drought on Vegetation Phenology

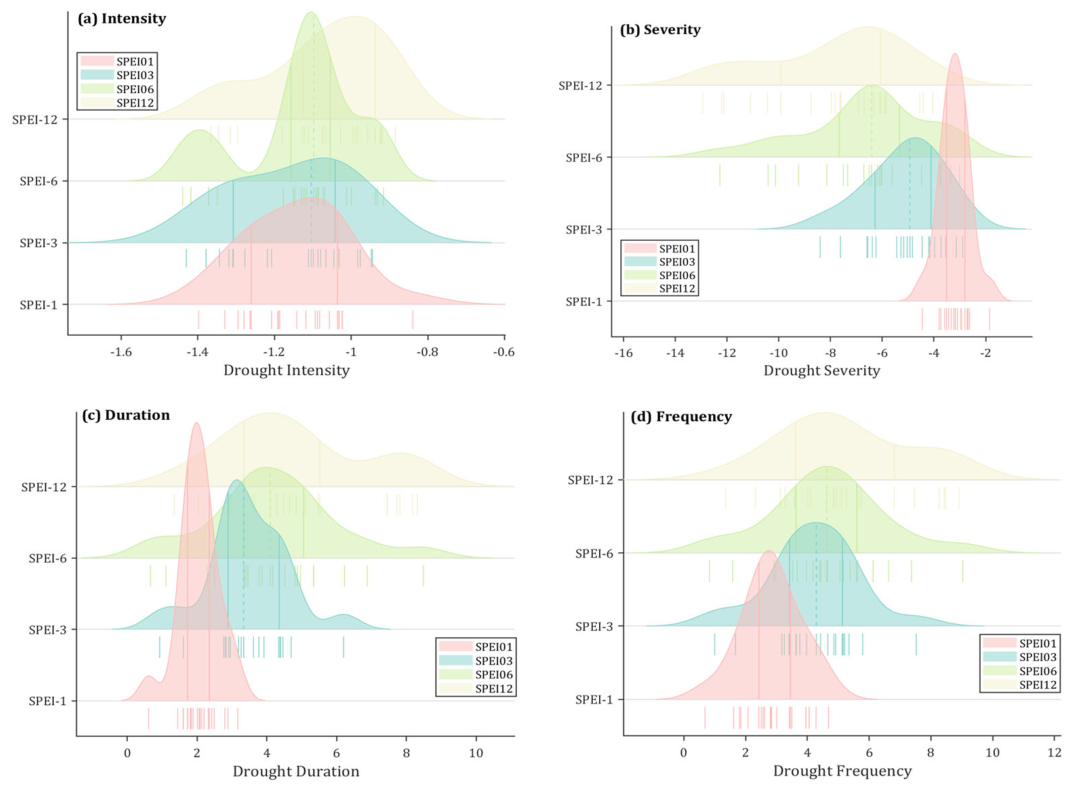
Drought characteristics exhibited clear dependence on SPEI time scale. With increasing SPEI aggregation scale, drought events became more severe and persistent. At the SPEI-1 scale, median drought severity and duration were −3.18 and 2.07 months, respectively, whereas at the SPEI-12 scale these values increased to −7.32 and 4.40 months (Figure 8b,c). In addition, frequency distributions broadened with increasing time scale, indicating greater variability and stronger cumulative effects in long-term drought metrics (Figure 8d). These results indicate that short-term SPEI primarily captures high-frequency drought fluctuations, whereas long-term SPEI reflects accumulated and persistent water deficits.
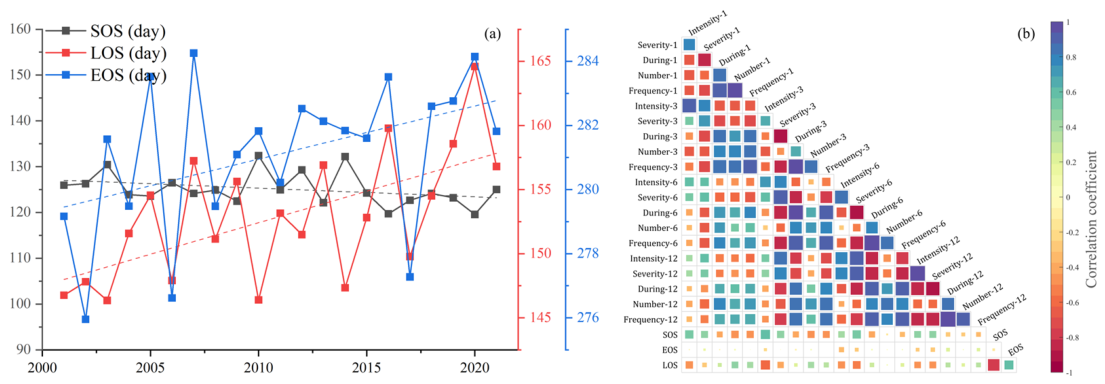
Vegetation phenology in Xinjiang showed noticeable interannual variability during 2001–2021 (Figure 9a). SOS exhibited a weak long-term trend, while EOS showed a slight delaying tendency, resulting in an overall extension of LOS. Among the three phenological indicators, EOS and LOS showed greater interannual variability, indicating higher sensitivity to climatic fluctuations.
Correlation analysis revealed significant associations between drought characteristics and vegetation phenology across multiple SPEI time scales (Figure 9b). SOS and LOS were generally more sensitive to drought variability than EOS. Drought duration, frequency, and number were predominantly negatively correlated with SOS, whereas drought intensity and severity showed mixed effects, with positive correlations under stronger drought conditions. This suggests that vegetation responds nonlinearly to drought stress, where repeated or prolonged water limitation tends to advance SOS, while high-intensity drought may delay vegetation green-up.
LOS showed clearer and more consistent responses to drought characteristics, particularly at intermediate (SPEI-3 and SPEI-6) and long (SPEI-12) time scales. In general, drought duration and frequency were negatively correlated with LOS, indicating that persistent drought conditions tend to shorten the growing season. In contrast, EOS exhibited weaker and less consistent relationships with drought variables, suggesting that senescence timing is less directly controlled by drought compared to SOS and LOS.
Overall, these results demonstrate a clear scale-dependent relationship between drought and vegetation phenology. Short-term drought variability is more closely associated with interannual phenological fluctuations, while long-term drought exerts stronger cumulative constraints on growing-season length and ecosystem functioning. Among phenological metrics, SOS and LOS are the most drought-sensitive indicators, whereas EOS shows a more complex and less stable response pattern.

3.6. Impacts of Drought on Vegetation Productivity

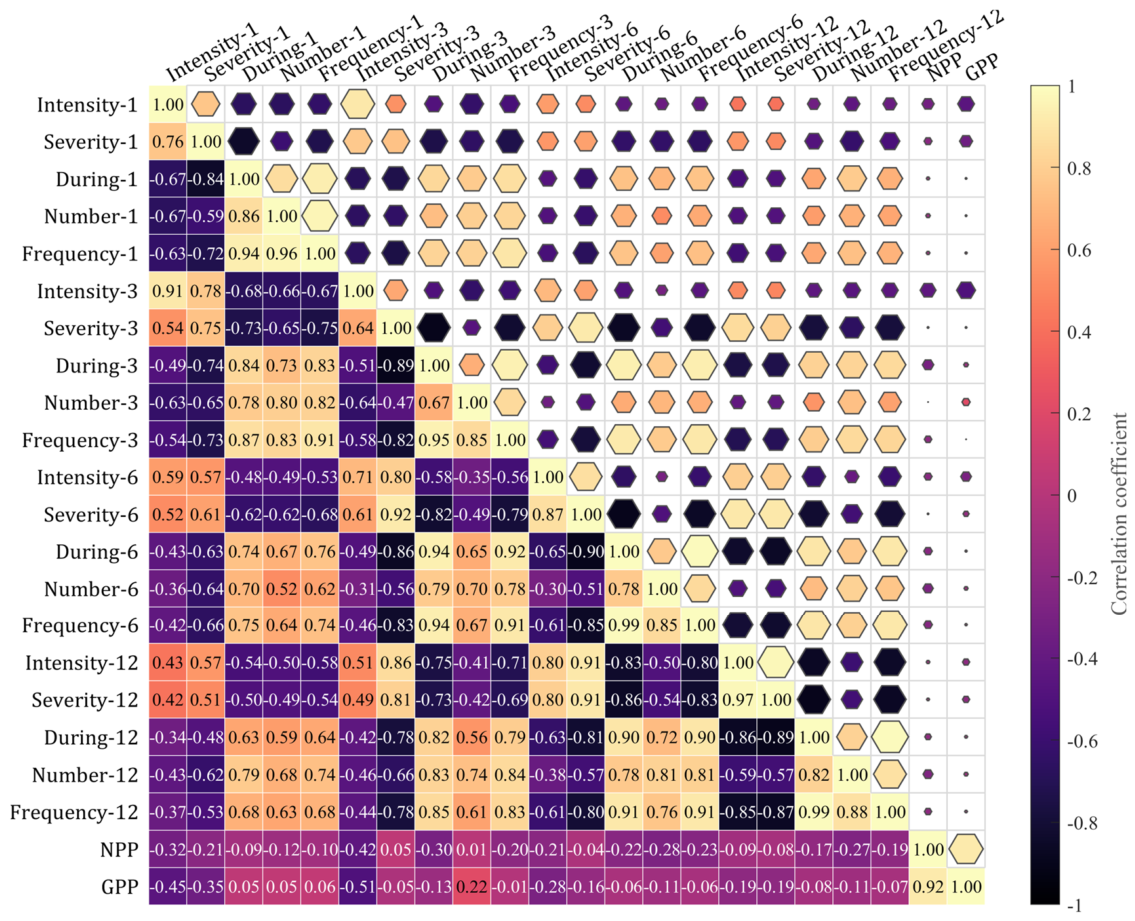
Correlation analysis between multi-scale drought characteristics and vegetation productivity (GPP and NPP) revealed predominantly negative relationships, indicating that drought stress is associated with reduced vegetation carbon uptake efficiency (Figure 10). Both GPP and NPP showed consistent decreases under increasing drought intensity, frequency, and duration across most SPEI time scales.
The relationships between drought and vegetation productivity exhibited clear scale dependence. The strongest correlation was observed at the SPEI-3 scale, where drought intensity showed a significant negative relationship with GPP (r = −0.42, p < 0.01). Drought duration and frequency at the SPEI-3 and SPEI-6 scales also showed relatively stronger correlations with both GPP and NPP compared to other time scales.
Shorter SPEI time scales (SPEI-3 and SPEI-6) capture rapid vegetation responses to seasonal water deficits, whereas longer time scales primarily reflect accumulated moisture conditions with weaker direct coupling to short-term productivity variability. This suggests that vegetation productivity in Xinjiang is more responsive to seasonal-scale drought variability than to long-term drought accumulation.
Overall, these results indicate a scale-dependent sensitivity of vegetation productivity to drought stress, with stronger responses occurring at seasonal time scales.

3.7. Vegetation Resistance and Resilience During the 2007–2008 Extreme Drought

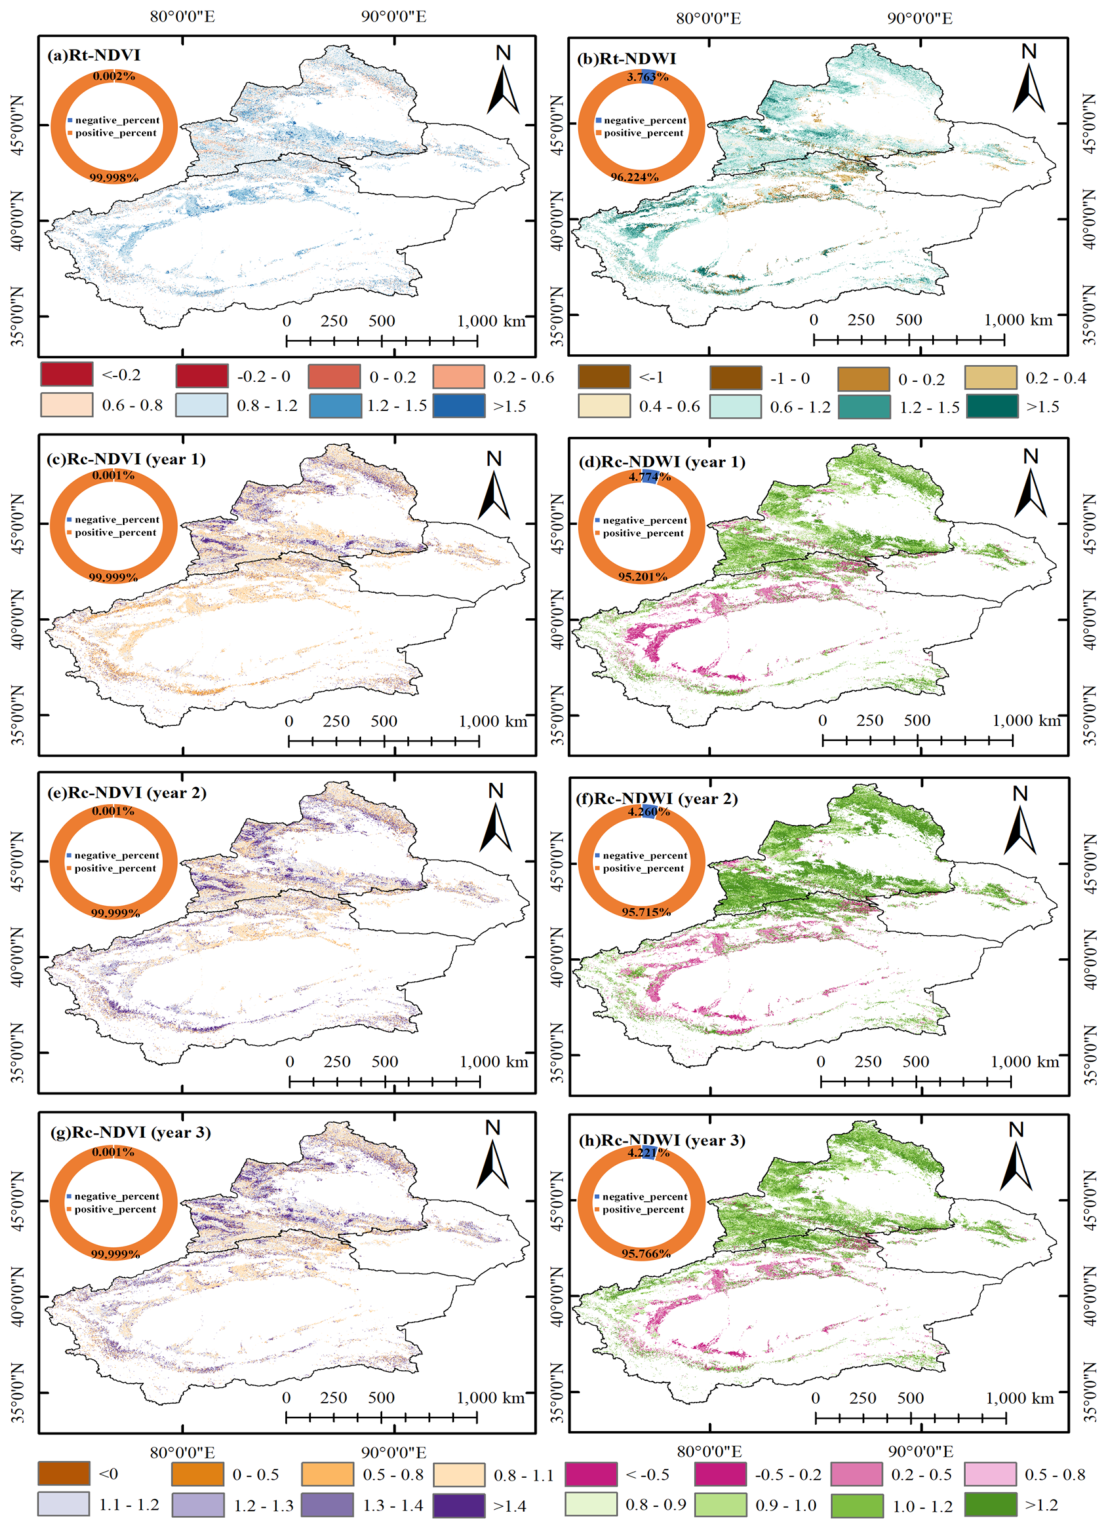
The 2007–2008 drought in Xinjiang was selected as a representative extreme hydro-climatic event for evaluating vegetation resistance and resilience (Figure 11). This event was characterized by persistent high-temperature anomalies, reduced snow accumulation, early snowmelt, and below-average precipitation, jointly inducing severe hydrological stress across the region. The SPEI-12 index indicated a prolonged drought condition lasting 8.32 months with an intensity of −1.37. Vegetation resistance (Rt) and resilience (Rc) were quantified using MODIS-derived NDVI and NDWI. Resistance was defined as the deviation between vegetation conditions during the drought period (2007–2008) and the pre-drought baseline year (2006). Resilience was calculated based on post-drought vegetation recovery during 2009–2011, representing a multi-year recovery trajectory.
Spatial patterns show that higher resistance values were concentrated in the northern slope of the Tianshan Mountains, the northern Kunlun Mountains, and the headwater regions of the Tarim River Basin, indicating relatively lower sensitivity to drought stress. In contrast, lower resistance and weaker resilience were observed in southern Xinjiang, particularly within the Tarim Basin, where post-drought recovery was slower and incomplete. Temporal dynamics indicate a rapid decline in NDVI during the drought year, followed by partial recovery in the first post-drought year and near or above baseline levels in the second year. In contrast, NDWI exhibited a slower and incomplete recovery trajectory, remaining below pre-drought conditions throughout the recovery period. This divergence indicates a faster recovery of vegetation greenness compared to canopy water content after drought termination.

4. Discussions

4.1. Mechanisms of Drought Impacts on Forest and Grassland Ecosystems

Drought is one of the most pervasive climatic stressors affecting ecosystem structure and function in arid regions such as Xinjiang, where water availability is the primary limiting factor for vegetation growth and stability [40]. Extreme drought events can trigger reductions in photosynthetic activity, hydraulic failure, and even large-scale vegetation mortality, leading to long-term ecosystem degradation [41]. Two primary physiological mechanisms have been widely proposed to explain drought-induced vegetation responses: the hydraulic failure hypothesis and the carbon starvation hypothesis [42]. Hydraulic failure occurs when water stress induces xylem embolism, disrupting water transport from roots to leaves and ultimately leading to tissue desiccation. In contrast, carbon starvation results from prolonged stomatal closure under drought stress, which reduces photosynthetic carbon assimilation and disrupts plant metabolic balance [43,44]. These two mechanisms jointly provide a theoretical basis for understanding drought-induced ecosystem decline in arid and semi-arid environments.

4.2. Drought Propagation and Scale-Dependent Vegetation Responses

Drought is a multiscale phenomenon characterized by cascading propagation across meteorological, agricultural, ecological, and hydrological domains [45,46]. This propagation reflects the progressive transmission of water deficits through the soil–plant–atmosphere continuum, leading to increasing ecological stress as drought develops. Our results demonstrate strong scale-dependent vegetation responses to drought, with pronounced sensitivity to seasonal (SPEI-3 and SPEI-6) drought conditions in regulating vegetation productivity, while longer-term drought (SPEI-12) primarily influences ecosystem stability and recovery processes. This pattern can be interpreted through drought propagation dynamics: short-term drought directly coincides with vegetation growth cycles and rapidly affects photosynthetic activity, whereas long-term drought reflects cumulative water deficits that influence ecosystem resilience and structural stability [47,48].
Importantly, the seemingly contradictory responses observed in this study—namely that prolonged or frequent drought is associated with earlier SOS, while extreme drought events can delay greening—reflect different stages of vegetation–water coupling processes rather than inconsistent results. Early SOS under frequent drought conditions may arise from compensatory strategies triggered by reduced competition and earlier snowmelt, whereas severe drought conditions exceeding physiological thresholds suppress metabolic activation and delay green-up. This indicates a nonlinear response of phenology to drought intensity, rather than a monotonic relationship.
Rather than being contradictory, the differing roles of seasonal and long-term drought reflect a hierarchical response mechanism. Seasonal drought governs interannual variability in vegetation productivity, while prolonged drought determines ecosystem resistance and long-term carbon cycle constraints [49,50]. This scale-dependent behavior highlights the importance of considering multiple drought timescales when assessing vegetation responses in arid ecosystems.

4.3. Regulation of Drought Recovery by Vegetation Phenology

Vegetation phenology plays a key role in modulating drought impacts by regulating the temporal window of carbon uptake and water consumption. This study shows that phenological shifts in Xinjiang not only respond to drought but also feed back into drought recovery through coupled ecohydrological interactions. Earlier spring onset extends the growing season and increases evapotranspiration demand, thereby intensifying soil moisture depletion during subsequent drought periods. Consequently, phenological advancement may partially offset gains in carbon uptake by enhancing water stress during the peak growing season [51].
Crucially, the mismatch between NDVI and NDWI recovery reveals a decoupling between structural and physiological recovery. While vegetation greenness (NDVI) recovers relatively quickly, canopy water content (NDWI) shows slower and incomplete recovery, indicating persistent hydraulic stress after drought termination. This lag suggests that carbon uptake capacity may remain constrained despite apparent greenness recovery, leading to delayed normalization of carbon fluxes and potential multi-year carbon balance effects. Similar lagged recovery patterns have been reported in other arid and semi-arid ecosystems, where hydraulic recovery lags behind structural regrowth, prolonging post-drought carbon assimilation deficits [52,53]. Overall, vegetation phenology acts as both a response to drought and a regulator of ecosystem sensitivity to subsequent drought events.

4.4. Scale Dependence of Drought Resistance, Resilience, and Vegetation Responses

The apparent differences in drought time scales used in this study reflect distinct roles of drought processes across temporal domains. Short-term drought conditions (SPEI-3 and SPEI-6) primarily capture rapid soil moisture fluctuations that directly regulate vegetation productivity and seasonal carbon uptake dynamics. In contrast, long-term drought conditions (SPEI-12) represent cumulative water deficits that better describe sustained ecosystem stress and are therefore more appropriate for characterizing extreme drought events and associated ecosystem disturbances [54,55].
In this context, vegetation resistance and resilience to the 2007–2008 drought should be interpreted as responses to integrated long-term water deficits rather than short-term variability. Resistance reflects the immediate ability of ecosystems to withstand persistent stress, while resilience represents the capacity to recover from cumulative drought impacts over multi-year time scales [56]. This conceptual separation is consistent with studies in the Mediterranean Basin and North American drylands, where ecosystem resistance was primarily controlled by drought magnitude and duration, whereas resilience was strongly influenced by antecedent moisture conditions and recovery time lags.
Accordingly, resistance and resilience do not necessarily exhibit identical scale dependence to productivity responses but instead reflect integrated ecosystem memory of prolonged hydroclimatic stress. This highlights a hierarchical drought response framework in which short-term drought controls productivity dynamics, while long-term drought governs ecosystem stability and recovery capacity.

5. Conclusions

This study assessed multi-scale drought dynamics and their impacts on vegetation in Xinjiang using long-term meteorological data, SPEI, and remote sensing. Despite a warming–wetting trend, drought frequency, intensity, and duration have intensified since 1997, particularly in southern Xinjiang. Vegetation shows earlier spring onset, longer growing seasons, and increased primary productivity, yet these reflect higher sensitivity rather than reduced vulnerability. Seasonal drought (3–6 months) showed the strongest statistical association with productivity variation, while long-term drought constrains ecosystem stability. Lagged and cumulative drought effects influence phenology, and extreme events reveal slower recovery of canopy water content compared to structural greenness. Phenological shifts may influence drought recovery through altered water use and growing-season duration. These findings highlight the paradox of warming–wetting yet intensifying drought and emphasize the critical role of seasonal drought in regulating arid ecosystems, providing guidance for adaptive management and climate resilience.

Author Contributions

Conceptualization, T.P.; methodology, T.P.; software, T.P.; validation, T.P.; formal analysis, T.P. and J.W.; investigation, T.P. and M.F.; resources, Y.W. and Y.C.; data curation, T.P.; writing—original draft preparation, T.P.; writing—review and editing, Y.W. and X.Z.; visualization, Y.W.; supervision, Y.W.; project administration, Y.C. and X.Z.; funding acquisition, Y.C. and X.Z. All authors have read and agreed to the published version of the manuscript.

Funding

The research was supported by the Central Financial Forest and Grassland Science and Technology Promotion Demonstration Project (Xinjiang [2024] TG22), sponsored by the Natural Science Foundation of the Xinjiang Uygur Autonomous Region (2024D01B85).

Data Availability Statement

Data will be made available on request.

Acknowledgments

We are sincerely grateful to the reviewers and editors for their constructive comments for the improvement of the manuscript.

Conflicts of Interest

The authors declare no conflicts of interest.

References

  1. Cook, B.I.; Mankin, J.S.; Anchukaitis, K.J. Climate change and drought: From past to future. Curr. Clim. Change Rep. 2018, 4, 164–179. [Google Scholar] [CrossRef]
  2. Qing, Y.; Wang, S.; Yang, Z.L.; Gentine, P. Soil Moisture−Atmosphere Feedbacks Have Triggered the Shifts from Drought to Pluvial Conditions since 1980. Commun. Earth Environ. 2023, 4, 254. [Google Scholar] [CrossRef]
  3. West, H.; Quinn, N.; Horswell, M. Remote sensing for drought monitoring & impact assessment: Progress, past challenges and future opportunities. Remote Sens. Environ. 2019, 232, 111291. [Google Scholar] [CrossRef]
  4. Wang, J.Y.; Li, Z.; Chen, Y.N. The Spatiotemporal Evolution of Socioeconomic Drought in the Arid Area of Northwest China Based on the Water Poverty Index. J. Clean. Prod. 2023, 401, 136719. [Google Scholar] [CrossRef]
  5. Gao, X.X.; Xiao, F.J.; Liu, Q.F.; Yu, C.W.; Huang, D.P.; Chi, Y.L.; Zheng, X.Y. Increasing influence of compound dry-hot events on vegetation in northern China in recent years. J. Arid Environ. 2025, 229, 105393. [Google Scholar] [CrossRef]
  6. Weng, Z.; Niu, J.; Guan, H.D.; Kang, S.Z. Three-Dimensional Linkage between Meteorological Drought and Vegetation Drought across China. Sci. Total Environ. 2023, 859, 160300. [Google Scholar] [CrossRef] [PubMed]
  7. Li, H.; Wang, H.D.; Sui, H.G.; Wardlow, B.; Hayes, M.J.; Wang, J.X. Mapping the spatial-temporal dynamics of vegetation response lag to drought in a semi-arid region. Remote Sens. 2019, 11, 1873. [Google Scholar] [CrossRef]
  8. Wang, H.; Zhao, H.; Wang, F.Q.; Yan, B.; Tang, L.; Du, Y.T.; Cui, L.B. Study on the Multi-Type Drought Propagation Process and Driving Factors on the Tibetan Plateau. J. Hydrol. 2024, 645, 132162. [Google Scholar] [CrossRef]
  9. Yao, J.Q.; Chen, Y.N.; Guan, X.F.; Zhao, Y.; Chen, J.; Mao, W.Y. Recent climate and hydrological changes in a mountain-basin system in Xinjiang, China. Earth-Sci. Rev. 2022, 226, 103957. [Google Scholar] [CrossRef]
  10. Spinoni, J.; Barbosa, P.; Bucchignani, E.; Cassano, J.; Cavazos, T.; Christensen, J.H.; Christensen, O.B.; Coppola, E.; Evans, J.; Geyer, B.; et al. Future Global Meteorological Drought Hot Spots: A Study Based on CORDEX Data. J. Clim. 2020, 33, 3635–3661. [Google Scholar] [CrossRef]
  11. Wolf, S.; Paul-Limoges, E. Drought and heat reduce forest carbon uptake. Nat. Commun. 2023, 14, 6217. [Google Scholar] [CrossRef] [PubMed]
  12. Beguería, S.; Vicente-Serrano, S.M.; Reig, F.; Latorre, B. Standardized precipitation evapotranspiration index (SPEI) revisited: Parameter fitting, evapotranspiration models, tools, datasets and drought monitoring. Int. J. Climatol. 2014, 34, 3001–3023. [Google Scholar]
  13. Liu, Y.; Chen, J. Future Global Socioeconomic Risk to Droughts Based on Estimates of Hazard, Exposure, and Vulnerability in a Changing Climate. Sci. Total Environ. 2021, 751, 142159. [Google Scholar] [CrossRef] [PubMed]
  14. Wang, Q.F.; Zeng, J.Y.; Qi, J.Y.; Zhang, X.S.; Zeng, Y.; Shui, W.; Xu, H.; Zhang, R.R.; Wu, X.P.; Cong, J. A multi-scale daily SPEI dataset for drought characterization at observation stations over mainland China from 1961 to 2018. Earth Syst. Sci. Data 2021, 13, 331–341. [Google Scholar] [CrossRef]
  15. Zhou, Z.; Shi, H.; Fu, Q.; Ding, Y.; Li, T.; Liu, S. Investigating the Propagation from Meteorological to Hydrological Drought by Introducing the Nonlinear Dependence with Directed Information Transfer Index. Water Resour. Res. 2021, 57, e2021WR030028. [Google Scholar] [CrossRef]
  16. Vicente-Serrano, S.M.; Beguería, S.; López-Moreno, J.I. A Multiscalar Drought Index Sensitive to Global Warming: The Standardized Precipitation Evapotranspiration Index. J. Clim. 2010, 23, 1696–1718. [Google Scholar] [CrossRef]
  17. Zhou, Z.Q.; Wang, P.; Li, L.Q.; Fu, Q.; Ding, Y.B.; Chen, P.; Xue, P.; Wang, T.; Shi, H.Y. Recent development on drought propagation: A comprehensive review. J. Hydrol. 2024, 645, 132196. [Google Scholar] [CrossRef]
  18. Li, W.G.; Yi, X.; Hou, M.T.; Chen, H.L.; Chen, Z.L. Standardized Precipitation Evapotranspiration Index Shows Drought Trends in China. Chin. J. Eco-Agric. 2012, 20, 643–649. [Google Scholar] [CrossRef]
  19. Zhu, Z.Y.; Duan, W.L.; Zou, S.; Zeng, Z.Z.; Chen, Y.N.; Feng, M.Q.; Qin, J.X.; Liu, Y.C. Spatiotemporal Characteristics of Meteorological Drought Events in 34 Major Global River Basins during 1901–2021. Sci. Total Environ. 2024, 921, 170913. [Google Scholar] [CrossRef] [PubMed]
  20. Kong, D.D.; Zhang, Q.; Gu, X.H.; Wang, Y.; Li, H.Z. Vegetation responses to drought at different time scales in China. Acta Ecol. Sin. 2016, 36, 7908–7918. [Google Scholar] [CrossRef]
  21. Wei, X.; Huang, S.; Huang, Q.; Liu, D.; Leng, G.; Yang, H.; Duan, W.; Li, J.; Bai, Q.; Peng, J. Analysis of Vegetation Vulnerability Dynamics and Driving Forces to Multiple Drought Stresses in a Changing Environment. Remote Sens. 2022, 14, 4231. [Google Scholar] [CrossRef]
  22. Liu, H.; Jiang, L.L.; Liu, B.; Liu, R.; Xiao, Z.L. Characteristics of drought in China and its effect on vegetation change in recent 40 years. Acta Ecol. Sin. 2023, 43, 7936–7949. [Google Scholar]
  23. Vicente-Serrano, S.M.; Quiring, S.M.; Peña-Gallardo, M.; Yuan, S.S.; Domínguez-Castro, F. A Review of Environmental Droughts: Increased Risk under Global Warming? Earth-Sci. Rev. 2020, 201, 102953. [Google Scholar] [CrossRef]
  24. Piao, S.L.; Wang, X.H.; Park, T.; Chen, C.; Lian, X.; He, Y.; Bjerke, J.W.; Chen, A.P.; Ciais, P.; Tømmervik, H.; et al. Characteristics, drivers and feedbacks of global greening. Nat. Rev. Earth Environ. 2020, 1, 14–27. [Google Scholar]
  25. Duan, R.; Huang, G.; Wang, F.; Tian, C.; Wu, X. Observations over a Century Underscore an Increasing Likelihood of Compound Dry-hot Events in China. Earths Future 2024, 12, e2024EF004546. [Google Scholar] [CrossRef]
  26. Li, Y.; Zhang, W.; Schwalm, C.R.; Gentine, P.; Smith, W.K.; Ciais, P.; Kimball, J.S.; Gazol, A.; Kannenberg, S.A.; Chen, A.P.; et al. Widespread spring phenology effects on drought recovery of Northern Hemisphere ecosystems. Nat. Clim. Change 2023, 13, 182–188. [Google Scholar] [CrossRef]
  27. Shen, X.J.; Liu, B.H.; Henderson, M.; Wang, L.; Jiang, M.; Lu, X.G. Vegetation greening, extended growing seasons, and temperature feedbacks in warming temperate grasslands of China. J. Clim. 2022, 35, 5103–5117. [Google Scholar] [CrossRef]
  28. Piao, S.L.; Liu, Q.; Chen, A.P.; Janssens, I.A.; Fu, Y.S.; Dai, J.H.; Liu, L.L.; Lian, X.; Shen, M.G.; Zhu, X.L. Plant phenology and global climate change: Current progresses and challenges. Glob. Change Biol. 2019, 25, 1922–1940. [Google Scholar] [CrossRef]
  29. Dai, A.G. Increasing drought under global warming in observations and models. Nat. Clim. Change 2012, 2, 52–58. [Google Scholar] [CrossRef]
  30. Liu, L.B.; Gudmundsson, L.; Hauser, M.; Qin, D.H.; Li, S.C.; Seneviratne, S.I. Soil moisture dominates dryness stress on ecosystem production globally. Nat. Commun. 2020, 11, 4892. [Google Scholar] [CrossRef] [PubMed]
  31. Yuan, W.P.; Zheng, Y.; Piao, S.L.; Ciais, P.; Lombardozzi, D.; Wang, Y.P.; Ryu, Y.; Chen, G.X.; Dong, W.J.; Hu, Z.M.; et al. Increased atmospheric vapor pressure deficit reduces global vegetation growth. Sci. Adv. 2019, 5, eaax1396. [Google Scholar] [CrossRef] [PubMed]
  32. Xu, C.G.; McDowell, N.G.; Fisher, R.A.; Wei, L.; Sevanto, S.; Christoffersen, B.O.; Weng, E.S.; Middleton, R.S. Increasing impacts of extreme droughts on vegetation productivity under climate change. Nat. Clim. Change 2019, 9, 948–954. [Google Scholar] [CrossRef]
  33. Wu, C.Y.; Munger, J.W.; Niu, Z.; Kuang, D. Comparison of multiple models for estimating gross primary production using MODIS and eddy covariance data in Harvard Forest. Remote Sens. Environ. 2010, 114, 2925–2939. [Google Scholar] [CrossRef]
  34. Xiao, J.F.; Zhuang, Q.L.; Law, B.E.; Chen, J.Q.; Baldocchi, D.D.; Cook, D.R.; Oren, R.; Richardson, A.D.; Wharton, S.; Ma, S.Y.; et al. A continuous measure of gross primary production for the conterminous United States derived from MODIS and AmeriFlux data. Remote Sens. Environ. 2010, 114, 576–591. [Google Scholar] [CrossRef]
  35. Chen, F.; Xie, T.; Yang, Y.; Chen, S.; Chen, F.; Huang, W.; Chen, J. Discussion of the “Warming and Wetting” Trend and Its Future Variation in the Drylands of Northwest China under Global Warming. Sci. China Earth Sci. 2023, 66, 1241–1257. [Google Scholar] [CrossRef]
  36. Yang, P.; Xia, J.; Zhan, C.S.; Zhang, Y.Y.; Hu, S. Discrete wavelet transform-based investigation into the variability of standardized precipitation index in Northwest China during 1960–2014. Theor. Appl. Climatol. 2018, 132, 167–180. [Google Scholar]
  37. Liu, J.; Meng, B.P.; Ge, J.; Gao, J.L.; Yin, J.P.; Hou, M.J.; Feng, Q.S.; Liang, T.G. Spatio-temporal dynamic changes of grassland NPP in Gannan prefecture, as determined by the CASA model. Acta Prataculturae Sin. 2019, 28, 19–32. [Google Scholar]
  38. Verhoeven, E.; Wardle, G.M.; Roth, G.W.; Greenville, A.C. Characterising the spatiotemporal dynamics of drought and wet events in Australia. Sci. Total Environ. 2022, 846, 157480. [Google Scholar] [CrossRef] [PubMed]
  39. Anderegg, W.R.L.; Schwalm, C.; Biondi, F.; Camarero, J.J.; Koch, G.; Litvak, M.; Ogle, K.; Shaw, J.D.; Shevliakova, E.; Williams, A.P.; et al. Pervasive drought legacies in forest ecosystems and their implications for carbon cycle models. Science 2015, 349, 528–532. [Google Scholar] [CrossRef] [PubMed]
  40. Liu, W.B.; Sun, F.B.; Lim, W.H.; Zhang, J.; Wang, H.; Shiogama, H.; Zhang, Y.Q. Global drought and severe drought-affected populations in 1.5 and 2 °C warmer worlds. Earth Syst. Dyn. 2018, 9, 267–283. [Google Scholar] [CrossRef]
  41. Li, S.F.; Ge, W.Y.; Wang, F. Characteristics of drought events and their impacts on vegetation in northern China from 1982 to 2019. Res. Soil Water Conserv. 2023, 30, 251–259. [Google Scholar] [CrossRef]
  42. Yu, X.; Zhang, L.; Zhou, T.; Zhang, X. Long-term changes in the effect of drought stress on ecosystems across global drylands. Sci. China Earth Sci. 2023, 66, 146–160. [Google Scholar]
  43. Friedman, J.; Hastie, T.; Tibshirani, R. Regularization Paths for Generalized Linear Models via Coordinate Descent. J. Stat. Softw. 2010, 33, 1–22. [Google Scholar] [CrossRef]
  44. Rhodes, J.S.; Cutler, A.; Moon, K.R. Geometry- and accuracy-preserving random forest proximities. IEEE Trans. Pattern Anal. Mach. Intell. 2023, 45, 10947–10959. [Google Scholar] [CrossRef] [PubMed]
  45. Chen, T.; Guestrin, C. XGBoost: A Scalable Tree Boosting System. In Proceedings of the 22nd ACM SIGKDD International Conference on Knowledge Discovery and Data Mining, San Francisco, CA, USA, 13–17 August 2016; pp. 785–794. [Google Scholar]
  46. Ji, Z.X.; Hou, Q.Q.; Pei, T.T.; Chen, Y.; Xie, B.P.; Wu, H.W. Sensitive response of vegetation phenology to seasonal drought in the Loess Plateau. Arid Land Geogr. 2022, 45, 557–565. [Google Scholar]
  47. Cao, S.P.; Zhang, L.F.; He, Y.; Zhang, Y.L.; Chen, Y.; Yao, S.; Yang, W.; Sun, Q. Effects and Contributions of Meteorological Drought on Agricultural Drought under Different Climatic Zones and Vegetation Types in Northwest China. Sci. Total Environ. 2022, 821, 153270. [Google Scholar] [CrossRef] [PubMed]
  48. Yang, L.M.; Li, X.; Zhang, G.X. Some advances and problems in the study of heavy rain in Xinjiang. Clim. Environ. Res. 2011, 16, 188–198. [Google Scholar]
  49. Yao, J.Q.; Zhao, Y.; Chen, Y.N.; Yu, X.J.; Zhang, R.B. Multi-Scale Assessments of Droughts: A Case Study in Xinjiang, China. Sci. Total Environ. 2018, 630, 444–452. [Google Scholar] [CrossRef] [PubMed]
  50. Qin, J.; Su, B.; Tao, H.; Wang, Y.; Huang, J.; Li, Z.; Jiang, T. Spatio-Temporal Variations of Dryness/Wetness over Northwest China under Different SSPs-RCPs. Atmos. Res. 2021, 259, 105672. [Google Scholar] [CrossRef]
  51. Zhu, X.; Lee, S.Y.; Wen, X.H.; Ji, Z.M.; Lin, L.; Wei, Z.; Zheng, Z.; Xu, D.Y.; Dong, W.J. Extreme climate changes over three major river basins in China as seen in CMIP5 and CMIP6. Clim. Dyn. 2021, 57, 1187–1205. [Google Scholar] [CrossRef]
  52. Huang, W.; Liu, C.; Cao, J.Q.; Chen, J.H.; Feng, S. Changes of hydroclimatic patterns in China in the present day and future. Sci. Bull. 2020, 65, 1061–1063. [Google Scholar] [CrossRef]
  53. Wang, Z.L.; Li, J.; Lai, C.G.; Zeng, Z.Y. Does drought in China show a significant decreasing trend from 1961 to 2009? Sci. Total Environ. 2017, 579, 314–324. [Google Scholar] [CrossRef]
  54. Bai, Q.S.; Yan, P.C.; Cai, D.H.; Jin, H.M.; Feng, G.L.; Zhang, T.J. Inter-decadal change characteristics of different grades drought in Northwest China in recent 56 years. J. Arid Meteorol. 2019, 37, 722–728. [Google Scholar]
  55. Wu, X.L.; Duan, C.F.; Maimaitiaili, M.; Zhang, J.L.; Zhang, T.X. Spatiotemporal characteristics of drought in Xinjiang during the recent 60 years based on the meteorological drought composite index. Arid Zone Res. 2022, 39, 75–83. [Google Scholar]
  56. Shi, H.Y.; Zhao, Y.Y.; Liu, S.N.; Cai, H.J.; Zhou, Z.Q. A New Perspective on Drought Propagation: Causality. Geophys. Res. Lett. 2022, 49, e2021GL096758. [Google Scholar] [CrossRef]
Figure 1. Study area and meteorological station distribution.
Remotesensing 18 02285 g001
Figure 2. Spatial trends of annual temperature and precipitation across Xinjiang.
Remotesensing 18 02285 g002
Figure 3. Drought frequency across multiple scales and intensity levels in Xinjiang. Note: asterisks denote the statistical significance of linear trend magnitudes: * p < 0.05, ** p < 0.01.
Remotesensing 18 02285 g003
Figure 4. Characteristics of drought events (SPEI-3). Note: The first column indicates the frequency of drought events (months/year); the second column represents the intensity of drought events (dimensionless, where smaller values indicate greater drought intensity); the third column shows the duration of drought events (months); and the fourth column denotes the severity of drought events (dimensionless, where smaller values reflect stronger drought conditions). Drought intensity was calculated as the mean SPEI value during a drought event, representing the average drought strength. Drought severity was calculated as the cumulative SPEI deficit during the event, representing the integrated drought stress over time.
Remotesensing 18 02285 g004
Figure 5. Spatial distribution of vegetation growing season onset (ad) and termination (eh) in Xinjiang (2001–2021).
Remotesensing 18 02285 g005
Figure 6. (a) Multi-year mean distribution and (b) trend variation of GPP in Xinjiang. Note: ESD = extremely significant decrease; SD = significant decrease; SSD = slightly significant decrease; NSD = non-significant decrease; NSI = non-significant increase; SSI = slightly significant increase; SI = significant increase; ESI = extremely significant increase.
Remotesensing 18 02285 g006
Figure 7. Spatial patterns and vegetation-type differences in NPP of artificial and natural vegetation in Xinjiang over the past two decades. Note: artificial vegetation refers to human-managed vegetation, including cropland, urban green spaces, shelterbelts, and other planted vegetation.
Remotesensing 18 02285 g007
Figure 8. Spatiotemporal probability density distributions of various drought characteristic attributes under different SPEI timescales (SPEI-1, SPEI-3, SPEI-6, and SPEI-12) across the study area during 2001–2021. Note: the horizontal gray lines represent explicit zero baselines for each sub-distribution to ensure precise visual alignment and independent comparison, and the vertical dashed lines indicate the median values for each scale. The rug plots at the bottom of each baseline represent the empirical data points.
Remotesensing 18 02285 g008
Figure 9. Vegetation phenological shifts and their drought associations in Xinjiang over the past 20+ years. (a) Interannual trajectories and linear fits of the start of the growing season (SOS), end of the growing season (EOS), and length of the growing season (LOS) from 2001 to 2021. (b) Pearson correlation matrix metrics between multi-timescale drought characteristics and phenological parameters.
Remotesensing 18 02285 g009
Figure 10. Relationship between drought patterns in Xinjiang and vegetation carbon uptake. Note: hexagon size represents the absolute magnitude of the correlation coefficient, whereas color indicates the correlation direction and value according to the color scale from −1 to 1.
Remotesensing 18 02285 g010
Figure 11. Spatial variations in vegetation resistance (Rt) and annual recovery (Rc) during and after the 2007–2008 focal extreme drought event in Xinjiang. Note: Panels (a,b) display the resistance based on NDVI (Rt-NDVI) and NDWI (Rt-NDWI), calculated as the index difference between the drought period (2007–2008) and the pre-drought baseline (2006). Panels (ch) display the annual post-drought recovery (Rc) across three consecutive years (Year 1: 2009; Year 2: 2010; Year 3: 2011) relative to the drought period, capturing the multi-year legacy effects on forest and grassland ecosystems. Positive Rc values indicate higher resilience or buffer capacity, while negative values in recovery years highlight areas potentially compounded by secondary drought events or persistent suppression.
Remotesensing 18 02285 g011
Disclaimer/Publisher’s Note: The statements, opinions and data contained in all publications are solely those of the individual author(s) and contributor(s) and not of MDPI and/or the editor(s). MDPI and/or the editor(s) disclaim responsibility for any injury to people or property resulting from any ideas, methods, instructions or products referred to in the content.