1. Introduction
Semantic segmentation of remote sensing imagery plays a fundamental role in a wide range of applications, including urban planning [
1], environmental monitoring, and disaster management [
2]. With the increasing availability of high-resolution and multi-source data, multimodal learning has become a dominant paradigm for improving scene understanding. In particular, the combination of optical imagery and Digital Surface Models (DSM) has been widely adopted, as these modalities provide complementary information. Optical imagery captures rich spectral and texture patterns, while DSM data encode geometric structure and elevation cues, enabling more precise delineation of complex objects [
3].
Despite these advantages, multimodal remote sensing segmentation remains highly challenging in complex scenarios. High-resolution images often exhibit large intra-class variation, irregular object boundaries, and significant scale differences. Moreover, multimodal data introduce additional difficulties, including modality-specific noise, misalignment, and inconsistent feature distributions. These factors make it difficult for existing models to achieve stable and reliable fusion, especially in ambiguous regions.
Recent advances in deep learning have explored different strategies to address these challenges. Spatial-based approaches focus on enhancing structural consistency by leveraging attention mechanisms or geometric guidance [
4], which improve boundary delineation and local continuity. In parallel, frequency-based methods have been introduced to capture global semantic information through spectral decomposition [
5], enabling more robust modeling of long-range dependencies.
However, existing methods generally assume that spatial and frequency representations can be integrated consistently throughout the network. In practice, these two representations often emphasize different aspects of the scene. Spatial representations favor local continuity, boundary preservation, and geometric alignment, whereas frequency representations emphasize global distributions, periodic patterns, and semantic abstraction. As a result, the two representations may generate inconsistent responses at the same spatial location, particularly in regions with complex boundaries, heterogeneous land-cover distributions, or ambiguous semantic structures. Such inconsistencies can propagate through multimodal fusion and negatively affect feature alignment and segmentation accuracy. Despite the growing interest in frequency-aware segmentation, the inconsistency between spatial-domain structural representations and frequency-domain semantic representations has not been explicitly modeled in existing multimodal remote sensing segmentation frameworks. In this work, we refer to this phenomenon as spatial–frequency representation conflict and investigate its impact on multimodal feature fusion.
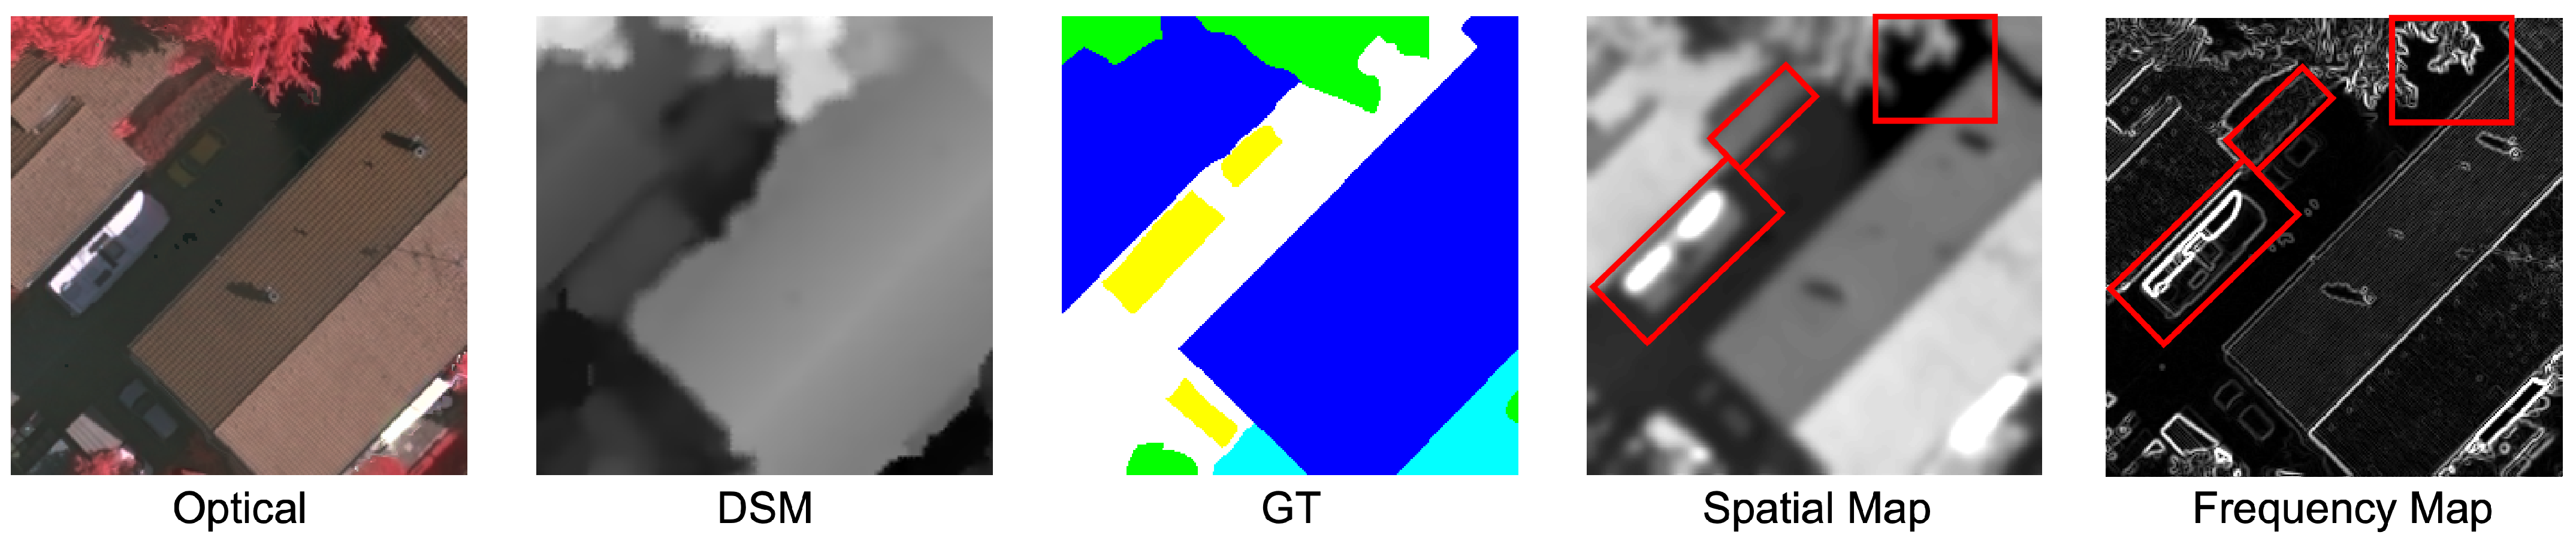
As illustrated in
Figure 1, we construct two complementary feature views from optical and DSM inputs. The spatial representation is obtained using a Sobel-based gradient operator applied to intermediate feature maps, which emphasizes local intensity variations and boundary structures. The frequency representation is derived from a Discrete Cosine Transform (DCT) applied to the same feature maps, capturing global structure and high-frequency components such as edges and fine details. Both representations are extracted from the intermediate encoder features (before the fusion stage) of the baseline feature extractor, ensuring consistent spatial resolution and channel alignment. Due to their different sensitivity characteristics, these two views may exhibit discrepancies at corresponding spatial locations. In this work, we quantify such discrepancies using a feature-level cosine similarity metric and refer to it as representation conflict. We observe that higher discrepancy is often associated with less stable predictions in challenging scenarios. Existing methods typically do not explicitly model this cross-view discrepancy, which may limit their ability to handle complex multimodal interactions.
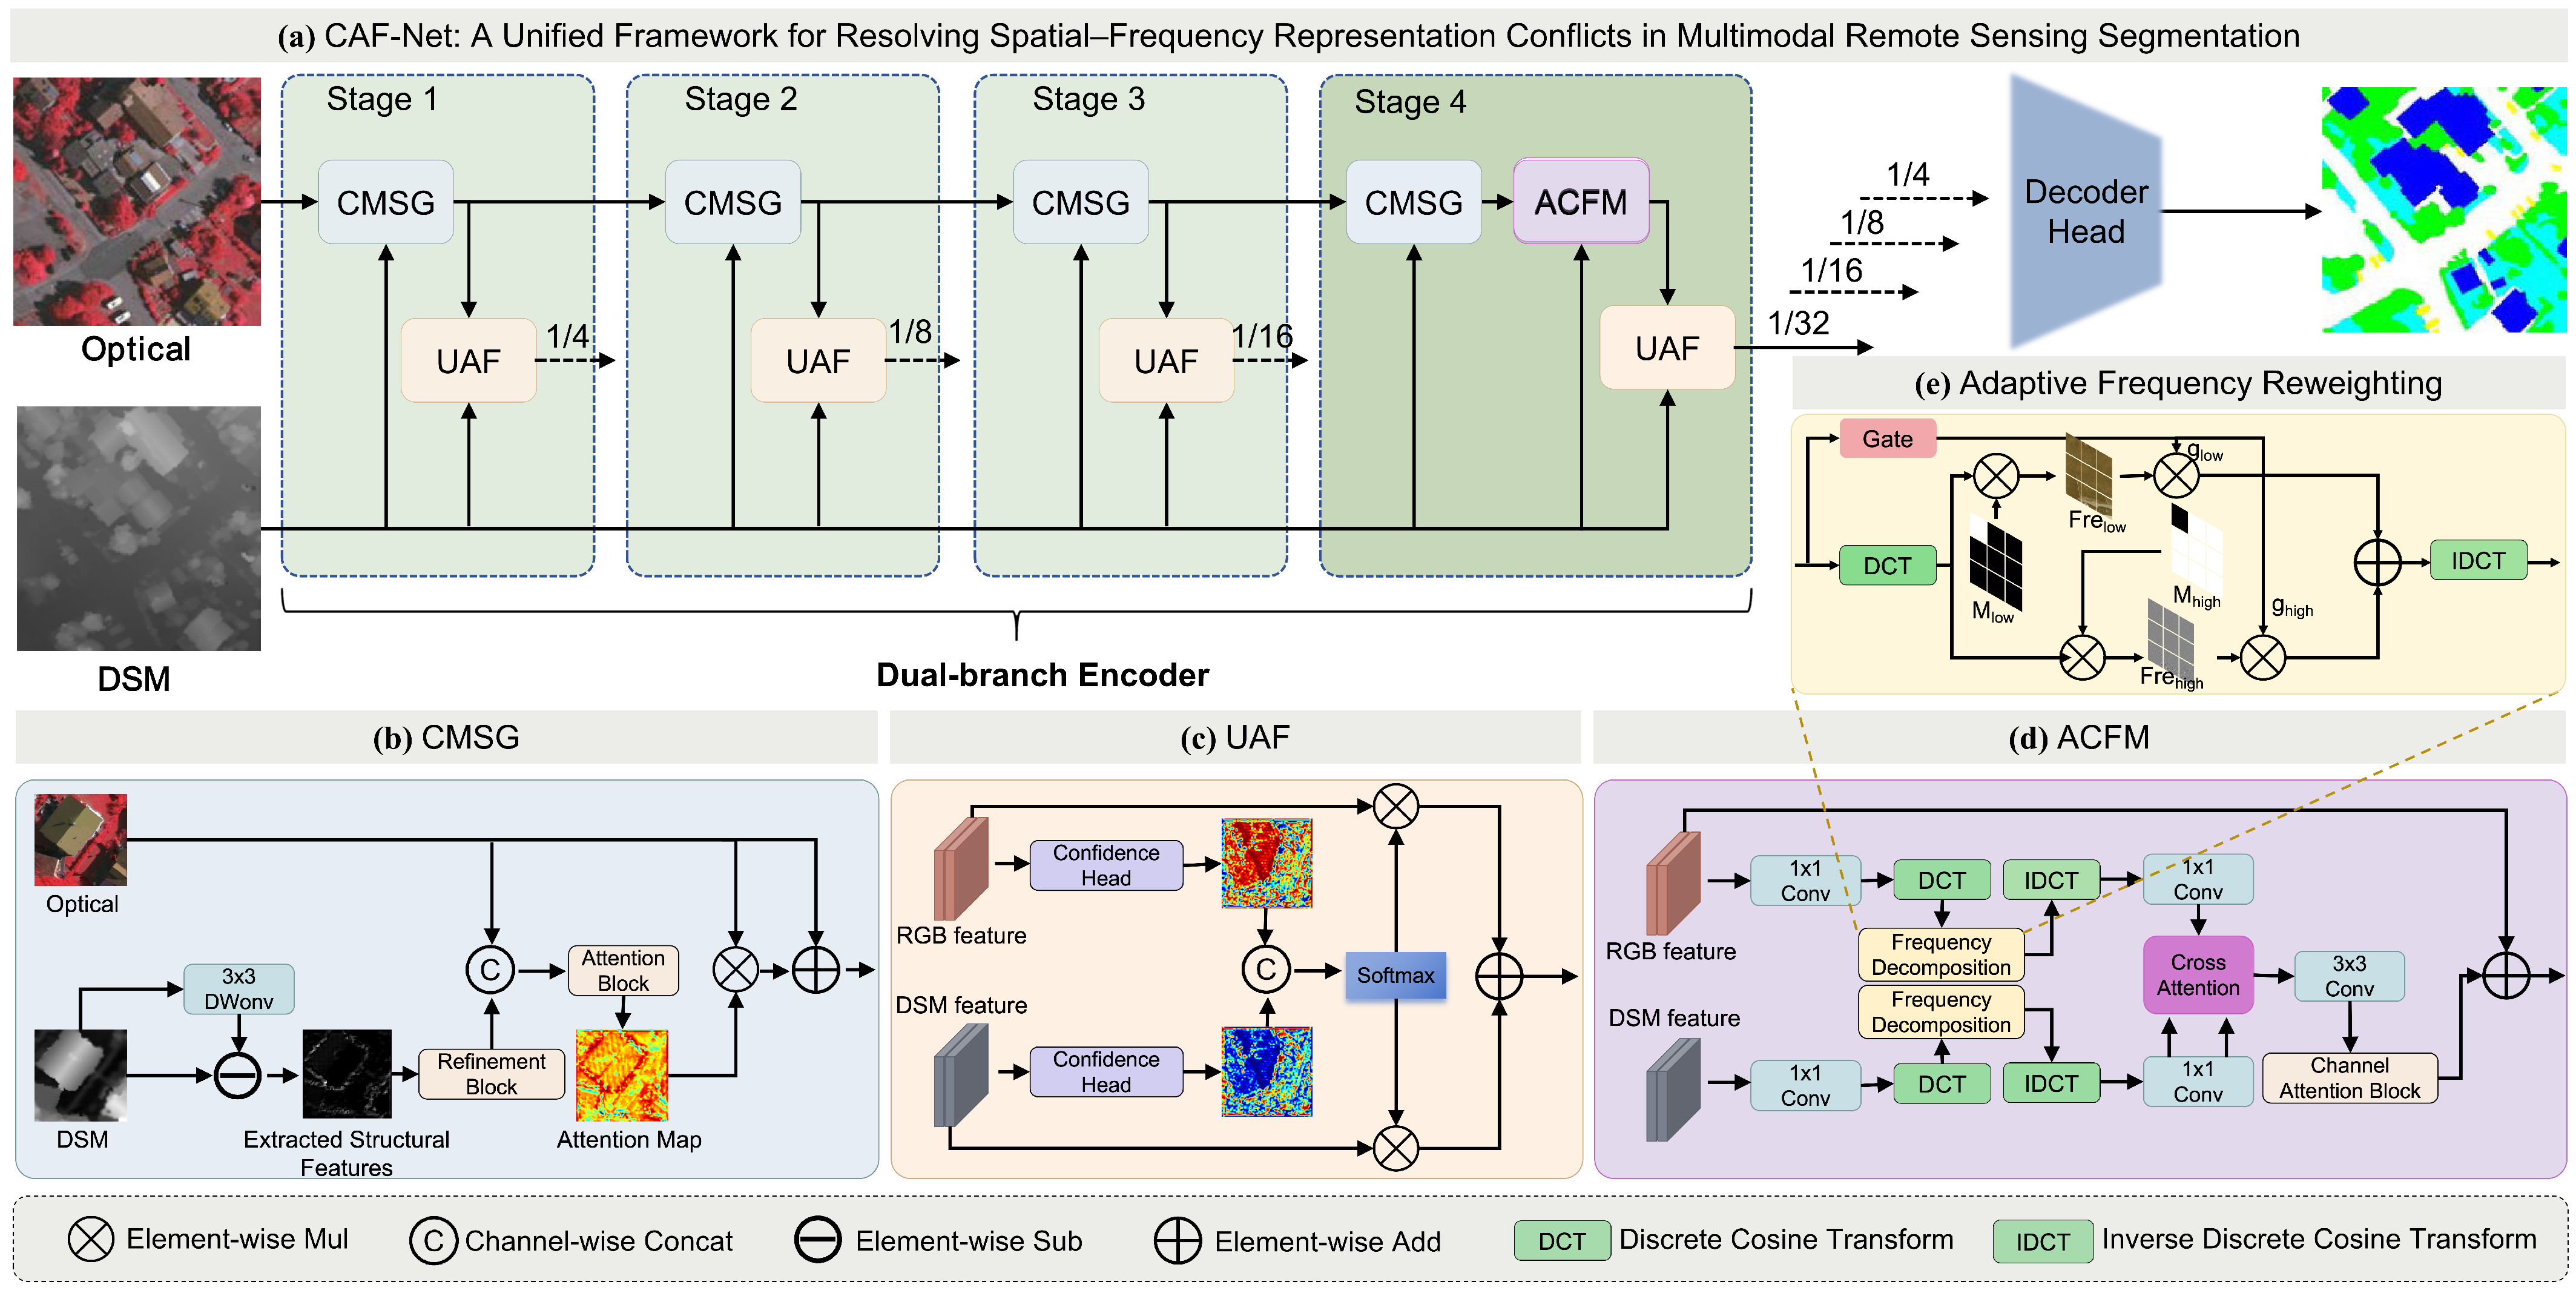
To address the aforementioned issue, we propose the Conflict-Aware Fusion Network (CAF-Net), a coordinated architecture designed to explicitly address spatial–frequency conflicts in multimodal fusion. The proposed framework integrates three complementary operations: (1) Cross-Modal Structure Guidance (CMSG), which injects DSM-derived geometric priors to enhance spatial consistency; (2) Adaptive Cross-Frequency Module (ACFM), which performs frequency decomposition and alignment to improve semantic coherence; and (3) Uncertainty-Aware Fusion (UAF), which estimates pixel-wise reliability to dynamically balance multimodal features and suppress conflicting responses. Rather than independently stacking these operations, CAF-Net couples them through consistency objectives and stage-wise feature interaction: CMSG supplies structure-enhanced spatial features, ACFM aligns their high-level frequency responses, and UAF regulates the resulting cross-modal interaction according to relative reliability.
The main contributions of this work are summarized as follows:
- (1)
We formulate spatial–frequency representation conflict as a feature-level discrepancy in optical–DSM segmentation and introduce global and boundary-focused diagnostic measures for its quantitative analysis.
- (2)
We develop CMSG and ACFM as complementary conflict-processing components: CMSG extracts DSM-derived high-pass structure for conditional spatial modulation, whereas ACFM performs explicitly masked frequency decomposition, adaptive band reweighting, and cross-modal alignment.
- (3)
We introduce UAF as a pixel-wise relative-reliability mechanism that normalizes modality confidence scores and regulates the interaction between structure-guided and frequency-aligned representations.
- (4)
Experiments on the ISPRS Vaihingen and Potsdam datasets evaluate segmentation accuracy, component contributions, computational complexity, feature discrepancy, and robustness to modality degradation.
2. Related Work
2.1. Spatial-Domain Fusion
Spatial-domain fusion methods aim to improve multimodal integration by enhancing spatial consistency and structural alignment across heterogeneous inputs [
6]. These approaches typically rely on attention-based interaction, geometric guidance, or feature alignment to model cross-modal relationships. Early methods mainly adopt symmetric feature concatenation, treating different modalities equally but often neglecting modality-specific characteristics. To address this limitation, recent studies have increasingly explored asymmetric modeling and modality-aware interaction.
For instance, ASANet [
7] introduces asymmetric semantic alignment to explicitly capture modality discrepancies, while RS
3Mamba [
8] leverages state space models to efficiently model long-range spatial dependencies with linear complexity. More recent studies further explore multimodal fusion strategies in remote sensing scenarios. For example, a multimodal cross-fusion Mamba framework is proposed in [
9], which enhances cross-modal interaction through complementary masked self-supervision, while projection-driven fusion methods integrate LiDAR and image data by explicitly modeling geometric consistency [
10]. In addition, CMGFNet [
11] employs cascaded fusion strategies to progressively refine feature selection, and RecLMIS [
12] enhances cross-modal alignment through conditional reconstruction mechanisms.
However, these methods primarily focus on spatial consistency and local structural refinement, while largely overlooking discrepancies that arise from complementary frequency-domain representations. This limitation may result in incomplete modeling of global contextual dependencies, especially in complex scenes where multi-scale information is essential.
2.2. Frequency-Domain Fusion
To address the limitations of purely spatial modeling, frequency-domain approaches have been introduced to capture global context and long-range dependencies. By decomposing features into different frequency components, these methods enhance global semantic modeling while preserving fine-grained structural details.
For example, GFNet [
13] replaces self-attention with global frequency filtering, achieving efficient long-range modeling. In multimodal remote sensing segmentation, FDMF-Net [
14] introduces frequency decoupling to reduce modality redundancy and improve semantic consistency. Similarly, Wave-ViT [
15] employs wavelet transforms to reduce token redundancy while preserving high-frequency information. Beyond remote sensing, FreqFormer [
16] and EW-ViT [
17] further demonstrate the effectiveness of frequency-domain representations in capturing global dependencies.
Despite their effectiveness, these methods mainly emphasize global spectral modeling while often neglecting local spatial structure consistency. As a result, directly integrating frequency-domain features with spatial representations may introduce inconsistencies, particularly in boundary-sensitive regions where precise localization is required.
2.3. Spatial–Frequency Joint Modeling
Recently, several methods have explored joint modeling of spatial and frequency information to leverage their complementary strengths. For instance, FAENet [
18] integrates wavelet transforms with attention mechanisms to capture spectral–spatial context, while AFNO [
19] combines Fourier-based global filtering with convolutional operations to balance global and local representations.
Although these methods improve representation capacity through feature integration, they mainly focus on enhancing fused representations rather than explicitly addressing inconsistencies between spatial and frequency domains. As pointed out in UFCNet [
20], combining spatial and spectral operators improves performance but does not explicitly resolve conflicting responses arising from their fundamentally different characteristics.
In essence, spatial representations emphasize local continuity and structural alignment, whereas frequency representations capture global distributions and periodic patterns. These inherently different properties may lead to inconsistent responses during multimodal fusion, especially in complex scenes with heterogeneous structures. Such inconsistencies remain insufficiently explored in existing methods.
Therefore, explicitly modeling and resolving spatial–frequency representation conflict remains an open and important problem in multimodal remote sensing segmentation, which motivates the design of our CAF-Net.
3. Methodology
3.1. Overall Architecture
The overall architecture of CAF-Net is illustrated in
Figure 2a. The proposed framework follows a dual-branch encoder design based on SegFormer-B4 [
21] to process optical imagery and DSM modalities in parallel. Given an optical image
and a DSM input
, two modality-specific branches extract hierarchical representations across four stages, where the spatial resolution is progressively reduced from
to
of the input. This hierarchical design enables the model to capture both low-level spatial details and high-level semantic information.
Although optical imagery and DSM data provide complementary cues for scene understanding, directly fusing these features is non-trivial. Optical imagery primarily encodes appearance information such as texture and spectral patterns, while DSM data describe geometric structures and elevation variations. These intrinsic differences often lead to representation conflicts, especially in challenging regions affected by noise, occlusion, or complex object boundaries.
Moreover, such conflicts may be further amplified when spatial representations interact with frequency-domain characteristics, resulting in inconsistent responses during feature fusion.
To address these challenges, CAF-Net is designed to explicitly model and resolve spatial–frequency representation conflicts in a unified framework. Instead of relying on a single fusion strategy, we decompose the fusion process into three complementary components, each handled by a dedicated module. First, Cross-Modal Structure Guidance (CMSG) is introduced to enhance spatial consistency. By injecting DSM-derived geometric priors into optical features, CMSG strengthens boundary awareness and improves structural alignment between modalities. Second, the Adaptive Cross-Frequency Module (ACFM) focuses on modeling complementary frequency representations. By decomposing features into different frequency components and adaptively reweighting them, ACFM improves global semantic consistency and mitigates discrepancies caused by heterogeneous data distributions. Third, the Uncertainty-Aware Fusion (UAF) serves as a dynamic fusion mechanism. Instead of directly aggregating features, UAF estimates pixel-wise reliability for each modality and adaptively balances their contributions, thereby suppressing unreliable responses and preserving complementary information.
These three components are progressively integrated across different stages of the encoder. CMSG and UAF operate throughout the network to refine spatial representations and stabilize multimodal fusion, while ACFM is applied only at the final stage to enhance high-level semantic alignment. This design is motivated by two considerations. First, frequency-domain modeling is more effective at higher semantic levels, where features encode global context rather than low-level textures. Applying frequency alignment at early stages may disrupt local spatial details that are critical for boundary preservation. Second, the Discrete Cosine Transform (DCT) operations in ACFM involve global transformations, and applying them at lower-resolution feature maps significantly reduces computational overhead. Through this coordinated design, CAF-Net jointly models spatial and frequency representations, enabling robust and consistent multimodal feature learning in complex remote sensing scenarios.
3.2. Cross-Modal Structure Guidance
In complex remote sensing scenes, accurate boundary delineation remains a challenging problem due to texture ambiguity, illumination variations, and background noise in optical imagery. Although optical features provide rich appearance information, they are often insufficient for capturing precise object structures. In contrast, DSM data encode stable geometric cues, such as elevation discontinuities and object contours, which are less sensitive to appearance variations.
As illustrated in
Figure 2b, motivated by this observation, we introduce CMSG to explicitly leverage DSM-derived structural information for spatial refinement within the encoder. The key idea is to enhance structure-consistent regions in optical features while suppressing ambiguous responses caused by texture noise.
At stage
l, structural representations are first extracted from DSM features by suppressing locally smooth components:
where
denotes a learnable depth-wise convolution with a kernel size of
, stride 1, padding 1, and no bias. It performs local smoothing independently on each channel. A separate CMSG instance is used at each encoder stage; therefore, its parameters are not shared across stages. All convolutional layers in CMSG are initialized from a zero-mean normal distribution with standard deviation
, where
; convolutional biases, when present, are initialized to zero. Batch-normalization scale and bias parameters are initialized to 1 and 0, respectively. This residual-like formulation highlights high-frequency information corresponding to edges and structural discontinuities.
The extracted structural representations are further refined through a lightweight transformation module, referred to as the Refinement Block, which consists of Batch Normalization; ReLU activation; a bias-free convolution that preserves the channel dimension, followed by another Batch Normalization step; and ReLU activation. This design suppresses noise and enhances discriminative geometric patterns while introducing limited computational overhead.
The refined structural representations are then integrated with optical features through an attention-based interaction mechanism. Specifically, the Attention Block concatenates the optical and structural features and applies two
convolutions with an intermediate ReLU activation and a final sigmoid normalization. For an input with
channels, the intermediate width is
and the output contains
spatial attention maps. This conditional attention mechanism allows the model to emphasize responses that are consistent with DSM-derived structures while retaining the original optical representation through the residual update in Equation (
2).
Finally, the optical representation is modulated in a residual manner:
where
denotes the spatial attention map generated from the fused representations using a lightweight convolutional attention head followed by a sigmoid activation. This formulation enhances boundary-related responses while preserving the original semantic information.
Compared with direct feature fusion, CMSG explicitly injects geometric priors into the spatial representation, enabling more accurate boundary delineation and improved alignment between modalities. CMSG outputs a structure-enhanced feature map with the same spatial resolution and channel dimension as the input features, which is used to refine the optical representation for subsequent fusion. This design is particularly effective in challenging regions where texture cues are unreliable but structural information remains consistent.
3.3. Adaptive Cross-Frequency Module
While CMSG improves spatial consistency, discrepancies between modalities also arise in the frequency domain. In multimodal remote sensing data, different modalities often exhibit complementary characteristics across frequency bands. In particular, low-frequency components mainly capture coarse semantic structures and global contextual information, whereas high-frequency components encode fine-grained details such as edges, textures, and local variations. However, directly combining these representations may introduce inconsistency, since different modalities often emphasize different frequency ranges and respond differently to scene variations.
As illustrated in
Figure 2d, we introduce ACFM at the final stage of the encoder, where feature maps contain rich semantic information and reduced spatial resolution. Given the high-level features
and
, we first project them into a compact embedding space and transform them into the frequency domain using a Discrete Cosine Transform:
where
denotes the DCT operator. This transformation decomposes the feature map into different frequency components, making global semantic structures and local details explicitly separable.
Based on this representation, we perform frequency decomposition using a fixed radial binary mask. For a DCT coefficient at index
in an
feature map, the normalized radial coordinate and low-frequency mask are defined as
where a denominator is replaced by 1 if the corresponding spatial dimension equals 1. The high-frequency mask is
, and
in all experiments. Thus,
and
. The low-frequency component mainly preserves smooth and coarse semantic information, while the high-frequency component retains local structural variations and detailed responses.
Specifically, a lightweight gating branch predicts the importance of low-frequency and high-frequency responses, and the recomposed frequency feature is formulated as
where
and
denote the low-frequency and high-frequency components of modality
, respectively. The coefficients
and
are sample-wise scalars of shape
. They are predicted from each projected modality feature by global average pooling, a
convolution that reduces the width to
, ReLU, a second
convolution with two outputs, and element-wise sigmoid activation. The two coefficients are independently learned and are not constrained to sum to one, allowing the network to enhance or suppress the two frequency bands independently.
After adaptive reweighting, the fused frequency representation is mapped back to the spatial domain through the inverse discrete cosine transform. The Inverse Discrete Cosine Transform (IDCT) operation is necessary because subsequent multimodal interaction and feature refinement are performed in the spatial domain:
where
denotes the inverse DCT operator. This step converts frequency-enhanced features into spatial feature maps while preserving the information selected during frequency decomposition and reweighting.
To further improve cross-modal consistency, the reconstructed optical and DSM features are then aligned through a cross-attention mechanism. In this process, optical imagery provides the query while DSM provides the key and value, enabling the model to explicitly capture complementary responses across modalities and reduce semantic discrepancy between them. Through this operation, ACFM encourages the frequency-enhanced features of the two modalities to focus on semantically corresponding regions rather than remaining independently distributed.
Following cross-attention, a Channel Attention Block is employed to refine the aligned feature responses. The purpose of this block is to adaptively recalibrate channel-wise importance after cross-modal interaction. Since different channels may carry different levels of semantic relevance after frequency alignment, channel attention helps emphasize informative responses while suppressing redundant or noisy channels, thereby improving representation compactness and discriminability.
Finally, the refined feature is fused with the original optical feature through a residual connection:
where
denotes the aligned and channel-refined frequency feature in the spatial domain. This residual design preserves the original semantic information while injecting complementary frequency-domain cues.
Compared with direct spatial fusion, ACFM explicitly models frequency-domain interactions and progressively completes four steps: frequency decomposition, adaptive reweighting, inverse reconstruction, and cross-modal alignment. Through this design, the module resolves discrepancies between global semantic patterns and local structural details, improves cross-modal consistency, and provides more robust high-level representations in challenging remote sensing scenarios.
3.4. Uncertainty-Aware Fusion
While CMSG and ACFM respectively address spatial and frequency discrepancies, inconsistencies between modalities may still persist during feature integration. In real-world remote sensing scenarios, the reliability of optical and DSM representations often varies significantly across spatial locations. For example, optical representations may become unreliable in shadowed regions or areas with severe texture ambiguity, whereas DSM representations may be affected by noise, missing data, or sensor artifacts. Under such conditions, directly aggregating representations from different modalities can propagate unreliable information and degrade segmentation performance.
To address this issue, we introduce UAF, which formulates multimodal fusion as a reliability-aware decision process. The confidence maps are learned jointly through the segmentation objective and are used as relative reliability indicators rather than calibrated probabilistic uncertainty estimates. Accordingly, the term “uncertainty-aware” refers to adaptive suppression of comparatively low-confidence modality responses, not Bayesian uncertainty estimation. As illustrated in
Figure 2c, UAF estimates the relative confidence of each modality at each spatial location and dynamically adjusts their contributions.
At stage
l, given the structure-enhanced optical representation
and the DSM representation
, two modality-specific confidence maps are first predicted:
where
and
are two modality-specific confidence estimation modules with independent parameters. Each module consists of a bias-free depth-wise
convolution with stride 1 and padding 1, Batch Normalization, ReLU, a bias-free
projection to
channels, another ReLU, and a final
convolution that produces a single-channel score map. The outputs
and
are unnormalized relative-confidence logits; they are not probabilities before the cross-modal normalization in Equation (
9):
The confidence maps are concatenated along the modality dimension and normalized using a temperature-scaled Softmax operation, producing two spatially adaptive weighting maps whose values sum to one at each pixel location. Here,
is used in the reported experiments. A smaller
T leads to a more peaked distribution, emphasizing the dominant modality, while a larger
T produces smoother weighting across modalities.
These weights are finally used to compute the fused representation:
This formulation introduces an explicit competition mechanism between modalities, allowing the model to prioritize more reliable representations while suppressing low-confidence responses. By dynamically adjusting fusion weights across spatial locations, UAF effectively mitigates the impact of modality-specific noise and reduces over-reliance on any single modality. This design complements the spatial refinement in CMSG and the frequency alignment in ACFM, enabling more robust and conflict-aware multimodal representation learning across both spatial and frequency domains.
3.5. Multi-Criteria Loss Function
To effectively optimize multimodal representations and alleviate spatial–frequency inconsistencies, we adopt a multi-criteria training objective that jointly considers segmentation accuracy and cross-domain consistency. The overall loss function is formulated as
where
denotes the segmentation loss, and
and
are balancing coefficients.
Segmentation Loss (). The segmentation loss supervises pixel-wise classification and ensures accurate semantic prediction. It is implemented as a combination of cross-entropy and Dice loss to balance class distribution and boundary accuracy.
Collaborative Consistency Loss (). To explicitly reduce inconsistencies between different feature representations, we introduce a collaborative consistency constraint across multiple branches. Specifically, at Stage 4, we enforce alignment between the outputs of CMSG, ACFM, and UAF:
This loss encourages the spatially refined features (from CMSG) and frequency-aligned features (from ACFM) to be consistent with the fused representation. By explicitly constraining multiple representations to converge, this term effectively mitigates conflicts between spatial and frequency domains and promotes coherent feature learning.
Low-frequency Consistency Loss (). To further stabilize global semantic structures, we introduce a low-frequency consistency constraint. Based on the frequency decomposition in ACFM, we focus on aligning low-frequency components that encode global contextual information:
Here, the low-frequency mask is applied to the DCT coefficients rather than directly to the spatial-domain feature maps. Specifically,
and
denote the frequency-domain representations of the Stage-4 optical and DSM features, respectively, and
denotes the same fixed radius-based low-frequency mask used in ACFM, with the normalized radius threshold
. The loss therefore measures the discrepancy between the masked low-frequency coefficients of the two modalities. This term enforces consistency in coarse semantic representations across modalities, reducing discrepancies in global structure and improving overall semantic coherence.
Overall, the proposed loss function complements the architectural design by jointly constraining spatial refinement, frequency alignment, and multimodal fusion. Through this coordinated optimization, the model achieves more consistent and robust representations under complex multimodal conditions.
The balancing coefficients and control the relative importance of consistency constraints. In practice, is set to 0.5 to moderately enforce cross-branch alignment without overwhelming the segmentation objective, while is set to 0.1 to provide a mild regularization on low-frequency components. We empirically observe that this configuration achieves a good trade-off between optimization stability and performance, and the model is not highly sensitive to small variations of these parameters.
3.6. Conflict Measurement
To analyze feature discrepancies between the spatial and frequency processing paths, we introduce a cosine-distance-based diagnostic metric. For every model variant, the two compared tensors are taken before UAF at Stage 4: is the output of CMSG and is the output of ACFM. Both tensors are generated in parallel from the same Stage-4 optical and DSM encoder features. They have identical dimensions ( and are of the input dimensions), so no channel projection or spatial interpolation is required before comparison. When a module is disabled in an ablation variant, its corresponding path returns the unmodified Stage-4 optical feature, which preserves a consistent comparison interface across variants.
Given two feature maps
and
, the conflict at each spatial location
is defined as
where
denotes the feature vector at spatial position
. This formulation measures the angular difference between feature embeddings, where larger values indicate higher feature discrepancy. Based on the resulting conflict map
, we compute two complementary statistics.
Global Conflict. The overall discrepancy across the feature map is computed as
Boundary Conflict. To focus on structurally sensitive regions, we further evaluate conflict around object boundaries:
where
denotes a binary boundary mask derived independently for each ground-truth patch. Specifically, the class-index label map is converted to an 8-bit image and processed using the Canny operator with lower and upper thresholds of 0 and 1. The resulting one-pixel-wide boundary map is binarized and resized to the Stage-4 feature resolution using nearest-neighbor interpolation. No additional morphological dilation is applied. Global Conflict is averaged over all Stage-4 spatial positions and evaluated patches, whereas Boundary Conflict is averaged only over positions selected by the resized boundary masks.
The two metrics are computed after training and are used only as diagnostic indicators of global and boundary-focused feature discrepancy. They do not form part of the optimization objective and should not be interpreted as causal evidence that a particular module resolves the observed discrepancies.
4. Results
4.1. Experimental Setup
Datasets. Experiments are conducted on two widely used benchmarks for high-resolution remote sensing semantic segmentation, namely ISPRS Vaihingen and Potsdam [
22].
ISPRS Vaihingen. The Vaihingen dataset consists of 33 high-resolution aerial orthophotos acquired over Vaihingen, Germany, with an average ground sampling distance (GSD) of 9 cm. Each image contains three spectral bands (near-infrared, red, and green), referred to as optical imagery, along with corresponding normalized digital surface models (nDSMs), which provide elevation information. The dataset is annotated with six land-cover classes, including impervious surfaces, buildings, low vegetation, trees, cars, and background. Following the standard protocol, 12 tiles are used for training and 4 tiles for testing. Due to the large image size, a sliding-window strategy with a patch size of is adopted during both training and inference.
ISPRS Potsdam. The Potsdam dataset provides higher-resolution urban scenes with a GSD of 5 cm. It contains 24 orthophotos of size approximately pixels, captured over Potsdam, Germany. Each image includes four spectral bands (red, green, blue, and near-infrared) along with corresponding nDSM data. Similar to Vaihingen, the dataset is annotated with the same set of semantic classes. We follow the official split, using 18 images for training and 6 for testing. A sliding-window approach with a patch size of is also applied to handle large-scale inputs.
Implementation Details. All experiments were implemented in PyTorch 2.5.0 and trained using AdamW with an initial learning rate of 0.01,
,
, and a weight decay of 0.01. A cosine-annealing schedule was applied at each optimization step over the complete 100-epoch training process, without learning-rate warmup. The batch size was 10. No explicit class rebalancing was used. Following the adopted ISPRS split, no additional validation subset was constructed; models were trained on the predefined training tiles and evaluated on the stated test tiles. During training,
patches were randomly sampled. Data augmentation comprised random horizontal and vertical flips, each with probability 0.5. Optical values were scaled to
by division by 255, while each DSM tile was independently min–max-normalized. During inference, a
sliding window with a stride of 32 pixels was used, and logits from overlapping windows were accumulated before the pixel-wise argmax operation. For fair comparison, no official test-set results or official task-specific checkpoints were directly copied into the reported tables. All compared methods were retrained on the ISPRS Vaihingen and Potsdam datasets using their publicly available implementations. The dataset splits, input preprocessing, patch size, data augmentation, total number of epochs, sliding-window inference protocol, and evaluation metrics were unified across methods. At the same time, method-specific architectural settings were preserved, including the published backbone, fusion structure, channel configuration, and officially recommended module hyperparameters, so that the original designs were not altered. When a method officially adopted a pretrained backbone initialization, the same initialization strategy was retained; however, the segmentation heads and fusion modules were trained on the ISPRS training sets, and no official remote-sensing segmentation checkpoint was used for the reported test values. Unimodal methods received only the optical input, whereas multimodal methods received the co-registered optical and DSM pair. For multimodal methods originally developed for another auxiliary sensor, only the auxiliary-input interface was adapted to accept the single-channel DSM; the published backbone and fusion architecture were retained. Each ablation configuration was independently trained and evaluated using five fixed random seeds,
. The seed set was specified before aggregation; seed 42 retains the original experiment, while the other four seeds provide distinct initialization and data-sampling states. The ablation experiments report the mean and standard deviation obtained over these five repeated runs. The source code and implementation details of the proposed CAF-Net are provided in the
Supplementary Materials to facilitate reproducibility.
Evaluation Metrics. Model performance is evaluated using standard metrics for semantic segmentation, including Overall Accuracy (OA), mean Intersection over Union (mIoU), mean F1-score (mF1), and the Kappa coefficient (). These metrics provide complementary assessments of classification accuracy, region overlap, and agreement consistency.
4.2. Comparison with the State of the Art
As shown in
Table 1, CAF-Net achieves the best mIoU on both the Vaihingen and Potsdam datasets and also obtains the best mF1 on both benchmarks, while remaining competitive in OA and Kappa. Compared with the unimodal baseline SegFormer-B4, CAF-Net achieves clear improvements in mIoU, indicating that incorporating DSM-derived geometric information significantly enhances structural representation. Furthermore, compared with recent multimodal methods such as FDMF-Net, CAF-Net achieves superior performance, particularly on the Potsdam dataset. This improvement demonstrates that explicitly modeling spatial–frequency interactions is more effective than relying on static frequency manipulation or direct feature fusion. Overall, these results suggest that resolving spatial–frequency representation conflicts is a key factor for achieving robust and consistent multimodal segmentation.
Table 2 presents the category-wise IoU comparison. CAF-Net achieves strong performance across most categories, especially for buildings and roads, where accurate structural modeling is critical. The improvement on buildings reflects enhanced boundary preservation, while the gain on roads indicates better sensitivity to fine-scale structures. For spectrally ambiguous categories such as low vegetation, CAF-Net maintains competitive performance, benefiting from uncertainty-aware fusion in challenging regions. Although the improvement on cars is relatively moderate, the overall results demonstrate that jointly modeling spatial and frequency representations leads to more balanced and reliable predictions across diverse semantic categories.
4.3. Qualitative Results
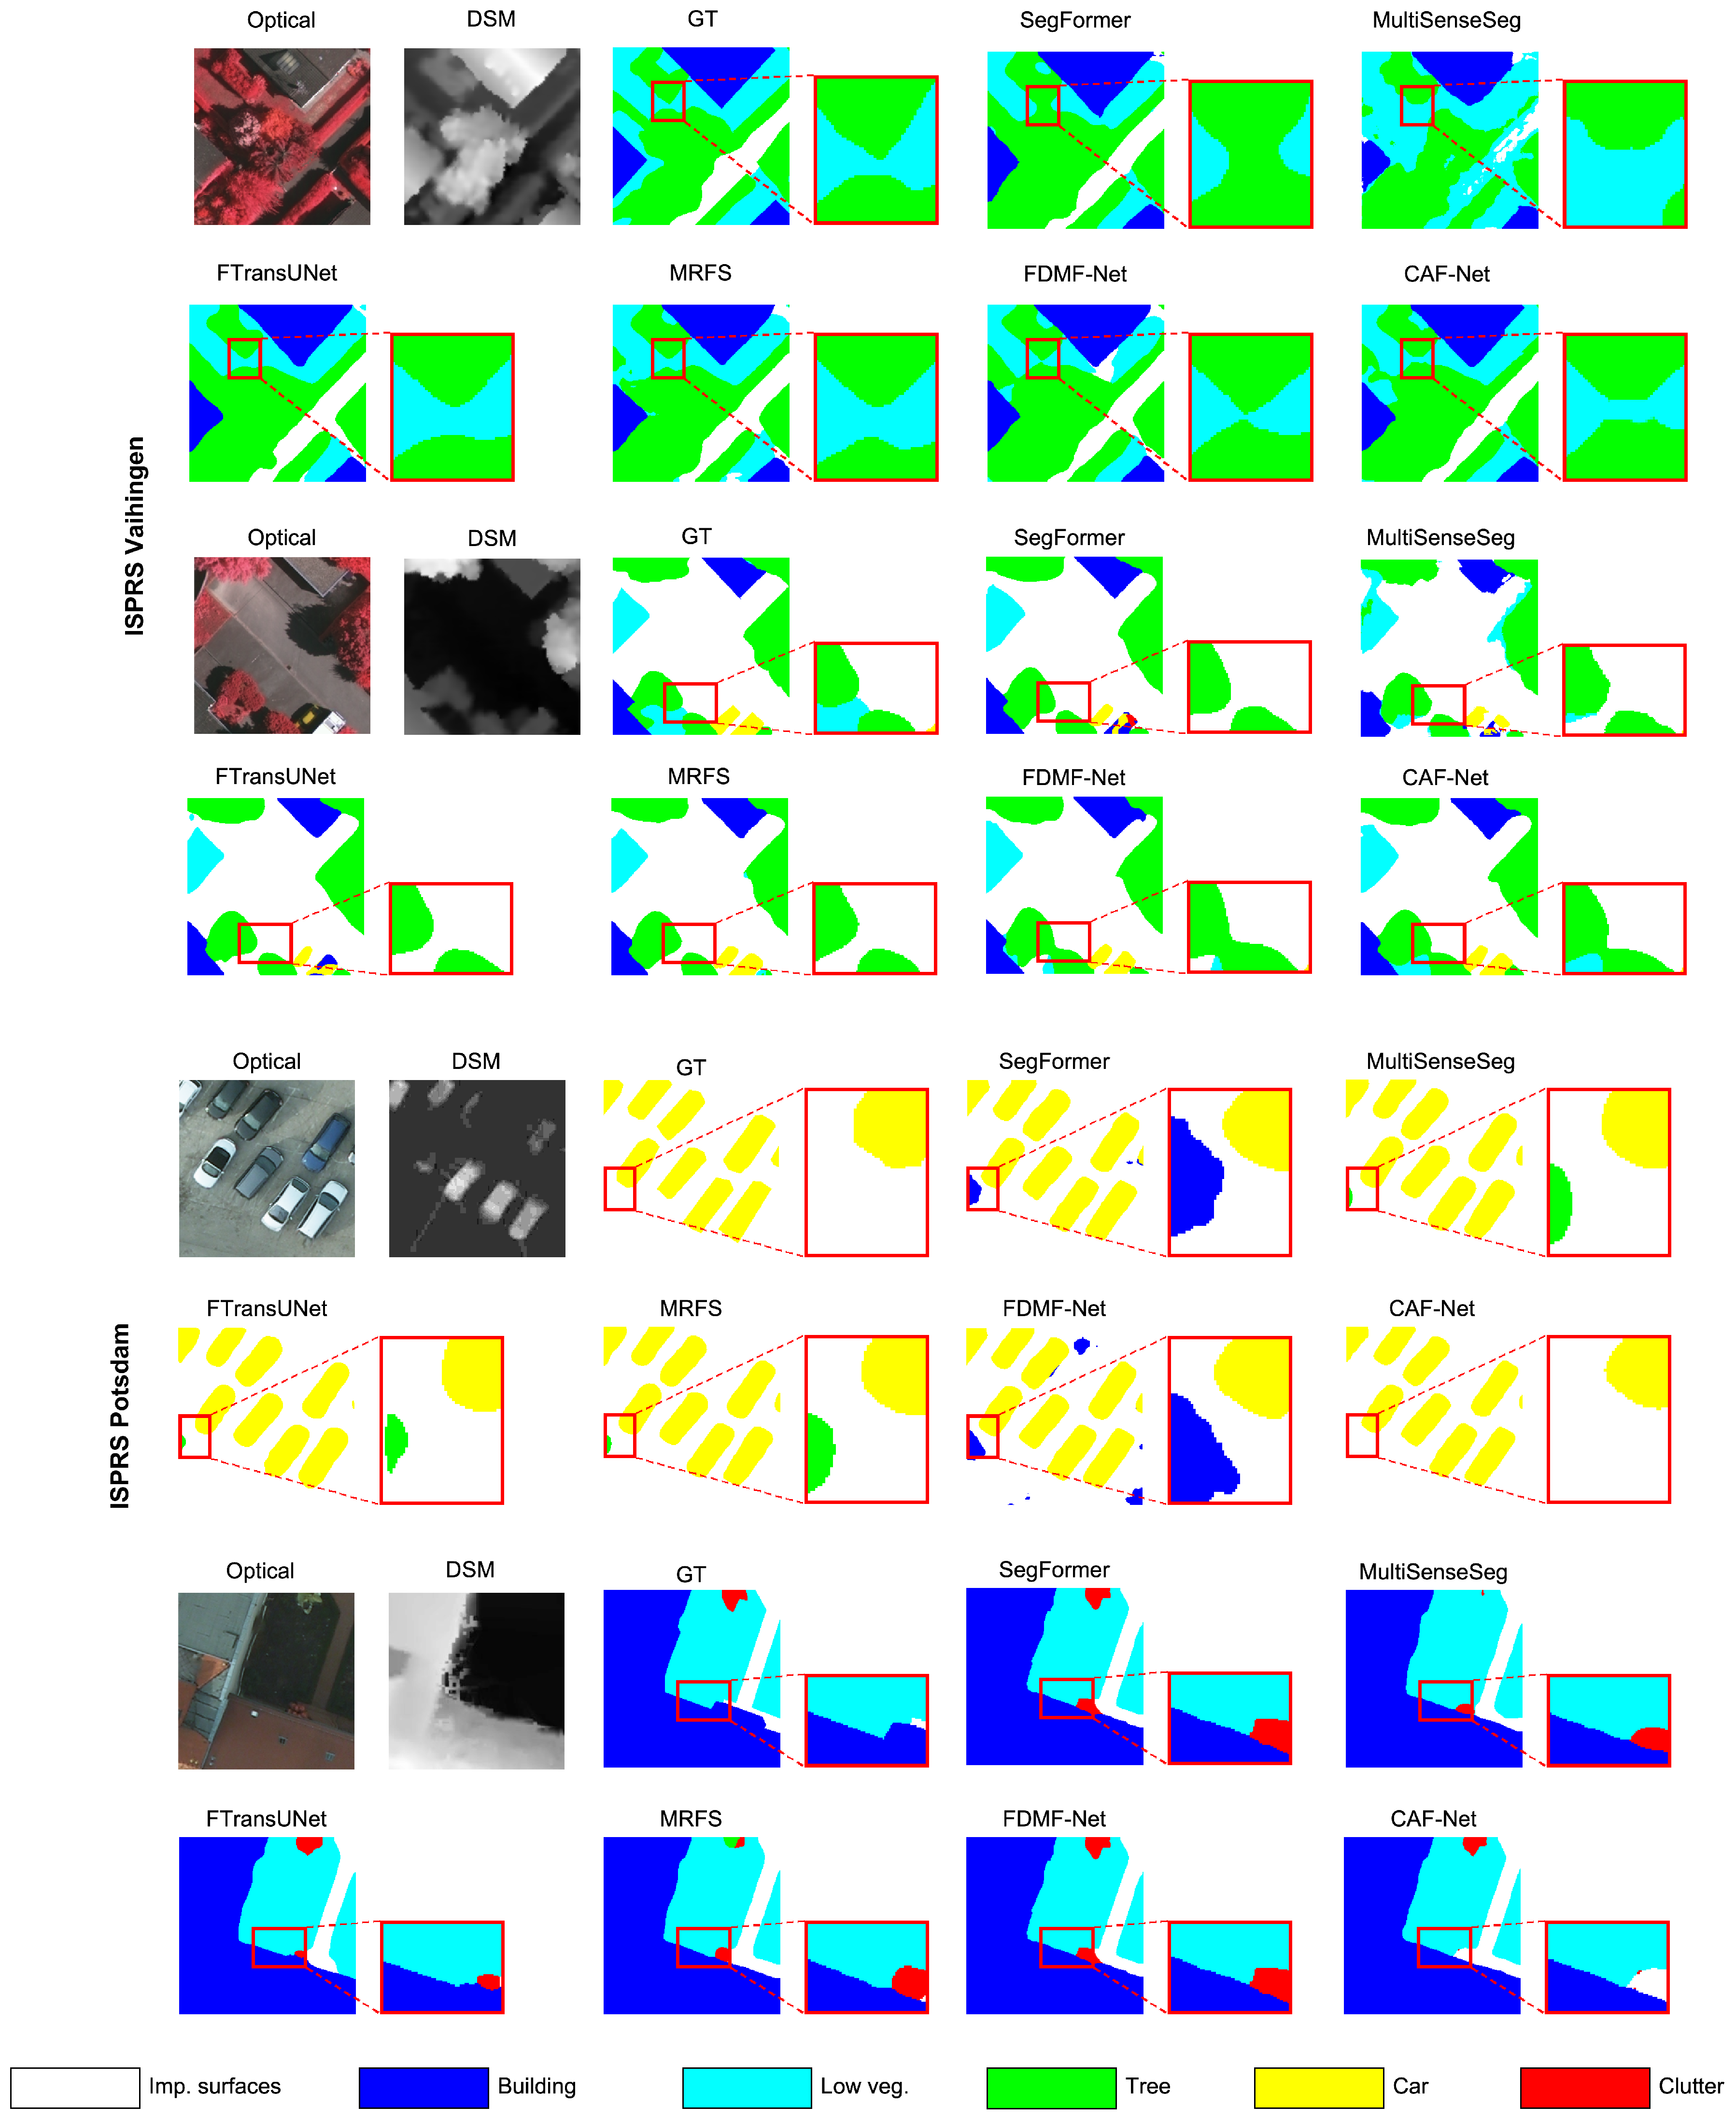
Figure 3 presents qualitative comparisons on the ISPRS Vaihingen and Potsdam datasets. To make local differences easier to inspect, one representative region is enlarged for each scene, with identical crop coordinates used for the GT and every compared method. The enlarged crops show that several existing methods produce less sharp boundaries, locally fragmented regions, or isolated misclassified pixels in the selected challenging areas. Multimodal methods such as FDMF-Net alleviate some of these errors but may still exhibit incomplete structures or local confusion. In comparison, CAF-Net generally produces predictions that are more spatially coherent and closer to the displayed GT boundaries. The car-dominated Potsdam example also shows fewer spurious responses around the selected small-object region. These visual results provide qualitative support for improved boundary consistency and local prediction stability, while the quantitative comparisons provide the primary performance evidence.
These improvements can be attributed to the coordinated design of CAF-Net. CMSG enhances spatial consistency by reinforcing geometric structures, ACFM improves global semantic alignment in the frequency domain, and UAF dynamically resolves inconsistencies between modalities. As a result, CAF-Net achieves more consistent predictions across both spatial and frequency domains, leading to robust performance in challenging multimodal scenarios.
4.4. Computational Complexity Analysis
Table 3 presents the comparison of model complexity and segmentation performance on the Potsdam dataset. CAF-Net achieves the best mIoU among all compared methods while maintaining a moderate computational cost, demonstrating a favorable balance between accuracy and efficiency. Compared with recent multimodal fusion methods using the same backbone, CAF-Net achieves higher segmentation accuracy with reduced computational overhead. In particular, CAF-Net reduces the parameter count by approximately 28M and lowers FLOPs by 15.9% compared with FDMF-Net, while still improving mIoU. This indicates that explicitly modeling spatial–frequency interactions enables more efficient feature utilization than direct feature fusion or static frequency modeling. Compared with CNN-based methods, CAF-Net also achieves competitive efficiency. Despite using a transformer-based backbone, the model maintains a relatively low computational cost, benefiting from lightweight operations such as depth-wise separable convolutions and adaptive feature selection. This design avoids unnecessary redundancy while preserving strong representation capability. Overall, these results demonstrate that CAF-Net achieves a superior accuracy–efficiency trade-off. By resolving spatial–frequency inconsistencies in a structured manner, the model not only improves segmentation performance but also reduces redundant computation, making it more suitable for practical remote sensing applications.
4.5. Ablation Study
To evaluate the contribution of each component, we conduct a comprehensive ablation study, as shown in
Table 4. Starting from the baseline, introducing CMSG yields the largest individual improvement, increasing mIoU from 82.35% to 83.60% on Vaihingen and from 84.76% to 86.00% on Potsdam. This result highlights the effectiveness of DSM-derived structural guidance in enhancing boundary delineation and spatial consistency. ACFM also consistently improves segmentation performance, demonstrating that frequency-domain modeling provides complementary semantic information beyond conventional spatial representations.
When applied independently, UAF yields relatively modest gains compared with CMSG and ACFM. The combination of CMSG and ACFM produces a stronger result than either frequency or structure guidance alone, but residual inconsistencies may still exist between spatially guided and frequency-enhanced representations. By further incorporating UAF, the full model achieves the best overall performance in
Table 4, reaching 84.35% mIoU on Vaihingen and 86.86% mIoU on Potsdam.
These results indicate that the primary role of UAF is not merely to improve segmentation accuracy in isolation, but to facilitate effective interaction between structure-guided and frequency-aligned features through reliability-aware fusion. Overall, the full model achieves the best performance, demonstrating that jointly modeling structural guidance, frequency alignment, and adaptive fusion is essential for robust multimodal remote sensing segmentation.
5. Discussion
5.1. Robustness Under Modality Degradation
As shown in
Table 5, the Full model achieves the highest clean performance and remains the best-performing variant under all evaluated degradations. Optical noise produces the largest reduction for the Baseline model, whereas the w/o UAF variant shows much stronger sensitivity to DSM-related degradations. Under optical noise, the Full model retains 67.10% mIoU. Under local DSM missing regions and DSM elevation noise, the Full model reaches 82.58% and 83.50% mIoU, respectively, corresponding to relatively small decreases from its clean result. Under DSM–optical misalignment, the Baseline decreases from 82.35% to 81.09%, whereas the Full model retains 84.04% mIoU, indicating lower sensitivity to the simulated spatial displacement.
The w/o UAF variant is highly sensitive to every DSM degradation, falling to approximately 23% mIoU under local missing regions, misalignment, complete missingness, and elevation noise. The similar values under these perturbations do not indicate that the perturbations are identical; rather, they suggest that the model enters a similar failure regime once DSM-derived guidance becomes unreliable. In the w/o UAF variant, DSM features are still actively used by CMSG and ACFM, but no reliability-aware mechanism is available to reduce their contribution. Therefore, corrupted DSM responses are not simply ignored; instead, they are injected into the optical representation as misleading structural and frequency-domain guidance. Local missing regions introduce discontinuous zero-valued structures, misalignment destroys pixel-level optical–DSM correspondence, complete missingness produces an out-of-distribution constant DSM input, and elevation noise introduces spurious high-frequency responses. Although these perturbations differ in form, they all invalidate the DSM-guided modulation and frequency-alignment pathways, leading to a common low-performance regime with mIoU values ranging from 22.99% to 23.83%. To simulate complete modality failure, the DSM input is replaced with an all-zero tensor during inference, while all models are trained using complete optical–DSM pairs. For consistency, all degraded evaluations use the same trained checkpoint and sliding-window inference protocol as the clean evaluation, and the perturbations are applied only at inference.
Under complete DSM missingness, the Full model retains 80.00% mIoU, compared with 23.83% for w/o UAF. Taken together, these experiments provide broader evidence that relative-reliability weighting reduces sensitivity to several forms of modality degradation. Nevertheless, these tests represent controlled synthetic perturbations and do not cover every source of variability encountered in operational remote sensing.
5.2. Conflict Analysis
To further analyze the relationship between feature discrepancy and model behavior, we report the conflict metrics defined in
Section 3.6. The results are summarized in
Table 6.
The baseline model exhibits relatively high feature conflict, indicating a noticeable discrepancy between spatial and frequency representations. When UAF is removed, the measured conflict increases, with Global Conflict rising from 0.958 to 1.997. This indicates that without adaptive fusion, the interaction between spatial and frequency features becomes less aligned. In contrast, the Full model shows lower conflict values, achieving a Global Conflict of 0.328 and a Boundary Conflict of 0.200. This suggests reduced feature-level discrepancy under the proposed fusion strategy. We further observe that the trend of conflict values is consistent with the performance changes reported under noise and modality degradation settings. This consistency suggests an association between feature-level discrepancy and segmentation performance under challenging conditions. Overall, these results provide a diagnostic analysis of feature consistency across different model variants, rather than serving as causal evidence of model behavior.
5.3. Mechanism Interpretability and Qualitative Analysis
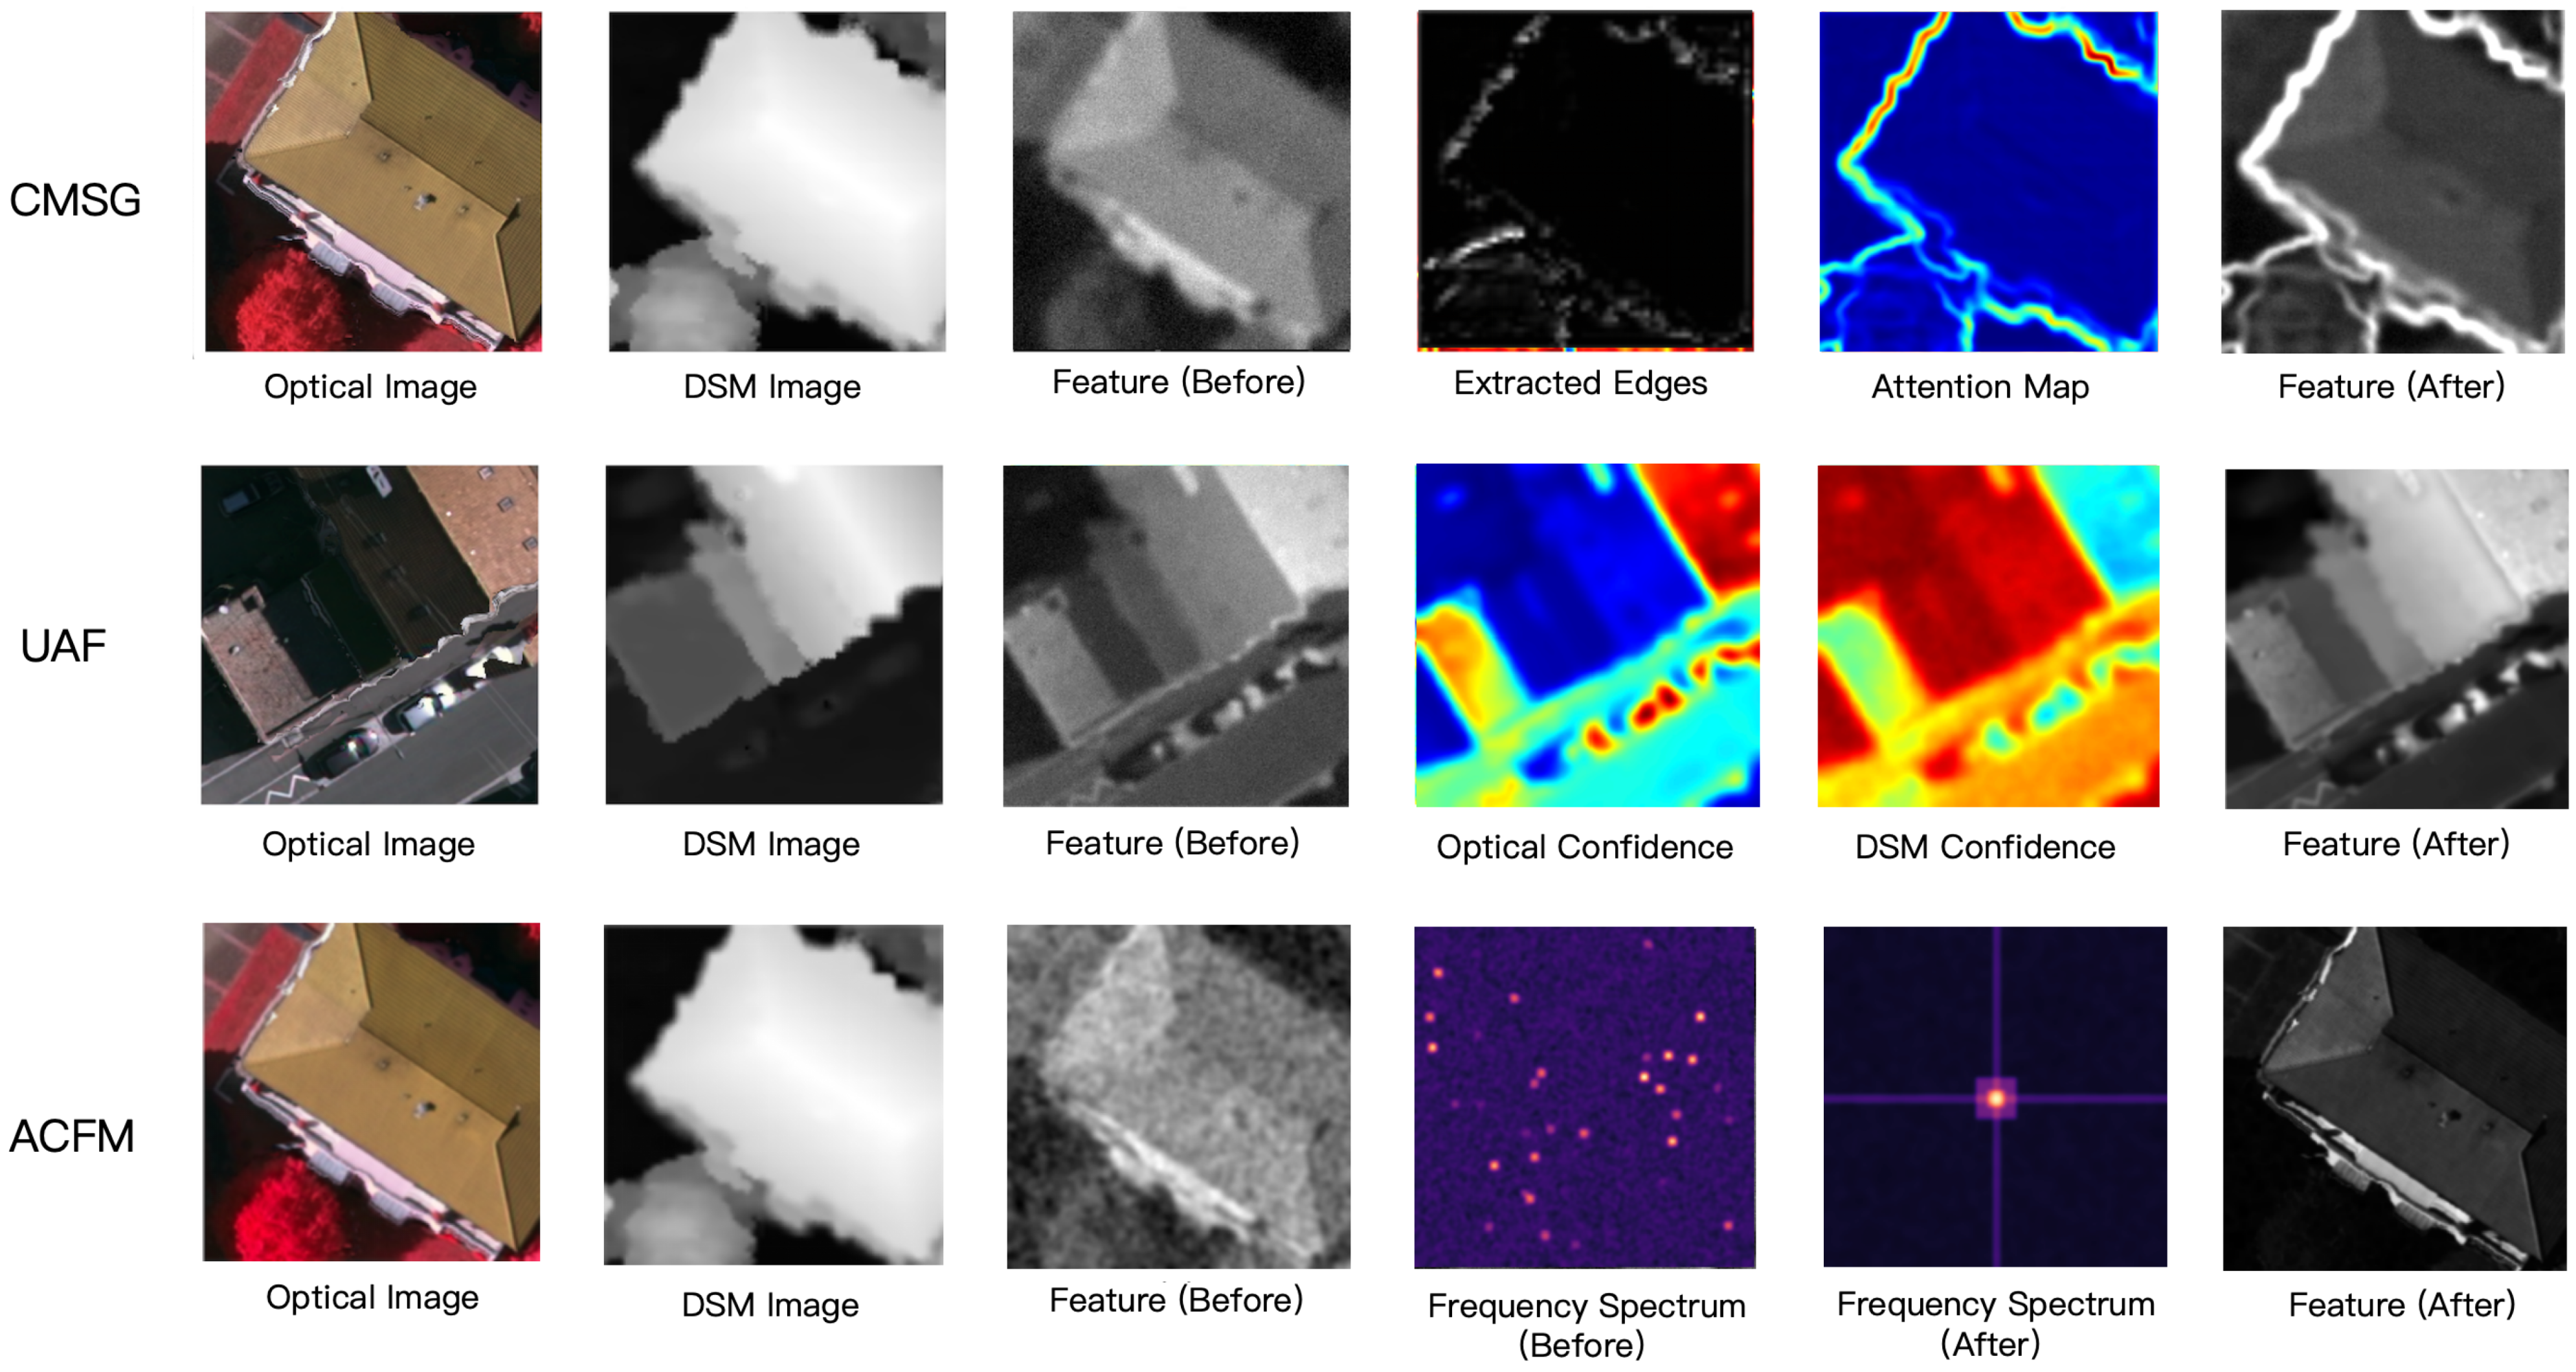
To analyze the internal mechanics of the proposed framework, we visualize the intermediate feature states of the three core modules in
Figure 4. This visualization tracks the progressive refinement of spatial structures, modality fusion weights, and frequency domain distributions.
The first row of
Figure 4 illustrates the CMSG branch. The optical input contains urban textures with ambiguous transitions between the building roof and its surroundings. The DSM-derived structural map emphasizes elevation discontinuities near the object boundary. The learned attention response is also concentrated around parts of these discontinuities. Compared with the feature before CMSG, the refined representation shows more localized responses near the depicted boundary. This qualitative observation is consistent with the intended role of DSM-guided structural modulation, but does not by itself establish a causal explanation.
The second row illustrates the pixel-level weighting strategy of UAF for a scene containing a building shadow. The optical reliability map assigns a comparatively lower response to part of the shadowed region, whereas the DSM reliability map gives a higher response in the corresponding area. The fused representation retains a more coherent activation pattern over the displayed structure. This example suggests that relative-reliability weighting can reduce the contribution of locally degraded modality features; broader quantitative evidence is provided by the degradation experiments.
The third row visualizes frequency responses before and after ACFM. The displayed spectrum changes from a more dispersed response to a distribution with stronger central concentration after adaptive reweighting and alignment. The reconstructed spatial feature also shows a more spatially coherent response over the depicted object. These observations are consistent with frequency selection and cross-modal alignment, although the visualization should be interpreted together with the quantitative ablation and conflict analyses.
Together, these stage-wise visualizations illustrate how CAF-Net differs from direct concatenation by combining spatial structure modulation, relative-reliability weighting, and frequency alignment. They are presented as qualitative support rather than direct proof of the proposed mechanism.
5.4. Sensitivity Analysis of Temperature Coefficient
To evaluate the influence of the temperature coefficient
T in UAF, we conduct experiments on both the Vaihingen and Potsdam datasets. The temperature parameter controls the sharpness of the Softmax distribution, thereby affecting the strength of modality competition during fusion. As shown in
Table 7, the performance remains stable across a wide range of temperature values. Variations in
T lead to only minor changes in mIoU and F1-score, indicating that the proposed framework is not sensitive to this hyperparameter. This suggests that the reliability-aware fusion mechanism can adaptively balance modality contributions without requiring precise tuning. Notably,
achieves the best Kappa and OA on both datasets, while maintaining competitive performance in mIoU and F1-score. Smaller values of
T lead to slightly sharper weighting, whereas larger values produce smoother distributions, but neither significantly degrades performance.
Overall, these results demonstrate that UAF is robust to the choice of temperature coefficient, and the proposed fusion strategy maintains stable performance across different settings. Therefore, is adopted as the default configuration in all experiments.
6. Conclusions
In this paper, we present CAF-Net, a unified framework for optical–DSM semantic segmentation that explicitly addresses spatial–frequency representation conflicts in multimodal learning. The proposed architecture replaces standard feature aggregation with a coordinated conflict resolution mechanism. Specifically, the CMSG component extracts elevation priors to correct spatial boundary ambiguities. The ACFM aligns high-frequency structural details with low-frequency global semantics. These modules are complemented by the UAF, which computes pixel-wise reliability maps to prevent the propagation of degraded data during the fusion process.
Extensive experiments on the ISPRS Vaihingen and Potsdam datasets demonstrate that CAF-Net achieves superior performance, reaching 84.35% and 86.86% mIoU, respectively. Beyond standard accuracy improvements, computational complexity analysis suggests that the framework maintains a highly favorable accuracy–efficiency trade-off, requiring fewer parameters and floating-point operations than recent multimodal baselines. Quantitative evaluations based on the proposed conflict measurement metric show a substantial reduction in cross-domain inconsistencies, particularly along sensitive object boundaries. Controlled robustness tests further show improved performance retention under optical noise, DSM elevation noise, local and complete DSM missingness, and optical–DSM misalignment.
Overall, this work demonstrates that resolving structural and semantic conflicts, rather than solely increasing feature extraction capacity, is an important factor for effective multimodal integration. This insight provides a useful perspective for designing multimodal segmentation models and highlights the potential benefits of jointly modeling spatial and frequency representations. Future work will evaluate CAF-Net under naturally occurring registration errors, sensor artifacts, seasonal changes, and cross-domain scenarios and extend the framework to more heterogeneous multimodal settings such as SAR and LiDAR data.