Article

From Depletion to Recovery: Tracking Water Storage Changes in the Semiarid Region of Inner Mongolia, China

1
School of Land Science and Technology, China University of Geosciences Beijing, Beijing 100080, China
2
College of Water Resources and Civil Engineering, Inner Mongolia Agricultural University, Hohhot 010018, China
3
College of Surveying and Geo-informatics, Tongji University, Shanghai 200092, China
4
School of Traffic and Transportation Engineering, Changsha University of Science and Technology, Changsha 400114, China
*
Author to whom correspondence should be addressed.
Remote Sens. 2025, 17(22), 3668; https://doi.org/10.3390/rs17223668
Submission received: 14 October 2025 / Revised: 3 November 2025 / Accepted: 5 November 2025 / Published: 7 November 2025
(This article belongs to the Special Issue Space-Geodetic Techniques (Third Edition))

Highlights

What are the main findings?
  • Inner Mongolia groundwater recovered after 2022, reversing a long-term depletion trend, highlighting the impact of policy interventions.
  • The groundwater loss was the major cause of overall water storage decline in the region, overwhelming a slight surface water increase.
  • There existed significant inter-regional differences, with water loss in the central/south driven by human activities and trends in the east/west dominated by climate.
What are the implications of the main findings?
  • Given proven groundwater recovery since 2022, expand current measures—promoting efficient irrigation, stricter extraction permits, and more ecological water transfers.
  • Tailor water policies by region: central/south must limit use and boost efficiency; northeast should prevent pollution and overuse; west needs climate adaptation.

Abstract

Inner Mongolia is an important energy producer and the sixth-largest grain-supplying region in China. To address crucial water security challenges, the spatiotemporal variations in terrestrial water storage (TWS) and groundwater storage (GWS) in semiarid Inner Mongolia from April 2002 to January 2025 were evaluated on the basis of the synergistic use of multisource data, including satellite gravimetry, hydrological models, and meteorological data. There was a loss of TWS in Inner Mongolia (−1.69 ± 0.17 mm/year), which was caused mainly by the depletion of groundwater (−4.90 ± 0.12 mm/year), and it offset a slight increase in surface water (+3.21 ± 0.19 mm/year). Marked declines were clustered mainly in the central/southern regions (e.g., Ordos: GWS of −10.20 ± 0.19 mm/year), whereas the northeastern region (e.g., Hulun Buir) experienced an increase (+5.09 mm/year), which was related to abundant rainfall. Notably, the declining trend of GWS across all of Inner Mongolia before 2022 (−5.49 ± 0.17 mm/year) achieved an unprecedented reversal after 2022 (+17.80 ± 0.21 mm/year), indicating the significant influence of policy interventions and precipitation changes. In the central/eastern agro-pastoral zones, water loss was driven mainly by human-related activities such as coal mining and farming; in contrast, aridity in the west was worsened by climate variability. Therefore, it is crucial to formulate urgent water redistribution strategies, promote efficient irrigation methods, and improve monitoring systems for the purpose of protecting energy and food security and strengthening ecological adaptability in the context of climate change.

1. Introduction

Inner Mongolia, being China’s leading energy producer and the sixth-largest grain supplier, has endured long-term water pressure, which is worsened by irregular rainfall (heavy rains in the east as opposed to continuous drought in the west) and excessive human-induced groundwater extraction. The intense production requirements and water scarcity are in crucial conflict, which is a basic obstacle to regional sustainability; thus, strict evaluations of water security and dynamic monitoring of water storage are needed.
Against this regional backdrop, it is crucial to recognize that local water security challenges are increasingly influenced by global climatic shifts. Global warming has led to an increase in extreme weather events, greatly transforming the global water cycle and regional hydrological conditions [1,2,3]. Changes in terrestrial water storage (TWS) are closely related to changes in important elements such as soil moisture storage (SMS), snow water storage (SNWS), surface water storage (SWS), canopy water storage (CWS), and groundwater storage (GWS) [4]. Many studies have investigated TWS and GWS changes in different time periods and geographical regions by using various data resources [4,5,6,7,8,9]. Before April 2002, the variation in TWS was usually inferred by computing the residual of the water budget equation, which was based on the principle of water balance. This process required high precision and was still a great challenge. To monitor changes in GWS, traditional methods such as piezometers, ground-based networks, and hydrological models have been widely used. Nonetheless, these approaches are often restricted in terms of spatial coverage, data accessibility, and model precision, which restricts their efficacy on larger scales [6,8,10,11,12,13].
The Gravity Recovery and Climate Experiment (GRACE) mission [14,15] and its successor, GRACE Follow-On (GRACE-FO) [16], were successfully launched. These missions provided the first direct means to estimate large-scale changes in Terrestrial Water Storage (TWS). The data collected since 2002 have profoundly enhanced knowledge of global and regional water storage variability. One prominent technique leverages this data by combining GRACE TWS with hydrological model outputs, such as those from GLDAS, which incorporate surface and near-surface water components (SMS, SNWS, CWS, and SWS). Through residual analysis, this synthesis allows scientists to isolate and estimate regional groundwater storage variations, as showcased in the research of Feng et al. [6] and Wang et al. [16]. This approach has been successfully applied to monitor large-scale groundwater changes in several regions, including Ethiopia [17], arid zones [18], South Korea [19], Southern Poland and Arctic Sweden [20], as well as North India [21]. Furthermore, some studies have incorporated GNSS data to improve algorithms for inverting groundwater anomalies [22].
In Inner Mongolia, water storage changes have been monitored in most recent studies by using GRACE data. As an illustration, Guo et al. [23] combined GRACE and land surface model data to evaluate the TWS and GWS alterations from 2003 to 2021. The outcomes demonstrated a notable regional depletion in TWS at an average rate of −1.82 mm/year, accompanied by an even more drastic decline in GWS of −4.15 mm/year, which underlines a crucial groundwater crisis. In another study, through the use of multisource data, Guo et al. [24] not only reported large differences in TWS trends in the five major groundwater basins of Inner Mongolia but also investigated the factors causing these changes. The research revealed clear regional differences: in the northeast and west, meteorological elements were predominant, and sufficient precipitation could even increase the TWS in the northeast (+2.36 mm/year). However, in the central and eastern regions, especially in the agro-pastoral ecotone, human-related activities, mainly agricultural irrigation and coal mining, were the main reasons for groundwater depletion, with rates reaching −4.09 mm/year and −3.69 mm/year, respectively. Water resources in Inner Mongolia are significantly influenced by both natural elements and human-related factors, necessitating various management strategies. Wang et al. [25] investigated the decoupling procedure between water consumption and economic growth in Inner Mongolia to evaluate the efficiency of water management policies.
Therefore, exploring the situation of TWS and GWS changes in Inner Mongolia and interpreting the causes are important for sustainable water resource management and protection of the regional ecological environment. However, despite the proliferation of GRACE/GLDAS applications globally and regionally, few studies have investigated in depth the potential causes of TWS and GWS changes in Inner Mongolia because of insufficient long-term data, especially from a city-level perspective and with a focus on quantifying the impact of specific policy interventions. Consequently, various data sources, such as satellite gravimetry (GRACE/GRACE-FO), meteorological observations, and hydrological models, within the period from April 2002 to January 2025, have been utilized to calculate the changes in TWS and GWS at the city level. However, it is important to note that the spatial resolution of GRACE/GRACE-FO data (~300 km) poses limitations for fine-scale analysis; thus, city-level results should be interpreted as indicative trends within the GRACE footprint rather than precise local estimates. This is intended to offer a high-resolution understanding of groundwater trends, which in turn can aid in the formulation of targeted and sustainable water management strategies. The paper is organized as follows: Section 2 describes the study area and data sources. In Section 3, the outcomes are presented along with their corresponding analysis. Finally, policy-relevant discussions and conclusions are provided in Section 4 and Section 5.

2. Study Region, Adopted Datasets, and Processing Methods

2.1. Study Area

The Inner Mongolia Autonomous Region (encompassing twelve cities—Alxa League, Wuhai, Bayannur, Ordos, Baotou, Hohhot, Ulanqab, Xilin Gol, Chifeng, Tongliao, Hinggan, and Hulun Buir), which is in northern China, is a vast territory with ecological diversity, covering approximately 1.18 million km2. This region is the focus of the study (Figure 1). This region, which lies within the latitudes of 37°24′~53°23′N and longitudes of 97°12′~126°04′E, represents a crucial transition area between the humid eastern monsoon regions and the arid northwestern inland region. Its climate is characterized by pronounced spatiotemporal variability, with mean annual precipitation declining sharply from >400 mm in the northeast to <50 mm in the western deserts.
In terms of hydrology, the southern part of Inner Mongolia contains the headwaters of the Yellow River (Huang He). There are also internally drained endorheic basins, such as the Hulun Lake Basin, and widespread groundwater systems, which are mostly recharged in mountainous areas. In the northern parts lies permafrost, and semiarid steppes and the Gobi Desert are present in the central and western regions. In this region, water stress is intensified by human-related factors such as large-scale farming, coal extraction, and livestock grazing in this fragile environment. From 1961 to 2023, the annual average surface temperature in China showed a significant upward trend, with an average increase of 0.3 °C/decade [26]. In this context, investigating the water storage changes in Inner Mongolia, as a climate-sensitive ecotone, can provide critical insights into coupled natural–human system responses under climate change and resource exploitation.

2.2. Adopted Datasets

2.2.1. GRACE and GRACE-FO Data

The GRACE (April 2002–June 2017) and GRACE-FO (June 2018–January 2025) RL06 mascon solutions from three institutions, namely, the Center for Space Research (CSR) [27,28], the Jet Propulsion Laboratory (JPL) [29,30], and the Goddard Space Flight Center (GSFC) [31], are adopted to directly estimate the TWS changes in Inner Mongolia from April 2002 to January 2025. Note that for the three mascon products, the glacial isostatic adjustment (GIA) effect has been corrected using the ICE6G-D model [32], the C20 (degree-2, order-0) spherical harmonic coefficients have been replaced by GRACE/GRACE-FO Technical Note 14 [31], the degree-1 (geocenter) corrections have been added by GRACE/GRACE-FO Technical Note 13 [33,34], and the land–ocean signal leakage has been minimized; therefore, no further postprocessing strategies are needed. However, some residual leakage errors may still persist, particularly at finer spatial scales, and this limitation will be further discussed in Section 4.2.

2.2.2. GLDAS Hydrological Models

The SMS, SNWS, and CWS components of TWS changes can be estimated using GLDAS hydrological models. In this study, three GLDAS products are adopted: the Noah model (GLDAS_NOAH10_M 2.1) [35], the catchment land surface model (CLSM) (GLDAS_CLSM10_M V2.1) [36], and the variable infiltration capacity (VIC) model (GLDAS_VIC10_M V2.1) [37]. NOAH and VIC do not contain GWS; however, the CLSM product provides it. To maintain consistency, the GWS element of the CLSM product is removed.

2.2.3. Precipitation, Evaporation, Runoff, and Water Resource Datasets

The monthly mean precipitation, evaporation, and runoff data from the GLDAS CLSM products [36,38] are used and resampled to a spatial resolution of 0.25° × 0.25°. In addition, the yearly water resources of precipitation, surface water, and groundwater are obtained from the Water Resources Bulletin of the Inner Mongolia Autonomous Region (2002–2024).

2.3. Methodology for Estimating TWS and GWS Changes

The TWS changes (Equation (1)) can be directly derived from the monthly GRACE/GRACE-FO Level-3 mascon solutions, mainly including the groundwater storage (GWS), soil moisture storage (SMS), snow water storage (SNWS), canopy water storage (CWS) change, and surface water storage (SWS).
TWS = GWS + SMS + SNWS + CWS + SWS
The SMS, SNWS, and CWS components can be estimated by GLDAS models; however, the SWS component is not included. Considering that the SWS component is relatively small in Inner Mongolia, we will neglect it in this study. Therefore, the GWS changes can be derived by deducting the SMS, SNWS, and CWS components of GLDAS from the TWS change observed by GRACE/GRACE-FO, which is presented as
GWS = TWS − SMS − SNWS − CWS
To enhance the reliability, three GLDAS models (i.e., CLSM, NOAH, and VIC) and three mascon solutions from three processing centers (i.e., CSR, JPL, and GSFC) are used to estimate the ΔSMS, ΔSNWS, and ΔCWS components and the TWS change, respectively, taking their ensemble average as the final estimated (ΔSMS + ΔSNWS + ΔCWS) and TWS change series, and then compute the GWS change estimations (recorded as GRACE-GLDAS) of Inner Mongolia.

3. Results and Analysis

3.1. Spatiotemporal Analysis of Water Storage Changes in Inner Mongolia

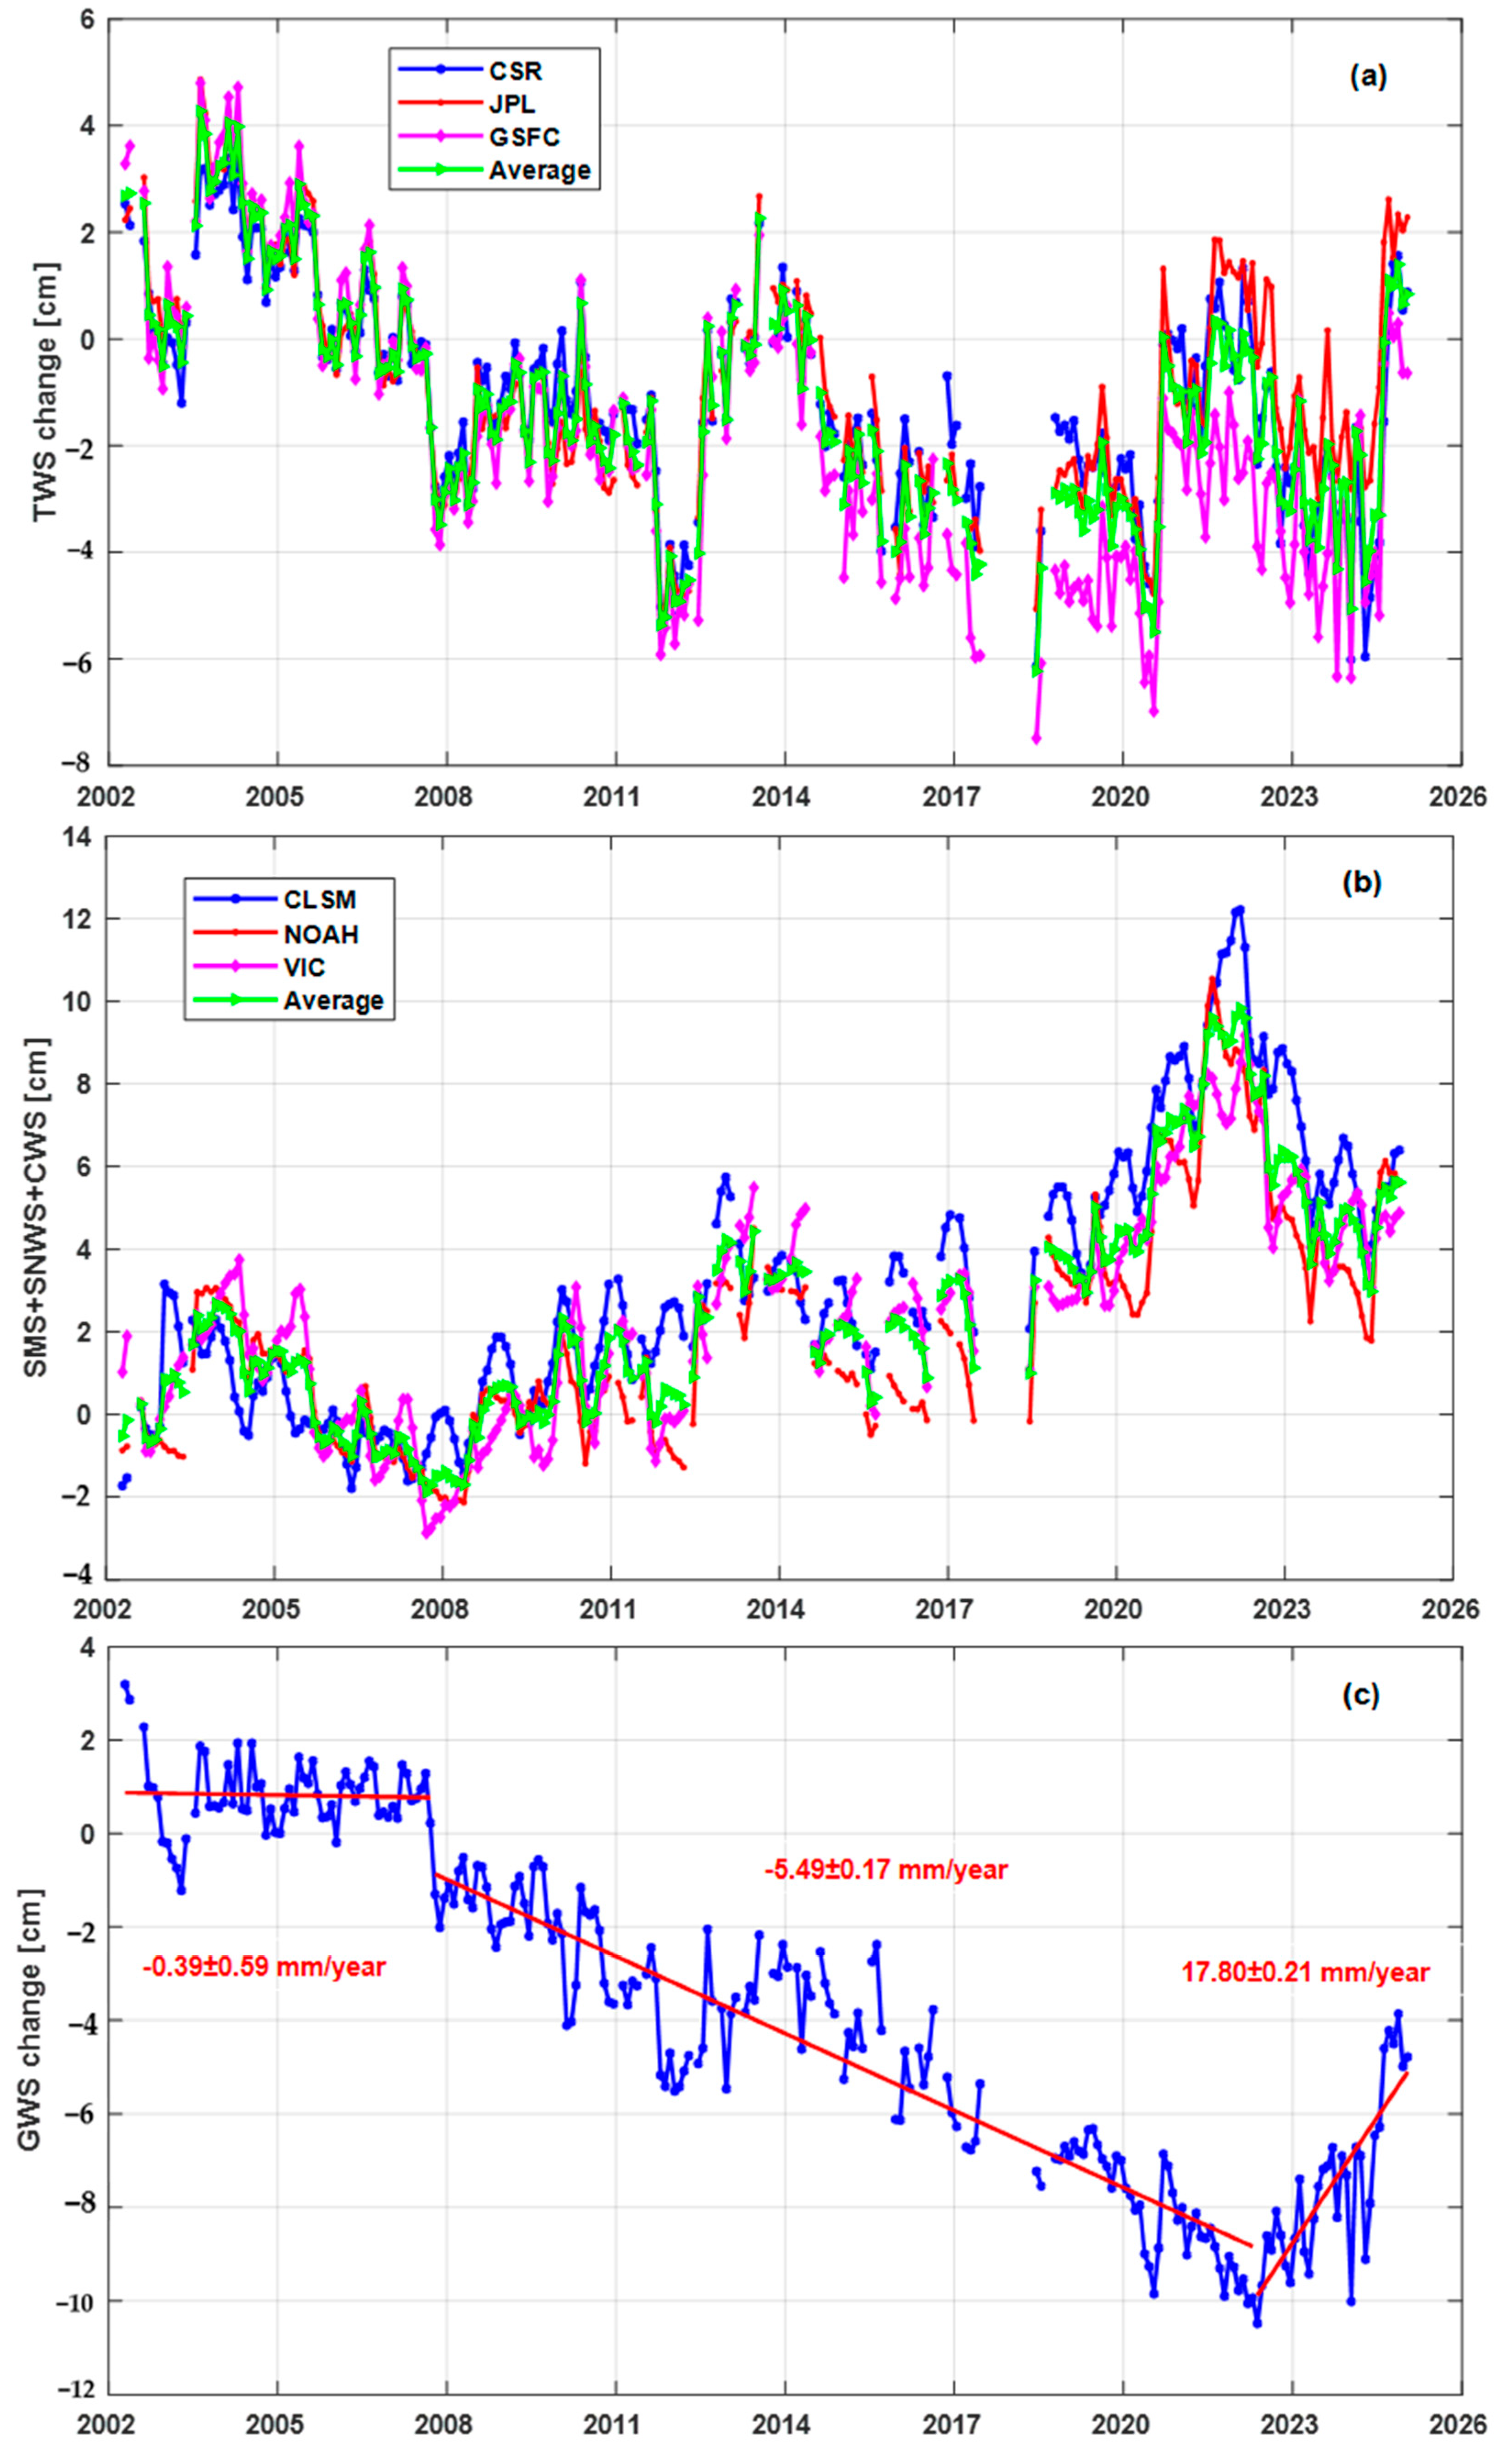
Using three GRACE and GRACE-FO mascon solutions (i.e., CSR, JPL, and GSFC), we first estimate the regional mean TWS changes in Inner Mongolia over the period from April 2002 to January 2025, which are presented in Figure 2a. The estimates obtained by the three mascon solutions are clearly consistent with each other, with high correlation coefficients of 0.90 (CSR vs. JPL), 0.91 (CSR vs. GSFC), and 0.88 (JPL vs. GSFC). However, some differences still exist among the estimated TWS changes, mainly because of the different inversion strategies adopted for the three mascon products. The annual and semiannual amplitude, phase, and linear trend are coestimated together using the least-squares fitting method. The statistical results are presented in Table 1, which reveals that the estimated annual amplitudes and linear trends (2002.04~2025.01) are 2.03 ± 1.52 mm and −1.49 ± 0.16 mm/year for the CSR solutions, 4.18 ± 1.76 mm and −1.09 ± 0.18 mm/year for the JPL solutions, and 0.93 ± 1.78 mm and −2.49 ± 0.18 mm/year for the GSFC solutions, respectively, confirming the greater difference, especially for the linear trend term. To obtain a relatively reliable TWS change estimation, we take the average estimates of three mascon solutions as the final results. To obtain a more robust and reliable TWS change estimation and to mitigate the uncertainties inherent in any single product, we take the average of the three mascon solutions as the final result. This approach of using a multi-product ensemble mean is widely adopted in GRACE/GRACE-FO studies to enhance the reliability of the findings [13,27]. The regional mean TWS change rate in Inner Mongolia is −1.69 ± 0.17 mm/year from April 2002 to January 2025.
To estimate the GWS changes in Inner Mongolia, the water storage changes in the SMS, SNWS, and CWS terms should be deducted from the TWS change estimations derived from the GRACE/GRACE-FO mascon solutions. The TWS components of SMS, SNWS, and CWS can be estimated using the GLDAS models. Note that the GRACE/GRACE-FO mascon solutions have a total of 33 months of missing data; notably, there is an 11-month data gap between the GRACE and GRACE-FO missions. To maintain temporal coherence and allow direct comparisons with different monitoring techniques, the months missing from the Mascon solutions are eliminated from the GLDAS models. The estimated changes in water storage, including the SMS, SNWS, and CWS elements, for the entire study period are shown in Figure 2b. Similar to the mascon solutions, the water storage changes derived from the three GLDAS models are essentially consistent, with high correlation coefficients of 0.90 (CLSM vs. NOAH), 0.88 (CLSM vs. VIC), and 0.91 (NOAH vs. VIC). The estimated linear trends are 3.86 ± 0.15 mm/year, 2.79 ± 0.18 mm/year, and 2.80 ± 0.16 mm/year for the CLSM, NOAH, and VIC, respectively, with an average of 3.15 ± 0.16 mm/year for the entire study period. Similarly, the ensemble mean of the three GLDAS models is used to represent the SMS + SNWS + CWS changes, aiming to reduce the bias associated with any single land surface model [6,39]. The water storage changes in SMS + SNWS + CWS elements show a fluctuating upward trend for the subperiod from April 2002 to April 2022 and a downward trend from May 2022 to January 2025.
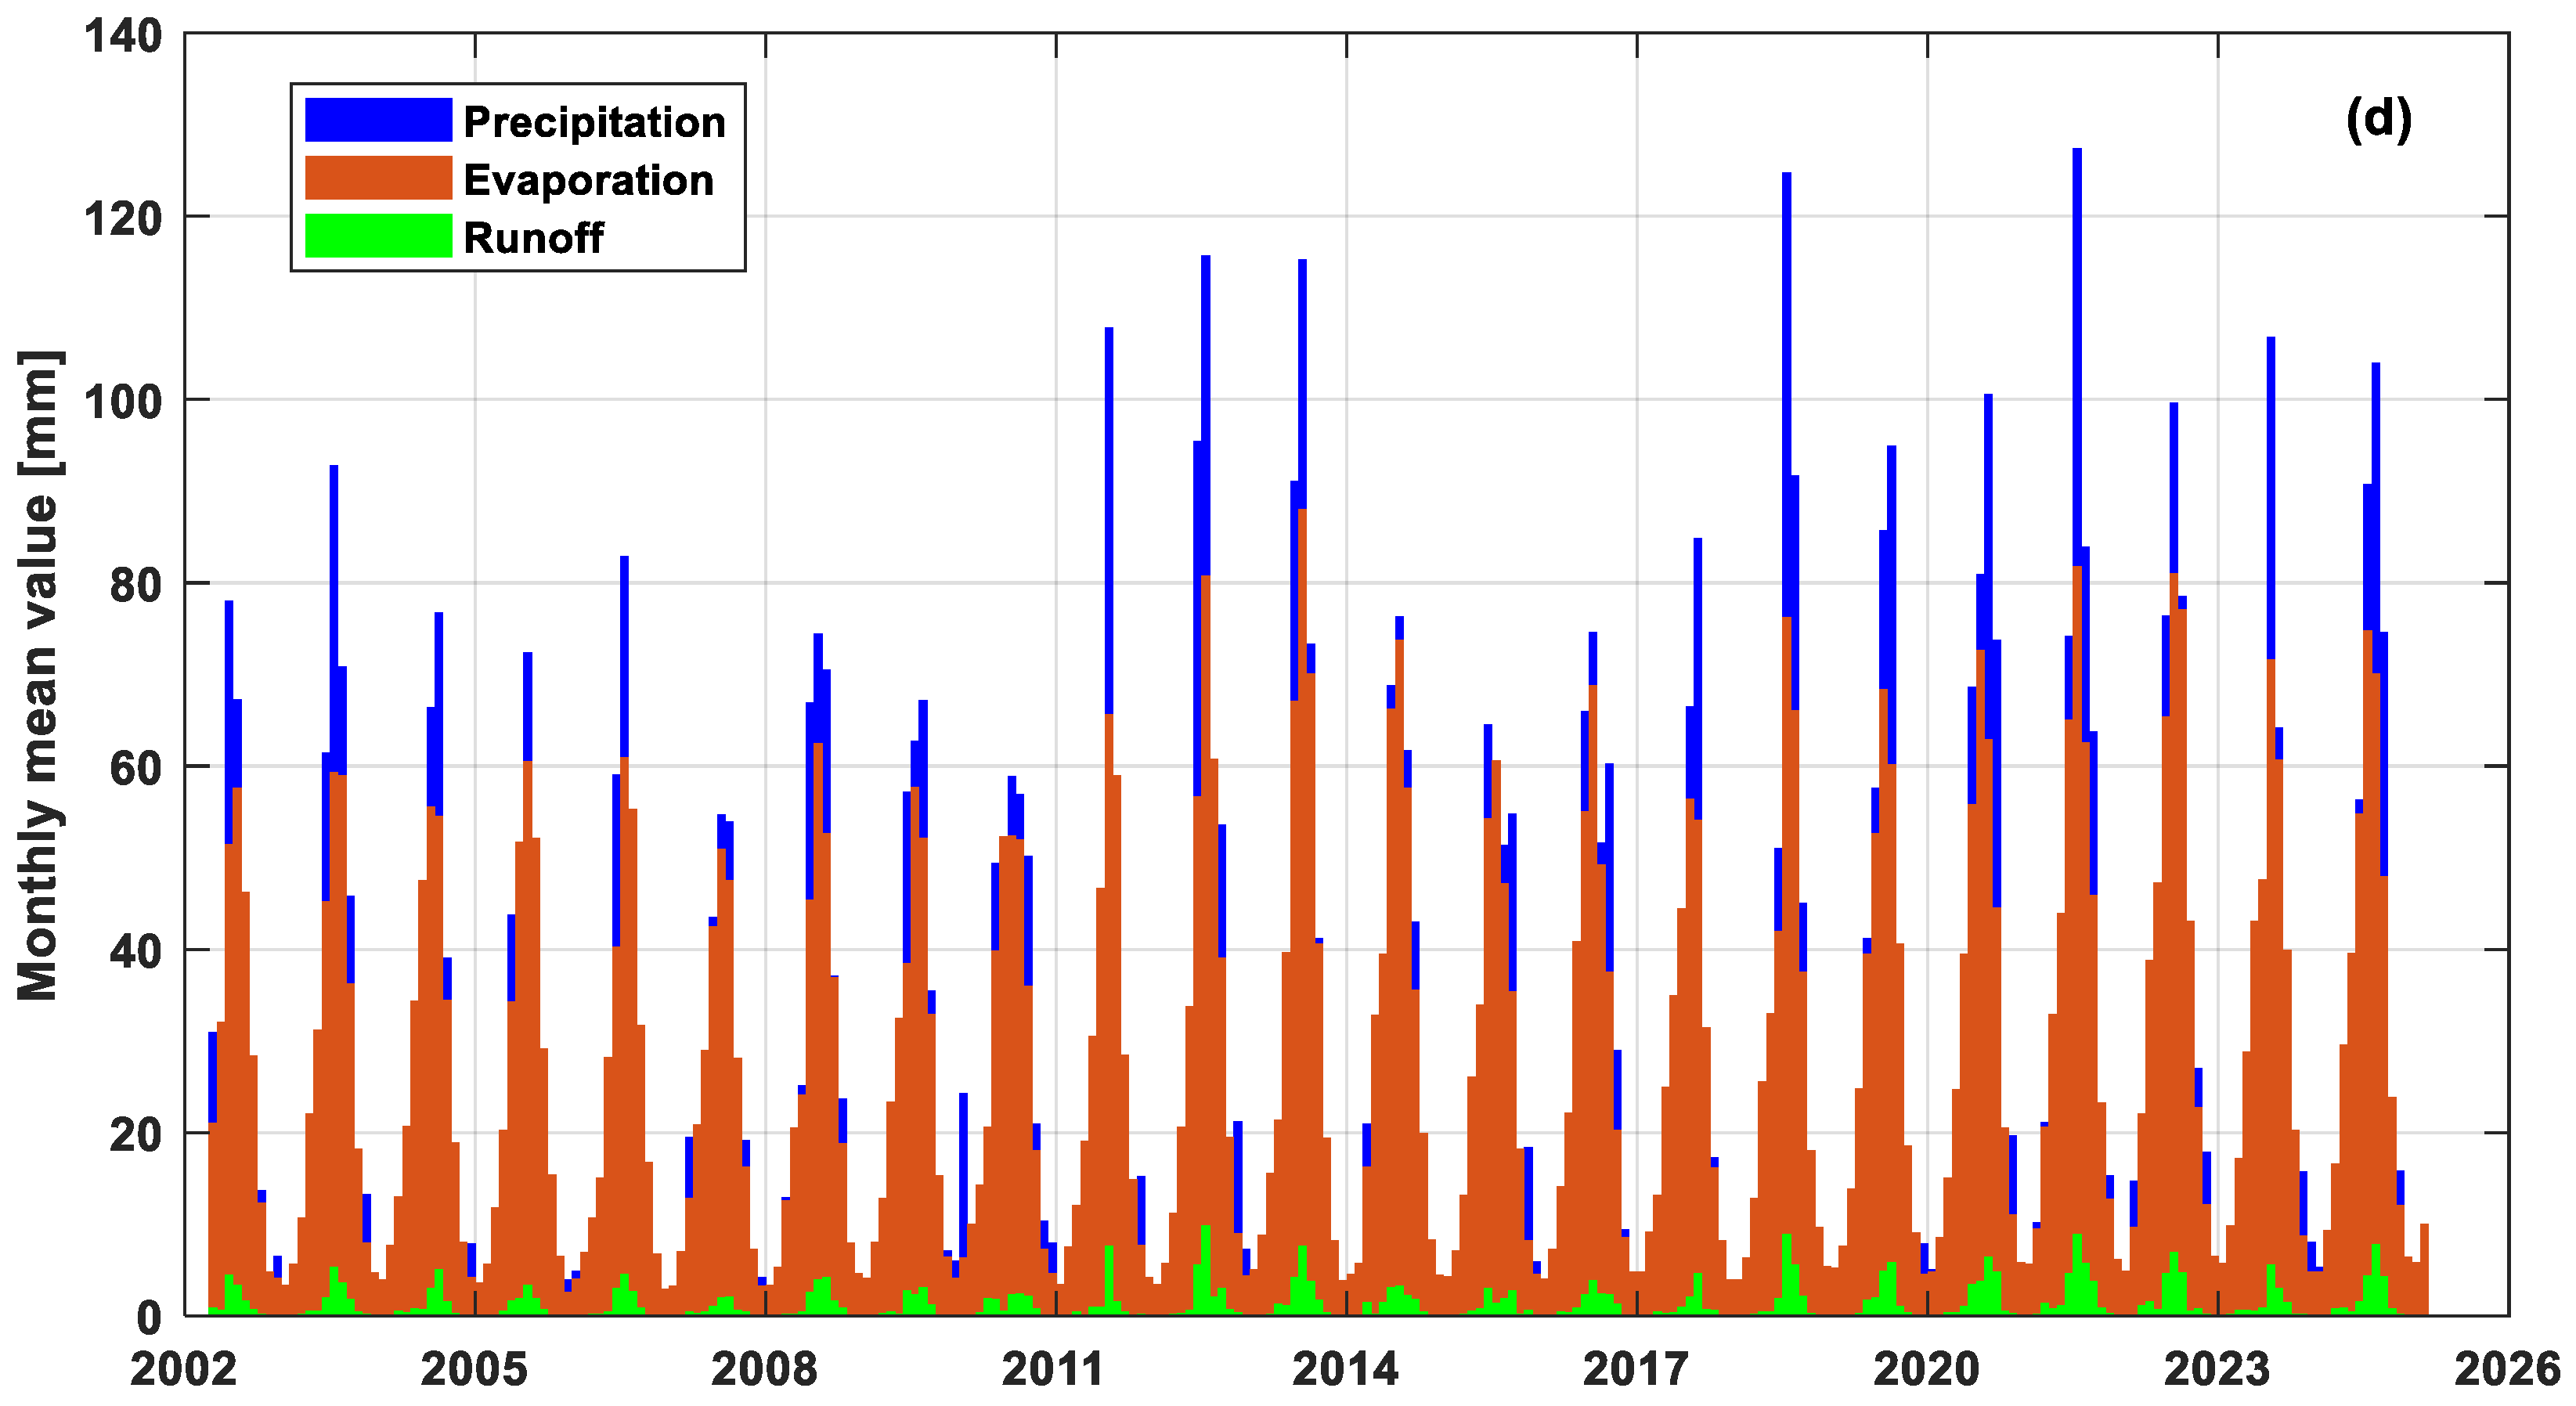
After the TWS and SMS + SNWS + CWS water storage changes are estimated from the GRACE/GRACE-FO and GLDAS models, respectively, one can derive the GWS changes in Inner Mongolia by removing the SMS + SNWS + CWS components from the TWS change estimations, as shown in Figure 2c. The regional mean GWS changes in Inner Mongolia can clearly be divided into three subperiods. For the period from April 2002 to September 2007, the linear trend of the GWS change series is only −0.39 ± 0.59 mm/year, with a nearly insignificant decreasing trend. For the period from October 2007 to April 2022, the GWS changes significantly decreased by −5.49 ± 0.17 mm/year. However, since May 2022, the GWS changes have turned around and started to increase at a rate of 17.80 ± 0.21 mm/year. For the entire study period, the estimated GWS change rate is −4.84 ± 0.12 mm/year. To investigate the potential causes of the TWS and GWS changes, Figure 2d presents the regional mean precipitation, evaporation, and runoff in Inner Mongolia for the entire study period. As shown in the subfigure, the precipitation actually increases during three subperiods (2002.4~2007.9, 2007.10~2022.4, and 2022.5~2025.1), with average precipitation values of 26.5191 mm, 29.4641 mm, and 33.2309 mm, respectively, for the corresponding subperiods. Moreover, evaporation and runoff also increase; therefore, it is difficult to conclude that increasing precipitation dominated the changes in GWS. The initial decrease in GWS, particularly during the period of significant decline (2007–2022), is consistent with findings from previous studies attributing groundwater depletion in the region to intensive human activities such as coal mining [7,11] and agricultural irrigation [23,24], compounded by the impacts of climate change, which can increase evaporative demand [9,40,41]. The notable reversal of the trend after 2022, despite a concurrent increase in evapotranspiration and runoff, strongly suggests that factors beyond natural climate variability are at play. This recovery is likely influenced by a combination of policy interventions and environmental conservation measures, which are comprehensively analyzed in the Discussions Section.
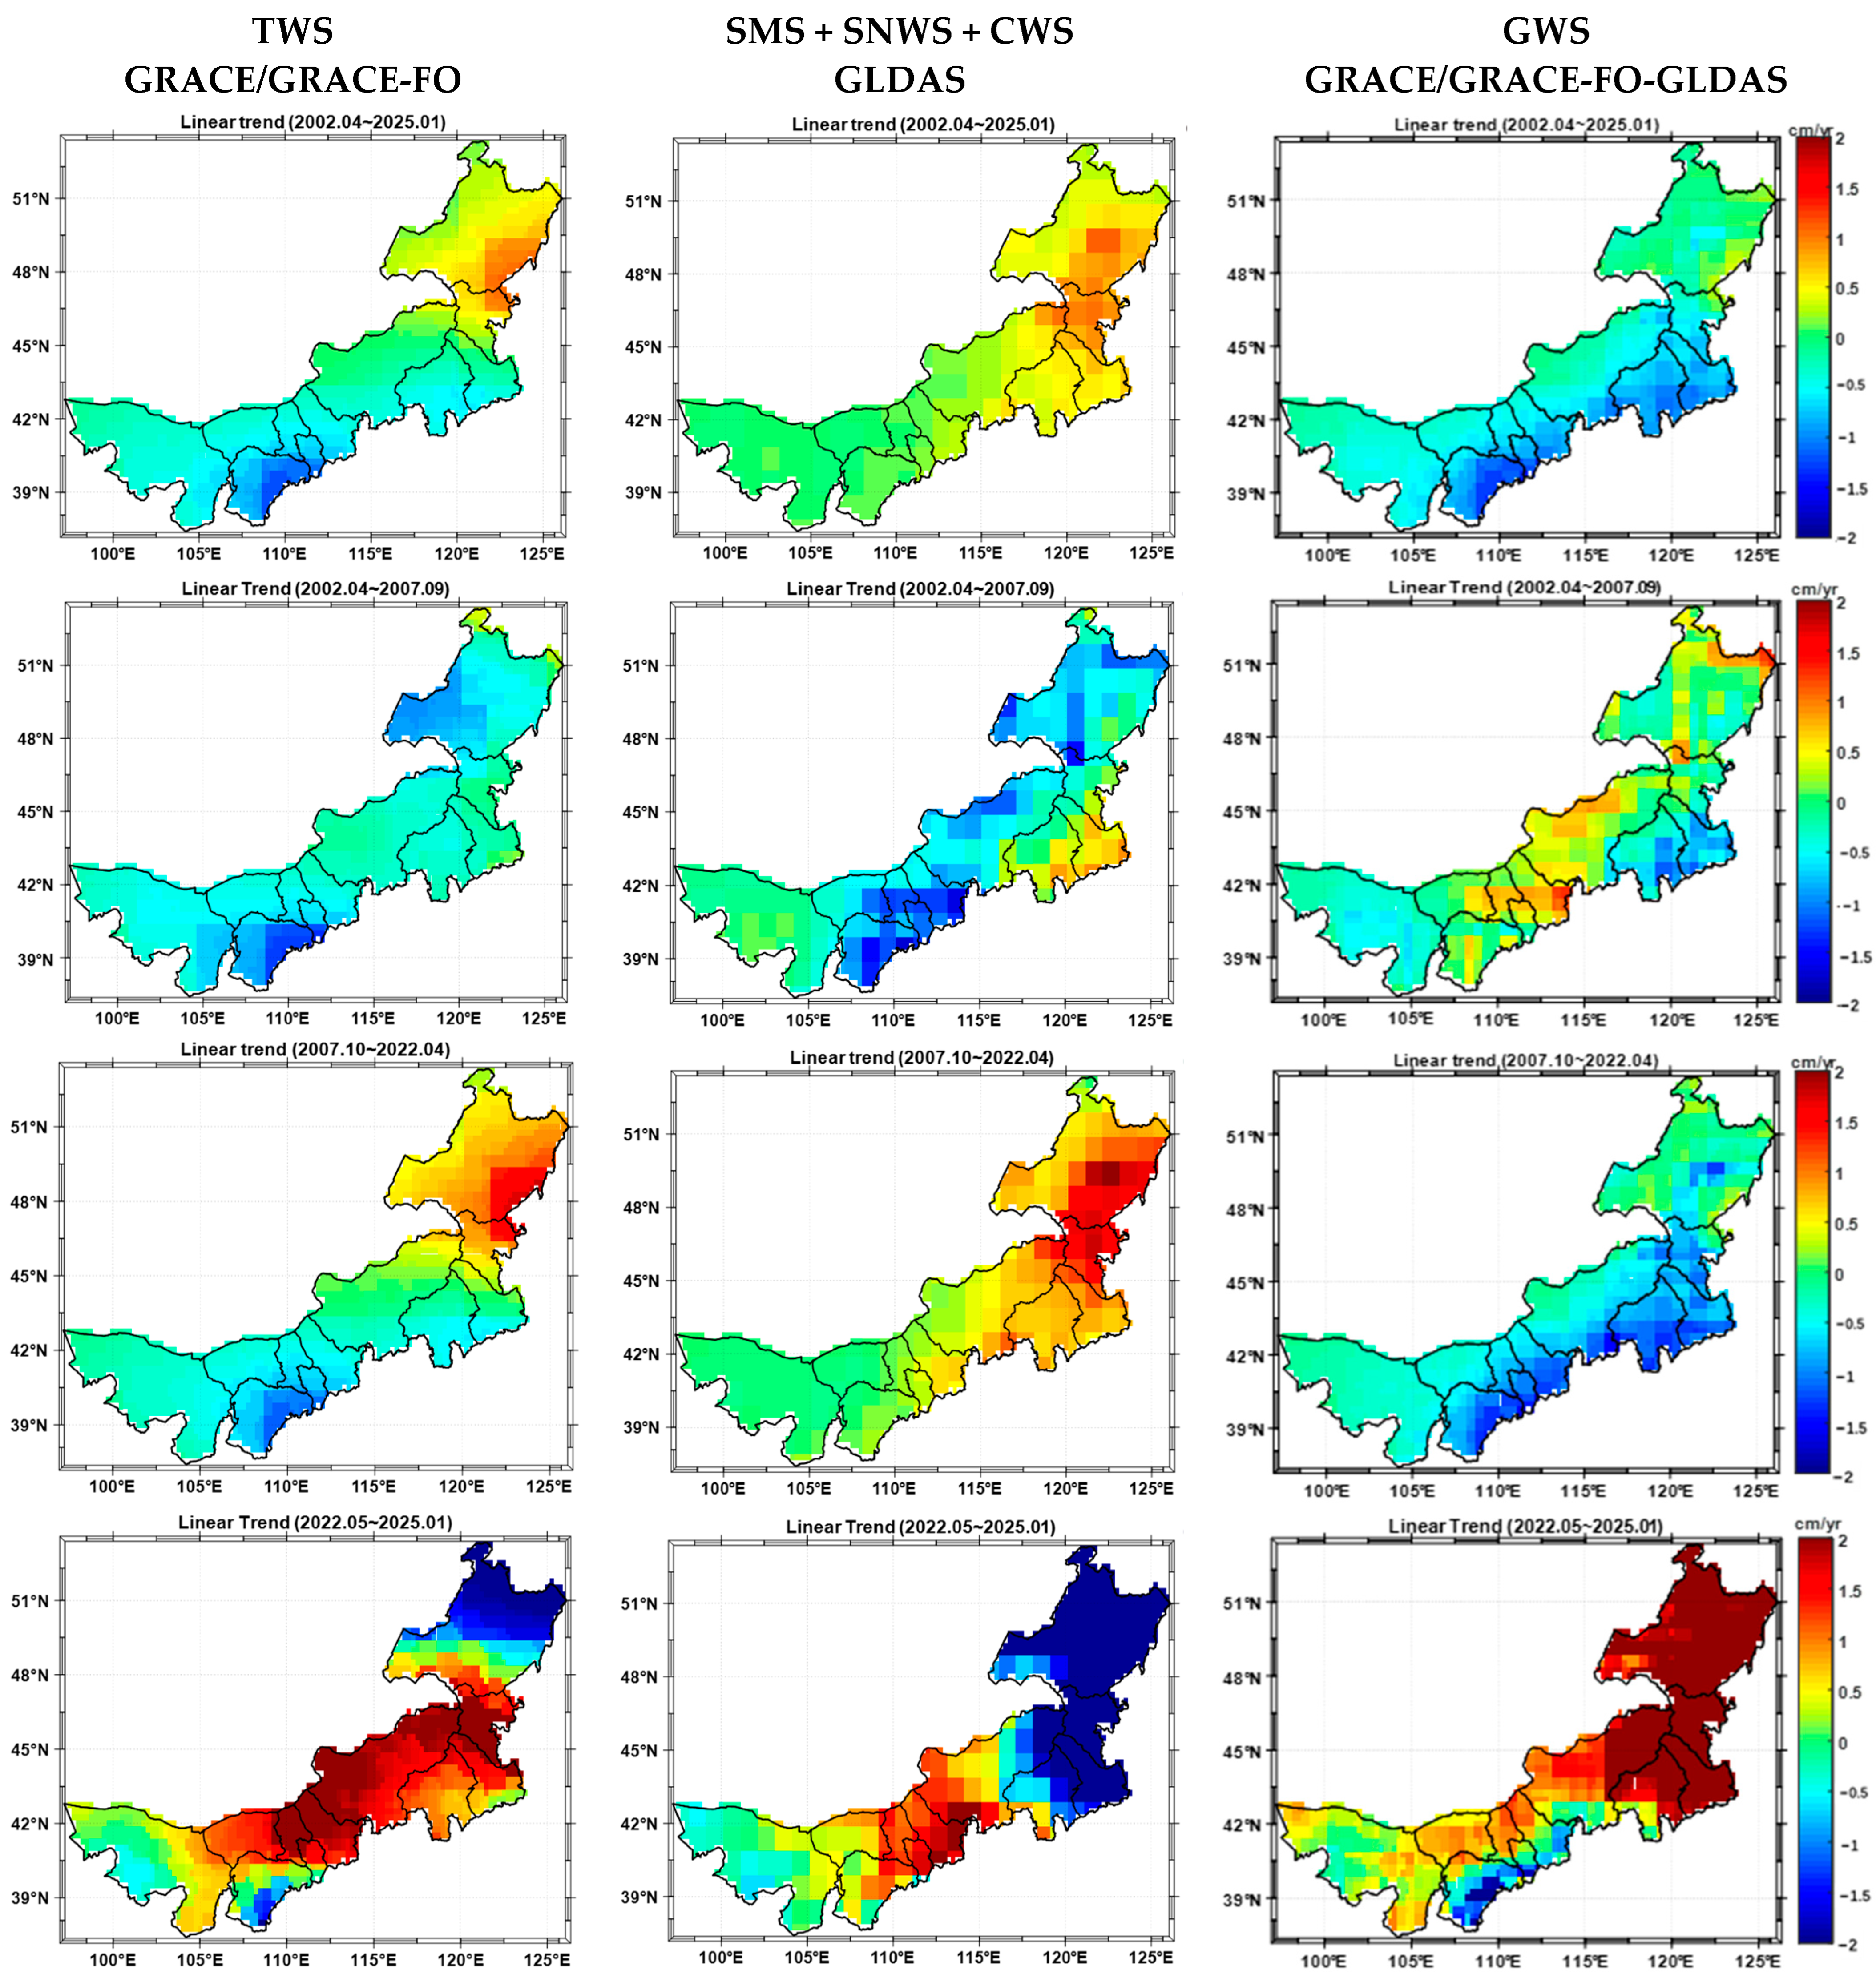
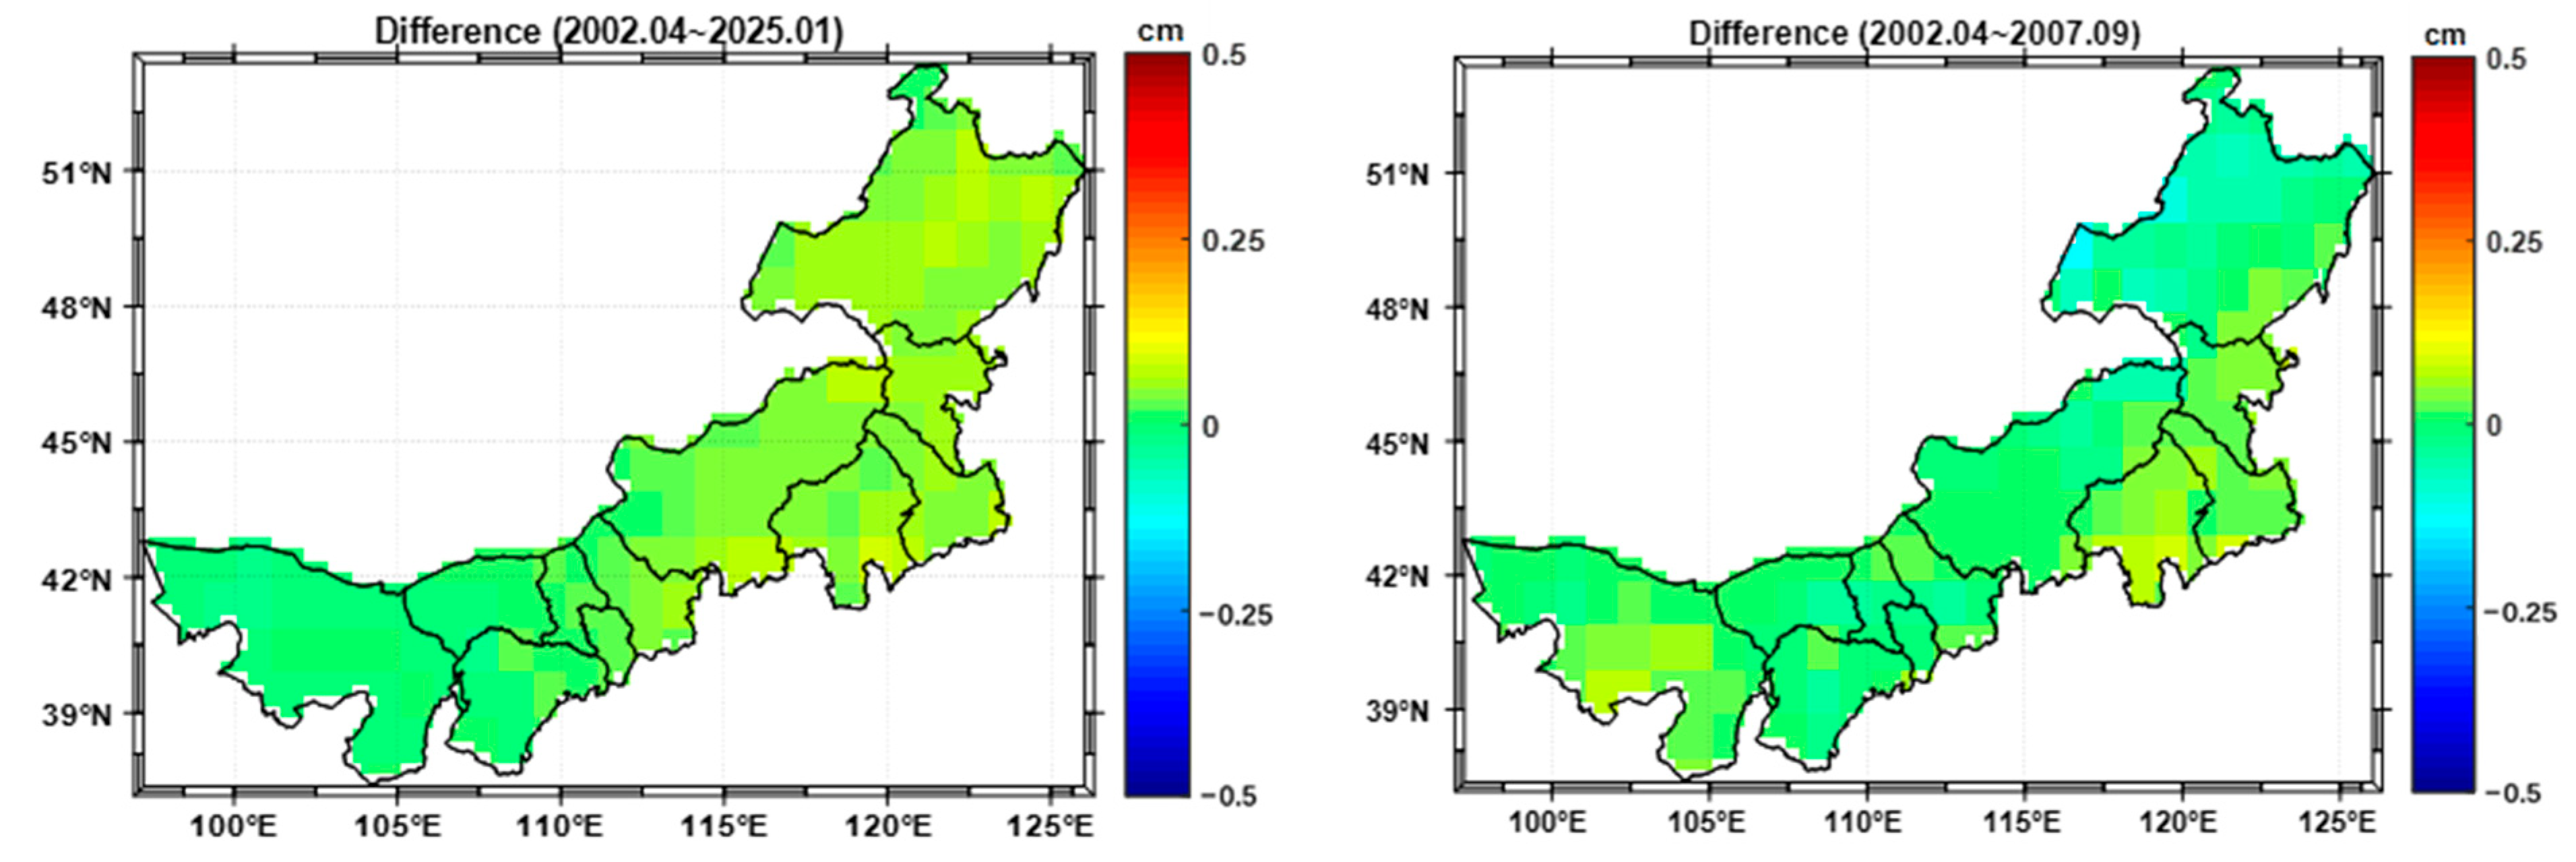
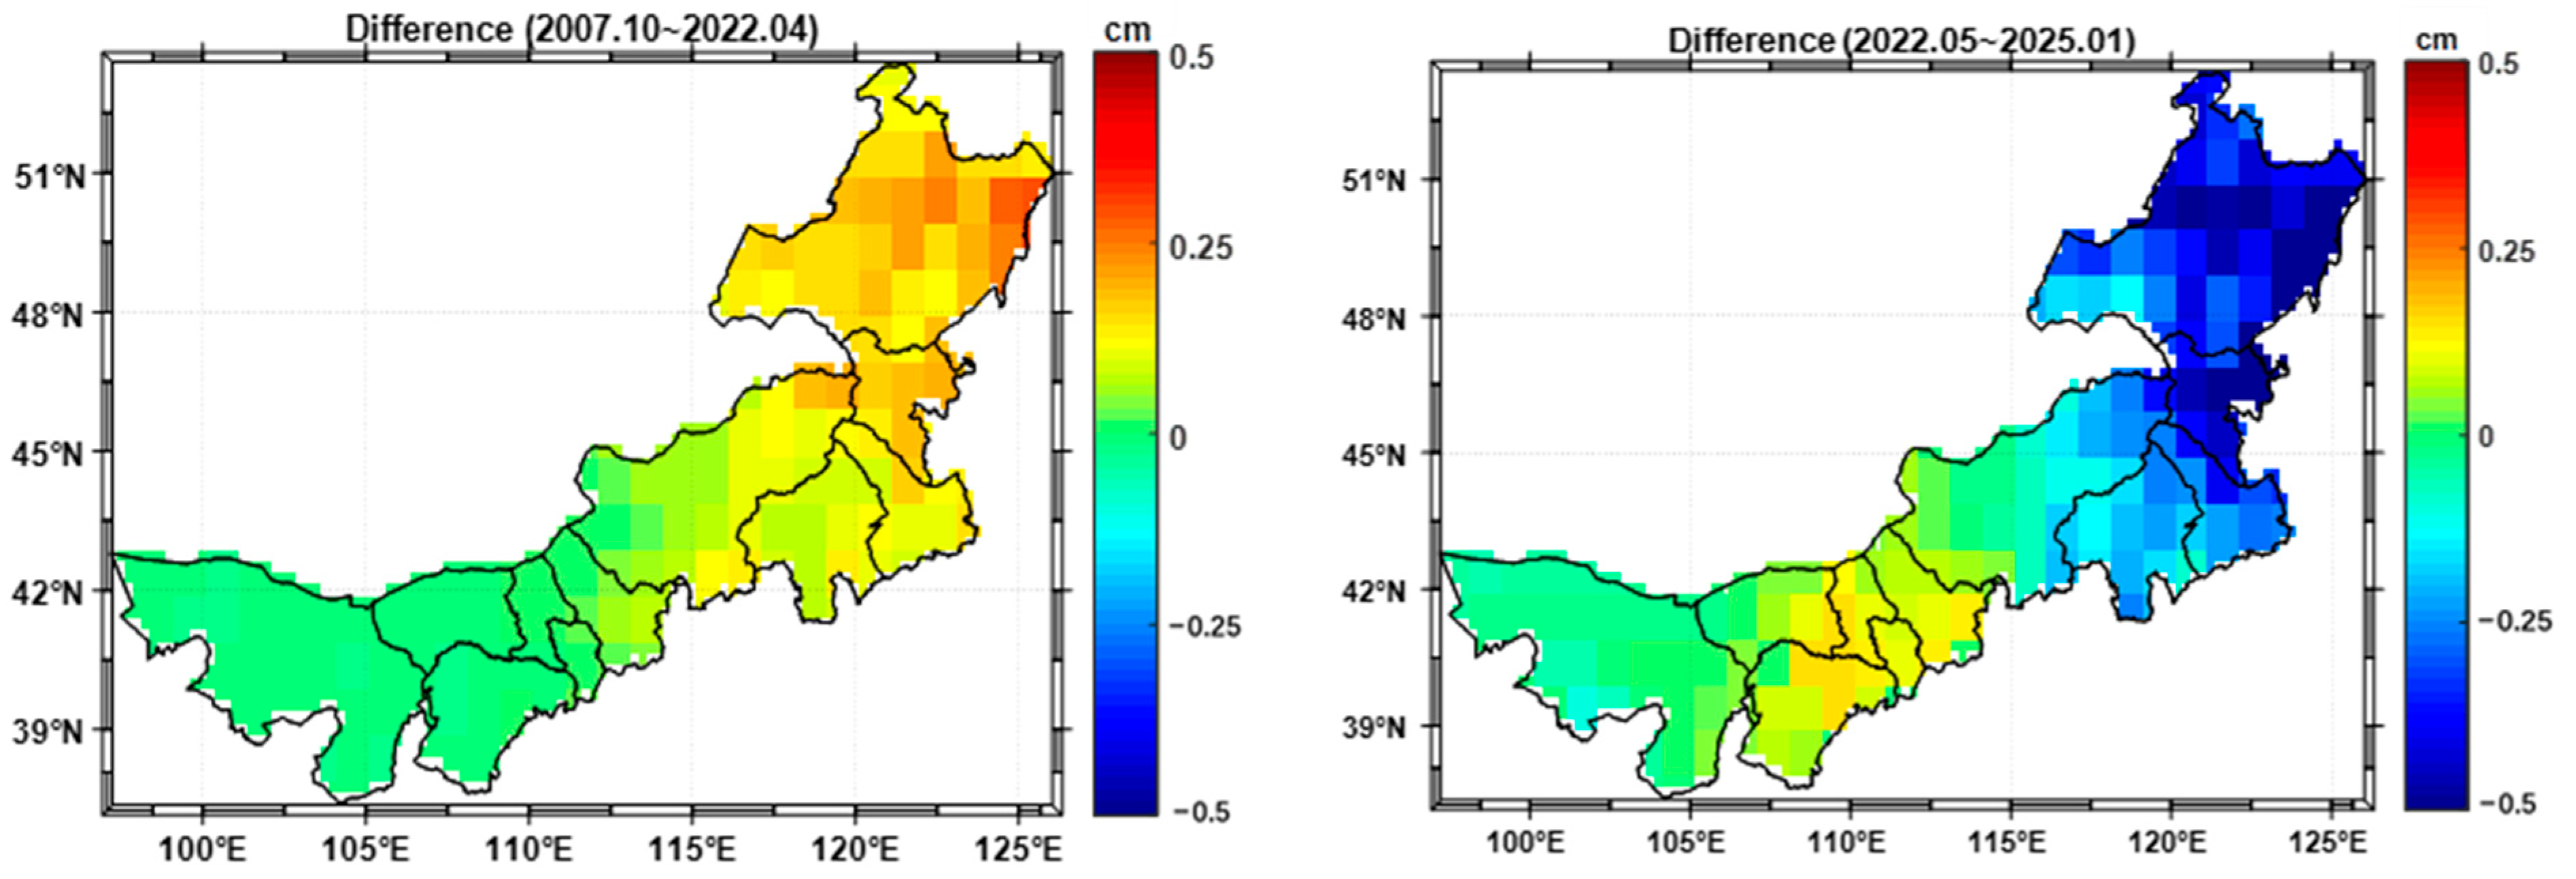
The regional TWS and GWS changes in Inner Mongolia are analyzed. The spatial distributions of TWS, SMS + SNWS + CWS, and GWS changes in Inner Mongolia from April 2002 to January 2025, as well as during three subperiods (2002.04–2007.09, 2007.10–2022.04, and 2022.05–2025.01), are shown in Figure 3. With respect to the TWS changes, the results reveal that most areas tend to decrease, indicating that the TWS reserves are widely reduced during the study period, especially in the middle and southern regions, such as Ordos city. On the other hand, in some parts of the northeast and certain western regions, such as Tongliao, Hinggan, and Hulun Buir, positive trends exist in TWS changes. For different time spans, significant discrepancies exist. The TWS change rate of the subperiod from April 2002 to September 2007 is relatively small, except for that of Ordos and Hulun Buir, which have obvious negative trends, as confirmed by Figure 2 and Table 1. Hulun Buir has a significant positive trend for the period from October 2007 to April 2022, which is opposite to that for the third subperiod (2022.05~2025.01). This spatial pattern of “descending in the south and rising in the north” indicates significant regional differences in the changes in water resources in Inner Mongolia.
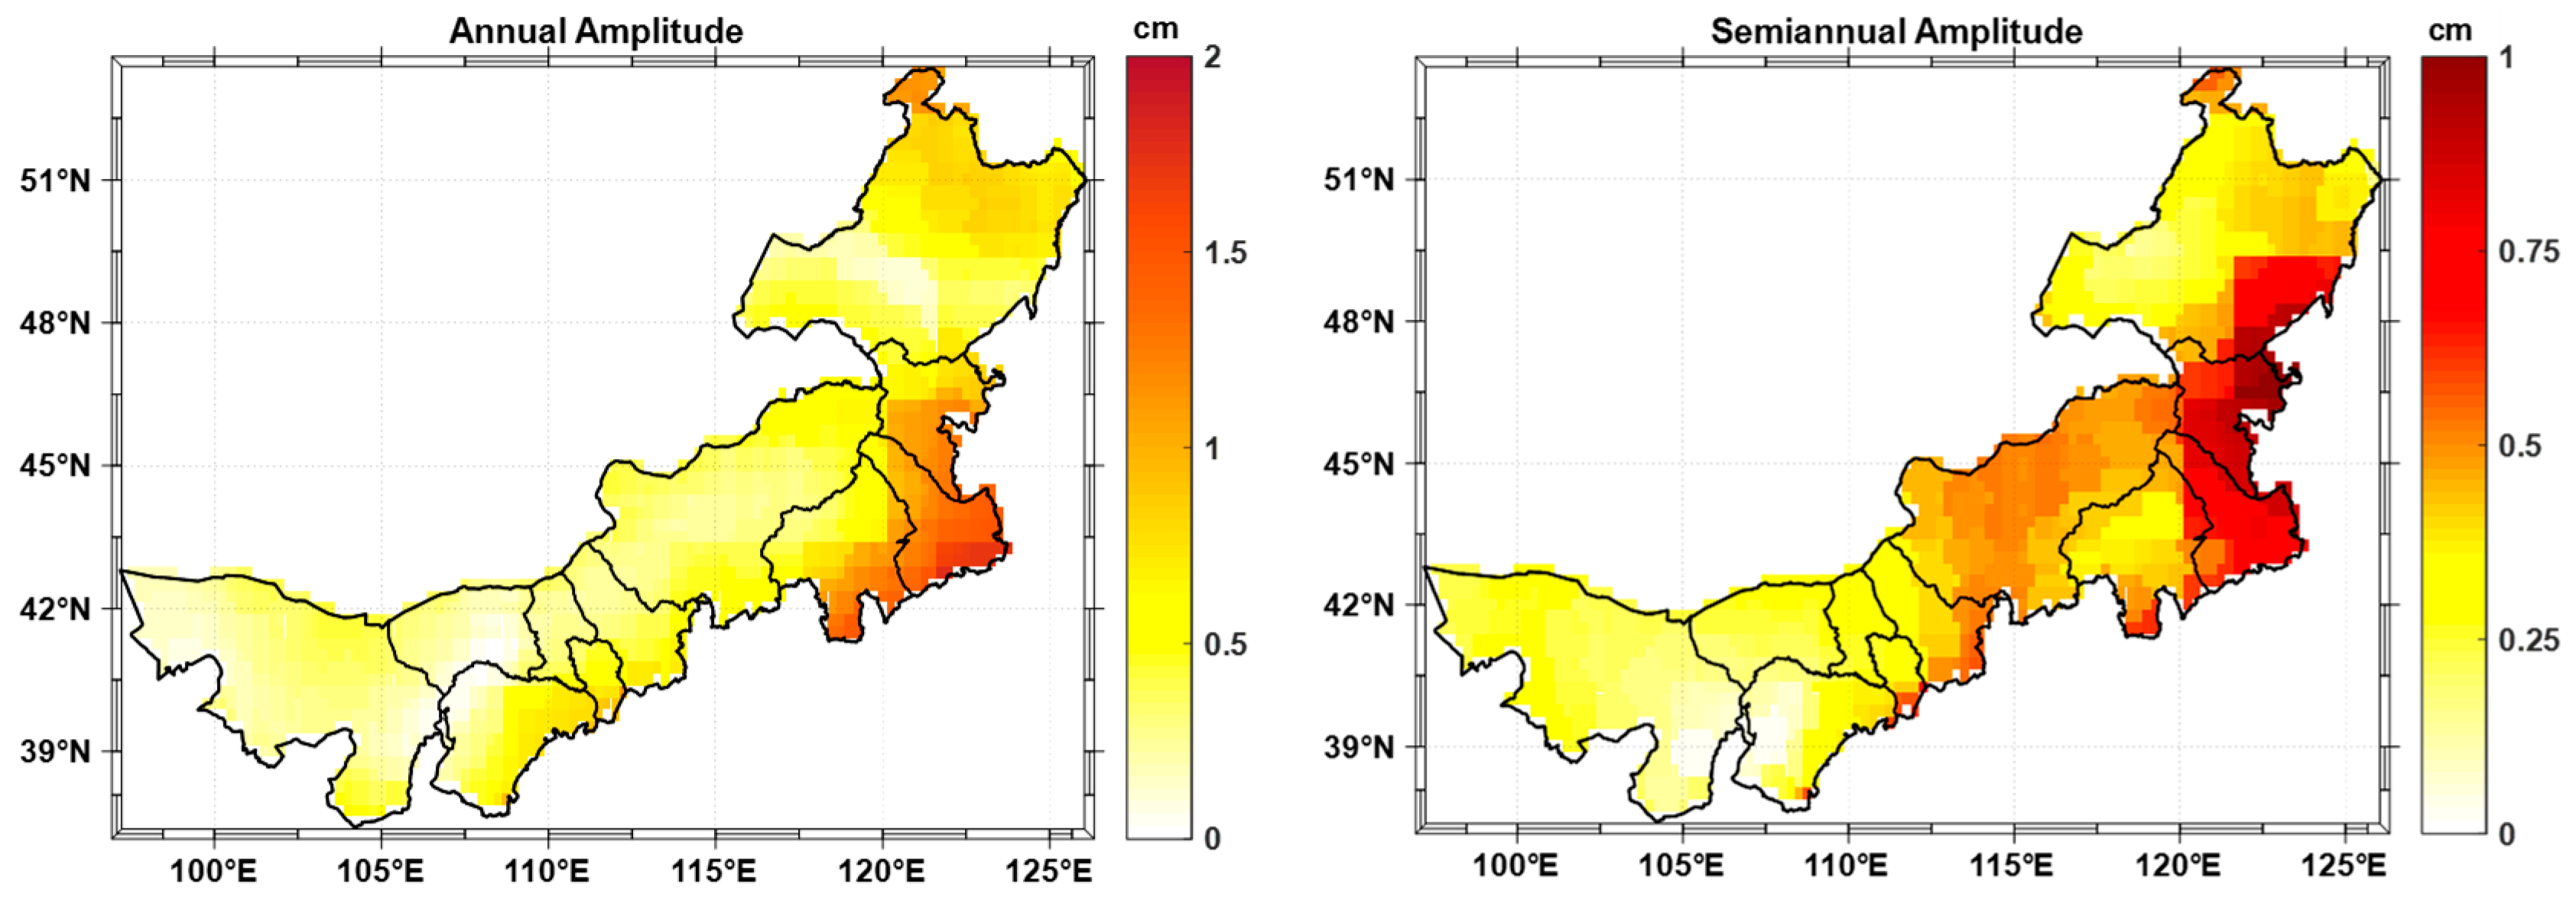
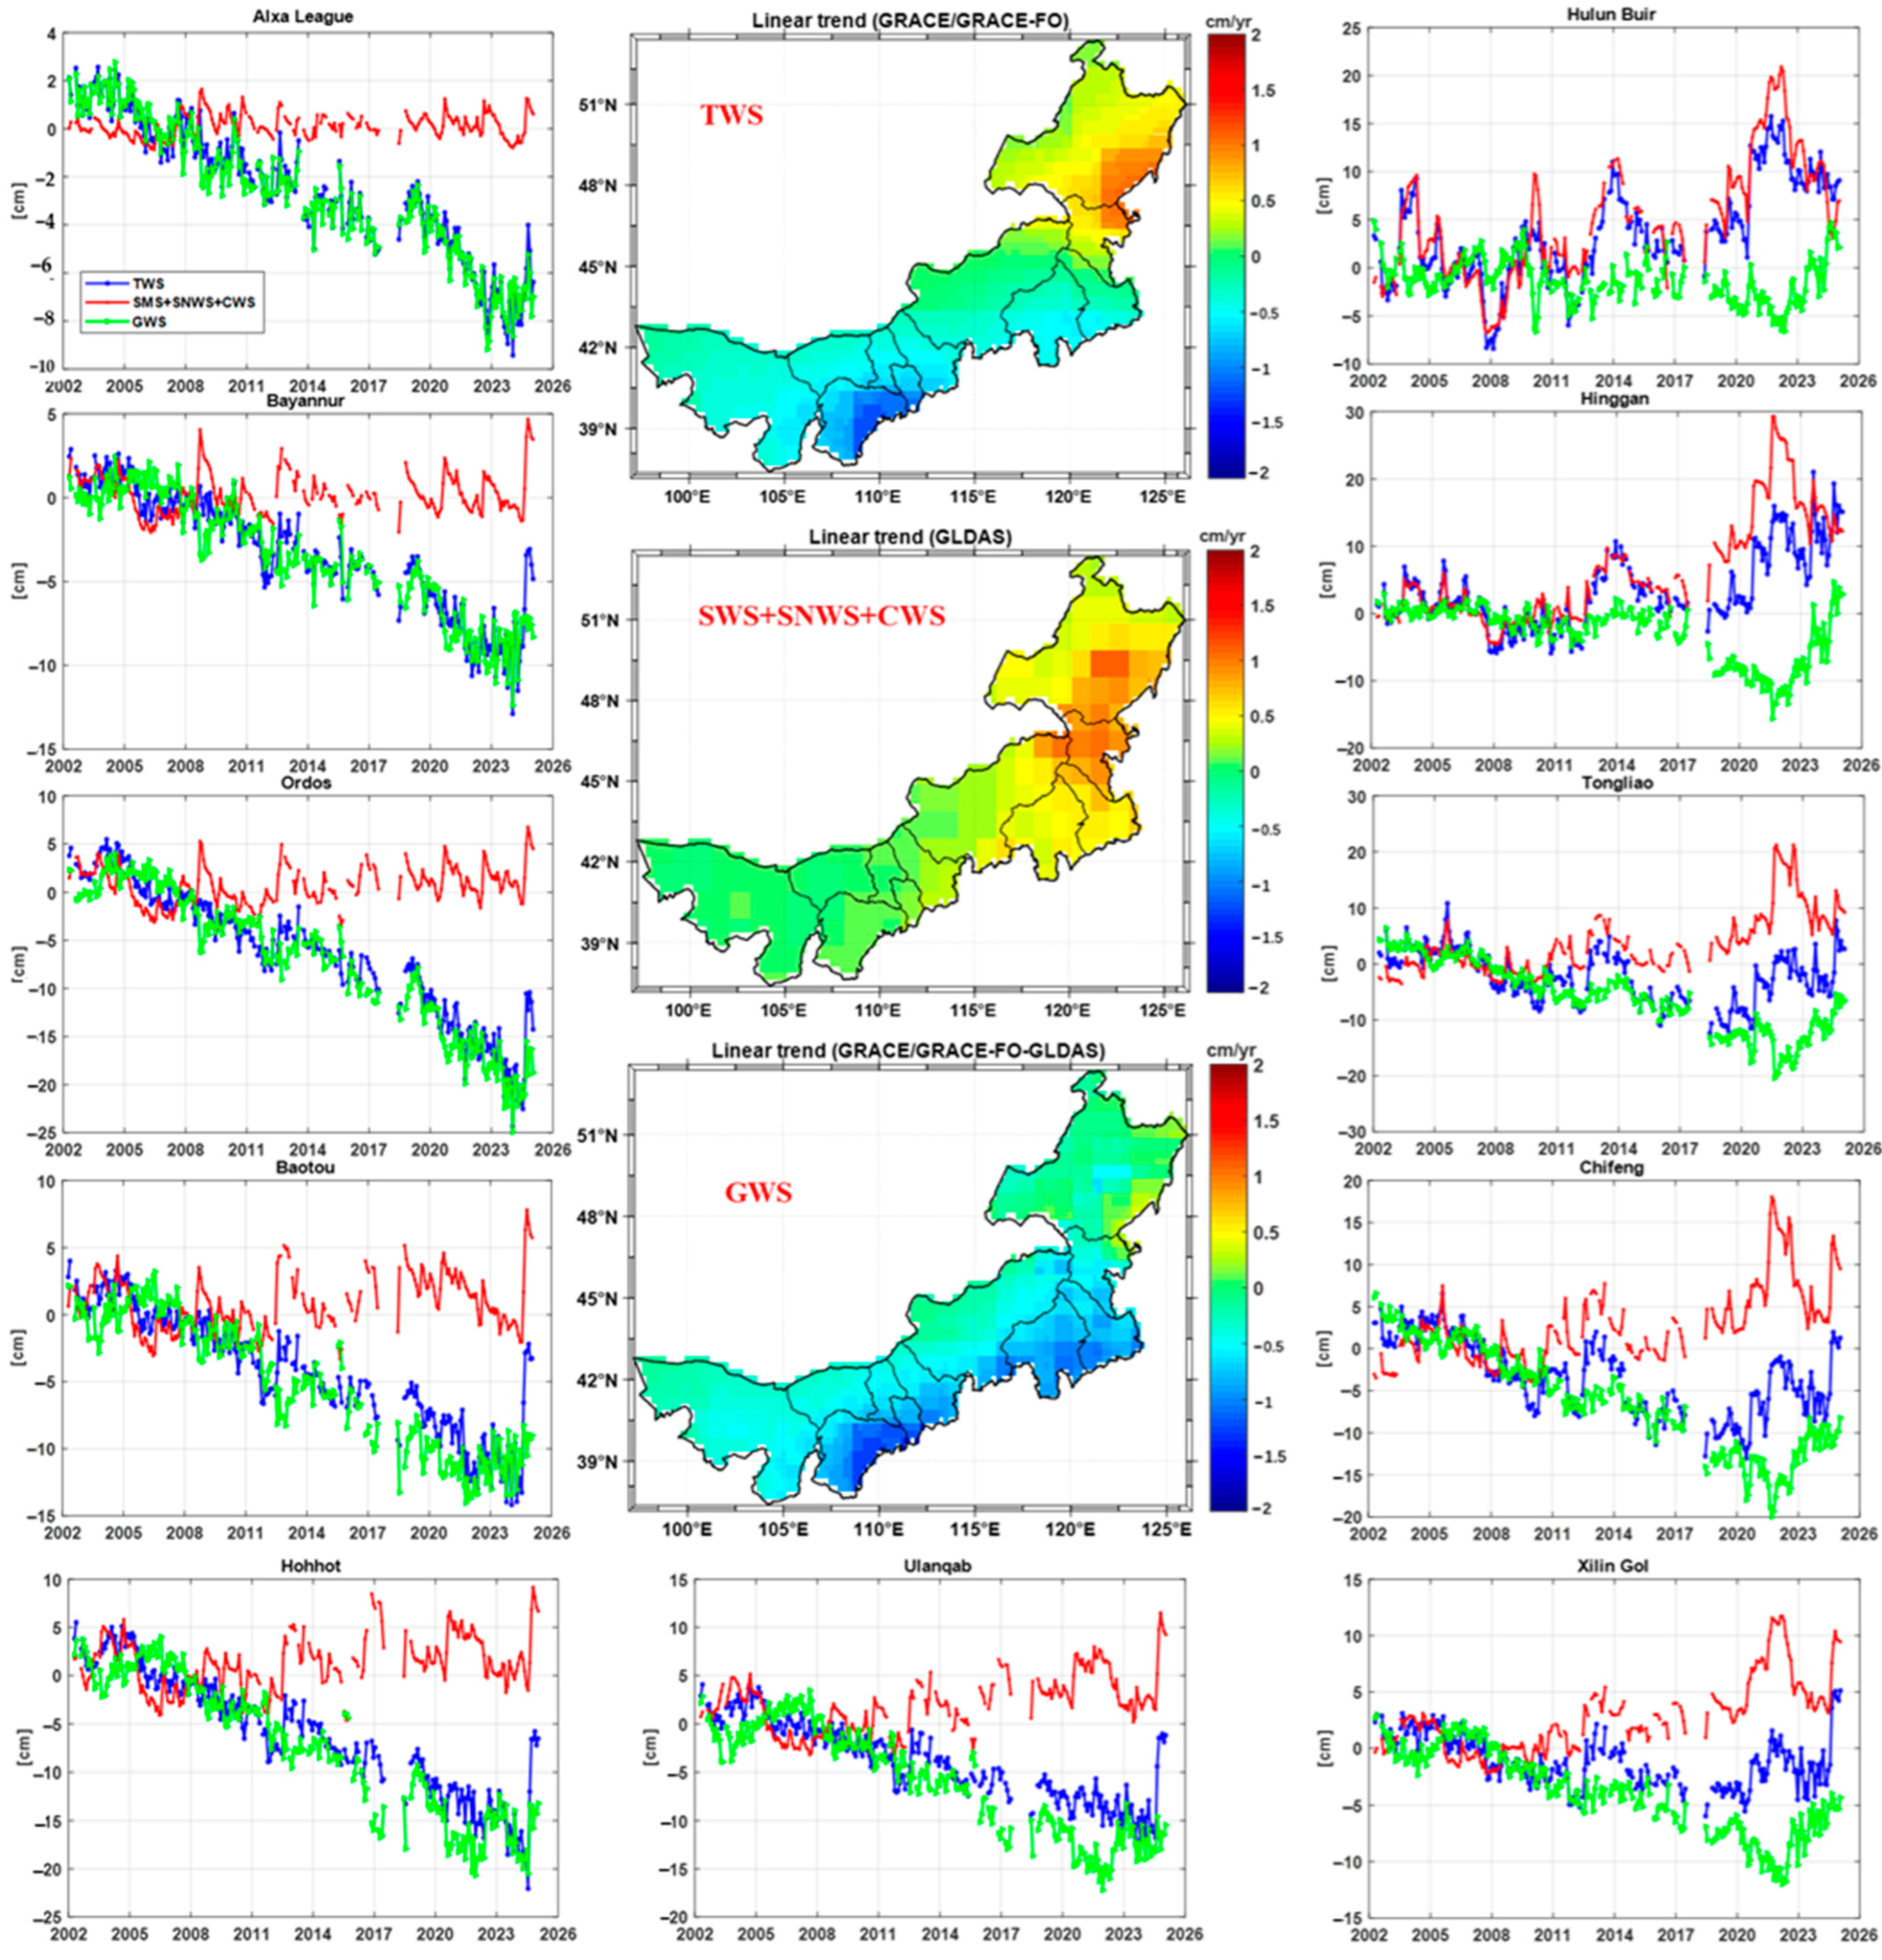
The linear trend distributions of water storage changes (SMS + SNWS + CWS) derived from the GLDAS models fluctuate overall during the entire study period but significantly differ across different time spans. After the SMS + SNWS + CWS elements are deducted from the estimated TWS changes, the GWS changes are obtained. As shown in Figure 3, the spatial distribution of water storage changes varies considerably across the region. A key finding is that the most pronounced TWS depletion in the central and southern regions (e.g., Ordos, Baotou, and Hohhot) coincides with the most severe GWS declines. This pattern highlights groundwater overexploitation as the principal contributor to the overall water loss in these basins. Conversely, in parts of the northeast where TWS is increasing, the trend is more consistent with the positive changes in water components (SMS + SNWS + CWS) derived from GLDAS. This indicates that the primary contributor to TWS changes varies regionally. On a regional mean basis, the quantitative analysis supports that the overall decrease in TWS in Inner Mongolia (−1.69 ± 0.17 mm/year) is primarily due to the substantial depletion of GWS (−4.84 ± 0.12 mm/year), which offsets a slight increase in surface water (+3.15 ± 0.16 mm/year). This finding indicates that although the water storage in terms of SMS+SNWS+CWS components tends to slightly increase overall (+3.21 ± 0.19 mm/year), groundwater overexploitation is the fundamental reason for the overall decrease in TWS in Inner Mongolia (−1.69 ± 0.17 mm/year). In addition, the spatial distributions of the annual and semiannual amplitudes of TWS changes derived from the GRACE/GRACE-FO mascon solutions are shown in Figure A1.
To better investigate the relationships between climate indices (precipitation, evaporation, and runoff) and the estimated water storage changes, Figure 4 and Figure 5 present the monthly mean precipitation, evaporation, and runoff of Inner Mongolia for the corresponding time spans. The precipitation (P) shows a pattern of “more in the east and less in the west”. The northeast (e.g., Hulun Buir) has abundant precipitation, whereas the west (e.g., Alxa League) has scarce precipitation. During the three subperiods, the average precipitation tends to increase (2002.04–2007.09: 26.51 mm; 2007.10–2022.04: 29.46 mm; and 2022.05–2025.01: 33.23 mm), indicating that the climate may be trending toward humidity. The bottom of Figure 4 shows the difference in P-E-R, which reflects the direct impact of climate factors on water storage (excluding human activities). Notably, for the subperiod 2022.05–2025.01, the northeastern region, including Hulun Buir, exhibits negative P-E-R values (Figure 5), indicating that climate conditions (increased evaporation and runoff outpacing precipitation gains) were the primary drivers for the net water loss observed in this region during this specific timeframe (Figure 3, TWS panel for 2022.05–2025.01). This contrasts with the central/southern regions, where human activities remained the dominant factor. Despite the increase in precipitation, the simultaneous increase in evapotranspiration and runoff cannot be simply attributed to the recovery of groundwater caused by the increase in precipitation. This finding indicates that the restoration of groundwater after April 2022 is more likely to be the result of a combination of policy interventions (such as mining restrictions and water conservation) and climate factors, rather than simply an increase in natural precipitation, which is investigated in depth in Section 3.3.

3.2. Spatiotemporal Analysis of Water Storage Changes at the City Scale

In Section 3.1, spatial–temporal analysis is carefully performed. To further investigate the TWS, SMS + SNWS + CWS, and GWS changes, we compute them for 11 major cities at the city scale. Note that Wuhai city is not included because of its relatively small area outside of the spatial resolution of GRACE/GRACE-FO. In theory, the spatial resolution of GRACE/GRACE-FO data (~300 km) limits fine-scale analysis; therefore, the following city-level results should be interpreted as indicative trends within the GRACE footprint rather than precise local estimates. The high temporal correlation between adjacent small sub-basins due to the limited GRACE resolution is acknowledged, and the reliability of these city-scale trends is discussed in Section 4.2. The estimated water storage series of 11 major cities are shown in Figure 6 to analyze in depth the changes in GWS during the study period. The corresponding estimated linear trends and annual and semiannual amplitudes are presented in Table 2.
The results shown in Figure 6 and Table 2 reveal a downward trend in TWS in most urban areas. Among them, Ordos (−9.57 ± 0.19 mm/year), Baotou (−5.88 ± 0.17 mm/year), and Hohhot (−8.55 ± 0.20 mm/year) have the most significant losses. The GWS trends in these areas are −10.20 ± 0.19 mm/year, −6.64 ± 0.16 mm/year, and −9.85 ± 0.22 mm/year, respectively. These findings indicate that the depletion of groundwater is the major factor leading to the reduction in TWS, highlighting the serious challenges associated with water resources in these regions. Moreover, a relationship of compensation between GWS and surface water is detected: in certain regions, such as Hinggan, there is an increase in surface water (for example, +9.12 ± 0.44 mm/year according to GLDAS data), whereas the depletion of groundwater persists (for instance, −5.05 ± 0.41 mm/year as per GRACE data). This implies that there is a continuous excessive dependence on groundwater even when surface water is available.
In general, between April 2002 and January 2025, there were substantial changes in both the TWS and GWS in Inner Mongolia, with significant decreases in most regions. These trends emphasize the need for ongoing monitoring and scientific administration for the sustainable utilization of water resources, particularly in cities and regions where water reserves are decreasing rapidly, thus decreasing the risk of future flood-stricken cities. Moreover, we should consider the areas where water resource reserves have increased for the rational distribution and utilization of water resources.

3.3. Investigating the Potential Causes

To study the potential causes in TWS and GWS changes, the data, including precipitation, surface water and groundwater resources, and water supply from both sources, are further adopted from the Inner Mongolia Autonomous Region Water Resources Bulletin. Note that the yearly precipitation refers to the total rainfall over the entire region, and the same applies to other corresponding datasets. To facilitate comparison with the estimates from the GRACE/GRACE-FO mascon solutions and GLDAS models, all the water volume data (in cubic meters) are converted to regional equivalent water heights (EWHs) in centimeters.
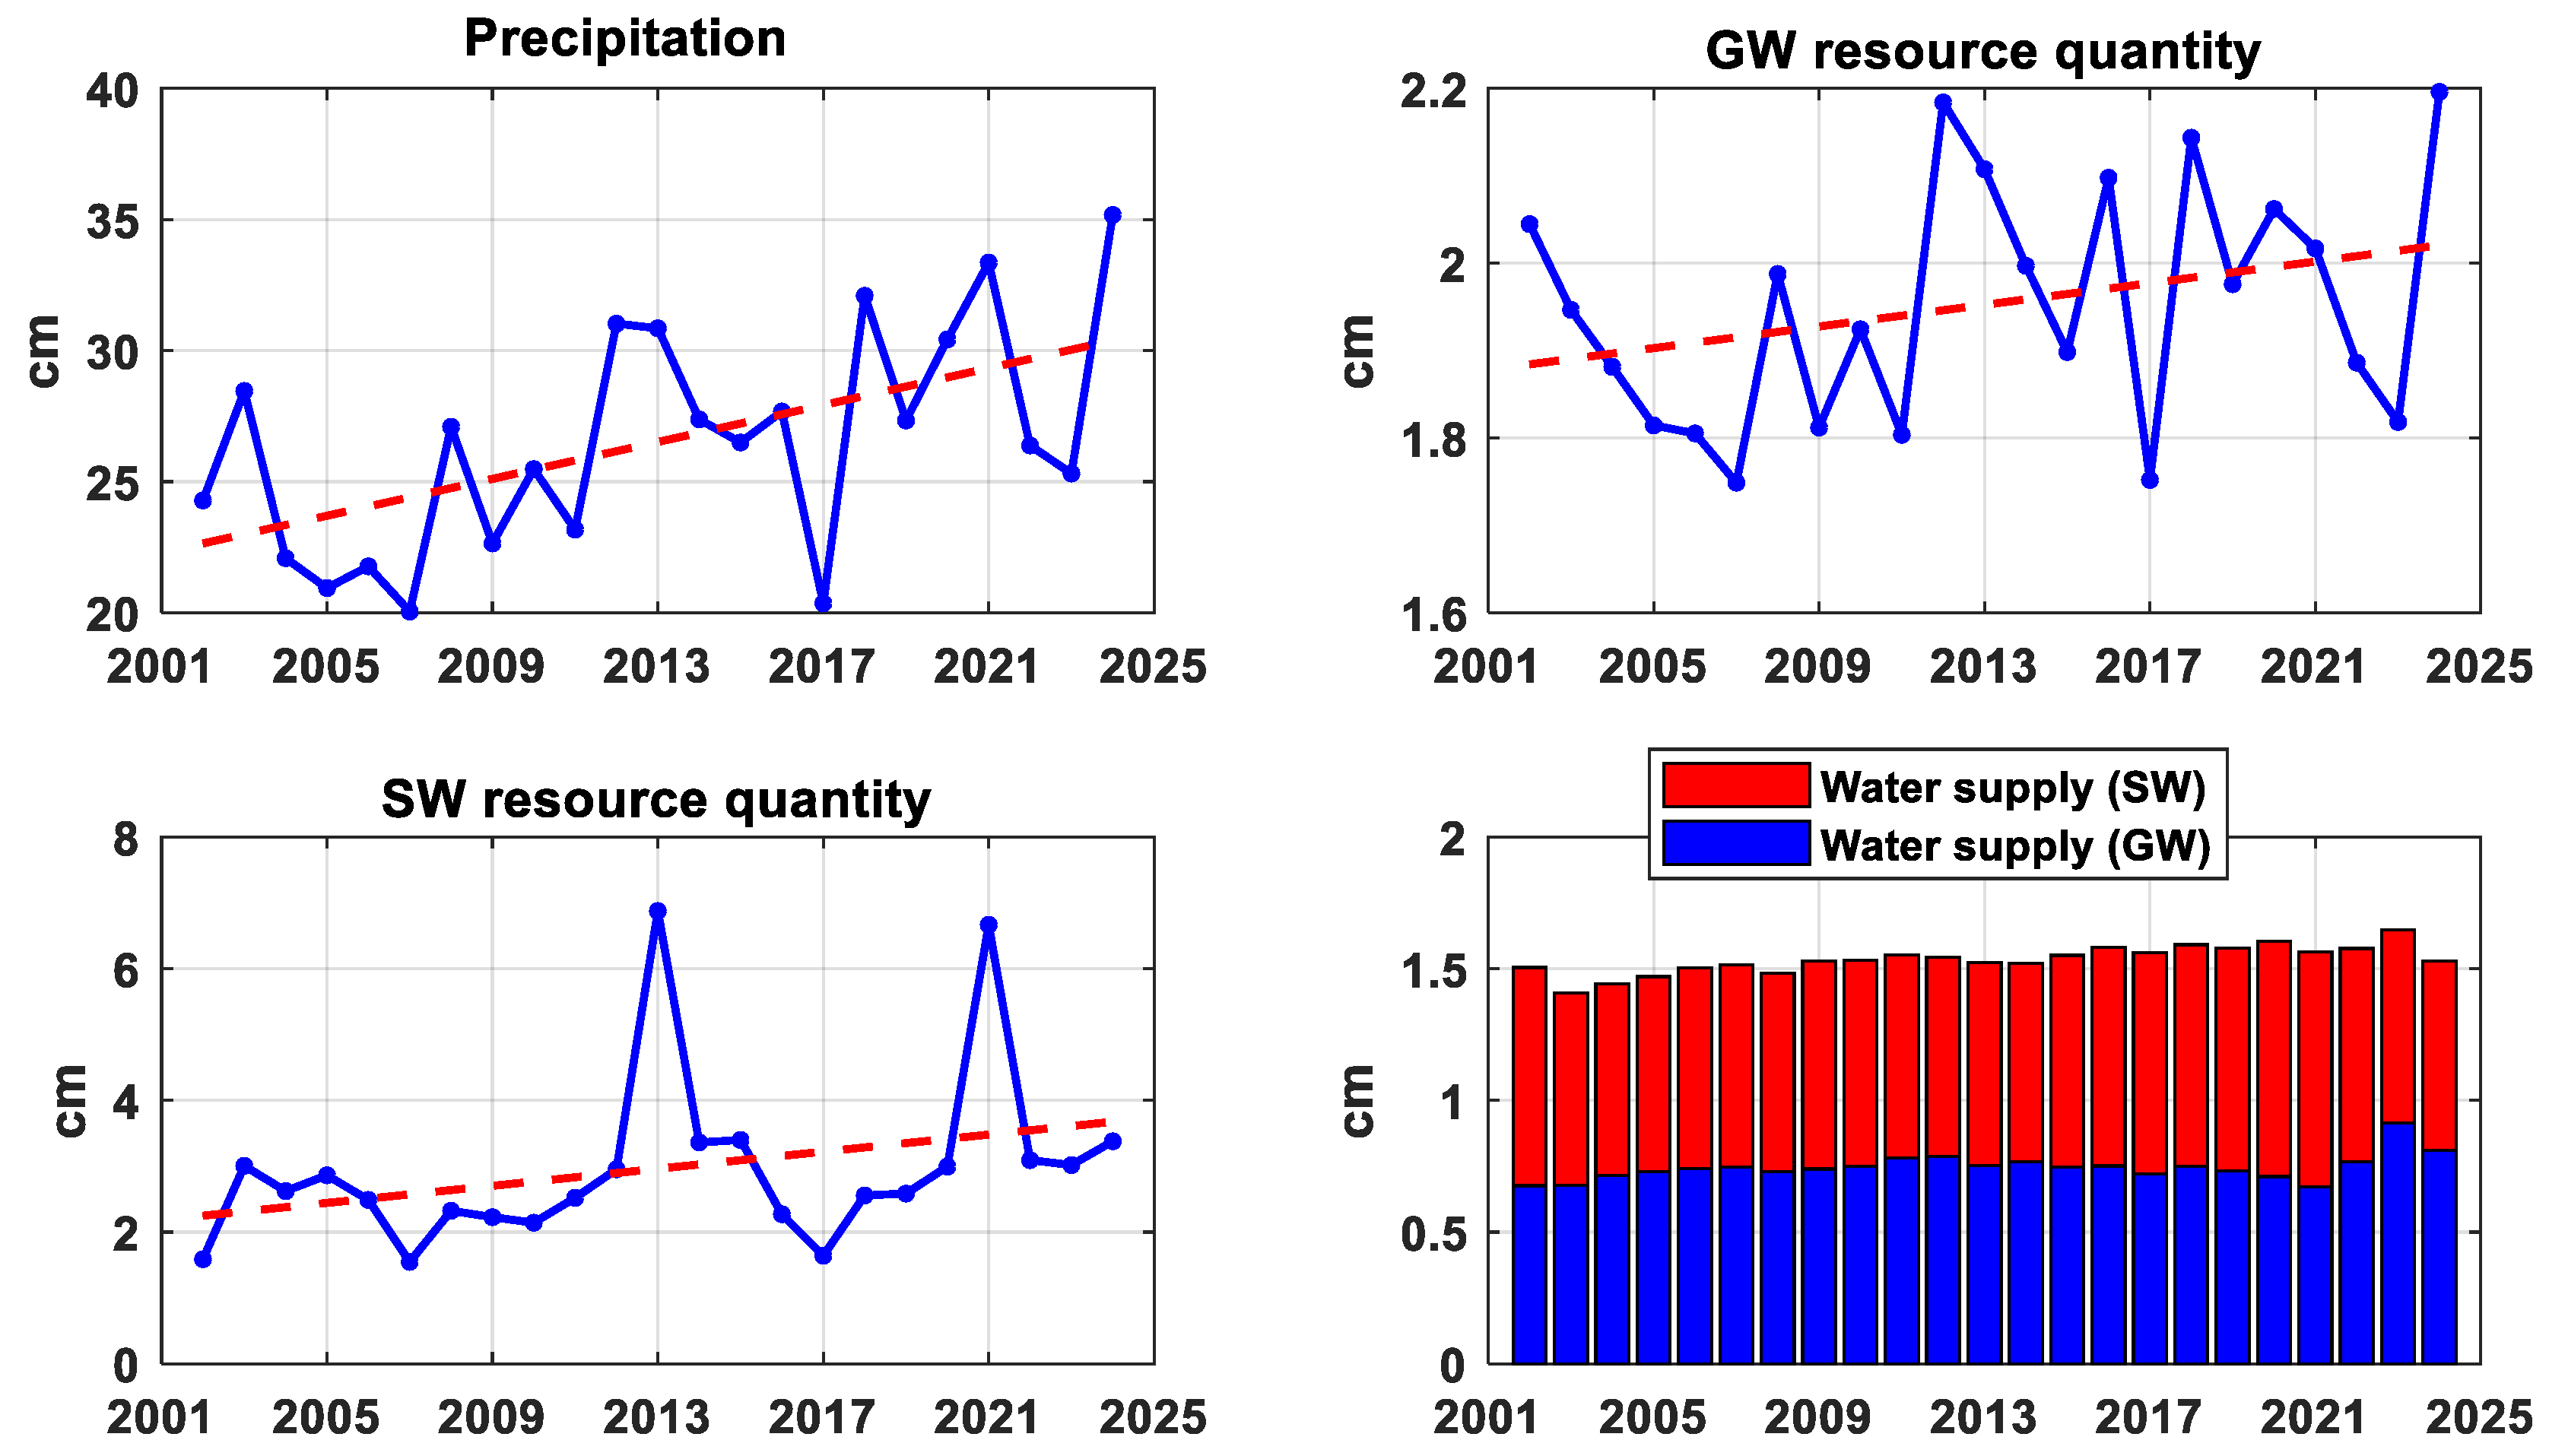
The annual precipitation, SW, and GW resource quantity, as well as the SW and GW water supply in Inner Mongolia from 2002 to 2024, are shown in Figure 7. It is evident that water resources in Inner Mongolia have tended to increase over the past 23 years, particularly in terms of precipitation. The water supply can be categorized into surface water and groundwater sources. Overall, the annual water supply in Inner Mongolia remained relatively stable during the study period. In 2013, the total surface water resources across the region reached 81.352 billion cubic meters, which is equivalent to 6.88 cm in EWH—an increase of 132.9% compared with that in the previous year and 100.1% above the multiyear average. This surge is attributable primarily to four cities: Hulun Buir, Hinggan, Tongliao, and Chifeng. The main cause was a series of short-duration, high-intensity rainstorms that occurred from July 2013 onward in the Hulun Buir River and Argun River Basins, leading to a once-in-a-century catastrophic flood in the Hailar and Genhe River areas. A similar situation occurred in 2021.
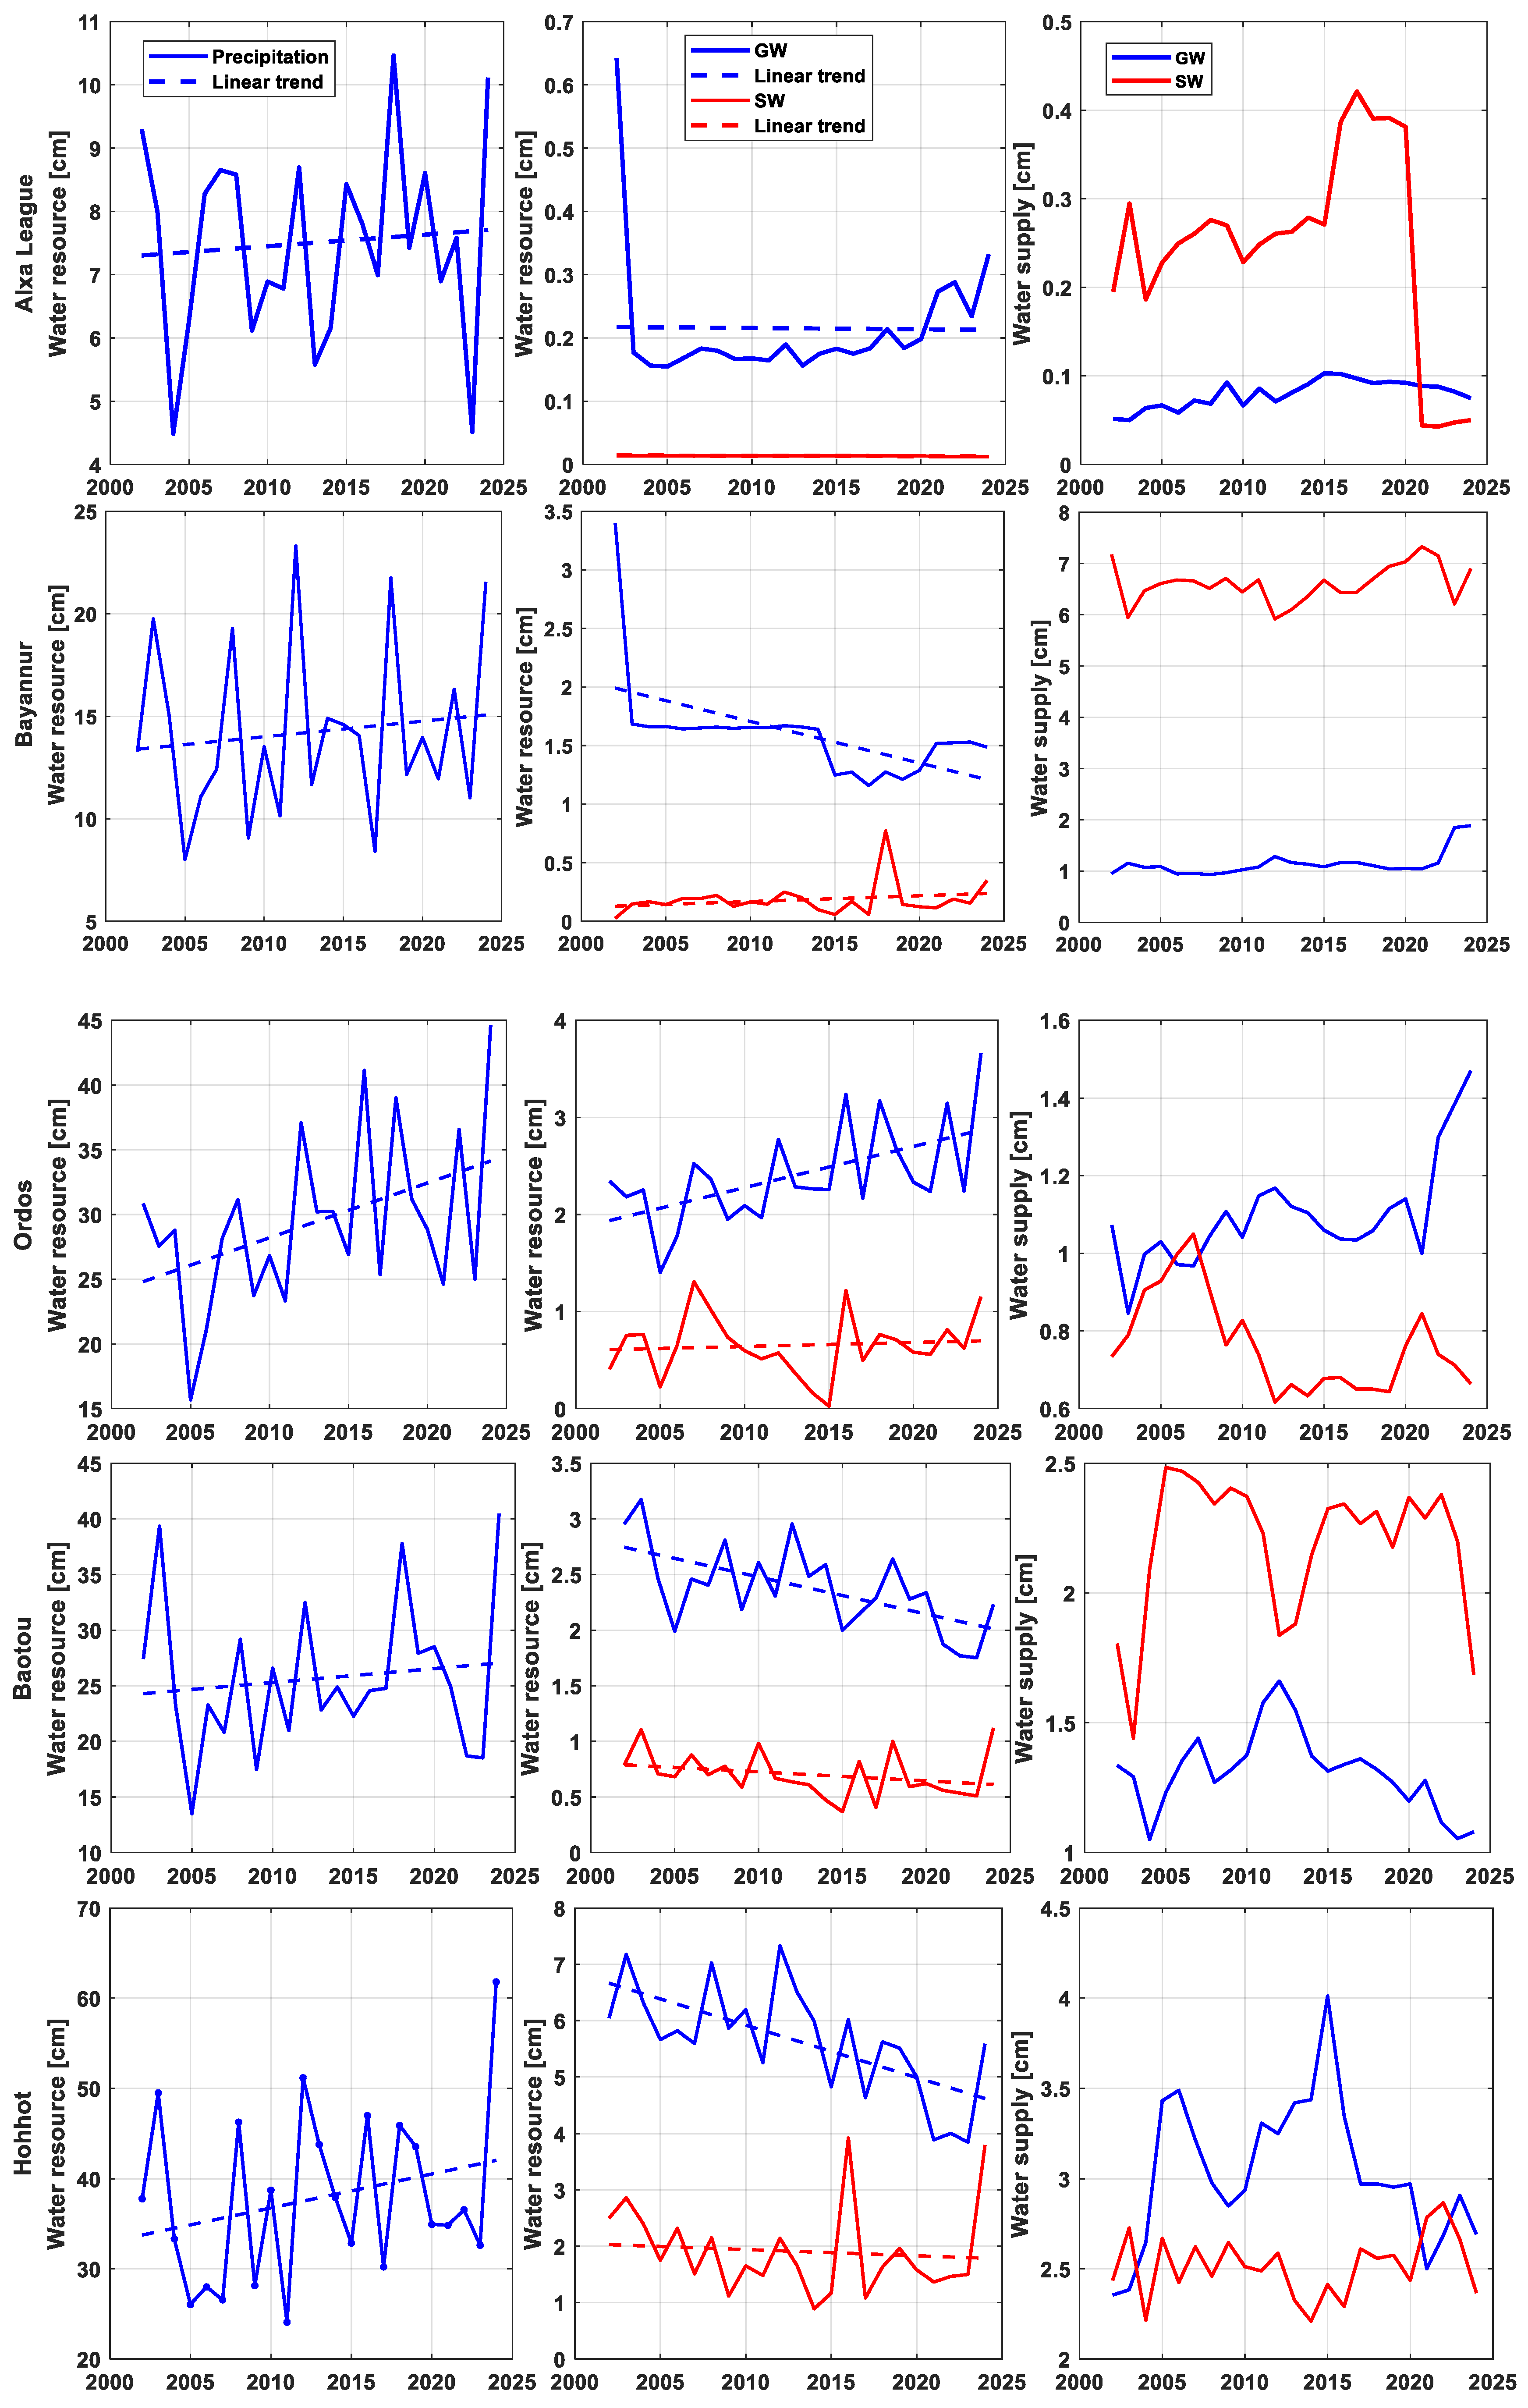
To further examine the causes of TWS and GWS changes across different cities, Figure 8 presents the annual precipitation, SW, and GW resource quantity from 2002 to 2024, as well as the water supply from SW and GW sources for 11 major cities in Inner Mongolia. Like the regional trend, all 11 cities experienced an increase in precipitation during the study period. In terms of water resources, most cities had more groundwater resources than surface water, with the exception of Hulun Buir and Hinggan. Moreover, a significant decreasing trend in groundwater resources was observed in Hohhot, Baotou, and Bayannur, whereas Xilin Gol, Ulanqab, and Ordos showed an increasing trend. With respect to water consumption, the supply primarily originated from both surface and groundwater sources. Table 3 summarizes the trends in key variables, including TWS, GWS, water resources, and water use, over the study period.
The data in Table 1 indicate that GWS in Inner Mongolia significantly decreased from April 2002 to April 2022, whereas an increasing trend was observed in certain regions—including Hulun Buir, Hinggan, Tongliao, Chifeng, Xilin Gol, and Ulanqab—from May 2022 to January 2025. This recovery can be attributed to several factors. On the one hand, increased precipitation helped replenish GWS losses. On the other hand, the water management principle of “Four Waters and Four Determinations” (i.e., determining the city, land, population, and production on the basis of water availability) has been fully implemented in Inner Mongolia. As one of the region’s key initiatives, water conservation has steadily improved agricultural water use efficiency. By integrating engineering, agronomic, and institutional measures, practices have shifted from extensive to economical, aiding groundwater protection and recovery.
In the arid Ordos basin, historical water scarcity and water-intensive coal mining led to severe groundwater overexploitation. Recent efficiency measures have raised groundwater levels for three straight years, with a 1.84 m increase by December 2024. Agricultural improvements—including 5000 acres of high-efficiency irrigation and 4000 acres of drought-resistant crops—reduced groundwater use [42]. Water-saving reforms in Shangdu County raised groundwater levels by 1.15 m in the first half of 2024, with a three-year cumulative rise of 0.83 m [43]. These gains reflect a better recharge–extraction balance.
The Chuo Ji Liao Water Diversion Project now supplies 109 million m3 of ecological water annually to Horqin District, replacing 20 million m3 of groundwater extraction each year and alleviating aquifer depletion [44]. The restored Molimiao Reservoir now provides sustained groundwater replenishment, helping curb overexploitation and maintain regional water ecology. To address groundwater overuse, Tongliao has promoted water-saving agriculture, notably drip irrigation. In Chifeng, enhanced conservation and higher rainfall boosted groundwater levels, with key monitoring points in Hongshan District recording rises of 2.24 m, 2.55 m, and 1.96 m in 2024 [45]. A 2020 report revealed that core grassland groundwater levels once fell by 0.8 m annually. After conservation efforts, regional vegetation coverage in Xilin Gol nearly doubled from 56.8% (2013) to 81.3% (2023) [46]. In summary, the increased rainfall and effective policies have been crucial in restoring Inner Mongolia’s groundwater.

4. Discussions

4.1. Interpretation of Spatiotemporal Patterns and Driving Factors

This study presents a long-term, detailed analysis of water storage change across semiarid Inner Mongolia, highlighting a complex relationship between climate-driven changes and human activities. The results confirm a broad decline in TWS in Inner Mongolia from April 2002 to January 2025, mainly due to substantial groundwater depletion, similar to that in earlier regional studies [23,24]. There were significant differences in characteristics; the central and southern regions, such as Ordos, Baotou, and Hohhot, experienced severe water loss, whereas the northeastern area, including Hulun Buir, remained stable or saw slight gains. Although the northeast region generally received more rainfall, Hulun Buir underwent a short-term net water loss between May 2022 and January 2025 (Figure 3), which can be explained by the negative precipitation–evaporation–runoff values during the same interval (Figure 5) to some extent. This indicates that even in relatively water-rich regions—where evapotranspiration and runoff outpace rainfall—they can temporarily outweigh both natural recharge and policy benefits, leading to net TWS depletion.
In the central–southern agro-pastoral transition zones, human activity appears to be the dominant driver. The high groundwater loss rate of –10.20 mm/year in Ordos is closely related to large-scale coal mining [7,11,40] and irrigated agriculture [23,24]. Coal mining not only causes a large amount of water consumption but can also damage local aquifer structures. Meanwhile, irrigation-dependent farming in this dry region places persistent and often unsustainable demand on groundwater. In contrast, in western areas like the Alxa League, the climate factor seems to be the main cause of water loss. Low rainfall and high evaporation, intensified by climate change [40], restrict natural recharge and lead to the decline in TWS water storage. Conversely, plentiful rainfall in the northeast supports both surface water and groundwater reserves, as reflected in the positive TWS trends seen in Hulun Buir.
One of the key findings of this study is the recovery of groundwater depletion after May 2022. The long-term decline rate of –5.49 ± 0.17 mm/year (2007–2022) shifted to a significant recovery of +17.80 ± 0.21 mm/year (2022–2025). Although precipitation increased modestly throughout the study period (Figure 2d and Figure 7), the groundwater recovery cannot simply be attributed to climate variability, especially since evaporation and runoff also rose, which would normally offset some gains from rainfall. Therefore, we hold on to the idea that this turnaround may have mainly been contributed to by the water governance measures enacted at regional and national levels, such as the “Four Waters and Four Determinations” principle proposed based on the available water resources. As discussed in Section 3.3, concrete actions included the following:
  • Strict controls on groundwater extraction for industrial use, particularly in water-intensive sectors like coal mining in Ordos.
  • Large-scale ecological water diversion projects (e.g., the Chuo Ji Liao project in Tongliao).
  • Comprehensive agricultural water pricing reforms and the development of high-standard farmland.
Figure 9 shows how water use efficiency changed in Inner Mongolia and its twelve administrative divisions between 2004 and 2023. Overall regional efficiency increased from 64.73% to 72.10%, with most cities improving at a faster rate after 2021, demonstrating that water-saving technologies effectively enhance resource utilization. However, progress has varied significantly across sectors. Industrial projects, such as Ordos’s coal chemical water recycling initiatives, have seen strong results due to their higher investment returns. In contrast, agriculture is lagging behind. For example, in Bayannur, drip irrigation covers less than 30% of farmland, and the region’s water efficiency remains the lowest in the area, below 60%. Bridging this gap will require targeted subsidies to encourage wider adoption of water-efficient practices in agriculture [25]. These efforts have collectively helped reduce groundwater extraction and improve recharge, contributing to the recovery of groundwater levels in several key cities (Table 3). This sends a positive message: even though human activity drove earlier groundwater depletion, well-designed policies and governance can reverse this trend—even in a water-scarce environment.

4.2. Policy Implications and Recommendations

This study offers practical insights for managing water resources in Inner Mongolia and other water-stressed regions, mainly including the following:
  • The groundwater recovery since 2022 shows that recent measures are working. These efforts should not only continue but be expanded—through ongoing investment in efficient irrigation, stricter enforcement of extraction permits, and scaled-up ecological water diversion projects.
  • Water storage trends vary significantly across the region, and management should reflect these differences. In the central and south, where overuse is severe, focus should remain on limiting extraction and boosting water efficiency in farming and industry. In the wetter northeast, the priority should be protecting water sources from pollution and future overuse. In the arid west, policies must help ecosystems and economies adapt to dry conditions.
  • The stark contrast between water-rich and water-poor areas in Inner Mongolia suggests potential for managed water transfers. Carefully designed inter-basin water projects, backed by thorough economic and environmental reviews, could help relieve pressure on overdrawn aquifers in the south.
This study confirms the value of satellite-based monitoring like GRACE/GRACE-FO. Blending these broad-scale insights with local sensor networks and detailed hydrological models can provide a stronger foundation for real-time water decisions.

4.3. Limitations and Future Perspectives

Though the GRACE/GRACE-FO missions have provided invaluable data for monitoring the water storage, the ~300 km resolution limits detailed analysis. At the city level, the results (Figure 6, Table 2) should therefore be seen as reflecting broad regional trends within the satellite’s footprint, not precise local measurements. Due to the signal leakage across boundaries, data for individual cities—especially smaller or neighboring ones—are not fully independent and show high correlation over time. Thus, while we highlight strong regional patterns (like the contrast between water loss in the Ordos–Baotou–Hohhot corridor and stability in the northeast), we caution against over-interpreting small differences between adjacent cities. The city-level trends offer reliable insights into general hydrological behavior, consistent with other GRACE-scale studies [13,23], but cannot replace higher-resolution data for local water management.
The GWS estimations largely depend on the accuracy of GLDAS models in simulating soil moisture, snow water, and canopy water storage. However, these models often have larger uncertainty in complex semiarid and cold regions, leading to biases that affect GWS results [6]. While using an ensemble average can reduce some uncertainty, it does not fully resolve these limitations. Although the recovery of GWS aligns temporally with policy measures and documented actions, establishing a definitive link requires more rigorous quantitative analysis. Future studies should combine high-resolution data on groundwater extraction, land use, and policy implementation with hydrological modeling to better separate the effects of climate variability and human intervention. The observed GWS recovery (2022–2025) is relatively short. Continued monitoring is also necessary to evaluate whether this positive trend can be sustained amid ongoing climate change and socioeconomic development. In summary, this study not only highlights serious water storage challenges in Inner Mongolia but also demonstrates that well-designed, strictly enforced policies can help reverse groundwater depletion. These insights offer a useful reference for managing water resources in other arid regions worldwide.

5. Conclusions

The GRACE/GRACE-FO satellite gravimetry and GLDAS hydrological models were utilized in this study to analyze the spatiotemporal variations in TWS and GWS in Inner Mongolia from April 2002 to January 2025. The results show a slight downward trend in regional terrestrial water storage (−1.69 ± 0.17 mm/year), along with a remarkable decrease in groundwater storage (−4.90 ± 0.12 mm/year), indicating that the depletion of groundwater is the main factor for the reduction in water reserves in the area. In terms of spatial scale, TWS changes tend to decrease in the southern part and increase in the northern part. In the central and southern regions, such as Ordos and Baotou, the overexploitation of groundwater is still highly serious, whereas in the northeastern areas, such as Tongliao and Hinggan League, a certain degree of recovery can be seen. Since 2022, the rate of groundwater decrease has decelerated and has tended to increase, indicating that the water conservation management and ecological restoration policies carried out in recent years have had positive effects. Satellite gravimetry plays an effective and irreplaceable role in the monitoring of regional water resource dynamics, as demonstrated by this study. This study demonstrates the power of satellite gravimetry in monitoring regional water resource dynamics. Despite certain limitations, our findings provide crucial scientific support for the sustainable management of water resources in semiarid regions and highlight the potential effectiveness of coordinated policy interventions in addressing groundwater overexploitation.

Author Contributions

Conceptualization, J.P.; data curation, Y.T. and L.M.; formal analysis, D.Z. and F.W.; investigation, T.F. and L.M.; methodology, D.Z.; resources, Y.T. and R.G.; visualization, T.F.; writing—original draft, D.Z.; writing—review and editing, J.P., F.W., L.M. and R.G. All authors have read and agreed to the published version of the manuscript.

Funding

This work has received funding from the Technological Achievements of Inner Mongolia Autonomous Region in China (2022YFDZ0050), the Natural Science Foundation of China (42374017), and the Natural Science Foundation of Inner Mongolia Autonomous Region (2025SHZR1229).

Data Availability Statement

Three GRACE/GRACE-FO (i.e., CSR, JPL, and GSFC) mascon solutions are available at the following websites: https://doi.org/10.15781/cgq9-nh24, https://podaac.jpl.nasa.gov/dataset/TELLUS_GRAC-GRFO_MASCON_CRI_GRID_RL06.3_V4 (accessed on 1 January 2025) and https://earth.gsfc.nasa.gov/geo/data/grace-mascons (accessed on 1 January 2025), respectively. The three GLDAS models (i.e., CLSM, NOAH, and VIC) can be directly downloaded from the following websites: https://doi.org/10.5067/FOUXNLXFAZNY, https://disc.gsfc.nasa.gov/datasets/GLDAS_NOAH025_M_2.1/summary?keywords=GLDAS (accessed on 1 January 2025), and GES DISC Dataset: GLDAS VIC Land Surface Model L4 monthly 1.0 × 1.0 degree V2.1 (GLDAS_VIC10_M 2.1). The monthly mean precipitation, evaporation, and runoff data from the GLDAS CLSM products can be found at https://doi.org/10.5067/FOUXNLXFAZNY. The yearly water resources of precipitation, surface water, and groundwater were obtained from the Water Resources Bulletin of the Inner Mongolia Autonomous Region, which can be downloaded from the following website: https://slt.nmg.gov.cn/xxgk/zfxxgkzl/fdzdgknr/gbxx/ (accessed on 1 January 2025).

Acknowledgments

The authors are grateful to the editor and two anonymous reviewers for their comprehensive and insightful comments, which have led to the improved presentation of the results.

Conflicts of Interest

The authors declare no conflict of interest.

Appendix A

Figure A1. Spatial distributions of annual and semiannual amplitudes of TWS changes derived from three mascon solutions.
Remotesensing 17 03668 g0a1

References

  1. Harder, P.; Pomeroy, J.W.; Westbrook, C.J. Hydrological resilience of a Canadian Rockies headwaters basin subject to changing climate, extreme weather, and forest management: Hydrological Resilience of a Canadian Rockies Basin Subject to Change. Hydrol. Process. 2015, 29, 3905–3924. [Google Scholar] [CrossRef]
  2. Ummenhofer, C.C.; Meehl, G.A. Extreme weather and climate events with ecological relevance: A review. Philos. Trans. R. Soc. B Biol. Sci. 2017, 372, 20160135. [Google Scholar] [CrossRef] [PubMed]
  3. Yang, D.; Yang, Y.; Xia, J. Hydrological cycle and water resources in a changing world: A review. Geogr. Sustain. 2021, 2, 115–122. [Google Scholar] [CrossRef]
  4. Humphrey, V.; Rodell, M.; Eicker, A. Using Satellite-Based Terrestrial Water Storage Data: A Review. Surv. Geophys. 2023, 44, 1489–1517. [Google Scholar] [CrossRef] [PubMed]
  5. Feng, W.; Zhong, M.; Lemoine, J.M.; Biancale, R.; Hsu, H.T.; Xia, J. Evaluation of groundwater depletion in North China using the gravity recovery and climate experiment (GRACE) data and ground-based measurements. Water Resour. Res. 2013, 49, 2110–2118. [Google Scholar] [CrossRef]
  6. Feng, T.; Shen, Y.; Chen, Q.; Wang, F.; Zhang, X. Groundwater storage change and driving factor analysis in north china using independent component decomposition. J. Hydrol. 2022, 609, 127708. [Google Scholar] [CrossRef]
  7. Chen, X.; Jiang, J.; Lei, T.; Yue, C. GRACE satellite monitoring and driving factors analysis of groundwater storage under high-intensity coal mining conditions: A case study of Ordos, northern Shaanxi and Shanxi, China. Hydrogeol. J. 2020, 28, 673–686. [Google Scholar] [CrossRef]
  8. Huan, C.; Wang, F.; Zhou, S.; Lu, T. Terrestrial water storage changes over 25 global river basins extracted by local mean decomposition from GRACE Monthly Gravity Field solutions. Acta Geodyn. Geomater. 2023, 19, 61–70. [Google Scholar] [CrossRef]
  9. Li, W.; Bao, L.; Yao, G.; Wang, F.; Guo, Q.; Zhu, J.; Zhu, J.; Wang, Z.; Bi, J.; Zhu, C.; et al. The analysis on groundwater storage variations from GRACE/GRACE-FO in recent 20 years driven by influencing factors and prediction in Shandong Province, China. Sci. Rep. 2024, 14, 5819. [Google Scholar] [CrossRef]
  10. Petch, S.; Dong, B.; Quaife, T.; King, R.P.; Haines, K. Precipitation explains GRACE water storage variability over large endorheic basins in the 21st century. Front. Environ. Sci. 2023, 11, 1228998. [Google Scholar] [CrossRef]
  11. Xie, X.; Xu, C.; Wen, Y.; Wei, L. Monitoring groundwater storage changes in the Loess Plateau using GRACE satellite gravity data, hydrological models and coal mining data. Remote Sens. 2018, 10, 605. [Google Scholar] [CrossRef]
  12. Liu, Z. Causes of changes in actual evapotranspiration and terrestrial water storage over the eurasian inland basins. Hydrol. Process. 2022, 36, e14482. [Google Scholar] [CrossRef]
  13. Long, D.; Xu, Y.; Cui, Y.; Cui, Y.; Butler, J.J., Jr.; Dong, L.; Wang, L.; Liu, D.; Wada, Y.; Hu, L.; et al. Unprecedented large-scale aquifer recovery through human intervention. Nat. Commun. 2025, 16, 7296. [Google Scholar] [CrossRef] [PubMed]
  14. Tapley, B.; Bettadpur, S.; Ries, J.; Thompson, P.; Watkins, M. GRACE measurements of mass variability in the Earth system. Science 2004, 305, 503–505. [Google Scholar] [CrossRef] [PubMed]
  15. Tapley, B.D.; Watkins, M.M.; Flechtner, F.; Reigber, C.; Bettadpur, S.; Rodell, M.; Sasgen, I.; Famiglietti, J.S.; Landerer, F.W.; Chambers, D.P.; et al. Contributions of GRACE to understanding climate change. Nat. Clim. Change 2019, 9, 358–369. [Google Scholar] [CrossRef] [PubMed]
  16. Wang, F.; Geng, J.; Shen, Y.; Wen, Y.; Feng, T. Regional Terrestrial Water Storage Changes in the Yangtze River Delta over the Recent 20 years. EGUsphere 2024, 202, 1–12. [Google Scholar] [CrossRef]
  17. Cho, Y. Analysis of terrestrial water storage variations in South Korea using GRACE satellite and GLDAS data in Google Earth Engine. Hydrol. Sci. J. 2024, 69, 1032–1045. [Google Scholar] [CrossRef]
  18. Rzepecka, Z.; Birylo, M.; Jarsjo, J.; Cao, F.; Pietroń, J. Groundwater Storage Variations across Climate Zones from Southern Poland to Arctic Sweden: Comparing GRACE-GLDAS Models with Well Data. Remote Sens. 2024, 16, 2104. [Google Scholar] [CrossRef]
  19. Zhou, T.; Wen, X.; Feng, Q.; Yu, H.; Xi, H. Bayesian Model Averaging Ensemble Approach for Multi-Time-Ahead Groundwater Level Prediction Combining the GRACE, GLEAM, and GLDAS Data in Arid Areas. Remote Sens. 2023, 15, 188. [Google Scholar] [CrossRef]
  20. Rana, S.K.; Chamoli, A. GRACE-derived groundwater variability and its resilience in north India: Impact of climatic and socioeconomic factors. Hydrol. Sci. J. 2024, 69, 2159–2171. [Google Scholar] [CrossRef]
  21. Shen, Y.; Zheng, W.; Zhu, H.; Yin, W.; Xu, A.; Pan, F.; Wang, Q.; Zhao, Y. Inverted Algorithm of Groundwater Storage Anomalies by Combining the GNSS, GRACE/GRACE-FO, and GLDAS: A Case Study in the North China Plain. Remote Sens. 2022, 14, 5683. [Google Scholar] [CrossRef]
  22. Yoshe, A.K. Water availability identification from GRACE dataset and GLDAS hydrological model over data-scarce river basins of Ethiopia. Hydrol. Sci. J. 2024, 69, 721–745. [Google Scholar] [CrossRef]
  23. Guo, Y.; Gan, F.; Yan, B.; Bai, J.; Xing, N.; Zhuo, Y. Evaluation of Terrestrial Water Storage Changes and Major Driving Factors Analysis in Inner Mongolia, China. Sensors 2022, 22, 9665. Available online: https://www.aminer.cn/pub/639738aa90e50fcafd8550a3 (accessed on 1 August 2025). [CrossRef] [PubMed]
  24. Guo, Y.; Xing, N.; Gan, F.; Yan, B.; Bai, J. Evaluating the Hydrological Components Contributions to Terrestrial Water Storage Changes in Inner Mongolia with Multiple Datasets. Sensors 2023, 23, 6452. Available online: https://www.aminer.cn/pub/64c5fc513fda6d7f0678d057 (accessed on 1 August 2025). [CrossRef] [PubMed]
  25. Wang, D.; Zhou, Y.; Wang, F. Decoupling Water Consumption from Economic Growth in Inner Mongolia, China. Water 2025, 17, 3073. [Google Scholar] [CrossRef]
  26. CMA Climate Change Centre. Blue Book on Climate Change in China; Science Press: Beijing, China, 2024. [Google Scholar]
  27. Save, H.; Bettadpur, S.; Tapley, B.D. High resolution CSR GRACE RL05 mascons. J. Geophys. Res. Solid Earth 2016, 121, 7547–7569. [Google Scholar] [CrossRef]
  28. Save, H. CSR GRACE and GRACE-FO RL06 Mascon Solutions v02; University of Texas at Austin: Austin, TX, USA, 2020. [Google Scholar] [CrossRef]
  29. Watkins, M.M.; Wiese, D.N.; Yuan, D.-N.; Boening, C.; Landerer, F.W. Improved methods for observing Earth’s time variable mass distribution with GRACE using spherical cap mascons. J. Geophys. Res. Solid Earth 2015, 120, 2648–2671. [Google Scholar] [CrossRef]
  30. Wiese, D.N.; Landerer, F.W.; Watkins, M.M. Quantifying and reducing leakage errors in the JPL RL05M GRACE mascon solution. Water Resour. Res. 2016, 52, 7490–7502. [Google Scholar] [CrossRef]
  31. Loomis, B.D.; Luthcke, S.B.; Sabaka, T.J. Regularization and error characterization of GRACE mascons. J. Geod. 2019, 93, 1381–1398. [Google Scholar] [CrossRef]
  32. Peltier, R.W.; Argus, D.F.; Drummond, R. Comment on “an assessment of the ICE-6G_C (VM5a) glacial isostatic adjustment model” by Purcell et al. J. Geophys. Res. Solid Earth 2018, 123, 2019–2028. [Google Scholar] [CrossRef]
  33. Landerer, F.W.; Flechtner, F.M.; Save, H.; Webb, F.H.; Bandikova, T.; Bertiger, W.I.; Bettadpur, S.V.; Byun, S.H.; Dahle, C.; Dobslaw, H.; et al. Extending the global mass change data record: GRACE Follow-On in-strument and science data performance. Geophys. Res. Lett. 2020, 47, e2020GL088306. [Google Scholar] [CrossRef]
  34. Landerer, F. Monthly Estimates of Degree-1 (Geocenter) Gravity Coefficients, Generated from GRACE (04-2002-06/2017) and GRACE-FO (06/2018 Onward) RL06 Solutions, GRACE Technical Note 13, The GRACE Project, NASA Jet Propulsion Laboratory. 2019. Available online: https://podaac-tools.jpl.nasa.gov/drive/files/allData/grace/docs (accessed on 1 August 2025).
  35. Beaudoing, H.; Rodell, M. NASA/GSFC/HSL 2020 GLDAS Noah Land Surface Model L4 monthly 1.0 × 1.0 degree V2.1, Greenbelt, Maryland, USA, Goddard Earth Sciences Data and Information Services Center (GES DISC). Available online: https://disc.gsfc.nasa.gov/datasets/GLDAS_NOAH10_M_2.1/summary (accessed on 4 April 2024).
  36. Li, B.; Beaudoing, H.; Rodell, M. NASA/GSFC/HSL 2020, GLDAS Catchment Land Surface Model L4 monthly 1.0 × 1.0 degree V2.1, Greenbelt, Maryland, USA, Goddard Earth Sciences Data and Information Services Center (GES DISC). Available online: https://disc.gsfc.nasa.gov/datasets/GLDAS_CLSM10_M_2.1/summary (accessed on 1 August 2025).
  37. Beaudoing, H.; Rodell, M. NASA/GSFC/HSL 2020, GLDAS VIC Land Surface Model L4 monthly 1.0 × 1.0 degree V2.1, Greenbelt, Maryland, USA, Goddard Earth Sciences Data and Information Services Center (GES DISC). Available online: https://disc.gsfc.nasa.gov/datasets/GLDAS_VIC10_M_2.1/summary (accessed on 1 August 2025).
  38. Rodell, M.; Houser, P.R.; Jambor, U.; Gottschalck, J.; Mitchell, K.; Meng, C.; Arsenault, K.; Cosgrove, B.; Radakovich, J.; Bosilovich, M.; et al. The Global Land Data Assimilation System. Bull. Am. Meteorol. Soc. 2004, 85, 381–394. [Google Scholar] [CrossRef]
  39. Feng, W.; Shum, C.K.; Zhong, M.; Pan, Y. Groundwater storage changes in China from satellite gravity: An overview. Remote Sens. 2018, 10, 674. [Google Scholar] [CrossRef]
  40. Yuan, X.; Zhou, Y.; Zhou, S.; Wang, F. Agricultural and energy sectors dominate Iran’s water crisis: A GRACE-GLDAS quantification (2002–2023). Acta Geodyn. Geomater. 2025, 22, 393–404. [Google Scholar] [CrossRef]
  41. Wang, F.; Zhou, Q.; Gao, H.; Wen, Y.; Zhou, S. Dynamic Monitoring of Poyang Lake Water Area and Storage Changes from 2002 to 2022 via Remote Sensing and Satellite Gravimetry Techniques. Remote Sens. 2024, 16, 2408. [Google Scholar] [CrossRef]
  42. Ding, Z. Groundwater Levels Continue to Rise in Ordos, Inner Mongolia. People’s Daily. 2025. Available online: https://slt.nmg.gov.cn/mobile/sldt_14620/mtzs_14629/202504/t20250409_2700124.html (accessed on 1 August 2025).
  43. Shangdu County People’s Government. Shangdu County: Bolsters Water Conservation Efforts, Groundwater Levels Rise Steadily. 2025. Available online: https://www.wulanchabu.gov.cn/qxdt/1721959.html (accessed on 1 August 2025).
  44. En, H.; Lian, Z. Chuo’er River and West Liao River Linked Up in 400-km Water Project After 2500 Days. 2025. Available online: https://www.nmg.gov.cn/zwyw/ymjnmg/202507/t20250709_2755885.html (accessed on 1 August 2025).
  45. Li, J. Chifeng City’s Hongshan District in Inner Mongolia Comprehensively Strengthens Groundwater Conservation through Extraction Control. 2025. Available online: https://slt.nmg.gov.cn/mobile/sldt_14620/msdt_14628/202501/t20250110_2651330.html (accessed on 1 August 2025).
  46. Su, N. Xilin Gol Grassland Restoration Breakthrough: From Desertification to Oasis in a Decade. 2025. Available online: https://baijiahao.baidu.com/s?id=1833384368955693330&wfr=spider&for=pc (accessed on 1 August 2025).
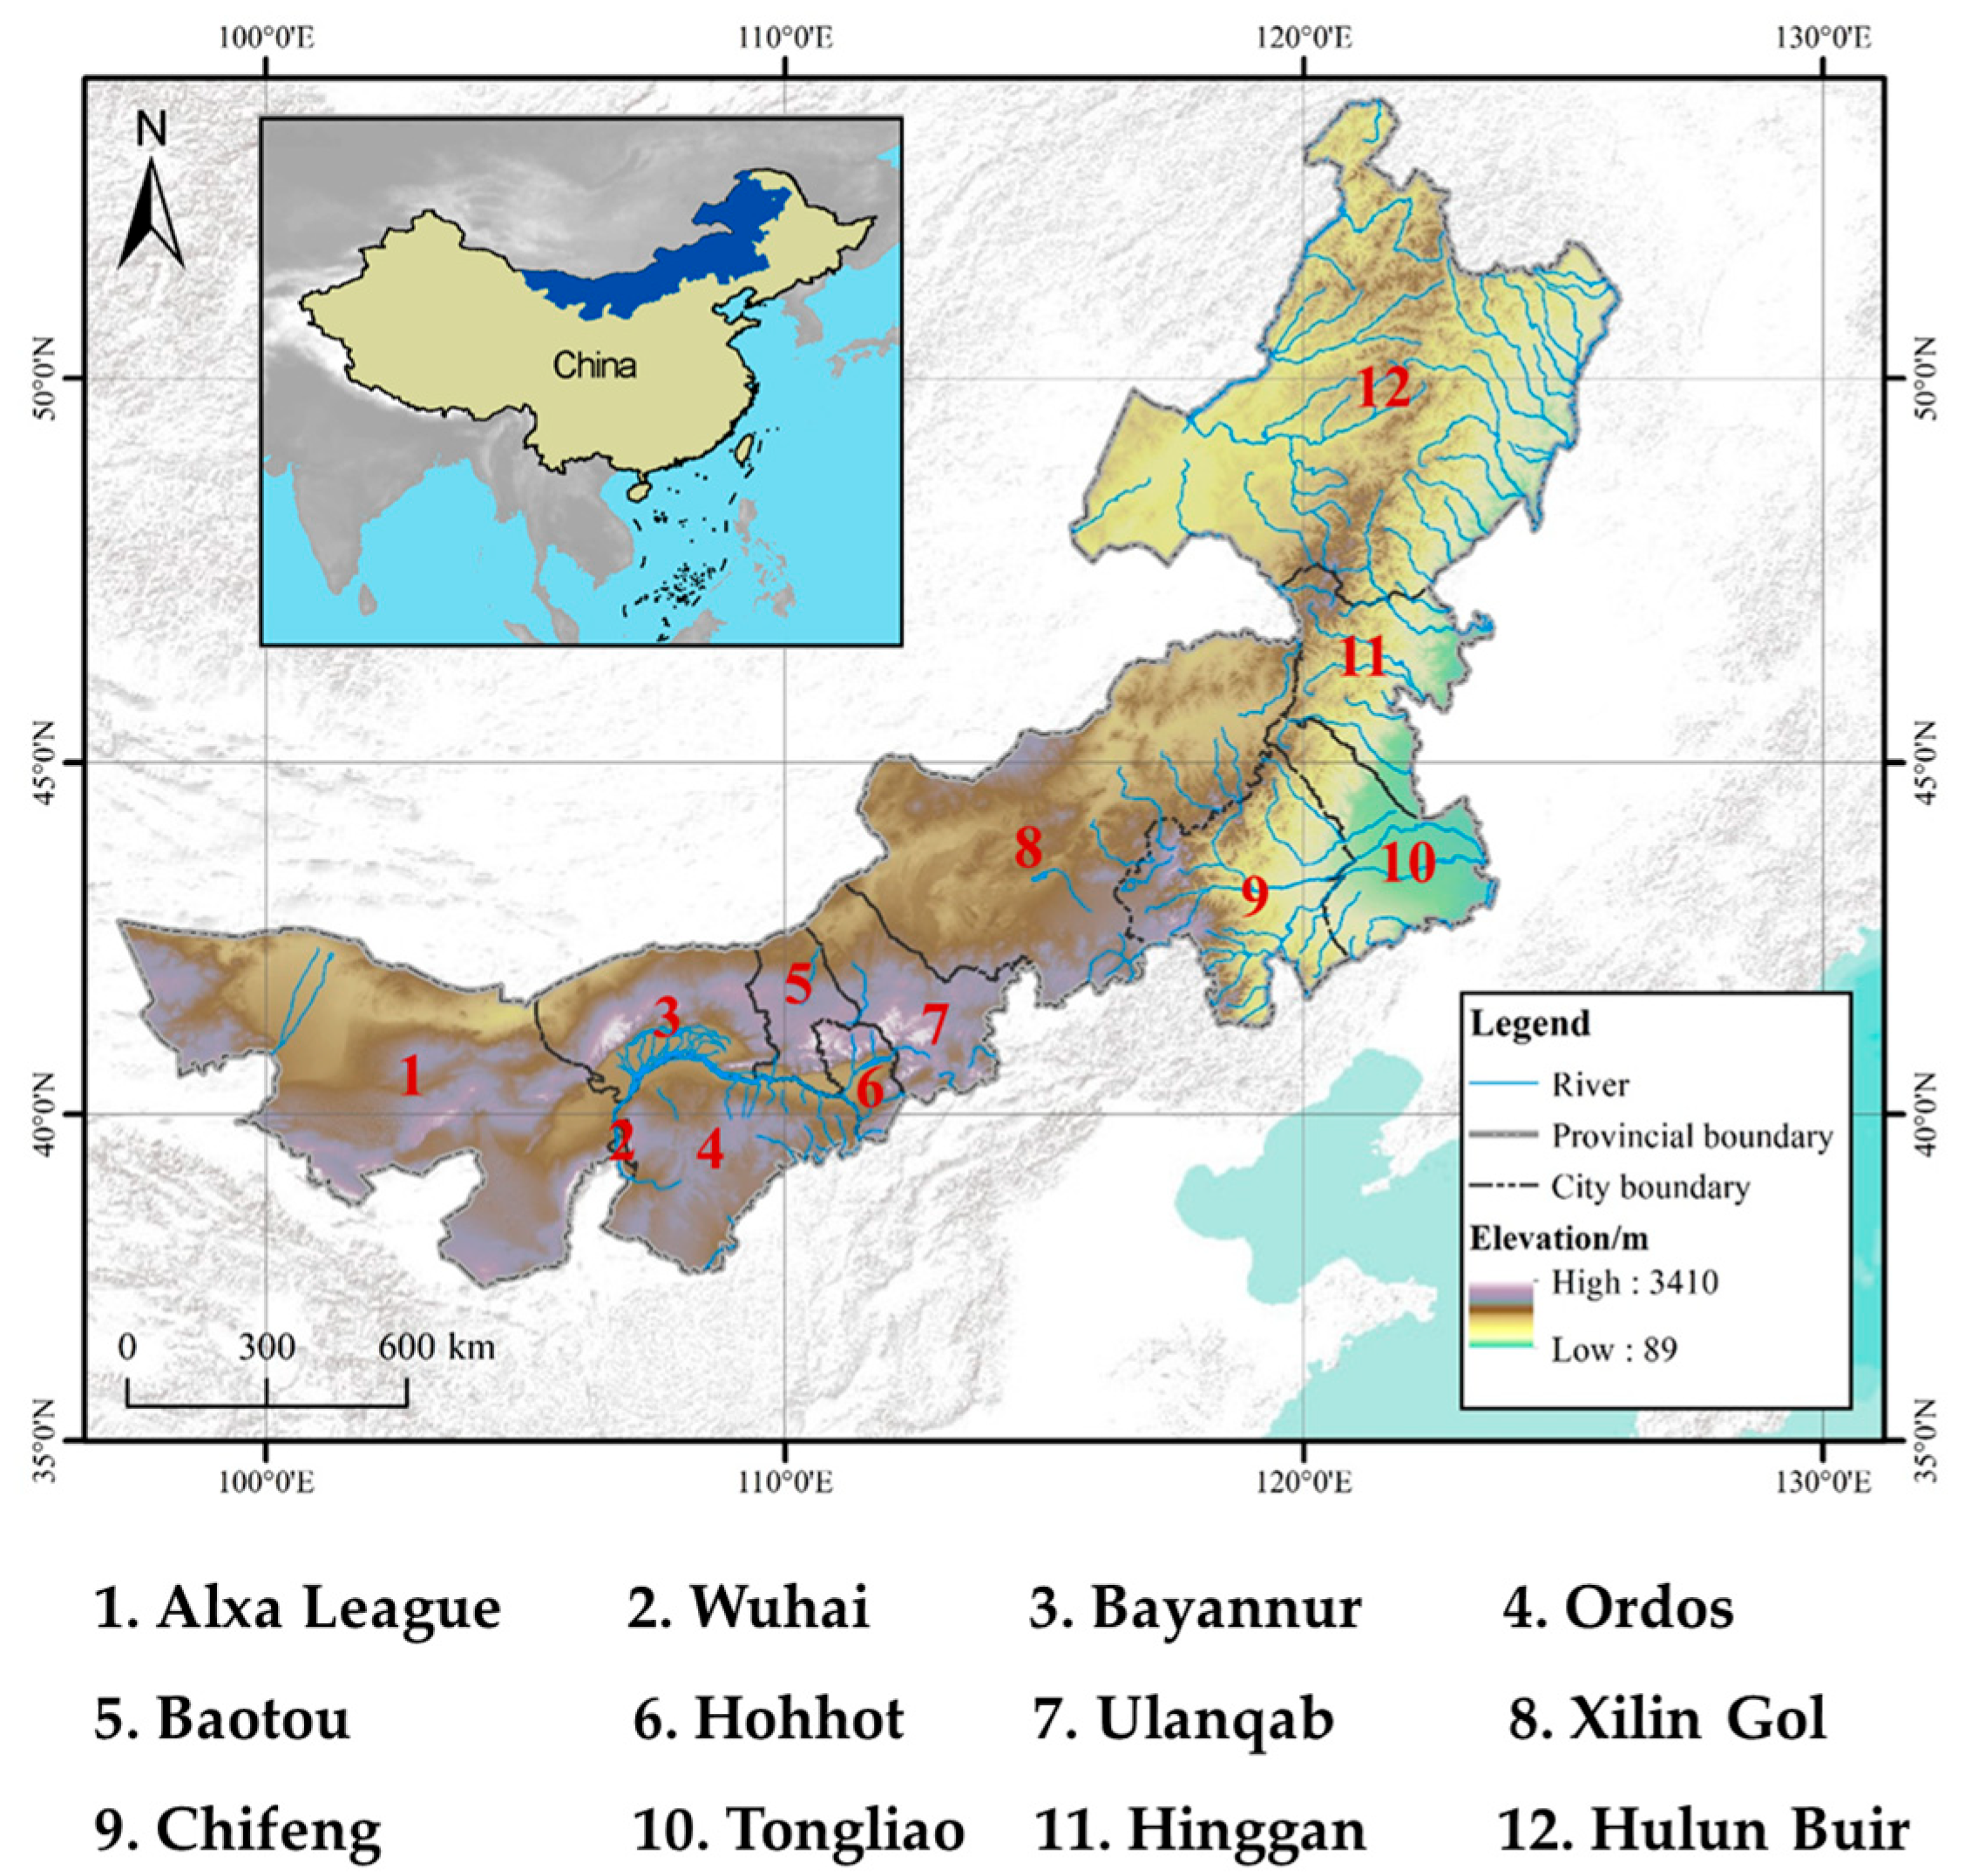
Figure 1. Study region of Inner Mongolia, revised from Wang et al. [25].
Remotesensing 17 03668 g001
Figure 2. (a) Estimated TWS changes derived from three GRACE/GRACE-FO mascon solutions (CSR, JPL, and GSFC), (b) SMS + SNWS + CWS from the GLDAS models (CLSM, NOAH and VIC), and (c) the derived GWS changes (three red lines represent the linear trends of three subperiods (2002.04~2007.09, 2007.10~2022.04, and 2022.05~2025.01) and (d) corresponding monthly mean climate indices (precipitation, evaporation, and runoff) for Inner Mongolia.
Remotesensing 17 03668 g002aRemotesensing 17 03668 g002b
Figure 3. Spatial distributions of TWS, SMS + SNWS + CWS, and GWS changes derived from GRACE/GRACE-FO mascon solutions and GLDAS models for the entire study period and three subperiods (2002.04~2007.09, 2007.10~2022.04, and 2022.05~2025.01).
Remotesensing 17 03668 g003
Figure 4. Spatial distributions of monthly mean precipitation, evaporation, and runoff for the entire study period and three subperiods (2002.04~2007.09, 2007.10~2022.04, and 2022.05~2025.01).
Remotesensing 17 03668 g004
Figure 5. Spatial distributions of the differences between monthly mean precipitation to remove evaporation and runoff for the entire study period and three subperiods (2002.04~2007.09, 2007.10~2022.04, and 2022.05~2025.01).
Remotesensing 17 03668 g005aRemotesensing 17 03668 g005b
Figure 6. Linear trend spatial distributions of TWS, SMS + SNWS + CWS, and GWS changes and the corresponding estimated results for the urban basin over the period from April 2002 to January 2025.
Remotesensing 17 03668 g006
Figure 7. The yearly precipitation, SW and GW resource quantity, and water supply of SW and GW sources in Inner Mongolia for the period from 2002 to 2024. Note. The three red dotted lines represent the linear trends of precipitation, GW and SW resource quanity, respectively.
Remotesensing 17 03668 g007
Figure 8. The yearly precipitation, SW and GW resource quantity, and water supply of SW and GW sources for 11 major cities in Inner Mongolia for the period from 2002 to 2024.
Remotesensing 17 03668 g008aRemotesensing 17 03668 g008bRemotesensing 17 03668 g008c
Figure 9. The water efficiency of Inner Mongolia and its twelve administrative divisions.
Remotesensing 17 03668 g009
Table 1. Amplitudes of annual and semiannual components and linear trends in regional water storage changes from GRACE/GRACE-FO and GLDAS models from April 2002 to January 2025.
TypeIndexAnnual Amplitude [mm] Phase [deg]Semiannual Amplitude [mm] Phase [deg]Linear Trend [mm/year]
TWS
GRACE/GRACE-FO
CSR[2.03 ± 1.52] [286.7 ± 42.4][2.74 ± 1.52] [95.3 ± 31.6]−1.49 ± 0.16
JPL[4.18 ± 1.76] [237.4 ± 24.4][3.39 ± 1.76] [100.3 ± 29.9]−1.09 ± 0.18
GSFC[0.93 ± 1.78] [287.0 ± 109.2][4.04 ± 1.78] [117.3 ± 25.3]−2.49 ± 0.18
Average[2.17 ± 1.63] [257.6 ± 42.7][3.34 ± 1.62] [105.7 ± 27.9]−1.69 ± 0.17
SMS + SNWS + CWS
GLDAS
CLSM[9.17 ± 1.48] [7.2 ± 9.3][3.15 ± 1.48] [103.7 ± 27.1]3.86 ± 0.15
NOAH[5.01 ± 1.72] [299.7 ± 19.7][2.34 ± 1.72] [127.8 ± 45.6]2.79 ± 0.18
VIC[7.18 ± 1.57] [110.2 ± 12.5][1.01 ± 1.57] [298.8 ± 89.4]2.80 ± 0.16
Average[3.26 ± 1.52] [21.3 ± 26.8][1.45 ± 1.52] [112.8 ± 60.1]3.15 ± 0.16
GWSGRACE/GRACE-FO
− GLDAS (Average)
[4.81 ± 1.21] [223.3 ± 7.3][1.91 ± 1.21] [100.3 ± 36.4]−4.84 ± 0.12
Note: The reported uncertainties correspond to the 1-sigma standard errors derived from least-squares spectral fitting applied to the estimated amplitudes, phases, and linear trends. SMS, SNWS, and CWS denote soil moisture storage, snow water storage, and canopy water storage changes, respectively.
Table 2. Annual and semiannual amplitudes and phases and linear trends in regional mean water storage changes from GRACE/GRACE-FO and GLDAS data for the period from April 2002 to January 2025.
TypeIndexAnnual Amplitude [mm] Phase [deg]Semiannual Amplitude [mm] Phase [deg]Linear Trend [mm/year]
Alxa LeagueTWS (GRACE/GRACE-FO)[1.81 ± 0.88] [207.0 ± 27.9][1.86 ± 0.86] [85.3 ± 27.3]−3.86 ± 0.09
SMS+SNWS+CWS (GLDAS)[2.50 ± 0.40] [296.1 ± 9.2][1.27 ± 0.40] [157.3 ± 18.1]0.09 ± 0.04
GWS
(GRACE/GRACE-FO−GLDAS)
[3.06 ± 0.80] [152.3 ± 15.1][1.90 ± 0.81] [45.8 ± 42.9]−3.95 ± 0.08
BayannurTWS (GRACE/GRACE-FO)[1.10 ± 1.25] [217.5 ± 62.5][2.15 ± 1.25] [76.6 ± 33.4]−4.80 ± 0.13
SMS+SNWS+CWS (GLDAS)[4.66 ± 1.06] [316.2 ± 5.1][2.19 ± 1.07] [176.4 ± 27.8]0.03 ± 0.11
GWS
(GRACE/GRACE-FO−GLDAS)
[4.94 ± 1.09] [148.9 ± 12.7][3.32 ± 1.10] [36.0 ± 18.5]−4.83 ± 0.11
OrdosTWS (GRACE/GRACE-FO)[4.82 ± 1.87] [1.8 ± 22.4][2.15 ± 1.88] [169.4 ± 49.9]−9.57 ± 0.19
SMS+SNWS+CWS (GLDAS)[9.79 ± 1.58] [315.7 ± 2.4][4.68 ± 1.58] [178.2 ± 19.3]0.63 ± 0.16
GWS
(GRACE/GRACE-FO−GLDAS)
[7.33 ± 1.84] [107.5 ± 14.3][2.58 ± 1.85] [5.4 ± 40.8]−10.20 ± 0.19
BaotouTWS (GRACE/GRACE-FO)[2.74 ± 1.63] [321.5 ± 31.8][2.70 ± 1.63] [110.3 ± 34.7]−5.88 ± 0.17
SMS+SNWS+CWS (GLDAS)[7.92 ± 1.76] [324.3 ± 12.5][3.34 ± 1.77] [169.4 ± 30.1]0.76 ± 0.18
GWS
(GRACE/GRACE-FO−GLDAS)
[5.18 ± 1.55] [145.7 ± 17.0][3.03 ± 1.55] [39.2 ± 26.8]−6.64 ± 0.16
HohhotTWS (GRACE/GRACE-FO)[6.42 ± 1.89] [341.6 ± 17.0][3.98 ± 1.90] [142.9 ± 26.4]−8.55 ± 0.20
SMS+SNWS+CWS (GLDAS)[8.29 ± 2.33] [349.7 ± 16.2][4.67 ± 2.34] [191.7 ± 28.6]1.30 ± 0.24
GWS
(GRACE/GRACE-FO−GLDAS)
[2.13 ± 2.08] [194.7 ± 56.5][3.62 ± 2.09] [67.3 ± 33.1]−9.85 ± 0.22
UlanqabTWS (GRACE/GRACE-FO)[4.22 ± 1.64] 327.5 ± 22.3][4.14 ± 1.64] [112.9 ± 22.8]−5.20 ± 0.17
SMS+SNWS+CWS (GLDAS)[5.62 ± 2.24] [333.5 ± 22.9][2.21 ± 2.25] [213.1 ± 58.0]2.24 ± 0.23
GWS
(GRACE/GRACE-FO−GLDAS)
[1.50 ± 1.96] [170.6 ± 75.5][5.03 ± 1.96] [87.3 ± 22.4]−7.44 ± 0.20
Xilin GolTWS (GRACE/GRACE-FO)[3.37 ± 1.87] [283.6 ± 31.6][4.62 ± 1.86] [88.9 ± 23.2]−1.29 ± 0.19
SMS+SNWS+CWS (GLDAS)[2.13 ± 2.00] [346.8 ± 54.1][1.33 ± 2.00] [64.9 ± 86.4]3.45 ± 0.21
GWS
(GRACE/GRACE-FO−GLDAS)
[3.07 ± 1.57] [245.3 ± 29.2][3.44 ± 1.56] [98.0 ± 26.1]−4.74 ± 0.16
ChifengTWS (GRACE/GRACE-FO)[8.29 ± 3.10] [266.8 ± 21.3][4.33 ± 3.09] [102.8 ± 41.0]−4.11 ± 0.32
SMS+SNWS+CWS (GLDAS)[12.60 ± 2.99] [259.9 ± 13.5][5.88 ± 2.98] [82.6 ± 29.1]4.40 ± 0.31
GWS
(GRACE/GRACE-FO−GLDAS)
[4.46 ± 2.13] [67.1 ± 27.2][2.35 ± 2.13] [223.2 ± 27.5]−8.51 ± 0.22
TongliaoTWS (GRACE/GRACE-FO)[13.30 ± 3.78] [249.0 ± 16.1][7.094 ± 3.76] [96.1 ± 30.5]−2.58 ± 0.39
SMS+SNWS+CWS (GLDAS)[11.30 ± 3.42] [259.2 ± 17.2][7.33 ± 3.40] [82.9 ± 26.7]5.69 ± 0.35
GWS
(GRACE/GRACE-FO−GLDAS)
[2.97 ± 2.47] [206.2 ± 47.9][1.68 ± 2.48] [187.4 ± 84.5]−8.27 ± 0.26
HingganTWS (GRACE/GRACE-FO)[9.55 ± 3.93] [244.3 ± 23.5][8.25 ± 3.91] [91.4 ± 27.3]5.05 ± 0.41
SMS+SNWS+CWS (GLDAS)[4.49 ± 4.28] [290.5 ± 54.4][4.82 ± 4.26] [104.6 ± 50.9]9.12 ± 0.44
GWS
(GRACE/GRACE-FO−GLDAS)
[7.22 ± 2.88] [217.6 ± 21.9][3.72 ± 2.88] [74.2 ± 44.5]−4.07 ± 0.30
Hulun BuirTWS (GRACE/GRACE-FO)[3.01 ± 3.56] [129.7 ± 78.2][3.46 ± 3.56] [136.0 ± 19.5]5.09 ± 3.69
SMS+SNWS+CWS (GLDAS)[11.30 ± 4.03] [51.2 ± 22.8][2.84 ± 4.04] [171.3 ± 81.0]6.10 ± 0.42
GWS
(GRACE/GRACE-FO−GLDAS)
[11.10 ± 1.88] [215.7 ± 9.6][2.00 ± 1.88] [80.6 ± 54.1]−1.01 ± 0.20
Table 3. Trends in TWS, GWS, water resource quantity, and water use series for the study period.
TypeTWSGWSWater Resource
2002–2024
Water Use
2022–2024
Alxa↓2002.4–2025.1↓2002.4–2025.1P↑; SW−; GW↓SW↓; GW↓
Bayannur↓2002.4–2025.1↓2002.4–2025.1P↑; SW↑; GW↓SW−; GW↑
Ordos↓2002.4–2025.1↓2002.4–2025.1P↑; SW↑; GW↑SW↓; GW↑
Baotou↓2002.4–2025.1↓2002.4–2025.1P↑; SW↓; GW↓SW↓; GW↓
Hohhot↓2002.4–2025.1↓2002.4–2025.1P↑; SW↓; GW↓SW↓; GW↑
Ulanqab↓2002.4–2025.1↓2002.4–2022.4
↑2022.5–2025.1
P↑; SW↓; GW↑SW↑; GW−
Xilin Gol↓2002.4–2025.1↓2002.4–2022.4
↑2022.5–2025.1
P↑; SW↑; GW↑SW−; GW↑
Chifeng↓2002.4–2025.1↓2002.4–2022.4
↑2022.5–2025.1
P↑; SW↑; GW↓SW↑; GW↓
Tongliao↓2002.4–2025.1↓2002.4–2022.4
↑2022.5–2025.1
P↑; SW↑; GW↑SW−; GW−
Hinggan↑2002.4–2025.1↓2002.4–2022.4
↑2022.5–2025.1
P↑; SW↑; GW↓SW↑; GW↓
Hulun Buir↑2002.4–2025.1↓2002.4–2022.4
↑2022.5–2025.1
P↑; SW↑; GW−SW↓; GW−
Note. “↑” represents an upward trend, “↓” represents a downward trend, and “–” represents no significant trend.
Disclaimer/Publisher’s Note: The statements, opinions and data contained in all publications are solely those of the individual author(s) and contributor(s) and not of MDPI and/or the editor(s). MDPI and/or the editor(s) disclaim responsibility for any injury to people or property resulting from any ideas, methods, instructions or products referred to in the content.