Article

Radiometric Cross-Calibration and Performance Analysis of HJ-2A/2B 16m-MSI Using Landsat-8/9 OLI with Spectral-Angle Difference Correction

1
China Centre for Resources Satellite Data and Application, Beijing 100094, China
2
Information Science and Technology College, Dalian Maritime University, Dalian 116026, China
*
Author to whom correspondence should be addressed.
Remote Sens. 2025, 17(21), 3569; https://doi.org/10.3390/rs17213569
Submission received: 5 August 2025 / Revised: 14 October 2025 / Accepted: 16 October 2025 / Published: 28 October 2025
(This article belongs to the Special Issue Remote Sensing Satellites Calibration and Validation: 2nd Edition)

Highlights

What are the main findings?
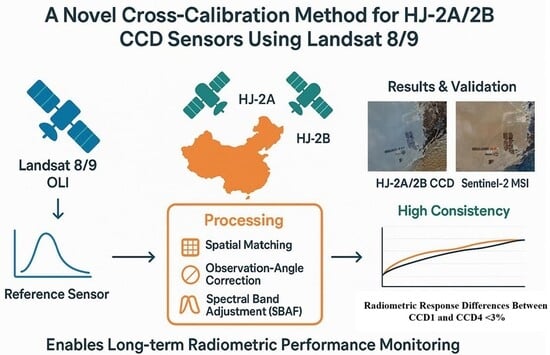
  • Developed a novel cross-calibration method for HJ-2A/2B, incorporating observation-angle and spectral band adjustment corrections.
  • Achieved high radiometric consistency, with cross-calibration results within 10% of official values and inter-sensor differences below 3%.
What are the implications of the main findings?
  • Enables frequent radiometric monitoring, overcoming the major limitation of traditional vicarious calibration.
  • Provides a reliable solution for long-term data quality assurance, enhancing the reliability of HJ-2A/2B data for environmental applications.

Abstract

The Huanjing-2A/2B (HJ-2A/2B) satellites are China’s next-generation environmental monitoring satellites, equipped with four visible light wide-swath charge-coupled device (CCD) sensors. These sensors enable the acquisition of 16-m multispectral imagery (16m-MSI) with a swath width of 800 km through field-of-view stitching. However, traditional vicarious calibration techniques are limited by their calibration frequency, making them insufficient for continuous monitoring requirements. To address this challenge, the present study proposes a spectral-angle difference correction-based cross-calibration approach, using the Landsat 8/9 Operational Land Imager (OLI) as the reference sensor to calibrate the HJ-2A/2B CCD sensors. This method improves both radiometric accuracy and temporal frequency. The study utilizes cloud-free image pairs of HJ-2A/2B CCD and Landsat 8/9 OLI, acquired simultaneously at the Dunhuang and Golmud calibration sites between 2021 and 2024, in combination with atmospheric parameters from the European Centre for Medium-Range Weather Forecasts (ECMWF) Reanalysis v5 (ERA5) dataset and historical ground-measured spectral reflectance data for cross-calibration. The methodology includes spatial matching and resampling of the image pairs, along with the identification of radiometrically stable homogeneous regions. To account for sensor viewing geometry differences, an observation-angle linear correction model is introduced. Spectral band adjustment factors (SBAFs) are also applied to correct for discrepancies in spectral response functions (SRFs) across sensors. Experimental results demonstrate that the cross-calibration coefficients differ by less than 10% compared to vicarious calibration results from the China Centre for Resources Satellite Data and Application (CRESDA). Additionally, using Sentinel-2 MSI as the reference sensor, the cross-calibration coefficients were independently validated through cross-validation. The results indicate that the radiometrically corrected HJ-2A/2B 16m-MSI CCD data, based on these coefficients, exhibit improved radiometric consistency with Sentinel-2 MSI observations. Further analysis shows that the cross-calibration method significantly enhances radiometric consistency across the HJ-2A/2B 16m-MSI CCD sensors, with radiometric response differences between CCD1 and CCD4 maintained below 3%. Error analysis quantifies the impact of atmospheric parameters and surface reflectance on calibration accuracy, with total uncertainty calculated. The proposed spectral-angle correction-based cross-calibration method not only improves calibration accuracy but also offers reliable technical support for long-term radiometric performance monitoring of the HJ-2A/2B 16m-MSI CCD sensors.

1. Introduction

On-orbit radiometric calibration is a fundamental aspect of the quantitative application of remote sensing [1], encompassing both relative and absolute calibration. The objective of absolute radiometric calibration is to derive calibration coefficients that convert raw digital number (DN) values into at-sensor radiance or reflectance for optical sensors, or brightness temperature (BT) for thermal infrared sensors [2]. The accuracy of radiometric calibration directly impacts the reliability of subsequent remote sensing applications, such as surface reflectance estimation and land vegetation parameter retrieval [3,4]. Current methods for on-orbit radiometric calibration of satellites primarily include on-board calibration, cross-calibration, and vicarious calibration. On-board radiometric calibration relies on integrated systems, such as internal lamps, solar diffusers, and other devices [5]. However, due to the technical complexity and high development costs, most medium- and high-resolution optical satellites in China are not equipped with on-board calibration systems [6,7]. Additionally, due to cost constraints, many commercial satellites and micro/nano-satellites, both domestic and international, also lack such systems [8]. Consequently, cross-calibration and vicarious calibration remain essential techniques for the on-orbit radiometric calibration of optical satellites [9]. Among these methods, vicarious calibration involves synchronizing ground and atmospheric parameter measurements during satellite overpasses of calibration sites, followed by simulating atmospheric radiative transfer to obtain reference radiance values at the satellite’s entrance aperture [10]. However, due to limitations such as site conditions, equipment costs, and labor requirements, vicarious calibration struggles to meet the demand for high-frequency satellite calibration and sensor performance evaluation [11]. In contrast, cross-calibration uses high-precision reference sensors to calibrate the target sensor, thereby eliminating the need for complex and resource-intensive ground-based synchronization experiments [12,13]. As a result, cross-calibration has become an essential technique for high-frequency radiometric calibration and lifecycle performance assessment of satellite sensors [14].
To assess on-orbit radiometric performance variations and ensure the radiometric consistency of optical satellite sensors, numerous studies have employed cross-calibration methods using highly radiometrically stable satellite sensors as references. These studies have achieved promising results in long-term performance analysis. For instance, Liu et al. conducted a long-term cross-calibration of the HJ-1A CCD1 sensor and examined its radiometric degradation over 12 years of on-orbit operation [15]. Wang et al. performed time-series radiometric cross-calibration for the GF-6 satellite using multiple calibration sites, confirming the reliability of cross-calibration and analyzing its long-term radiometric performance trends [16]. Angal et al. focused on cross-calibrating the Landsat-7 Enhanced Thematic Mapper Plus (ETM+) and Terra MODIS sensors in the Visible Near-Infrared (VNIR) spectral range using the Libya 4 pseudo-invariant calibration site, revealing an average percentage difference in intercepts ranging from −5% to 6% over long-term evaluations [17]. Yang et al. applied a cross-calibration method based on the bidirectional reflectance distribution function (BRDF) model for the GF-6 wide field-of-view (WFV) sensor using the Badain Jaran Desert site, demonstrating significantly improved calibration frequency and controlling cross-calibration relative errors within 5% [18]. Liu et al. proposed a BRDF correction method using time-series MODIS top-of-atmosphere (TOA) reflectance data to cross-calibrate the GF-1 PMS sensor over the Dunhuang and Golmud sites [19]. Gao et al. derived multi-temporal calibration coefficients for the CBERS-02B CCD sensor using MODIS as the reference sensor [20]. Teillet et al. developed a radiometric cross-calibration method for the solar reflective bands of Landsat-7 ETM+ and Landsat-5 Thematic Mapper (TM) sensors, validating the results through ground reference data analysis of tandem image pairs [21]. These cross-calibration studies underscore their effectiveness for high-frequency on-orbit calibration and long-term satellite sensor performance monitoring, while emphasizing the need to mitigate the impacts of temporal, spatial, spectral, and angular differences between reference and target sensors.
Building on previous efforts, increasing attention has been directed towards the Huanjing-2A/B (HJ-2A/2B) satellites, which represent China’s next-generation environmental monitoring systems [22]. These satellites are equipped with a 16-m multispectral imager (MSI) that features a unique design incorporating four charge-coupled device (CCD) sensors, whose fields of view are stitched together to achieve an 800 km swath width for Earth observation [23]. While this design offers significant advantages in ultra-wide coverage, it also presents challenges in maintaining radiometric consistency among the different CCDs following calibration. Currently, the China Centre for Resources Satellite Data and Application (CRESDA) uses vicarious calibration to independently calibrate each of the four CCD sensors, updating their calibration coefficients annually [24]. However, due to factors such as satellite orbital cycles, weather conditions, and the costs of labor and materials, the calibration frequency for the HJ-2A/2B 16m-MSI is difficult to increase [25]. As a result, routine assessments of radiometric performance variations and inter-CCD radiometric consistency have not been effectively conducted, potentially compromising the quantitative applications of data acquired by these sensors [26].
To address the need for radiometric performance analysis and inter-CCD radiometric consistency assessment of the HJ-2A/2B 16m-MSI, this study proposes a cross-calibration method incorporating spectral-angle difference correction. Using the Landsat-8/9 Operational Land Imager (OLI) as the reference sensor, we perform cross-calibration of the four CCD sensors on the HJ-2A/2B to derive long-term radiometric calibration coefficients. This study focuses on analyzing the long-term trends in radiometric response characteristics across the sensors and quantitatively evaluates their inter-CCD radiometric consistency, providing essential references for the quantitative application of satellite data. The analysis also investigates the impacts of spectral response differences among sensors on the cross-calibration results. Specifically, the effects of surface reflectance properties, aerosol optical depth (AOD), and water vapor content (WVC) on the spectral band adjustment factors (SBAFs) are examined. Additionally, an uncertainty analysis is conducted to identify the primary sources of error and quantify their contributions to the overall uncertainty in the cross-calibration process.
The structure of this paper is as follows: Section 2 provides a detailed description of the basic parameters of the reference and calibrated satellite sensors, the geographical characteristics of the study area, and the research datasets utilized. Section 3 elaborates on the proposed spectral-angle difference correction-based cross-calibration method, outlining a comprehensive technical workflow for the cross-calibration process. Section 4 presents an analysis of the cross-calibration results, validates the obtained cross-calibration coefficients, and conducts a systematic evaluation of the radiometric performance variations and inter-CCD radiometric consistency of the HJ-2A/2B 16m-MSI CCD sensors. In Section 5, the study investigates the influence of key environmental parameters, including surface reflectance properties, aerosol optical depth (AOD), and water vapor content (WVC), on the spectral band adjustment factor (SBAF), alongside a thorough uncertainty analysis of the critical factors affecting cross-calibration accuracy. Finally, Section 6 summarizes the key findings of this study and offers recommendations for future research directions.

2. Materials and Methods

2.1. Satellites

HJ-2A/2B: The HJ-2A/B satellites were successfully launched by China on 27 September 2020 from the Taiyuan Satellite Launch Center, Taiyuan, Shanxi province, China, aboard a Long March 4B carrier rocket in a dual-satellite configuration. Compared to their predecessor, the Huanjing-1A/B (HJ-1A/B), the HJ-2A/2B satellites exhibit significant improvements in data acquisition capabilities, technical performance, and remote sensing data accuracy. Both satellites are equipped with four types of remote sensing sensors: a 16-m multispectral imager (MSI), a hyperspectral imager, an infrared sensor, and an atmospheric correction instrument. These sensors provide 16-m MSI, 48-m hyperspectral images (HSI), and 48-m/96-m infrared images (IRS). The 16m-MSI consists of four visible-light charge-coupled device (CCD) sensors that achieve an 800-km swath width through field-of-view stitching. The four CCD sensors on the HJ-2A/2B share identical spectral ranges and spatial resolution, capturing multispectral images across five spectral bands: blue, green, red, near-infrared, and red edge. Currently, radiometric calibration for the HJ-2A/2B satellites is conducted by the China Centre for Resources Satellite Data and Application (CRESDA) through annual vicarious calibration, which uses synchronous ground observations at calibration sites to achieve high-precision radiometric calibration [27].
Landsat-8/9: Landsat-8/9 are Earth observation satellites jointly operated by the National Aeronautics and Space Administration (NASA) and the United States Geological Survey (USGS). Landsat-8 was launched on 11 February 2013, and Landsat-9 on 27 September 2021. These satellites play a pivotal role in global remote sensing and monitoring. The Operational Land Imager (OLI) onboard Landsat-8/9 is renowned for its exceptional absolute calibration accuracy, making it one of the most reliable and longest-running high-spatial-resolution Earth observation datasets. The OLI sensor is widely used in traditional remote sensing applications, including land surface parameter retrieval and land-use change monitoring. It features a swath width of 185 km and a spatial resolution of 30 m across nine spectral bands, which cover the visible, near-infrared, and shortwave infrared regions. To ensure radiometric calibration, Landsat-8/9 primarily employs onboard lamps, solar diffusers, lunar observations, and vicarious calibration techniques for the OLI sensor [28].
Given the high spectral similarity between the HJ-2A/2B CCD sensor and the Landsat-8/9 OLI sensor, this study selects four characteristic OLI bands (B2–B5) as reference benchmarks for cross-calibrating the corresponding bands of the HJ-2A/2B CCD sensor. The detailed specifications of the selected bands and the spectral response function curves for both the HJ-2A/2B CCD and Landsat-8/9 OLI sensors are presented in Table 1 and Figure 1.

2.2. Calibration Sites

This study selected the Dunhuang and Golmud test sites as the research areas for radiometric cross-calibration. Both sites are critical reference locations for the radiometric calibration of China’s remote sensing satellites. These sites offer significant advantages in terms of geographical characteristics, atmospheric conditions, and surface properties, making them highly suitable for high-precision radiometric cross-calibration [29].
The Dunhuang test site is China’s primary in-orbit radiometric calibration location for visible/near-infrared sensors. Since the late 1990s, it has been consistently used for calibrating Chinese satellites. Located 15 km west of Dunhuang City at coordinates 40.1°N and 94.4°E, with an elevation of 1253 m, the site features a large, approximately 30 km × 30 km flat and homogeneous area. The surface composition is predominantly gravel, sandstone fragments, and minor clay deposits. Figure 2 shows the geographical location of the Dunhuang test site, along with a false-color image captured by the HJ-2A CCD sensor.
The Golmud calibration site, another flat and homogeneous test field, is located 60 km west of Golmud City in Qinghai Province, China. Situated at geographical coordinates 36.38°N and 94.23°E, with an altitude of 2894 m, the Golmud site encompasses a uniform area of approximately 15 km × 15 km. Figure 2 displays the geographical location of the Golmud test site, along with a false-color image captured by the Landsat 9 OLI sensor.

2.3. Dataset

2.3.1. Image Data

High-quality cross-calibration image pairs are crucial for ensuring calibration accuracy, as they directly influence the precision of cross-calibration results, as well as the reliability and stability of the methodology. To maximize data availability, this study selects cloud-free, clear-sky image pairs acquired by the HJ-2A/2B CCD and Landsat-8/9 OLI during their same-day overpasses of the Dunhuang and Golmud calibration sites from 2021 to 2024. To minimize atmospheric effects, the temporal difference between the HJ-2A/2B CCD and Landsat-8/9 OLI acquisitions on the same day was constrained to within 70 min. This constraint ensures that the difference in solar zenith angles between the reference and calibrated sensors remains within approximately 15°, based on calculations considering the imaging times and geographical coordinates of the two calibration sites. Table 2 presents the statistical information of valid image pairs between the HJ-2A/2B CCD and Landsat-8/9 OLI sensors across different years.
The fundamental principle of cross-calibration technology relies on synchronous observations of the same ground target areas by two satellites within the same or closely matched time windows. Shorter temporal intervals between observations minimize variations in surface reflectance characteristics, atmospheric conditions, and illumination environments, thereby effectively preventing radiometric or geometric errors induced by temporal discrepancies. This synchronous or quasi-synchronous observation approach significantly reduces uncertainties introduced by spatiotemporal variations, consequently enhancing the reliability and accuracy of calibration results. Figure 3 statistically analyzes the temporal differences between HJ-2A/2B CCD and Landsat-8/9 OLI image acquisitions. The results demonstrate that CCD1 exhibits acquisition time differences of 50–60 min relative to the reference sensor, while CCD4 shows comparatively smaller temporal offsets of 30–40 min.
Due to differences in the orbital parameters of the HJ-2A/2B and Landsat-8/9 satellites, significant variations occur in their observational geometries for the same ground target. These geometric disparities lead to pronounced bidirectional reflectance distribution function (BRDF) effects, causing identical surface features to exhibit different reflectance characteristics under varying viewing angles. The BRDF effects introduce systematic errors that can compromise the accuracy of the cross-calibration results. Figure 4 illustrates the observational geometry parameters, including zenith and azimuth angles, for the HJ-2A/2B CCD and Landsat-8/9 OLI image pairs. These parametric differences are the primary factors driving the BRDF effects. The figure shows that CCD1 and CCD4 exhibit larger viewing zenith angles, while the reference satellite sensor maintains relatively stable observation angles, predominantly within 10 degrees.

2.3.2. Atmosphere Parameters

Water vapor content (WVC) and aerosol optical depth (AOD) are critical atmospheric parameters that influence the accuracy of radiometric cross-calibration. As the most significant absorbing medium in the atmosphere, water vapor exhibits strong absorption characteristics in the near-infrared and shortwave infrared bands, significantly affecting surface radiative transfer. AOD quantifies the scattering and absorption effects of aerosols, with particular sensitivity in the visible spectrum, especially at 550 nm. Consequently, WVC and AOD at 550 nm serve as fundamental parameters in the radiometric calibration process.
This study utilizes WVC and AOD data from the European Centre for Medium-Range Weather Forecasts (ECMWF) Reanalysis v5 (ERA5) dataset for the radiometric cross-calibration analysis [30].
Developed by the ECMWF and produced by the Copernicus Climate Change Service (C3S), ERA5 is a fifth-generation global climate reanalysis dataset that comprehensively documents global climate conditions from January 1950 to the present. The dataset provides hourly, high-precision estimates of various atmospheric, terrestrial, and oceanic climate variables. Based on the geographical coordinates of the Dunhuang and Golmud calibration sites, the study acquired WVC and AOD data for both locations from 2021 to 2024. Figure 5 presents the WVC measurements and 550 nm AOD data from these calibration sites used for the radiometric cross-calibration. Furthermore, to systematically quantify the impact of WVC and 550 nm AOD on the spectral band adjustment factor (SBAF), subsequent analysis employs sensitivity analysis methods, including controlled variable experiments for quantitative assessment.

2.3.3. Surface Reflectance

Unlike vicarious calibration techniques, radiometric cross-calibration does not rely on ground-synchronous surface reflectance measurements. Instead, it establishes radiative transfer relationships by applying consistent ground spectral reflectance data to simulate the spectral band adjustment factor (SBAF). As illustrated in Figure 6, this study utilizes historical ground-measured spectral reflectance data from both the Dunhuang and Golmud calibration sites [31,32]. Surface spectral data were collected using SVC spectrometers and whiteboards at these sites on 13 July 2024 and 17 July 2023, respectively, in the uniform Gobi Desert. Additionally, quantitative experimental assessments were conducted to systematically evaluate the influence of surface reflectance characteristics on the SBAF.

3. Methodology

3.1. The Process of Cross-Calibration Method

To address the challenges posed by spectral-radiometric characteristics and differences in observational geometry during radiometric cross-calibration, this study proposes a novel spectral-angle difference correction method. First, stringent spatiotemporal matching criteria are applied to select cloud-free, synchronous image pairs from the HJ-2A/2B CCD and Landsat-8/9 OLI over the calibration sites. This is followed by geometric registration and homogeneous pixel sampling. Second, an observation angle linear correction model is established using satellite geometric parameters, including solar zenith angle, view zenith angle, and relative azimuth angle, in combination with a BRDF model. This approach effectively eliminates radiometric biases induced by sensor viewing geometry differences. Subsequently, the spectral band adjustment factor (SBAF) is calculated through spectral response function convolution to precisely compensate for radiometric discrepancies arising from sensor-specific spectral response characteristics. Finally, high-precision cross-calibration coefficients are derived by correlating the corrected apparent radiance with the original sensor digital numbers (DN). This integrated workflow facilitates the synergistic correction of both observational geometry and spectral response differences, with the complete cross-calibration procedure illustrated in Figure 7.

3.1.1. Spatial Registration and Sampling

Due to the difference in spatial resolution between the HJ-2A/2B CCD sensor and the Landsat-8/9 OLI sensor, this study first applies the nearest neighbor resampling method to downscale the HJ-2A/2B CCD images, aligning their spatial resolution with that of the Landsat-8/9 OLI. This ensures consistency in data scale. Following this, rigorous image registration is performed to eliminate any geometric discrepancies.
A 30 × 30 pixel homogeneous region is then selected based on strict criteria, requiring the spatial coefficient of variation (CV) of pixel digital numbers (DN) to be less than 3%. This ensures stable surface coverage and spectral uniformity. The mean DN values of corresponding regions from both the HJ-2A/2B CCD and Landsat-8/9 OLI images are calculated separately and used as fundamental inputs for the subsequent cross-calibration computations.

3.1.2. Correction of Observation Angle Differences

This study develops an observation-angle linear correction model to address the bidirectional reflectance distribution function (BRDF) effects induced by geometric observation differences between the HJ-2A/2B CCD1/CCD4 sensors and the Landsat-8/9 OLI sensors. The methodology first employs a kernel-driven model to accurately characterize surface directional reflectance properties, effectively eliminating the influence of sensor observation geometry on surface reflectance. Subsequently, a linear correction model is established to describe the radiative transfer relationships between Landsat-8/9 OLI and HJ-2A/2B CCD1/CCD4. This is achieved by generating simulated radiance datasets under multiple aerosol optical depth (AOD) gradients, resulting in a physically consistent correction of radiometric biases caused by observation angle differences.
Using the RossThick-LiSparseR kernel-driven model, this study characterizes surface directional reflectance at both the Dunhuang and Golmud calibration sites. The BRDF expression is formulated as:
R ( θ i , θ r , Φ , λ ) = f i s o ( λ ) + f v o l ( λ ) K v o l ( θ i , θ r , Φ , ) + f g e o ( λ ) K g e o ( θ i , θ r , Φ , )
where θ i , θ r , and Φ represent the solar zenith angle, sensor view zenith angle, and relative azimuth angle, respectively; f i s o λ , f v o l λ , and f g e o λ denote the weighting coefficients for isotropic scattering, volume scattering, and geometric-optical scattering; K v o l and K g e o correspond to the volume scattering kernel and geometric-optical kernel, respectively; and λ indicates the wavelength.
The study systematically generates multiple sets of simulated radiance datasets under varying aerosol optical depth (AOD) conditions by inputting the bidirectional reflectance factor (BRF) values from both Landsat-8/9 OLI and HJ-2A/2B CCD into the radiative transfer model. This process produces comprehensive radiance datasets based on the following formula:
L λ H J ( τ i ) = F M O D T R A N ( B R F H J , τ i , Ω H J , R S R λ )
L λ L a n ( τ i ) = F M O D T R A N ( B R F L a n , τ i , Ω L a n , R S R λ )
where L λ H J ( τ i ) and L λ L a n ( τ i ) denote the radiance values for Landsat-8/9 OLI and HJ-2A/2B CCD, respectively; τ i = τ 0 ± 0.1 × i , i = 1,2 , 3 . . . 10 , τ 0 represents the AOD value at the satellite overpass time; Ω H J and Ω L a n specify the observational geometric parameters; F M O D T R A N refers to the MODTRAN radiative transfer model; and R S R λ indicates the spectral response function for each spectral band.
Based on the simulated radiance values L λ H J ( τ i ) and L λ L a n ( τ i ) obtained under different AOD conditions, this study establishes an observation-angle linear correction model as expressed in the following formula:
L λ H J = a × L λ L a n + b
where L λ H J and L λ L a n represent the simulated radiance values for each spectral band of HJ-2A/2B CCD and Landsat-8/9 OLI, respectively, and a and b denote the slope and intercept of the linear model for each spectral band.

3.1.3. Correction of Spectral Response Differences

The application of SBAF constitutes a critical step in cross-calibration between target and reference sensors, effectively eliminating discrepancies caused by spectral response differences. The procedure involves separately inputting the observational geometry, acquisition time, spectral response functions, and atmospheric parameters of both the sensor-to-be-calibrated and the reference sensor into the radiative transfer model. The SBAF is then calculated through division of the simulated results, as expressed in the following formula:
S B A F H J L a n = L λ H J ^ L λ L a n ^ = F M O D T R A N ( Ω H J , R S R λ H J ) F M O D T R A N ( Ω L a n , R S R λ L a n )
where S B A F H J L a n is the SBAF between HJ-2A/2B CCD and Landsat-8/9 OLI, and L λ H J ^ and L λ L a n ^ represent the simulated radiance values for each spectral band of HJ-2A/2B CCD and Landsat-8/9 OLI, respectively, as calculated by the MODTRAN radiative transfer model. R S R λ H J and R S R λ L a n denote the corresponding spectral response of HJ-2A/2B CCD and Landsat-8/9 OLI, respectively. The SBAF between HJ-2A/2B CCD and Landsat-8/9 OLI is shown in Figure 8.

3.1.4. Calculation of Cross-Calibration Coefficient

Radiometric calibration converts DN values into the corresponding radiance values for each pixel to eliminate systematic errors from the sensor. Typically, there is a linear relationship between the DN values of satellite sensors and radiance, which can be expressed by the following formula:
L λ = gain λ × D N λ + offse t λ
where gai n λ and offse t λ represent the calibration coefficients for each band, while L λ and D N λ denote the sensor’s radiance and image DN values, respectively.
Based on the calibration coefficients and DN values of Landsat-8/9 OLI, the radiance at the sensor can be calculated using the following formula:
L λ L a n ~ = g a i n λ L a n × D N λ L a n + o f f s e t λ L a n
where g a i n λ L a n and o f f s e t λ L a n represent the gain and offset of the calibration coefficients for each band of Landsat-8/9 OLI, and D N λ L a n is the DN value of the image.
The radiance of the HJ-2A/2B CCD sensor, corrected by the observation angle linear correction model, is calculated to account for differences caused by varying observation angles. The related formula is:
L λ H J ¯ = a × L λ L a n ~ + b
where L λ H J ¯ represents the apparent radiance of the HJ-2A/2B CCD sensor after correction by the angle linear correction model.
Next, the radiance of the HJ-2A/2B CCD sensor is adjusted using the SBAF to account for differences caused by spectral response. The related formula is:
L λ H J = S B A F × L λ H J ¯
where L λ H J represents the radiance of the HJ-2A/2B CCD sensor after correction by the S BAF.
Finally, the simulated radiance values L λ H J of the HJ-2A/2B CCD sensor and the DN values are fitted to calculate the cross-radiometric calibration coefficients, thereby achieving the calibration of the HJ-2A/2B CCD sensor.
L λ H J = g a i n λ H J × D N λ H J + o f f s e t λ H J
where g a i n λ H J is the gain of the cross-calibration coefficients for the HJ-2A/2B CCD sensor, o f f s e t λ H J is the offset, and D N λ H J represents the DN value of the HJ-2A/2B image. It should be noted that, since the HJ-2A/2B CCD sensor data preprocessing includes dark current correction, in this study, the intercept o f f s e t λ H J is set to zero, and the calibration slope g a i n λ H J is directly calculated from the DN values D N λ H J and at-sensor radiance L λ H J .

3.2. Analysis of Radiation Performance of HJ-2A/2B CCD

3.2.1. Time-Series Analysis

For the long-term radiometric performance evaluation of the HJ-2A/2B CCD sensors, this study employs a day-of-year (DOY)-based linear regression model for time-series analysis. The model establishes a linear relationship that describes the variation in calibration coefficients for each band with respect to the day of year. The formula is expressed as follows:
y λ = k λ × D o y + b λ
where y λ represents the linear model describing the variation in calibration coefficients for each band with DOY, and k λ and b λ denote the slope and intercept of the linear model for each band of the HJ-2A/2B CCD, respectively. The established linear model can reflect long-term trends in radiometric response, enabling the evaluation of annual variation rates and radiometric stability.

3.2.2. Annual Rate of Change Analysis

To further investigate the temporal variation trends of calibration coefficients for each band of the HJ-2A/2B CCD and systematically assess the radiometric response stability of the sensor, this study analyzes the interannual variation characteristics of the calibration coefficients by quantifying their annual change rates. The calculation formula is as follows:
YC R λ = k λ × 365
R Y C R λ = ( Y C R λ b λ ) × 100 %
where YC R λ denotes the annual variation amount of calibration coefficients for each band of HJ-2A/2B CCD, and R Y C R λ indicates the annual change rate of calibration coefficients for each band of HJ-2A/2B CCD.

3.3. Radiation Consistency Analysis of HJ-2A/2B CCD

To evaluate the radiometric response consistency among the four CCD sensors onboard the HJ-2A and HJ-2B satellites, this study proposes a systematic quantitative analysis method. As illustrated in Figure 9, the four sensors are arranged in a specific spatial configuration, enabling large-scale continuous observation through wide-swath stitching technology. Moreover, thanks to their nearly simultaneous overpass times and consistent observational geometries, these sensors provide an ideal foundation for radiometric consistency analysis.
To ensure radiometric consistency in the stitched images, this study focuses on three critical overlapping regions between sensors (CCD1–CCD2, CCD2–CCD3, and CCD3–CCD4). Multiple typical homogeneous regions are selected within each overlapping area, and the radiometric response consistency of the four CCD sensors is quantitatively evaluated by calculating the relative differences in radiance between corresponding pixels.
In the radiometric consistency analysis, the Mean Relative Difference (MRD) is used as the core quantitative metric to effectively characterize the radiometric response differences between any two CCD sensors. For the overlapping areas between any two sensors, the MRD is calculated as follows:
M R D m n λ = 1 N i = 1 N ( L m , i λ L n , i λ ( L m , i λ + L n , i λ ) / 2 × 100 % )
where M R D m n λ represents the mean relative difference in radiometric response between C C D m and C C D n across all spectral bands, L m , i λ and L n , i λ denote the radiance values calculated after cross-calibration for C C D m λ and C C D n λ , respectively; and N indicates the number of samples.

4. Result

4.1. Analysis of Cross-Calibration Results

Using the proposed spectral-angle difference correction-based cross-calibration method, this study calculated the cross-calibration coefficients between the HJ-2A/2B CCD and Landsat-8/9 OLI for the period from 2021 to 2024. These results were then compared with the official vicarious calibration coefficients for the HJ-2A/2B CCD, as published by the China Centre for Resources Satellite Data and Application (CRESDA) during the same timeframe. The relative error for each band of the HJ-2A CCD, based on this comparison, is presented in Figure 10.
R e l a t i v e   Error ( % ) = C c r o s s C v i c a r i o u s C v i c a r i o u s × 100 %
where C c r o s s and C v i c a r i o u s represent the cross-calibration coefficient and vicarious calibration coefficient.
The results show that the relative errors between the cross-calibration and vicarious calibration results from CRESDA are predominantly within 10%, with only a few exceptions exceeding this threshold. These deviations are primarily attributed to differences in satellite observation zenith angles between the HJ-2 CCD and Landsat-8/9 OLI. Although angular differences were corrected in this study, larger variations in the view zenith angle (VZA) can still contribute to some accumulation of calibration errors. Overall, the results strongly support the consistency between the cross-calibration method and the vicarious calibration results. Further analysis reveals that the CCD2 sensor of the HJ-2A satellite exhibits better stability and smaller fluctuations in deviation from the vicarious calibration results compared to the other sensors. Notably, after the systematic correction of observation angle differences, the calibration results remain closely aligned with the vicarious calibration coefficients, even when significant observational geometry differences exist between the HJ-2A/2B CCD2/CCD3 sensors and Landsat-8/9 OLI sensors. This not only confirms the effectiveness of the proposed spectral-angle difference correction cross-calibration method but also demonstrates the reliable accuracy and stability of the corrected cross-calibration results.
To further validate the accuracy of the radiometric cross-calibration coefficients between the HJ-2A/2B CCD sensors and the Landsat-8/9 OLI sensors, this study employed Sentinel-2 MSI sensors for cross-verification. Part of the European Space Agency’s (ESA) Copernicus program for global environmental and security monitoring, the Sentinel-2 mission consists of two satellites: Sentinel-2A, launched on 23 June 2015, and Sentinel-2B, launched on 7 March 2017 [33]. The primary payload of these satellites is the MSI, which features 13 spectral bands covering visible, near-infrared, and shortwave infrared wavelengths (400–2400 nm) [34]. With radiometric calibration based on ESA’s pre-launch laboratory calibration and onboard calibration system, the Sentinel-2 MSI demonstrates high accuracy and stability, making it an ideal reference for verifying the cross-calibration coefficients between the HJ-2A/2B CCD and Landsat-8/9 OLI [35,36].
This study compared the radiance values obtained from cross-calibrated HJ-2A/2B CCD data with Sentinel-2 MSI. This study examines multiple radiometrically stable and homogeneous regions, selected from synchronous observations of both Sentinel-2 MSI and HJ-2A/2B CCD at the Dunhuang calibration site. Radiance values for each HJ-2A/2B CCD sensor are calculated using both cross-calibration and vicarious calibration coefficients. The MRD is computed for each spectral band to quantify and assess the radiance consistency between the two datasets. The results are presented in Figure 11.
As shown in Figure 11, the Mean Relative Difference (MRD) between radiance values calculated using cross-calibration coefficients for HJ-2A/2B CCD and those derived from Sentinel-2 MSI calibration coefficients remains below 5% across all spectral bands. Comparative analysis reveals that discrepancies between the cross-calibration results and Sentinel-2 MSI radiance values are significantly smaller than those observed with vicarious calibration, indicating superior consistency between the cross-calibration outcomes and Sentinel-2 calibration references. Notably, the radiance differences between vicarious calibration results and Sentinel-2 MSI calibration references exhibit substantial fluctuations, with the MRD for the HJ-2B CCD2 sensor’s blue band exceeding 10%. This is likely due to the blue band’s heightened sensitivity to atmospheric scattering and aerosol effects in vicarious calibration. In contrast, radiance values calculated using cross-calibration coefficients demonstrate markedly better stability. These quantitative comparison results conclusively validate that the cross-calibration method provides superior accuracy and reliability for radiometric calibration applications of the HJ-2A/2B CCD sensors.

4.2. Analysis Results of Radiation Performance of HJ-2A/2B CCD

Based on the cross-calibration coefficients (i.e., the slope in the calibration equation), this study conducted a temporal analysis of the cross-calibration coefficients for each band of the HJ-2A/2B CCD sensors, with particular emphasis on their evolution patterns over the day of year (DOY). A radiometric response degradation trend model was then established for the HJ-2A/2B CCD sensors to systematically quantify the long-term variation characteristics of radiometric responses across all bands. The time-series analysis of cross-calibration coefficients for HJ-2A CCD1 is presented in Figure 12, while the corresponding time-series for HJ-2A CCD2–4 and HJ-2B CCD1–4 are provided in Appendix A.
As shown in Figure 12, the linear radiometric models of the cross-calibration coefficients for all bands of HJ-2A’s four CCD sensors exhibit clear linear trends. Specifically, the radiometric responses of each band primarily follow two variation patterns: either remaining stable or showing an increasing trend. Additionally, the different CCD sensors exhibit similar patterns of radiometric response variation across their respective bands. The established linear regression models facilitate long-term monitoring and evaluation of the radiometric performance of the HJ-2A/2B CCD sensors, offering essential support for analyzing the on-orbit performance degradation of satellite payloads.
To thoroughly assess the radiometric stability of the HJ-2A/2B CCD sensors, this study performed a quantitative analysis of the annual variation rates of the cross-calibration coefficients across all bands. As summarized in Table 3, the annual variation rates for the cross-calibration coefficients of all four bands in both the HJ-2A and HJ-2B CCD sensors remain relatively low. Notably, all bands of the HJ-2A/2B CCD1 sensors exhibit exceptional stability, with variation rates controlled within 1%. These quantitative results indicate that the radiometric responses of the HJ-2A/2B CCD sensors, derived from cross-calibration coefficients, maintain strong temporal stability.

4.3. Analysis Results of Radiation Consistency of HJ-2A/2B CCD

Radiometric consistency analysis is crucial for the reliable quantitative application of HJ-2A/2B CCD sensor remote sensing data. As a 16m-MSI system utilizing four CCDs for mosaic acquisition, maintaining high radiometric consistency among the individual CCD sensors is essential. Any discrepancies in the radiometric responses between different CCDs would result in radiance deviations for identical ground targets across CCD observations. Such systematic errors would directly undermine data reliability and the accuracy of subsequent quantitative applications.
The comparative analysis between the cross-calibration and vicarious calibration methods reveals the radiometric consistency characteristics of the HJ-2A CCD sensors, as illustrated in Figure 13. The results demonstrate that, compared to conventional vicarious calibration, cross-calibration significantly enhances the radiometric consistency of the HJ-2A CCD sensors. The data points are tightly clustered around the 1:1 reference line, indicating superior stability and uniformity. In terms of spectral band performance, the Green and NIR bands exhibit optimal radiometric consistency, while the Red band shows relatively greater dispersion. Notably, the vicarious calibration results reveal significant response differences between CCD2 and CCD3 in the Blue band, with multiple outliers deviating from the 1:1 reference line.
To further quantitatively assess the radiometric consistency of the HJ-2A CCD sensors, Table 4 presents a detailed analysis of the MRD metrics across overlapping CCD regions. The results indicate that cross-calibration significantly enhances consistency across all spectral bands, with all MRD values maintained within 3%, demonstrating excellent radiometric consistency. In contrast, vicarious calibration shows comparatively poorer performance in the Red band, where MRD values consistently exceed 2%, revealing notable deficiencies in radiometric consistency. The slightly larger MRD observed in the Red band is likely due to the broader spectral response function (SRF) of the HJ-2A/2B CCD Red band compared to the corresponding band of Landsat-8/9 OLI. Although SBAF corrections were applied, this SRF difference may contribute to residual discrepancies that are not fully eliminated. A comparative analysis of MRD metrics between the two calibration methods clearly shows that cross-calibration results in superior radiometric consistency for HJ-2A/2B CCD sensors. These findings provide essential data quality assurance for subsequent wide-swath image mosaicking and quantitative remote sensing applications.

5. Discussion

5.1. Analysis of the Impact of Spectral Response Difference Correction

5.1.1. The Impact of Atmosphere Parameters

This study systematically investigates the influence of atmospheric parameters, specifically the 550 nm aerosol optical depth (AOD) and water vapor content (WVC), on the Spectral Band Adjustment Factor (SBAF). To accurately assess the independent effects of AOD and WVC variations, a controlled variable approach was employed. Each parameter was adjusted within 25–175% of its original value, while keeping other atmospheric conditions constant. This methodology allowed for a quantitative analysis of the SBAF’s response to changes in AOD and WVC.
As shown in Figure 14a, three image pairs were analyzed to investigate the SBAF’s response to variations in AOD. The results reveal consistent SBAF behavior across all spectral bands within the tested AOD range (25–175%). Notably, the SBAF exhibits only minor fluctuations as AOD values increase, indicating that changes in AOD have a relatively limited effect on spectral band adjustments.
Water vapor, as the primary atmospheric absorber, exhibits significant absorption characteristics in the NIR and SWIR bands. To accurately assess the independent impact of WVC, this study systematically analyzes the SBAF’s response to variations in water vapor. Figure 14b presents the results from three image pairs, showing that SBAF remains largely insensitive to WVC changes in the visible bands, but exhibits noticeable variations in the NIR and SWIR bands. Specifically, SBAF demonstrates a gradual decrease as WVC increases in these infrared regions, which aligns with the physical mechanism of strong water vapor absorption in these spectral ranges.

5.1.2. The Impact of Surface Reflectance

The cross-calibration process does not rely on ground-synchronous surface reflectance measurements but instead uses historical surface reflectance data as input for radiative transfer modeling of both HJ-2A/2B CCD and Landsat-8/9 OLI systems. This study specifically investigates the impact of varying surface reflectance on the SBAF during cross-calibration. Five representative surface reflectance conditions were selected based on historical measurements at the Dunhuang site. The mean reflectance values from five distinct measurement times were used as inputs for the SBAF calculation for each spectral band. As shown in Figure 15a, the results indicate that the derived SBAFs remain highly consistent across different surface reflectance scenarios. Additionally, as illustrated in Figure 15b, the standard deviation is smallest in the Green band and largest in the NIR band. These findings confirm that historical surface reflectance data can effectively substitute for real-time ground measurements in cross-calibration tasks, while still maintaining the calibration accuracy required for practical applications.

5.2. Cross-Calibration Uncertainty Analysis

The analysis of the cross-calibration process between HJ-2A/2B CCD and Landsat-8/9 OLI reveals several key factors that influence the accuracy of calibration. These factors include: (1) the impact of image spatial registration accuracy; (2) residual errors in spectral difference correction; (3) uncertainty in observation angle difference correction; (4) radiation variations due to differences in observation times; (5) calibration uncertainty of the reference sensor; and (6) errors introduced by other contributing factors [37].
Spatial registration errors between geometrically corrected HJ-2A/2B CCD and Landsat-8/9 OLI images can affect the accuracy of cross-calibration. To quantify this uncertainty, a sliding window method was used to assess the impact of misalignment. By examining fluctuations in DN values across all sliding windows, the statistical analysis revealed that spatial registration introduces band-specific uncertainties: 0.18% (Blue), 0.19% (Green), 0.22% (Red), 0.23% (NIR), and 0.24% (SWIR), as summarized in Table 5.
Uncertainty in spectral difference correction arises primarily from two key factors: atmospheric conditions and surface reflectance. Quantitative analysis (Figure 14 and Figure 15) shows that AOD variations contribute 0.14–0.62% uncertainty across bands, while WVC fluctuations cause uncertainties ranging from 0.14% to 1.81%. Surface reflectance differences lead to uncertainties between 0.33% and 0.79%. Error propagation analysis yields a composite uncertainty range for spectral correction of 1.25–2.74%.
The uncertainty introduced by angular difference correction is mainly attributed to the accuracy of the semi-empirical BRDF model used for calibration at the Dunhuang and Golmud sites. This model was constructed by fitting multi-angle reflectance data. Validation at these sites revealed that the model-predicted values deviated from the measured values by 2.5–3%. Therefore, we conservatively estimate the uncertainty from angular difference correction to be approximately 3%.
The temporal discrepancy (30–60 min) between HJ-2A/2B CCD and Landsat 8/9 OLI acquisitions may introduce additional cross-calibration errors due to potential surface/atmospheric changes during this interval. Through correlation analysis of temporal offsets versus radiometric variations, this study conservatively estimates that observation time differences contribute approximately 0.5% uncertainty to the calibration process.
Inherent calibration uncertainties in Landsat-8/9 OLI (estimated at approximately 1% based on existing studies and calibration data) may also propagate into the cross-calibration results.
Other factors influencing calibration accuracy include assumptions about aerosol types in MODTRAN simulations and variations in Earth-Sun distance, which together are estimated to contribute an additional 1% uncertainty.
A comprehensive uncertainty analysis of the HJ-2A/2B CCD and Landsat-8/9 OLI cross-calibration process is provided in Table 5, summarizing the total error budget.

6. Conclusions

The HJ-2A/2B satellites represent China’s next-generation environmental monitoring platforms, equipped with a uniquely designed 16m-MSI that offers an expansive 800 km observation swath. While the China Centre for Resources Satellite Data and Application (CRESDA) has employed vicarious calibration techniques to independently calibrate the four CCD sensors, the limited frequency of these calibrations poses challenges for continuous monitoring. To address this, the present study leverages the high-precision Landsat-8/9 OLI sensor for cross-calibration of the HJ-2A/2B sensors, thereby enhancing both calibration accuracy and timeliness.
This study performs cross-calibration using cloud-free, simultaneous image pairs of HJ-2A/2B CCD and Landsat-8/9 OLI, acquired at the Dunhuang and Golmud calibration sites between 2021 and 2024. Atmospheric parameters, including water vapor content (WVC) and aerosol optical depth (AOD) from the ERA5 reanalysis dataset, as well as historical ground-measured spectral reflectance data, are also incorporated. The process begins with spatial matching and resampling of the image data, followed by the selection of radiometrically stable and homogeneous calibration areas. To account for sensor viewing angle differences, this study introduces an innovative linear correction model, establishing a radiative transfer relationship between Landsat-8/9 OLI and HJ-2A/2B CCD1/CCD4 sensors to correct radiometric deviations caused by observation angle discrepancies. Finally, spectral response differences between the HJ-2A/2B CCD and Landsat-8/9 OLI are effectively corrected by calculating the Spectral Band Adjustment Factors (SBAF).
The final cross-calibration coefficients obtained in this study show less than a 10% difference compared to the vicarious calibration results from CRESDA and applications. A systematic verification and analysis of the cross-calibration results indicate that, in comparison to traditional vicarious calibration coefficients, the cross-calibration coefficients derived here exhibit better consistency with radiance values observed by Sentinel-2 MSI. Building on these results, we further evaluated the interannual variations in the radiometric performance of the HJ-2A/2B CCD sensors and calculated their annual change rates. For the CCD field stitching characteristics of HJ-2A/2B, a quantitative analysis of radiometric consistency in overlapping areas between CCDs was conducted using the cross-calibration coefficients. The findings reveal that the cross-calibration results maintain radiometric response differences between CCD1 and CCD4 below 3%.
In the error analysis, this study examines the impact of atmospheric parameters (WVC, AOD) and surface reflectance on spectral response difference correction. It also evaluates the uncertainty introduced by the main factors affecting calibration accuracy during the cross-calibration process, yielding a total uncertainty range of 4.57% to 5.18%. The experiments demonstrate that the angle-spectral correction cross-calibration method proposed in this study not only significantly enhances calibration accuracy but also provides reliable technical support for the long-term radiometric performance monitoring of HJ-2A/2B CCD sensors.

Author Contributions

J.Z., H.Z. and Y.S. contributed to the research idea and analysis. Q.L., Q.H. and X.Z. contributed to suggestions on data analysis. X.W. and Z.X. wrote the paper. Z.H., X.D. and B.Y. contributed to the validation and paper revision. All authors have read and agreed to the published version of the manuscript.

Funding

This work is supported by the National Key Research and Development Program of China (Grant No. 2022YFB3903000, 2022YFB3903004).

Data Availability Statement

The original contributions presented in the study are included in the article; further inquiries can be directed to the corresponding author.

Conflicts of Interest

The authors declare no conflicts of interest.

Appendix A

Figure A1. Time-series analysis of cross-calibration coefficients for HJ-2A CCD.
Remotesensing 17 03569 g0a1
Figure A2. Time-series analysis of cross-calibration coefficients for HJ-2B CCD.
Remotesensing 17 03569 g0a2

References

  1. Thome, K.J. Absolute Radiometric Calibration of Landsat 7 ETM+ Using the Reflectance-Based Method. Remote Sens. Environ. 2001, 78, 27–38. [Google Scholar] [CrossRef]
  2. Sun, J.-Q.; Xiong, X.; Barnes, W.L.; Guenther, B. MODIS Reflective Solar Bands On-Orbit Lunar Calibration. IEEE Trans. Geosci. Remote Sens. 2007, 45, 2383–2393. [Google Scholar] [CrossRef]
  3. Zhao, E.; Qu, N.; Wang, Y.; Gao, C.; Zeng, J. TEBS: Temperature–Emissivity–Driven Band Selection for Thermal Infrared Hyperspectral Image Classification with Structured State-Space Model and Gated Attention. Int. J. Appl. Earth Obs. Geoinf. 2025, 142, 104710. [Google Scholar] [CrossRef]
  4. Zhao, E.; Qu, N.; Wang, Y.; Gao, C.; Duan, S.-B.; Zeng, J.; Zhang, Q. Thermal Infrared Hyperspectral Band Selection via Graph Neural Network for Land Surface Temperature Retrieval. IEEE Trans. Geosci. Remote Sens. 2024, 62, 5003414. [Google Scholar] [CrossRef]
  5. Ma, L.; Zhao, Y.; Li, W.; Yang, R.; Wang, R.; Wang, N.; Han, Q.; Lu, X.; Huang, F.; Zhao, J. Top-of-Atmosphere Radiometric Reference Model for Stable Land Sites with Relaxed Temporal Stability Requirements and Its Application to GF6/WFI Radiometric Calibration and Validation. Remote Sens. Environ. 2025, 326, 114796. [Google Scholar] [CrossRef]
  6. Zhao, Y.; Ma, L.; Li, C.; Gao, C.; Wang, N.; Tang, L. Radiometric Cross-Calibration of Landsat-8/OLI and GF-1/PMS Sensors Using an Instrumented Sand Site. IEEE J. Sel. Top. Appl. Earth Obs. Remote Sens. 2018, 11, 3822–3829. [Google Scholar] [CrossRef]
  7. Uncertainty Analysis for RadCalNet Instrumented Test Sites Using the Baotou Sites BTCN and BSCN as Examples. Available online: https://www.mdpi.com/2072-4292/12/11/1696 (accessed on 11 October 2025).
  8. On-Orbit Radiance Calibration of Nighttime Sensor of LuoJia1-01 Satellite Based on Lunar Observations. Available online: https://www.mdpi.com/2072-4292/11/18/2183 (accessed on 11 October 2025).
  9. Han, J.; Tao, Z.; Xie, Y.; Li, H.; Yi, H.; Guan, X. Validation of the TOA Products of the Baotou Sandy Site with Landsat8/OLI Considering BRDF Correction. IEEE Trans. Geosci. Remote Sens. 2023, 61, 5401611. [Google Scholar] [CrossRef]
  10. Cross-Calibration of HJ-1/CCD over a Desert Site Using Landsat ETM-Imagery and ASTER GDEM Product|IEEE Journals & Magazine|IEEE Xplore. Available online: https://ieeexplore.ieee.org/document/6779628 (accessed on 11 October 2025).
  11. Markham, B.L.; Helder, D.L. Forty-Year Calibrated Record of Earth-Reflected Radiance from Landsat: A Review. Remote Sens. Environ. 2012, 122, 30–40. [Google Scholar] [CrossRef]
  12. Cross-Calibration of GF-1/WFV over a Desert Site Using Landsat-8/OLI Imagery and ZY-3/TLC Data. Available online: https://www.mdpi.com/2072-4292/7/8/10763 (accessed on 11 October 2025).
  13. Operational BRDF Effects Correction for Wide-Field-of-View Optical Scanners (BREFCOR)|IEEE Journals & Magazine|IEEE Xplore. Available online: https://ieeexplore.ieee.org/document/6894143 (accessed on 11 October 2025).
  14. Xiong, X.; Sun, J.; Xie, X.; Barnes, W.L.; Salomonson, V.V. On-Orbit Calibration and Performance of Aqua MODIS Reflective Solar Bands. IEEE Trans. Geosci. Remote Sens. 2010, 48, 535–546. [Google Scholar] [CrossRef]
  15. Long-Term Cross Calibration of HJ-1A CCD1 and Terra MODIS Reflective Solar Bands|Scientific Reports. Available online: https://www.nature.com/articles/s41598-021-86619-y (accessed on 11 October 2025).
  16. Time-Series Cross-Radiometric Calibration and Validation of GF-6/WFV Using Multi-Site. Available online: https://www.mdpi.com/2072-4292/16/7/1287 (accessed on 11 October 2025).
  17. Multitemporal Cross-Calibration of the Terra MODIS and Landsat 7 ETM+ Reflective Solar Bands|IEEE Journals & Magazine|IEEE Xplore. Available online: https://ieeexplore.ieee.org/abstract/document/6459578 (accessed on 11 October 2025).
  18. Radiometric Cross-Calibration of the Wide Field View Camera Onboard GaoFen-6 in Multispectral Bands. Available online: https://www.mdpi.com/2072-4292/12/6/1037 (accessed on 11 October 2025).
  19. Liu, Q.; Yu, T.; Gao, H. Radiometric Cross-Calibration of GF-1 PMS Sensor with a New BRDF Model. Remote Sens. 2019, 11, 707. [Google Scholar] [CrossRef]
  20. Gao, C.; Jiang, X.; Li, X.; Li, X. The Cross-Calibration of CBERS-02B/CCD Visible-near Infrared Channels with Terra/MODIS Channels. Int. J. Remote Sens. 2013, 34, 3688–3698. [Google Scholar] [CrossRef]
  21. Radiometric Cross-Calibration of the Landsat-7 ETM+ and Landsat-5 TM Sensors Based on Tandem Data Sets. Remote Sens. Environ. 2001, 78, 39–54. [CrossRef]
  22. Lei, X.; Liu, Z.; Tao, F.; Hou, W.; Huang, H.; Xie, Y.; Zhao, X.; Dong, H.; Zou, P.; Song, M.; et al. Geolocation Error Estimation Method for the Wide Swath Polarized Scanning Atmospheric Corrector Onboard HJ-2 A/B Satellites. IEEE Trans. Geosci. Remote Sens. 2022, 60, 5626609. [Google Scholar] [CrossRef]
  23. Li, Z.; Xie, Y.; Hou, W.; Liu, Z.; Bai, Z.; Hong, J.; Ma, Y.; Huang, H.; Lei, X.; Sun, X.; et al. In-Orbit Test of the Polarized Scanning Atmospheric Corrector (PSAC) Onboard Chinese Environmental Protection and Disaster Monitoring Satellite Constellation HJ-2 A/B. IEEE Trans. Geosci. Remote Sens. 2022, 60, 4108217. [Google Scholar] [CrossRef]
  24. Zhang, H.; Qin, W.; Wang, K.; Wang, Q.; Tao, P. On-Orbit Geometric Calibration of the HJ-2 A/B Satellites’ Infrared Sensors. ISPRS Ann. Photogramm. Remote Sens. Spat. Inf. Sci. 2024, 10, 305–311. [Google Scholar] [CrossRef]
  25. Radiometric Calibration for HJ-1A Hyper-Spectrum Imager and Uncertainty Analysis|Request PDF. Available online: https://www.researchgate.net/publication/290289535_Radiometric_calibration_for_HJ-1A_hyper-spectrum_imager_and_uncertainty_analysis (accessed on 11 October 2025).
  26. The Application of Deep Convective Clouds in the Calibration and Response Monitoring of the Reflective Solar Bands of FY-3A/MERSI (Medium Resolution Spectral Imager). Available online: https://www.mdpi.com/2072-4292/5/12/6958 (accessed on 11 October 2025).
  27. Huang, H.; Wang, Y.; Liu, X.; Ti, R.; Sun, X.; Liu, Z.; Lei, X.; Lin, J.; Fan, L. Synchronous Atmospheric Correction of Wide-Swath and Wide-Field Remote Sensing Image from HJ-2A/B Satellite. Remote Sens. 2025, 17, 2072–4292. [Google Scholar] [CrossRef]
  28. Inter-Comparison of Landsat-8 and Landsat-9 During On-Orbit Initialization and Verification (OIV) Using Extended Pseudo Invariant Calibration Sites (EPICS): Advanced Methods. Available online: https://www.mdpi.com/2072-4292/15/9/2330 (accessed on 11 October 2025).
  29. Li, Y.; Bao, Y.; Jiang, K.; Wang, H.; Zhao, Y. On-Orbit Radiometric Calibration and Performance of GF-5A WTI. arXiv 2025. [Google Scholar] [CrossRef]
  30. Zhu, D.; Zhang, K.; Yang, L.; Wu, S.; Li, L. Evaluation and Calibration of MODIS Near-Infrared Precipitable Water Vapor over China Using GNSS Observations and ERA-5 Reanalysis Dataset. Remote Sens. 2021, 13, 2761. [Google Scholar] [CrossRef]
  31. Han, J.; Tao, Z.; Xie, Y.; Li, H.; Guan, X.; Yi, H. Radiometric Calibration of Large-View-Angle Satellite Sensor at Railroad Valley Playa Site Despite Incomplete RadCalNet Datasets. IEEE J. Sel. Top. Appl. Earth Obs. Remote Sens. 2025, 18, 24374–24384. [Google Scholar] [CrossRef]
  32. Hu, X.K.; Gao, H.L.; Cheng, T.H.; Tang, S.H.; Liu, L.; Liu, Q.Y. Site Selection and Evaluation of CHINA’S New Radiometric Calibration Test Sites. Int. Arch. Photogramm. Remote Sens. Spat. Inf. Sci. 2020, 42, 511–520. [Google Scholar] [CrossRef]
  33. Copernicus Sentinel-2A Calibration and Products Validation Status. Available online: https://www.mdpi.com/2072-4292/9/6/584 (accessed on 11 October 2025).
  34. Pla, M.; Bota, G.; Duane, A.; Balagué, J.; Curcó, A.; Gutiérrez, R.; Brotons, L. Calibrating Sentinel-2 Imagery with Multispectral UAV Derived Information to Quantify Damages in Mediterranean Rice Crops Caused by Western Swamphen (Porphyrio Porphyrio). Drones 2019, 3, 45. [Google Scholar] [CrossRef]
  35. A Global Analysis of Sentinel-2A, Sentinel-2B and Landsat-8 Data Revisit Intervals and Implications for Terrestrial Monitoring. Available online: https://www.mdpi.com/2072-4292/9/9/902 (accessed on 11 October 2025).
  36. Full Article: Sentinel-2A MSI and Landsat-8 OLI Radiometric Cross Comparison over Desert Sites. Available online: https://www.tandfonline.com/doi/full/10.1080/22797254.2018.1507613 (accessed on 11 October 2025).
  37. Liu, Y.-K.; Ma, L.-L.; Wang, N.; Qian, Y.-G.; Zhao, Y.-G.; Qiu, S.; Gao, C.-X.; Long, X.-X.; Li, C.-R. On-Orbit Radiometric Calibration of the Optical Sensors on-Board SuperView-1 Satellite Using Three Independent Methods. Opt. Express 2020, 28, 11085–11105. [Google Scholar] [CrossRef]
Figure 1. Spectral response functions for matched bands of HJ-2A/2B CCD and Landsat-8/9 OLI.
Remotesensing 17 03569 g001
Figure 2. Geographical location information of Dunhuang calibration site and Golmud calibration site. (a) the image of Dunhuang site; (b) the image of Golmud site.
Remotesensing 17 03569 g002
Figure 3. Time difference between HJ-2A/2B CCD and Landsat-8/9 OLI imaging: (a) in the HJ-2A CCD, (b) in the HJ-2B CCD.
Remotesensing 17 03569 g003
Figure 4. Distribution of geometric parameters observed by HJ-2A/2B CCD and Landsat-8/9 OLI: (a) in the HJ-2A CCD, (b) in the HJ-2B CCD.
Remotesensing 17 03569 g004
Figure 5. WVC and 550 nm AOD data from Dunhuang and Golmud calibration sites: (a) in the Dunhuang calibration site, (b) in the Golmud calibration site.
Remotesensing 17 03569 g005
Figure 6. Surface spectral reflectance data and location (marked by red rectangle) of calibration site: (a) in the Dunhuang calibration site (b) in the Golmud calibration site.
Remotesensing 17 03569 g006
Figure 7. Flowchart of the spectral-angle corrected cross-calibration method.
Remotesensing 17 03569 g007
Figure 8. SBAF between HJ-2A CCD (a), HJ-2B CCD (b) and Landsat-8/9.
Remotesensing 17 03569 g008
Figure 9. Wide-swath mosaic image from HJ-2A/2B CCD sensors.
Remotesensing 17 03569 g009
Figure 10. Relative errors between cross-calibration coefficients and vicarious calibration coefficients of HJ-2A CCD: (a) in the HJ-2A CCD1, (b) in the HJ-2A CCD2, (c) in the HJ-2A CCD3, (d) in the HJ-2A CCD4.
Remotesensing 17 03569 g010
Figure 11. Comparison of radiance differences between HJ-2A/2B CCD and Sentinel-2 MSI: (a) in the HJ-2A CCD1, (b) in the HJ-2A CCD4, (c) in the HJ-2B CCD2, (d) in the HJ-2B CCD4.
Remotesensing 17 03569 g011
Figure 12. Time-series analysis of cross-calibration coefficients for HJ-2A/2B CCD.
Remotesensing 17 03569 g012
Figure 13. Radiometric consistency analysis of HJ-2A CCD sensor: (a) in the blue band, (b) in the green band, (c) in the red band, (d) in the NIR band.
Remotesensing 17 03569 g013
Figure 14. Influence of atmospheric parameters on SBAF: (a) in the AOD, (b) in the WVC.
Remotesensing 17 03569 g014
Figure 15. Influence of surface reflectance on SBAF. (a) The SBAFs calculated using different surface reflectance. (b) The statistical information of calculated SBAFs using different surface reflectance.
Remotesensing 17 03569 g015
Table 1. Spectral ranges of HJ-2A/2B CCD and Landsat-8/9 OLI.
Spectral BandHJ-2A/2B CCDLandsat-8/9 OLI
Band No.Spectral Range (nm)Band No.Spectral Range (nm)
Blue1430–5202450–510
Green2520–6003530–590
Red3630–6904640–670
NIR4760–9005850–880
Table 2. Number of HJ-2A/2B CCD and Landsat-8/9 OLI image pairs from 2021 to 2024.
SensorLandsat-8 OLILandsat-9 OLITotal
20212022202320242021202220232024
HJ-2A CCD11413025319
HJ-2A CCD2121102209
HJ-2A CCD32013031313
HJ-2A CCD42103032112
HJ-2B CCD11113043215
HJ-2B CCD21113132113
HJ-2B CCD32250040013
HJ-2B CCD40122024112
Table 3. Annual variation rates of cross-calibration coefficients for HJ-2A/2B CCD sensors.
HJ-2AHJ-2B
SensorCCD1CCD2CCD3CCD4CCD1CCD2CCD3CCD4
Band10.37%1.30%0.13%2.9%0.80%1.25%1.75%0.88%
Band20.55%1.53%−0.48%1.61%0.77%1.06%0.57%0.61%
Band30.67%0.49%−0.85%1.57%0.47%1.45%0.97%−1.39%
Band40.78%0.48%−0.80%0.63%0.03%1.10%−0.09%−1.24%
Table 4. MRD statistical results of overlapping areas for HJ-2A CCD sensor.
Cross-CalibrationVicarious Calibration
BandCCD1–CCD2CCD2–CCD3CCD3–CCD4CCD1–CCD2CCD2–CCD3CCD3–CCD4
Blue1.55%0.33%0.66%2.60%2.00%2.49%
Green1.16%0.28%0.81%2.28%0.48%2.77%
Red1.92%2.36%1.68%2.87%4.92%3.57%
NIR1.68%2.33%0.85%1.72%4.17%1.19%
Table 5. Uncertainty analysis of cross-calibration results.
Error SourcesBlueGreenRedNIR
Spatial Differences0.18%0.21%0.19%0.24%
Spectral Difference Correction1.89%1.37%1.25%2.74%
Angular Difference Correction3.00%3.00%3.00%3.00%
Temporal Variability0.50%0.50%0.50%0.50%
Uncertainty of Reference Satellite3.00%3.00%3.00%3.00%
Other Uncertainties1.00%1.00%1.00%1.00%
Combined uncertainty (k = 1)4.78%4.60%4.57%5.18%
Disclaimer/Publisher’s Note: The statements, opinions and data contained in all publications are solely those of the individual author(s) and contributor(s) and not of MDPI and/or the editor(s). MDPI and/or the editor(s) disclaim responsibility for any injury to people or property resulting from any ideas, methods, instructions or products referred to in the content.

