Article

A Unified Fusion Framework with Robust LSA for Multi-Source InSAR Displacement Monitoring

1
Tianjin North China Geological Exploration General Institute, Tianjin 300170, China
2
School of Geodesy and Geomatics, Wuhan University, Wuhan 430079, China
3
Tianjin North China Geological Exploration General Institute Limited Company, Tianjin 300170, China
*
Author to whom correspondence should be addressed.
Remote Sens. 2025, 17(20), 3469; https://doi.org/10.3390/rs17203469
Submission received: 17 August 2025 / Revised: 12 October 2025 / Accepted: 13 October 2025 / Published: 17 October 2025
(This article belongs to the Special Issue Applications of Radar Remote Sensing in Earth Observation)

Highlights

What are the main findings?
  • A Practical Framework for Robust InSAR Fusion: This study provides a practical, systematic workflow that integrates multi-temporal InSAR processing, homonymous Persistent Scatterer (PS) generation, and robust Least Squares Adjustment (LSA). It offers a directly applicable solution for enhancing the reliability of displacement monitoring in the case of a small number of SAR datasets.
  • Theoretical Foundation for Multi-Source InSAR Data Reliability: The paper establishes a mathematical foundation for multi-source InSAR fusion incorporating formal reliability parameters (internal and external). This provides a theoretical benchmark for evaluating and improving the integrity of fused datasets, moving beyond simple data combination to statistically robust integration.
What is the implication of the main finding?
  • Effective Gross Error Identification: The proposed robust LSA framework successfully identified and eliminated gross errors from 11.1% of homonymous PS sets, significantly cleansing multi-source InSAR data contaminated by phase unwrapping failures.
  • Enhanced Displacement Monitoring Accuracy: Validation with high-precision leveling data showed the framework achieves a vertical displacement estimation accuracy of 5.7 mm/yr. A localized analysis incorporating both leveling validation and time series in a challenging area demonstrated a 42.5% improvement in accuracy compared to traditional Ordinary Least Squares (OLS) methods.

Abstract

Time-series Interferometric Synthetic Aperture Radar (InSAR) techniques encounter substantial reliability challenges, primarily due to the presence of gross errors arising from phase unwrapping failures. These errors propagate through the processing chain and adversely affect displacement estimation accuracy, particularly in the case of a small number of SAR datasets. This study presents a unified data fusion framework designed to enhance the detection of gross errors in multi-source InSAR observations, incorporating a robust Least Squares Adjustment (LSA) methodology. The proposed framework develops a comprehensive mathematical model that integrates the fusion of multi-source InSAR data with robust LSA analysis, thereby establishing a theoretical foundation for the integration of heterogeneous datasets. Then, a systematic, reliability-driven data fusion workflow with robust LSA is developed, which synergistically combines Multi-Temporal InSAR (MT-InSAR) processing, homonymous Persistent Scatterer (PS) set generation, and iterative Baarda’s data snooping based on statistical hypothesis testing. This workflow facilitates the concurrent localization of gross errors and optimization of displacement parameters within the fusion process. Finally, the framework is rigorously evaluated using datasets from Radarsat-2 and two Sentinel-1 acquisition campaigns over the Tianjin Binhai New Area, China. Experimental results indicate that gross errors were successfully identified and removed from 11.1% of the homonymous PS sets. Following the robust LSA application, vertical displacement estimates exhibited a Root Mean Square Error (RMSE) of 5.7 mm/yr when compared to high-precision leveling data. Furthermore, a localized analysis incorporating both leveling validation and time series comparison was conducted in the Airport Economic Zone, revealing a substantial 42.5% improvement in accuracy compared to traditional Ordinary Least Squares (OLS) methodologies. Reliability assessments further demonstrate that the integration of multiple InSAR datasets significantly enhances both internal and external reliability metrics compared to single-source analyses. This study underscores the efficacy of the proposed framework in mitigating errors induced by phase unwrapping inaccuracies, thereby enhancing the robustness and credibility of InSAR-derived displacement measurements.

Graphical Abstract

1. Introduction

Interferometric Synthetic Aperture Radar (InSAR), particularly time-series techniques such as Persistent Scatterer InSAR (PSI) and Small Baseline Subset (SBAS), has substantially enhanced the field of geodetic monitoring by facilitating precise, millimeter- to centimeter-scale measurements of surface displacements across extensive spatial domains [1,2,3,4,5]. The distinctive attributes of InSAR—namely its broad spatial coverage, high measurement precision, and non-invasive operational characteristics—have established it as an essential tool in a wide range of applications, including the assessment of urban displacement [6,7], the monitoring of infrastructure integrity [8,9], the detection of landslides [10,11], and the analysis of displacement induced by mining activities [12,13,14].
Despite significant advancements in time-series InSAR (TS-InSAR) methodologies, conventional techniques continue to encounter persistent challenges that hinder their reliability in complex and long-term monitoring applications. Among the most critical issues are phase unwrapping errors, which may introduce substantial uncertainties into the estimation of surface displacements, especially in the case of a small number of SAR datasets [15,16]. Notably, phase unwrapping errors—particularly in regions characterized by low coherence or steep displacement gradients—remain notoriously difficult to fully automate or correct [17,18]. Furthermore, datasets derived from single-sensor or single-track acquisitions are often constrained by limitations in viewing geometry, spatiotemporal baseline continuity, and insufficient capabilities for error correction [18,19].
To overcome these limitations, the integration of multi-source InSAR data—encompassing datasets from multiple sensors and orbital tracks—has emerged as a pivotal research direction. Recent studies have highlighted the potential of this approach. Jiang et al. [20] integrated COSMO-SkyMed, TerraSAR-X, and Sentinel-1 data through the combined application of the Power Exponential Knothe Model (PEKM) algorithm and Long Short-Term Memory (LSTM) networks, enabling decadal-scale displacement monitoring in Wuhan. Zhang et al. [21] achieved 30-year seamless displacement records in Beijing by implementing a multi-sensor, multi-track, and multi-temporal Synthetic Aperture Radar (SAR) interferometry data integration algorithm that ensures seamless connectivity between ERS/ENVISAT and TerraSAR-X/Sentinel-1 datasets. Chen et al. [22] employed a fusion of ENVISAT ASAR and TerraSAR-X data to quantify displacement drivers along the Beijing-Tianjin High Speed Railway. Furthermore, Fuhrmann and Garthwaite [23] introduced a methodology for the fusion of Line-of-Sight (LOS) InSAR measurements derived from multiple viewing geometries, employing both simulated and observed displacement phenomena from Envisat datasets.
Existing InSAR fusion frameworks predominantly rely on traditional Ordinary Least Squares (OLS) methods, which often fail to adequately address the issue of gross errors in the case of small SAR datasets. However, these gross errors frequently stem from phase unwrapping failures, maybe lead to significant distortions in displacement rates and subsequent misinterpretations of the underlying geophysical processes [16,19]. Notably, there is a scarcity of effective robust Least Squares Adjustment (LSA) methods specifically tailored for InSAR data fusion. This critical gap poses considerable challenges to the operational effectiveness of InSAR technologies, particularly in safety-critical applications such as the precise monitoring and prevention of regional ground displacement [19,24]. Therefore, further research and development of robust LSA frameworks are essential to enhance the reliability and accuracy of InSAR-derived measurements.
This study implements a robust LSA method and framework designed specifically for the fusion of multi-source InSAR data, aimed at addressing the challenges posed by gross error data. The principal contributions of this research are delineated as follows: (i) A comprehensive mathematical model is established for the fusion and robust LSA analysis of multi-source InSAR datasets. This model encompasses both internal and external reliability indicators, thereby providing a theoretical basis for the efficient integration of heterogeneous data. (ii) A reliability-driven data fusion workflow with robust LSA is developed that systematically integrates multi-temporal InSAR (MT-InSAR) processing, the creation of homonymous Persistent Scatterer (PS) sets, and an iterative Baarda’s data snooping analysis. This workflow facilitates simultaneous gross error localization and displacement parameter optimization, consequently enhancing the reliability of the data fusion process. (iii) The validity of the proposed framework is assessed utilizing Radarsat-2 and Sentinel-1 datasets from the study area located in Tianjin Binhai New Area. The results indicate an elimination rate of gross errors by 11.1% and a root mean square error (RMSE) of 5.7 mm/year, alongside improved accuracy within the local area and time series, thereby confirming the efficacy of the proposed method.

2. Study Area and Data Description

2.1. Study Area

The present study is conducted in the Binhai New Area, Tianjin, China (Figure 1), a rapidly urbanizing coastal region that has experienced extensive land reclamation over the past several decades [25]. This area is characterized by the presence of soft soil layers, predominantly composed of Holocene sediments, which are inherently susceptible to significant natural compaction due to their low bearing capacity and high compressibility [26]. In addition to these natural processes, anthropogenic activities—including groundwater extraction, construction, and industrial development—have further contributed to and intensified ground displacement in this region [27].
The topography of the Binhai New Area is predominantly flat, characterized by a dense urban infrastructure, extensive industrial zones, and a well-developed transportation network. These features contribute to intricate spatial patterns of surface displacement, which may lead to phase ambiguities within InSAR data. As a result, this study area serves as an exemplary testbed for the assessment of data fusion methodologies incorporating robust LSA techniques, particularly in environments where both natural and anthropogenic displacement mechanisms coexist [26,27].

2.2. Multi-Source SAR Datasets

To mitigate the challenges posed by phase unwrapping errors in TS-InSAR processing, this study employs a multi-sensor, multi-track approach through the integration of SAR datasets acquired between August 2017 and September 2018. The datasets selected for analysis comprise: (i) 30 Sentinel-1 images in ascending orbits (hereafter referred to as S1A) with the mode of Terrain Observation by Progressive Scans (TOPS) [28], (ii) 30 Sentinel-1 images in descending orbits (designated as S1D) with TOPS mode, and (iii) 17 Radarsat-2 images collected in descending orbits (denoted R2D), with the mode of StripMap (SM) [25]. Key acquisition parameters for each dataset are summarized in Table 1.
Figure 2a provides a schematic illustration of the distinct orbital geometries by depicting the relative positions of satellites with respect to a common ground reference point at the time of data acquisition. This visual representation highlights the variations in satellite pass direction and viewing angles, which can significantly influence the quality and consistency of InSAR measurements [24]. Figure 2b presents a temporal overview of the acquisition dates for the three SAR datasets, thereby elucidating their periods of overlap and suitability for data fusion analysis. The selection of these datasets is predicated on their compatibility concerning spatial coverage, temporal resolution, and acquisition geometry, which are crucial for enabling a rigorous and comprehensive comparative assessment of ground displacement estimation through the data fusion approach across varying sensor configurations.

2.3. Ancillary Data for Validation

To assess the reliability of the multi-sensor InSAR data fusion methodology with robust LSA, in situ static leveling data are utilized for cross-validation against satellite-derived displacement estimates. Static leveling is a well-established and highly precise technique for measuring vertical ground displacement, and thus serves as a suitable reference for validating InSAR-derived displacement results [26]. Figure 3 illustrates the spatial distribution of static leveling stations with numbers as their ID, highlighting their placement across various land-use categories, including urban, industrial, and open land. This representation ensures that the validation process encompasses a representative subset of the study region, thereby strengthening the credibility and robustness of the InSAR-based displacement analysis.

3. Methods

In the context of multi-source InSAR data fusion processing, traditional OLS has been extensively applied under the assumption that observations are affected exclusively by random errors [29]. However, in practical applications, this assumption is frequently compromised due to the coexistence of significant gross errors alongside random noise. Two critical phenomena further highlight the complexity and urgency of robust LSA. (i) The magnitude of a gross error in the computed corrections is typically attenuated, often significantly smaller than the original error, particularly when the redundancy of the observation set is limited. (ii) A single gross error in an observation can propagate through the adjustment process, influencing not only its own correction but also those of other observations. Therefore, the investigation and implementation of robust LSA methodologies are essential for ensuring the reliability and accuracy of surveying adjustment in scenarios where both random noise and potential gross errors may be present within the model [30,31,32,33].
In the fusion process of multi-source InSAR data, one possible approach is to process the entire SAR dataset using a connection algorithm without considering PS extraction [22]. This approach can be problematic, especially in cases of low overall coherence within the scene, as it may lead to significant errors during phase unwrapping. To mitigate these challenges, this study emphasizes the deformation results derived from multi-source InSAR data, respectively, through the implementation of a robust LSA.

3.1. Multi-Source InSAR Data Fusion Method with Robust LSA

The current limitations of in-orbit SAR satellite significantly restrict the feasibility of acquiring multiple time-series InSAR datasets from the same geographic location. To address this challenge, this study employs Barrada’s single one-dimensional candidate hypothesis as a foundation for robust estimation. Initially, a multi-source data fusion model is proposed, followed by the application of a gross error detection (GED) method to identify potential gross errors within the dataset. Then, LSA processing is conducted to obtain reliable results.

3.1.1. Multi-Source InSAR Data Fusion Model

The theoretical foundation of data fusion with robust LSA is established through the integration of InSAR data from multiple sources. This methodology involves the amalgamation of displacement measurements acquired from a minimum of two distinct viewing geometries, thereby facilitating the derivation of more reliable displacement estimates.
The functional model for this fusion is expressed as Equation (1):
L = A x + e
wherein, L denotes the observation vector derived from multi-sensor InSAR, x represents the unknown velocity parameters to be estimated, A is the design matrix that incorporates the geometric configuration of the satellite sensors, and e corresponds to the noise vector [24].
For the successful integration of multi-sensor InSAR data, three essential conditions must be satisfied: (i) spatial consistency in location, (ii) temporal coherence in the observation period, and (iii) geometric alignment in the viewing direction. To ensure spatial consistency (i), homonymous PS sets are selected across different sensors, as the identified PS locations may vary due to differences in sensor configurations and acquisition geometries. Regarding temporal coherence (ii), temporal interpolation is typically required to align the image acquisition times across different sensors. However, under the assumption of steady-state motion over the observation period, linear displacement rates (i.e., velocities) can be used as a proxy for displacement, thereby enabling the fusion of data from disparate time intervals. To address geometric alignment (iii), a multi-geometry fusion approach can be employed to decompose LOS measurements obtained from different viewing geometries into eastward, northward, and vertical velocity components [24]. Subsequently, data fusion method with robust LSA can be performed independently in each directional component. Alternatively, if the dominant component of LOS displacement is known (e.g., vertical), the LOS measurements can be projected into that specific direction prior to conducting data fusion workflow with GED.
This approach can incorporate LOS displacement measurements derived from InSAR data acquired by various SAR sensors, such as X-band, C-band, and L-band. The corresponding multi-sensor InSAR data fusion model in three directional component is formulated as Equation (2):
v l o s , 1 v l o s , i v l o s , n = sin θ 1 cos α 1 sin θ 1 sin α 1 cos θ 1 sin θ i cos α i sin θ i sin α i cos θ i sin θ n cos α n sin θ n sin α n cos θ n v e v n v u + e
wherein, n in the number of InSAR dataset, v l o s , i represents the LOS displacement of the i -th InSAR dataset from 2 to n 1 , θ i denotes its incident angle in the i -th InSAR dataset, α i denotes its heading angle of the i -th InSAR dataset, and v e , v n , v u corresponds to the displacement velocities in the east–west, north–south and vertical directions.
However, due to the current limited availability of concurrent multi-sensor SAR datasets, this study assumes that the dominant component of LOS displacement arises from vertical ground movement [25,26]. Consequently, the corresponding multi-sensor InSAR data fusion model is formulated as Equation (3):
v l o s , 1 v l o s , i v l o s , n = cos θ 1 cos θ i cos θ n v u + e
The incorporation of exact incidence angles θ for each PS within the design matrix presented in Equation (3) becomes particularly critical when integrating Interferometric Wide Swath data from the European Space Agency’s Sentinel-1 mission [33], considering the significant variation in the incidence angle across the near-range to far-range swath.
Due to the variation in the incidence angle θ with range, the design matrix A differs for each PS. A variance-covariance matrix Q L L is employed to weight the LSA. This matrix incorporates the uncertainties of LOS velocities, which are derived from independent linear regression analyses of the LOS displacement time series for each SAR dataset. Assuming no correlation among LOS velocities obtained from independent InSAR analyses, Q L L reduces to a diagonal matrix containing only the variances of the respective LOS velocity estimates δ l o s , i . The formulation of this matrix is given in Equation (4):
Q L L = δ l o s , 1 2 0 0 0 δ l o s , i 2 0 0 0 δ l o s , n 2

3.1.2. GED Method

To address the critical need for GED and optimal computation within a multi-source data fusion framework, the survey reliability theory established by Barrada and Deren L. is implemented in this paper [29,30,31,32]. The main principle of this method is briefly introduced as following.
Under the assumption that the observations conform to a normal random model with unit weight variances and corresponding weight coefficient matrices, the fundamental linearized error equation (Equation (5)) is calculated [31].
L + Δ L = F ( x 0 ) + A Δ x
wherein, Δ L denotes the vector of correction values, F ( x 0 ) represents the functional model of the observed values, and Δ x corresponds to the correction value of the unknown parameter relative to its approximate value.
The implemented solution generates a correction vector for the observed data. Crucially, the weight coefficient matrix associated with this correction vector possesses distinct statistical characteristics. Specifically, the diagonal elements of this matrix Q Δ L Δ L P are directly related to the redundancy components r i of the corresponding observations (Equation (6)) [31].
r i = ( Q Δ L Δ L P ) ii
Furthermore, the mathematical expression for the mean square error of the correction vector Δ L i is displayed in Equation (7), which serves as a critical metric for quantifying the associated uncertainty.
σ Δ L i = r i σ L i
wherein, σ L i denotes the mean square error of the observed value, and σ Δ L i represents the mean square error of the correction value associated with the observed value.
The foundation of our identification methodology is based on the analysis of these correction vectors in conjunction with their corresponding statistical parameters, namely, redundancy components r i and mean square error σ Δ L i . Deviations of these parameters beyond the expected statistical bounds are considered primary indicators of the presence of gross errors in specific observations.
When gross errors contaminate the functional model of surveying adjustment, the implementation of a statistically GED becomes imperative. A widely adopted approach is the standardized residual test, commonly known as Baarda’s data snooping [29,30,31,32,34], which is effective in identifying single gross errors. Under the assumption of a known a priori unit weight variance, the standardized residual w i is employed as the test statistic. It is formally defined as Equation (8):
w i = Δ L i σ Δ L i r i
where Δ L i denotes the residual of the i -th observation, σ Δ L i represents the standard deviation of the residual.
If no gross error is present in the i -th observation L i , the standardized residual w i is assumed to follow a standard normal distribution in Equation (9) [29,30,31,32].
w i ~ N ( 0 , 1 )
The existence of a gross error ( ε i ) is determined through statistical hypothesis testing. And the following hypotheses are defined: (i) the null hypothesis ( H 0 ): no gross error is present ( ε i = 0 ); and (ii) the alternative hypothesis ( H 1 ): A gross error is present ( ε i 0 ).

3.1.3. LSA Method

After removing the gross errors, the least squares estimation criterion is applied to obtain the optimal solution within the framework of the Gauss–Markov model for all input datasets. Under the least squares principle, the objective is to minimize Equation (10):
( L L ) T Q L L 1 ( L L ) = min
where L is the estimated value of L .
Utilizing the Lagrange multiplier method for unconstrained optimization, we differentiate the corresponding cost function to obtain the estimates of the model parameters. Equation (11) provides a systematic approach to integrating multi-source InSAR data, ensuring that the resulting estimates are robust and reliable.
x = ( A T Q L L 1 A ) 1 A T Q L L 1 L
where x is the estimated parameters.

3.2. Multi-Source InSAR Data Fusion Workflow with Robust LSA

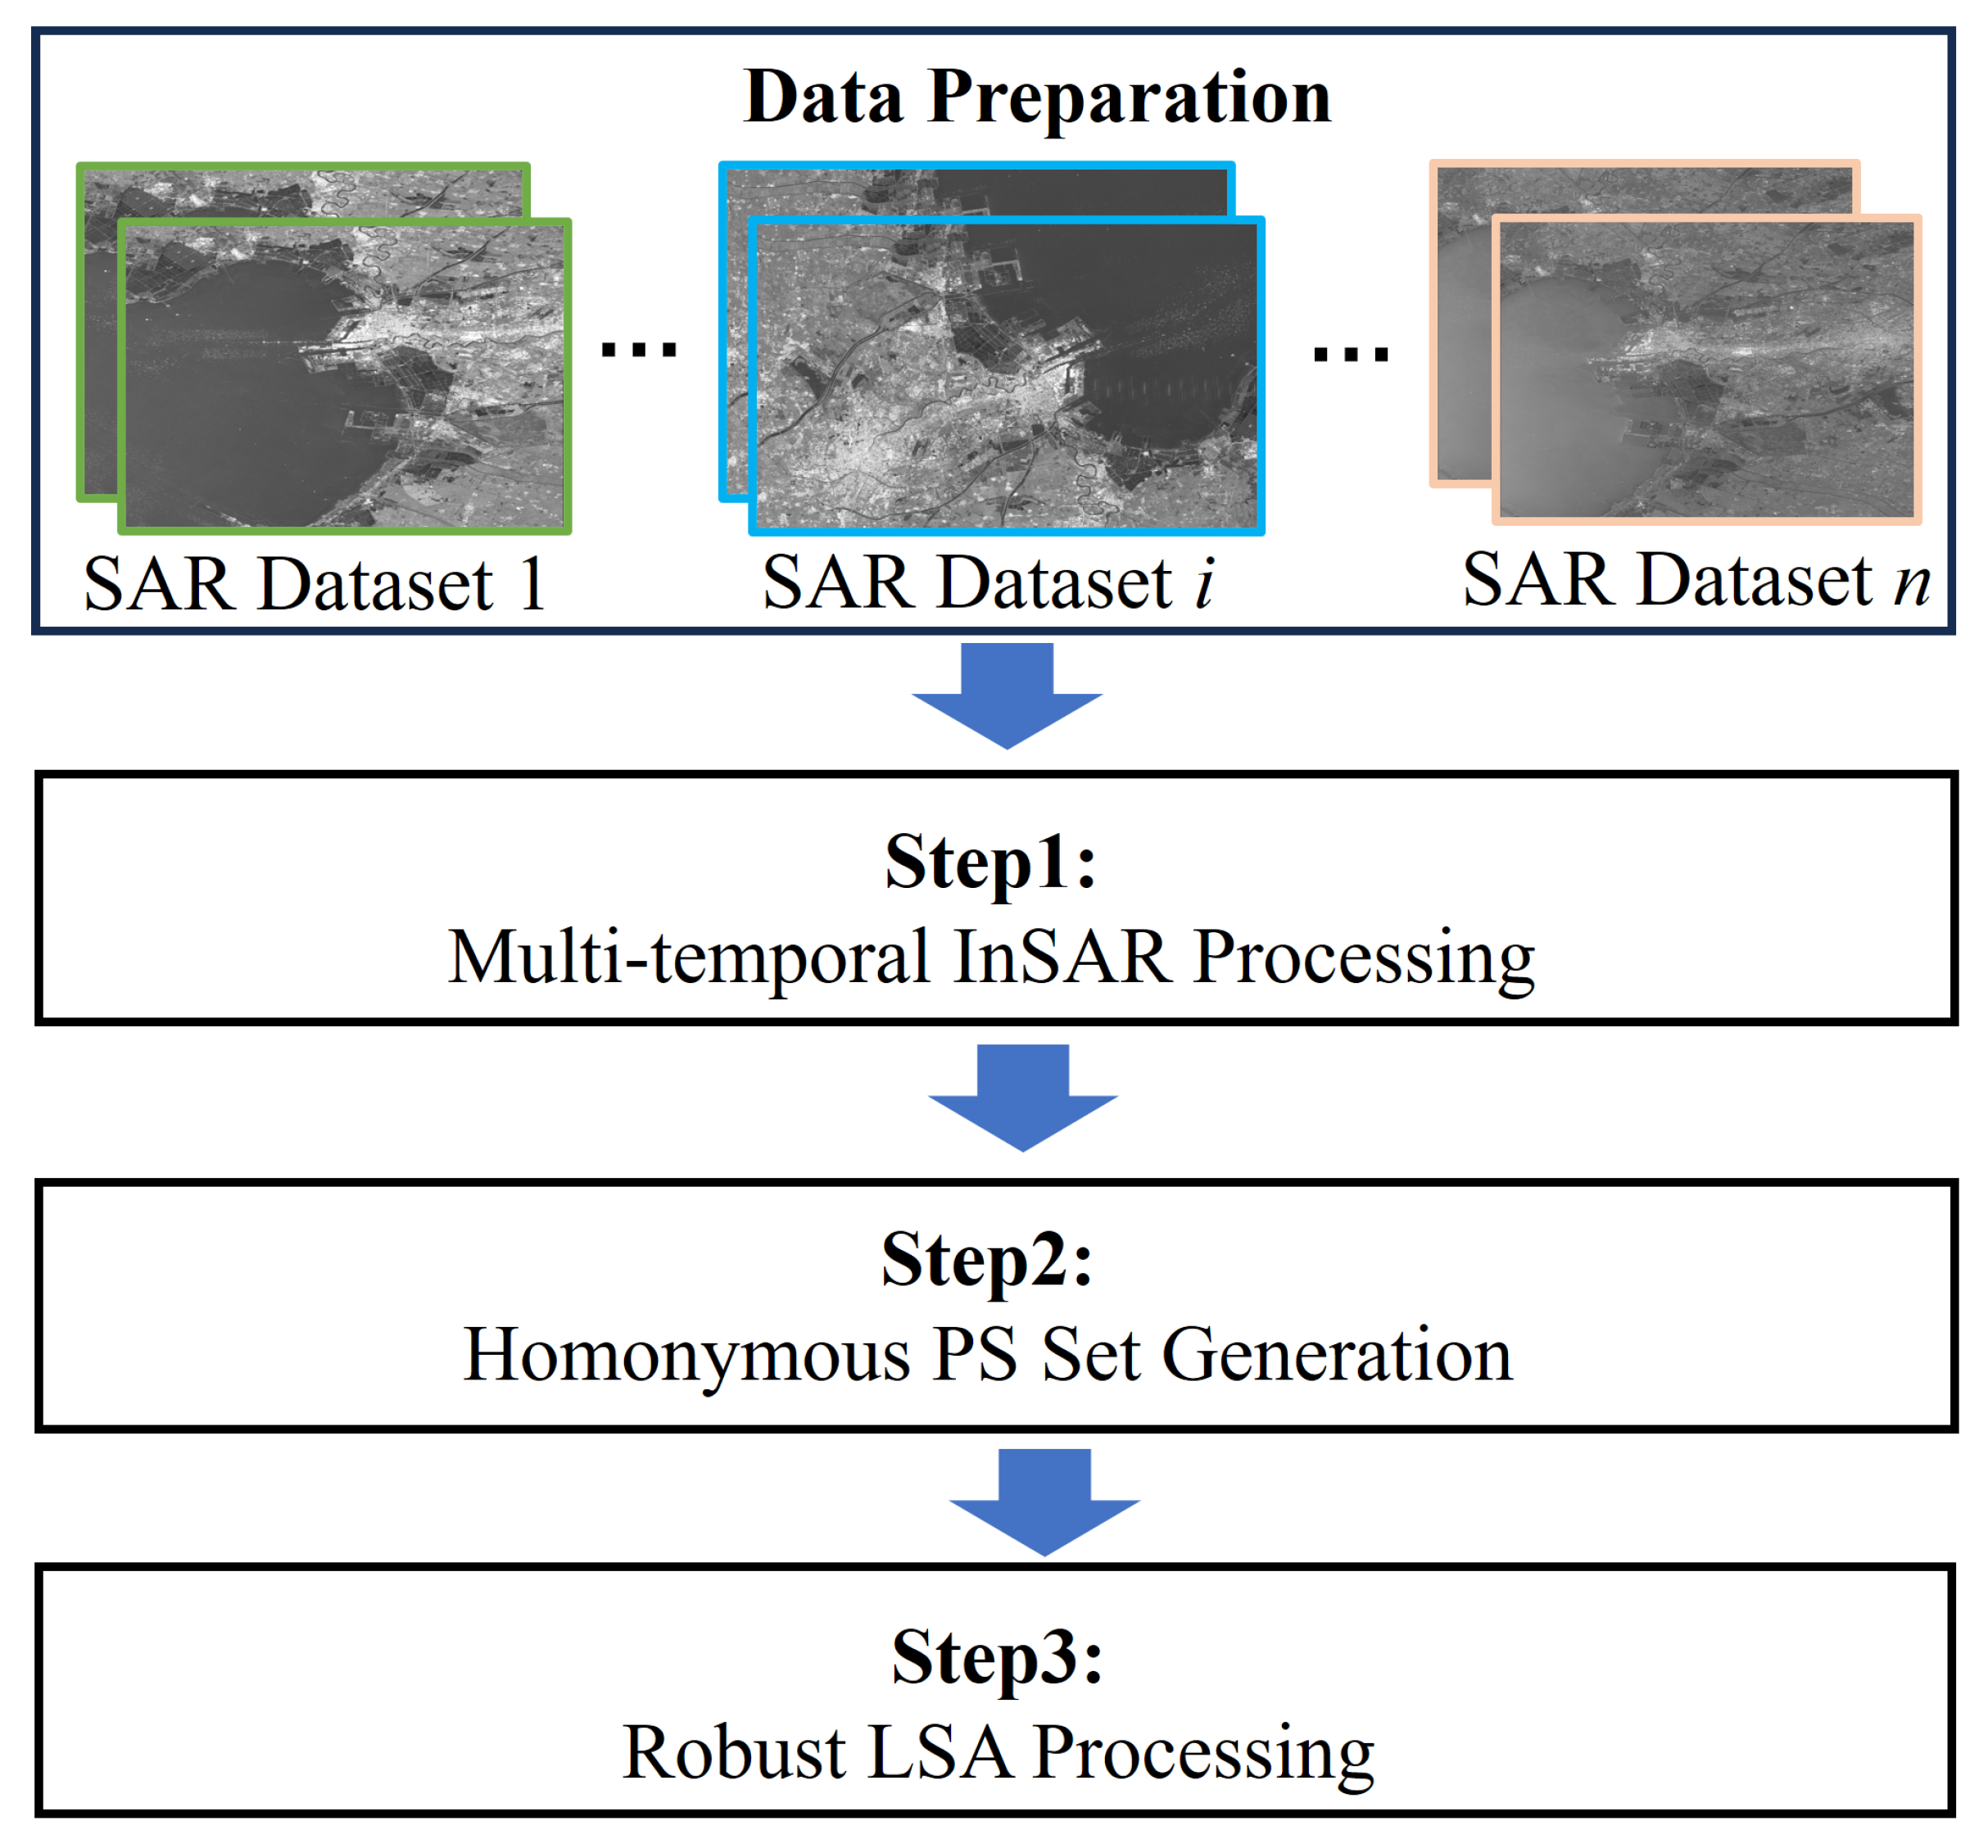
Based on the multi-source InSAR data fusion model with robust LSA analysis described in Section 3.1, a systematic workflow for reliable vertical displacement extraction with multi-sensor InSAR can be established, as illustrated in Figure 4. The MT-InSAR processing technique first generates a high-density PS network through a sequence of multi-stage processing and iterative phase unwrapping procedures. Subsequently, homonymous PS sets are identified using both planar proximity filtering and elevation consistency filtering techniques. Finally, a robust LSA analysis procedure comprised both GED and LSA is implemented by integrating Baarda’s data snooping with statistical hypothesis validation. This integrated approach ensures accurate vertical displacement measurement while effectively suppressing phase unwrapping artifacts.

3.2.1. MT-InSAR Processing

To accurately retrieve surface displacement within the complex urban and coastal environments of the study area, a MT-InSAR processing strategy integrating PSI and SBAS methods is employed with GAMMA software (Version 1.1) [24,35]. The rationale for combining these two techniques is grounded in their complementary capabilities: while PSI demonstrates high sensitivity to slow displacement processes, it is generally limited in its applicability to vegetated, forested, or low-reflectivity areas; conversely, SBAS exhibits superior performance in non-urban, vegetated regions and areas characterized by high displacement rates [36,37]. This integrated MT-InSAR approach utilizes multiple SAR datasets to mitigate the limitations inherent in conventional InSAR techniques, such as spatial and temporal decorrelation and atmospheric disturbances, thereby facilitating precise measurements of land surface displacement (Figure 5). The methodology is applied to both Sentinel-1 and Radarsat-2 data acquisitions within the study area.
The processing workflow commences with the utilization of precise orbital parameters in conjunction with the Shuttle Radar Topography Mission (SRTM) Digital Elevation Model (DEM) to perform iterative coregistration through amplitude cross-correlation, thereby attaining sub-pixel level accuracy. Subsequently, differential interferograms are generated based on short temporal and spatial baseline constraints [38].
Subsequently, the amplitude deviation threshold technique and the point target detection method derived from the PSI approach is utilized to identify high-coherence PS within a time series of radar images. The coherence coefficient threshold technique facilitates the extraction of distributed scatterers from all available SAR interferograms. This integration is critical for establishing a high-density, high-quality network of PS, which is imperative for achieving high-precision phase unwrapping in subsequent analyses [37,38].
Then, phase unwrapping strategy with spatial unwrapping and iterative regression analysis is taken. For interferograms exhibiting relatively short temporal intervals and small spatial baselines, spatial unwrapping is a viable approach [35]. A 1-D regression applied to the unwrapped phase facilitates the determination of PS height corrections. By employing these refined PS heights, it becomes feasible to effectively unwrap the PS phases of interferograms characterized by longer baselines iteratively [35].
Finally, the components of the displacement signal—including linear displacement, atmospheric phase screen, and non-linear displacement—is distinguished through the application of Singular Value Decomposition (SVD) and spatio-temporal filtering, utilizing the unwrapped PS phase. Subsequently, the LOS displacement measurements are geocoded to produce the displacement field as well as the temporal series within the geographical spatial coordinate system [3,5,26].

3.2.2. Homonymous PS Set Generation

In the context of multi-sensor InSAR data fusion, homonymous PS set refer to ground targets that exhibit temporally stable radar scattering characteristics across multiple SAR acquisitions. The precise identification of such sets is essential for robust LSA analysis and must comply with two fundamental constraints. (i) Spatial constraint. Homonymous PS set is required to meet a Euclidean distance threshold based on Tobler’s First Law of Geography, which asserts that geographically proximate locations tend to possess similar characteristics. (ii) Redundant observation constraint. Each PS must be observed independently in at least two overlapping SAR image datasets [39]. This redundancy is critical for facilitating robust LSA analysis through statistical cross-validation.
To generate homonymous PS sets across multi-sensor InSAR datasets, a hierarchical clustering methodology is implemented, comprising three fundamental stages.
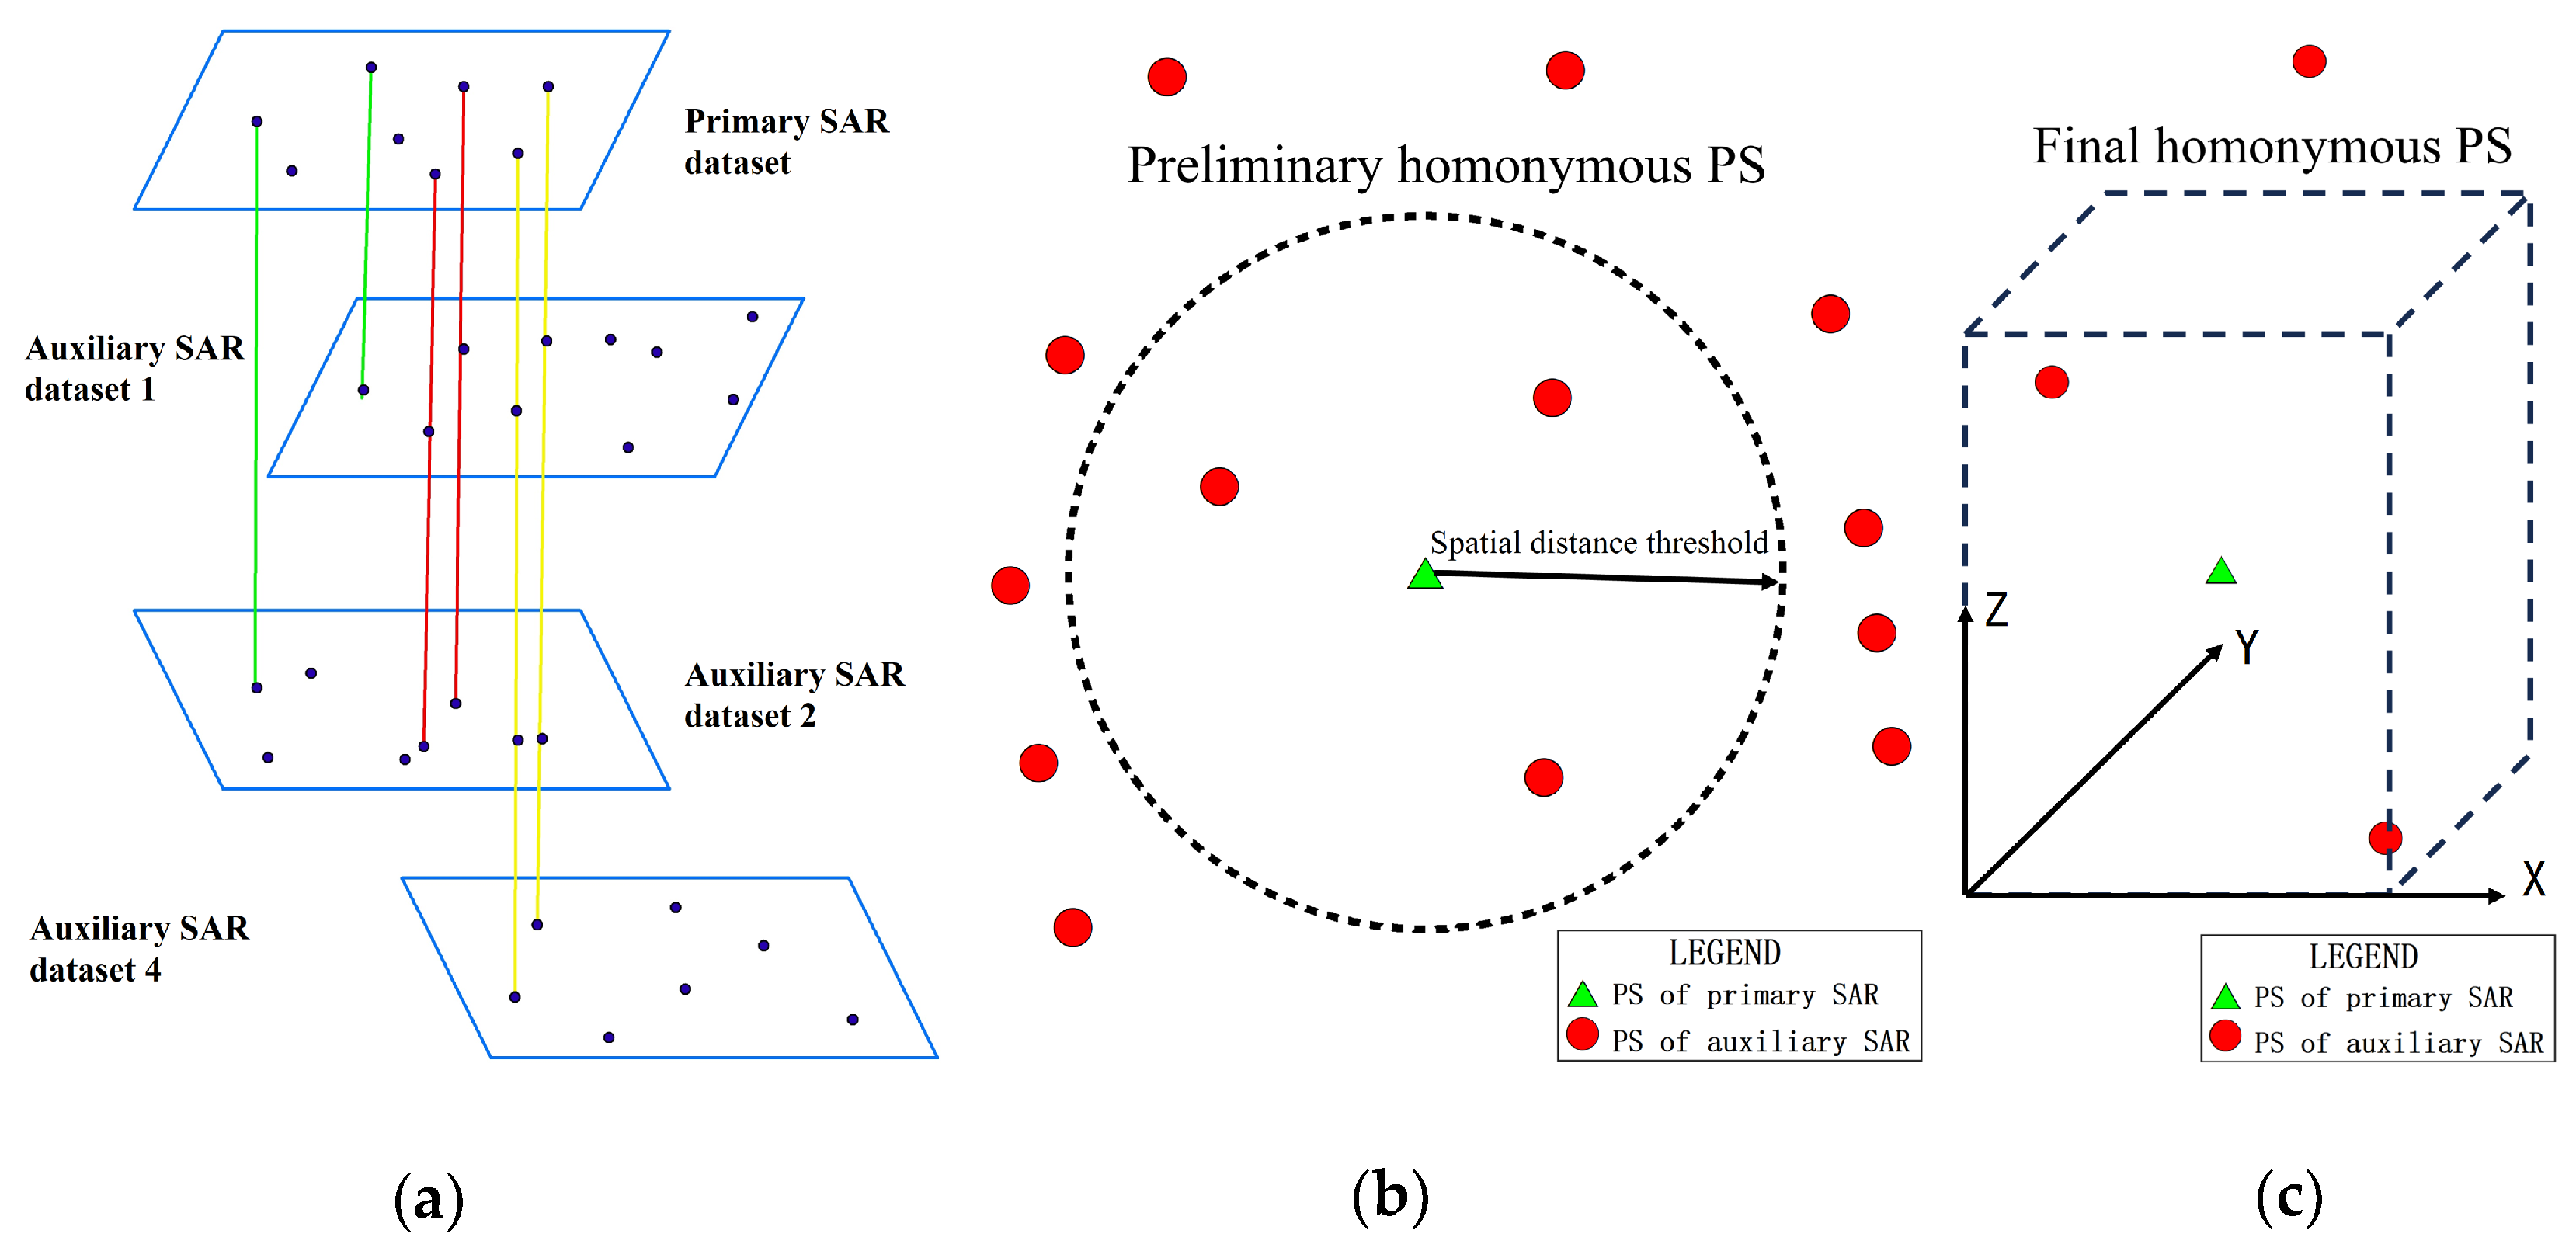
(1) Selection of primary SAR dataset. The fusion of multi-source TS-InSAR results necessitates the identification of a primary SAR dataset [39]. Considering that the distribution and density of PS vary across different satellite monitoring modes, a primary SAR dataset is chosen, accompanied by one or more auxiliary SAR datasets (Figure 6a). The PS within the primary dataset are established as fixed reference points, serving as the spatial benchmark for subsequent robust LSA analysis in relation to the auxiliary datasets.
(2) Preliminary selection of homonymous PS set with planar proximity filtering. For each PS in the primary SAR dataset, the Euclidean distances to the PS present in the auxiliary images are calculated (Figure 6b). These distances are subsequently compared against a predetermined spatial distance threshold to identify potential homonymous PS sets [40]. This threshold is established at five times the pixel ground spacing, thereby striking a balance between the requirements of sensor resolution and the principles of spatial autocorrelation.
(3) Optimized selection of homonymous PS set based on elevation filtering. To mitigate environmental complexity and further refine the candidate sets, a local elevation statistical filtering approach is employed. For each preliminary homonymous PS cluster identified in the preceding stage, a narrow rectangular prism is constructed around the preliminary PS. The horizontal dimensions of this prism correspond to the spatial distance threshold, while the vertical dimension remains unbounded. The elevation values of all candidate PS within this prism are subsequently analyzed; those exhibiting elevation differences that exceed a statistically determined threshold are classified as noise and are therefore eliminated from consideration (Figure 6c). And the homonymous PS set are generated, as shown by distinctly colored lines in Figure 6a, to facilitate subsequent LSA processing.

3.2.3. Robust LSA Processing

Drawing upon the established relationships between InSAR measurement accuracy, coherence coefficient, and the effective number of interferograms, and taking into account the distribution of SAR interferometric pairs pertinent to this study, the mean square error of the settlement rate is determined to be 1 mm/yr [19,41].
Subsequently, for α 0 = 0.01 , we obtain K = 2.576 referring to the normal distribution table [32]. And then for the convenience of subsequent calculations, the critical value is rounded to 3.0.
The decision rule is articulated in Equation (12):
I f w i k α , a   normal observation value I f w i > k α ,   the observation value may contain gross errors
In the implementation of the method described in Section 3.1, for each PS j in the primary SAR dataset, the InSAR observation value is recorded as v l o s , 1 ; for homonymous PS sets across auxiliary SAR datasets, the average displacement value is computed as v l o s , i , while the average incidence angle value is computed as θ i , where i denotes the specific image in the dataset.
The observed values and standardized residuals for each homonymous PS set across all multi-sensor InSAR datasets are computed by employing Equations (1)–(9), as well as Equation (12). Subsequently, these residuals are compared against the critical value to ascertain the presence of any gross errors. In instances where a gross error is detected, the PS exhibiting the largest standardized residual is classified as a gross error and is thereafter removed from the dataset. This calculation process, as articulated in Equations (1)–(9), as well as Equation (12), is iteratively repeated until no further gross errors are identified. Ultimately, if no gross errors are detected upon the completion of the iterative process, the observation results for the homonymous PS set across the multi-source InSAR images are retained. Following this, the LSA method is employed to refine the final displacement estimates.

4. Result and Analysis

4.1. MT-InSAR Processing of Multi-Source SAR Datasets

4.1.1. Key Parameters of MT-InSAR Processing

The MT-InSAR methodology, as detailed in Section 3.2, was employed to process the three SAR datasets outlined in Section 2, namely S1A, S1D, and R2D.
The coregistration procedure was conducted utilizing consistent thresholds across all datasets, thereby ensuring spatial alignment and minimizing geometric distortions. Specifically, for the Radarsat-2 datasets, a coregistration accuracy threshold of 0.1 pixels was established [19], while a more stringent threshold of 0.001 pixels was applied to the Sentinel-1 datasets [42]. These thresholds were selected based on the intrinsic characteristics of each sensor’s acquisition mode, thereby highlighting the importance of sensor-specific parameters in obtaining reliable interferometric results.
During the configuration of interferometric pairs, differential interferometric pairs were generated in accordance with spatiotemporal baseline constraints dictated by the unique orbital and temporal characteristics of each satellite. The selection of these pairs was informed by the small baseline criteria established in references [3,38]. For the Radarsat-2 datasets, the temporal baseline limit was set at 180 days, with a perpendicular baseline threshold of 300 m. Conversely, for the Sentinel-1 datasets, the temporal baseline limit was established at 100 days, accompanied by a perpendicular baseline threshold of 100 m.
In the multi-look processing stage, the multi-look factor was configured to 5 for the Radarsat-2 data and 2 for the Sentinel-1 data. This parameter was calibrated to optimize the balance between spatial resolution and speckle noise reduction. The application of varying multi-look factors was consistent with the findings presented in [4,43], which illustrate that multi-look settings considerably impact the quality of interferometric results.
For the extraction of PS, uniform thresholds were implemented across all datasets to ensure consistency in PS detection. Specifically, an amplitude deviation threshold of 1.4, a point target density threshold of 0.35, and a coherence coefficient threshold of 0.35 were employed, in accordance with the methodology outlined in [4,5]. These thresholds were determined based on empirical validation and have been widely endorsed in prior research for the identification of stable scatterers that exhibit reduced susceptibility to atmospheric and temporal decorrelation effects [4].
Phase unwrapping was subsequently conducted using an iterative regression approach. Initially, spatial unwrapping was performed on interferometric pairs characterized by relatively short temporal intervals to eliminate orbital phase contributions. Residual phases were then subjected to 1-D regression to estimate point height corrections, relying on iterative refinements with initial height accuracy and baseline characteristics. This iterative process facilitated the unwrapping of longer-baseline pairs, making the methodology particularly effective in scenarios involving significant deformation.
A SVD process was employed to derive the least-squares solution for linear displacement from a multi-reference stack of unwrapped phases. Iterative spatial and temporal filtering techniques were applied to the residual phase to separate atmospheric influences and non-linear deformation components.
Finally, the LOS displacement results were geocoded into the WGS84 coordinate system, ensuring consistency with geographic reference frameworks. This alignment is paramount for enabling further analytical studies and the interpretation of data fusion methodologies employing robust LSA.

4.1.2. Multi-Source InSAR Results

The mean LOS velocity (mm/yr) maps of the final geocoded displacements generated from the Sentinel-1 and Radarsat-2 data were presented in Figure 7a (for S1A), Figure 7b (for S1D), and Figure 7c (for R2D). Within the study area, a total of 131,376 PS were obtained from the S1A data, 126,224 PS from the S1D data, and 155,848 PS from the R2D data; these PS contributed to the generation of the homonymous PS set discussed in the subsequent section. The color gradient, which transitions from orange to blue, represents vertical velocities, with negative values indicating vertical displacement and positive values indicating uplift. As depicted from Figure 7a to Figure 7c, the principal vertical displacement patterns were consistently highlighted across the three InSAR measurements from different sensors and geometries. The central urban core of Tanggu exhibits minimal vertical displacement, while significant vertical displacement was observed in the eastern coastal reclamation zones. Additionally, marked vertical displacement was evident in the western airport economic area.

4.2. Generation of the Homonymous PS Sets

To achieve robust LSA utilizing multi-source InSAR data, a homonymous PS set was generated in accordance with the methodology detailed in Section 3.2. This set was predicated on the assumption that the displacement rates obtained from MT-InSAR analyses of individual PS were reliable indicators of actual ground displacement.

4.2.1. Selection of the Primary SAR Dataset from Three InSAR Datasets

The spatial distribution and density of PS exhibit significant variability across different InSAR measurement results. As depicted in Figure 7, the S1A dataset encompasses approximately 102 PS per square kilometer, while the S1D dataset consists of around 98 PS/km2; conversely, the R2D dataset demonstrates a density of approximately 121 PS/km2. To maintain spatial consistency among the datasets, the R2D dataset—acquired in Stripmap mode—was selected as the primary SAR dataset. This decision was substantiated by its superior spatial resolution and enhanced observational accuracy [28,44], both of which were crucial for precise geolocation and alignment with Sentinel-1 datasets. Consequently, the S1D and S1A datasets were designated as auxiliary SAR datasets. This strategic selection was imperative for facilitating cross-dataset comparisons and ensuring that the homonymous PS set accurately represents true spatial correspondences.

4.2.2. Generation of Homonymous PS Sets Between R2D and S1D

The generation of homonymous PS sets between the primary dataset (R2D) and the auxiliary dataset (S1D) was executed algorithmically for each PS within the R2D dataset. The process commenced with the calculation of Euclidean spatial distances between PS j in the R2D dataset and all PS in the S1D dataset. Candidate points were subsequently selected based on a predefined spatial threshold to identify preliminary homonymous PS candidates. In this study, the threshold D t h r e s h was established at 125 m, which corresponds to five times the pixel ground spacing of Radarsat-2. Following this initial selection phase, a local elevation statistical filter was applied to eliminate noise points that may have arisen from atmospheric disturbances, temporal decorrelation, or surface alterations. This filtering step was critical for ensuring that only high-quality, spatially consistent PS were incorporated into the final homonymous set. Once the filtered candidates were identified, ( P S j , R 2 D , P S m n , S 1 D ) were classified as homonymous PS sets based on their congruence in geographic coordinates.
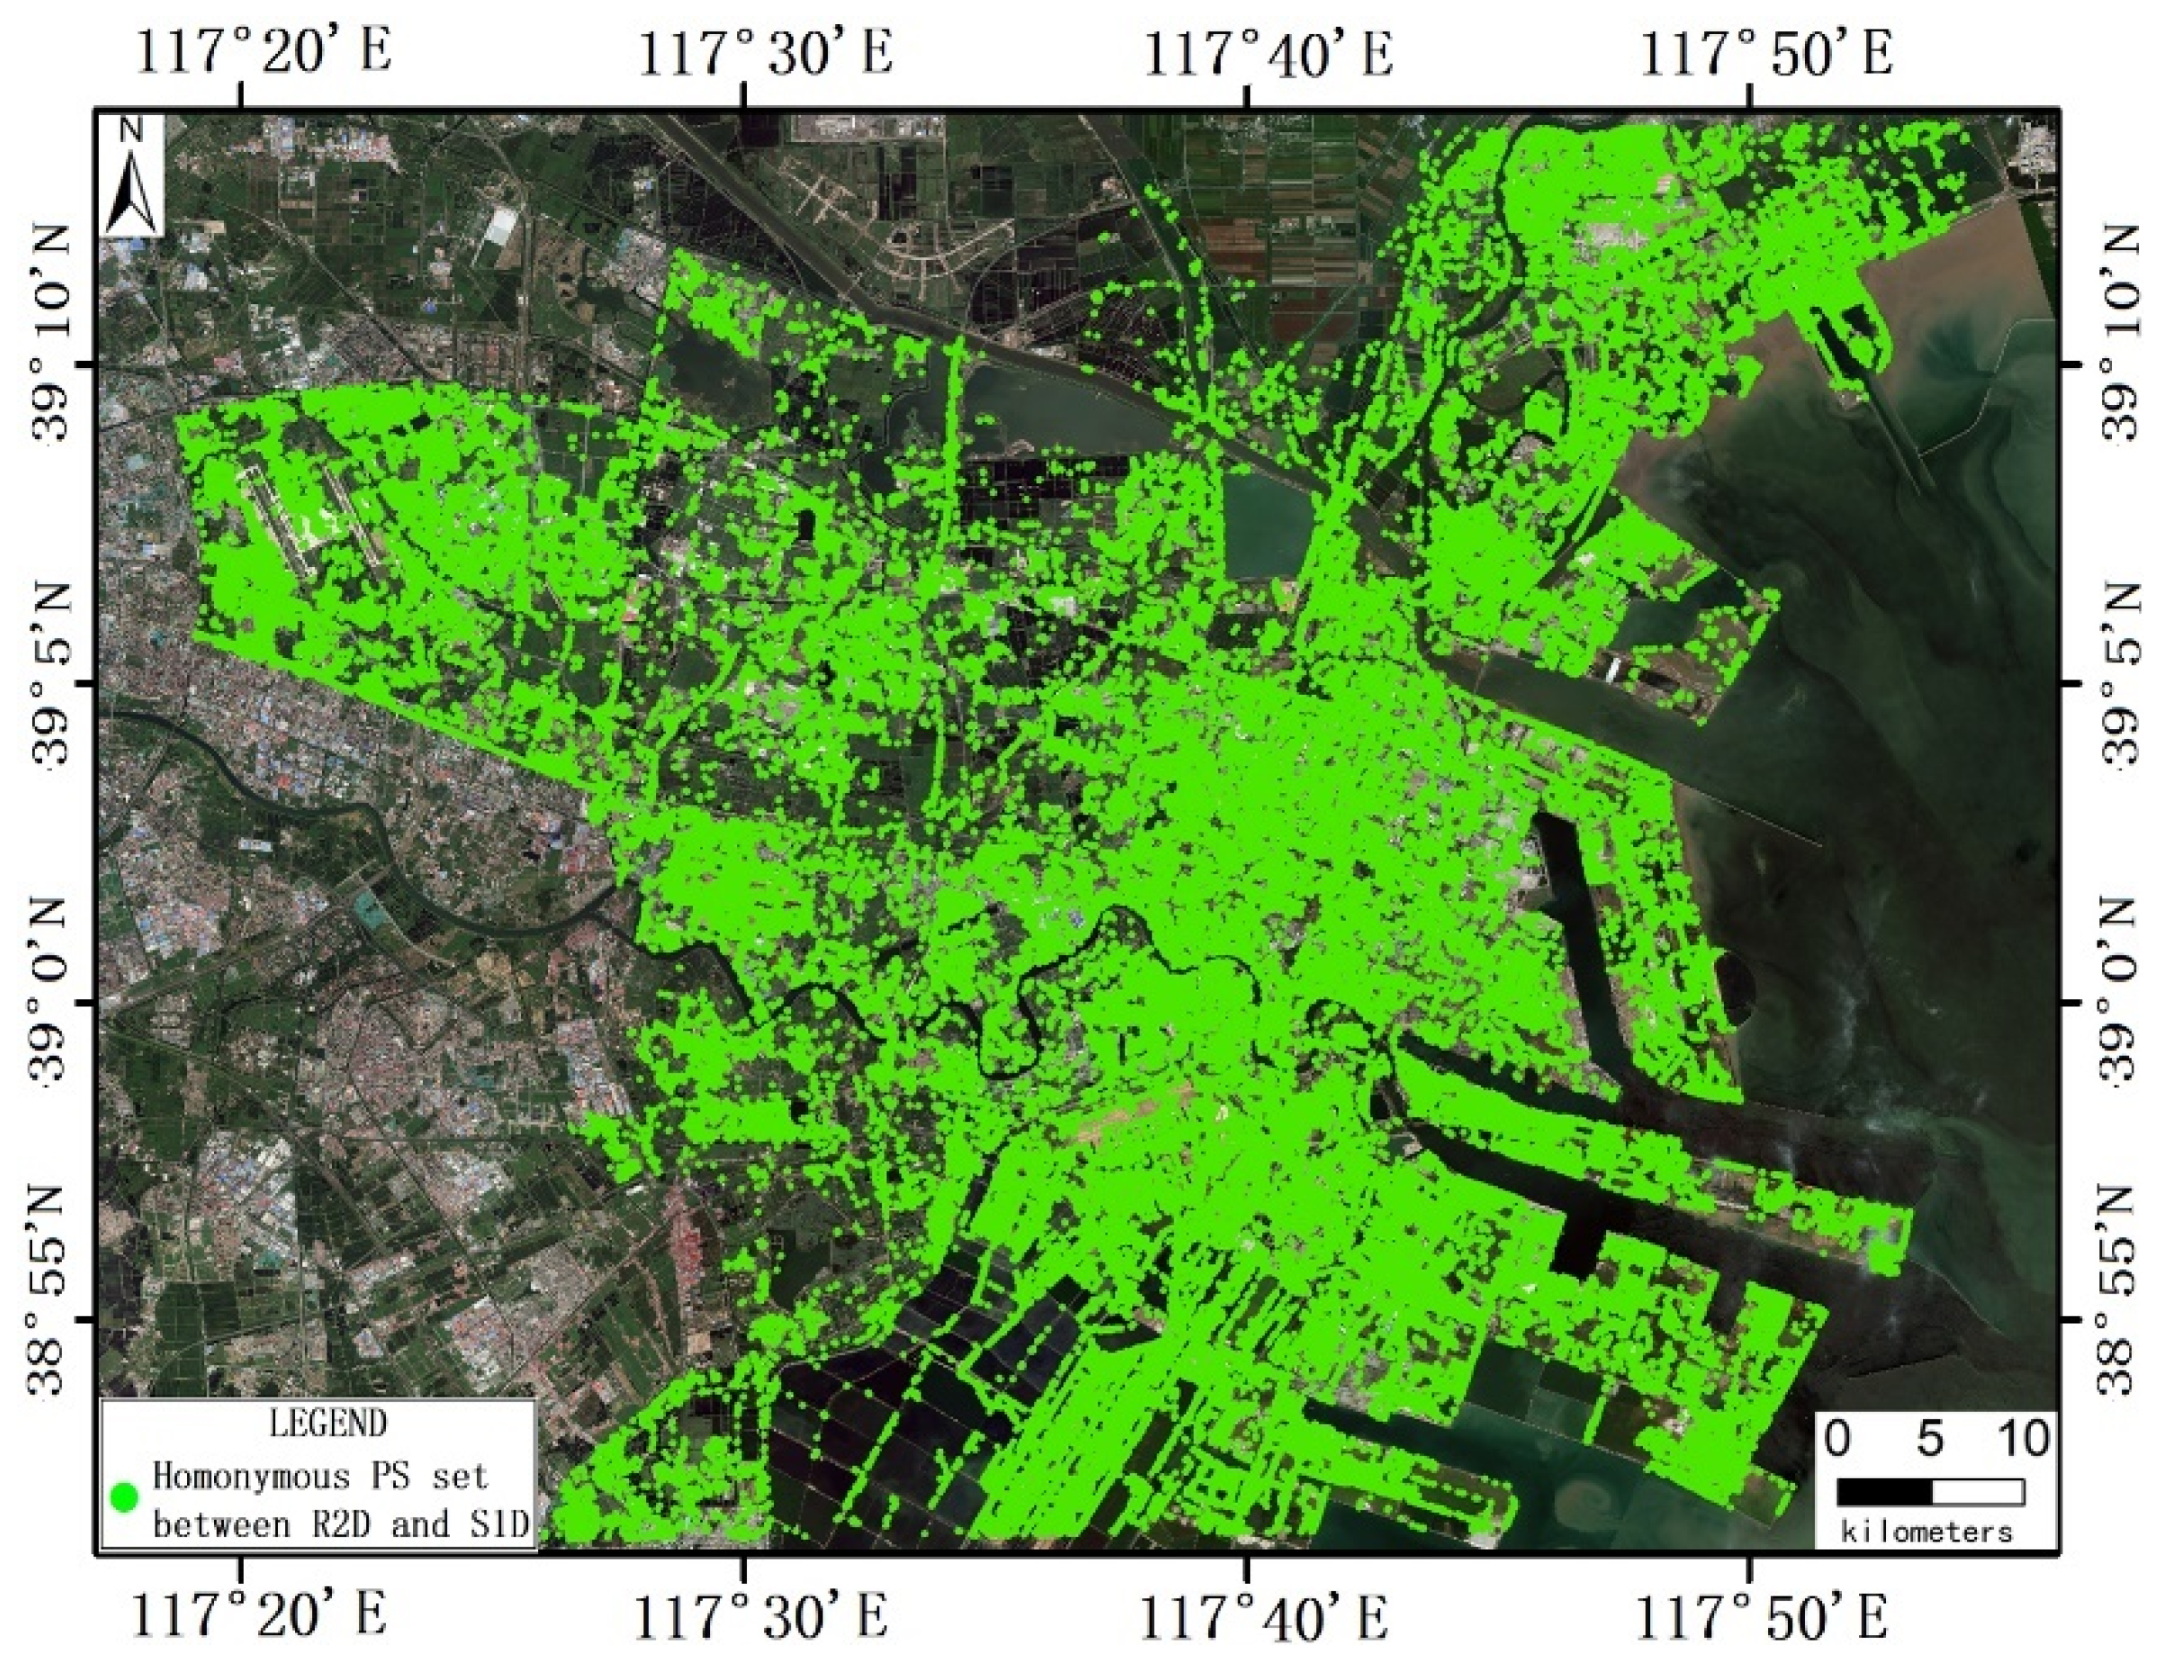
The procedure was systematically applied iteratively to all PS within the R2D dataset, culminating in the identification of approximately 120,000 matched homonymous PS sets, hereafter designated as R2D_S1D (Figure 8). This number accounts for 76.9% of the total PS present in the R2D dataset. This comprehensive homonymous set constitutes the foundational basis for the subsequent robust LSA and related analyses.

4.2.3. Generation of Homonymous PS Sets Across Three InSAR Datasets

Building upon the established R2D-S1D homonymous PS sets, this study extends the methodology to integrate all three SAR datasets into a cohesive multi-source homonymous PS set. This integration was designed to enhance the robustness of displacement monitoring by capitalizing on the complementary characteristics inherent in multiple SAR acquisitions.
The identification of homonymous PS sets between the auxiliary S1A dataset and the primary R2D dataset was performed utilizing spatial proximity filtering and elevation filtering techniques that were consistent with those applied in the R2D_S1D pairing process. These filtering methods were designed to ensure that only PS demonstrating analogous geometric and temporal behaviors across the datasets were regarded as potential candidates for cross-dataset alignment. The resulting set of PS derived from this pairing was designated as R2D_S1A.
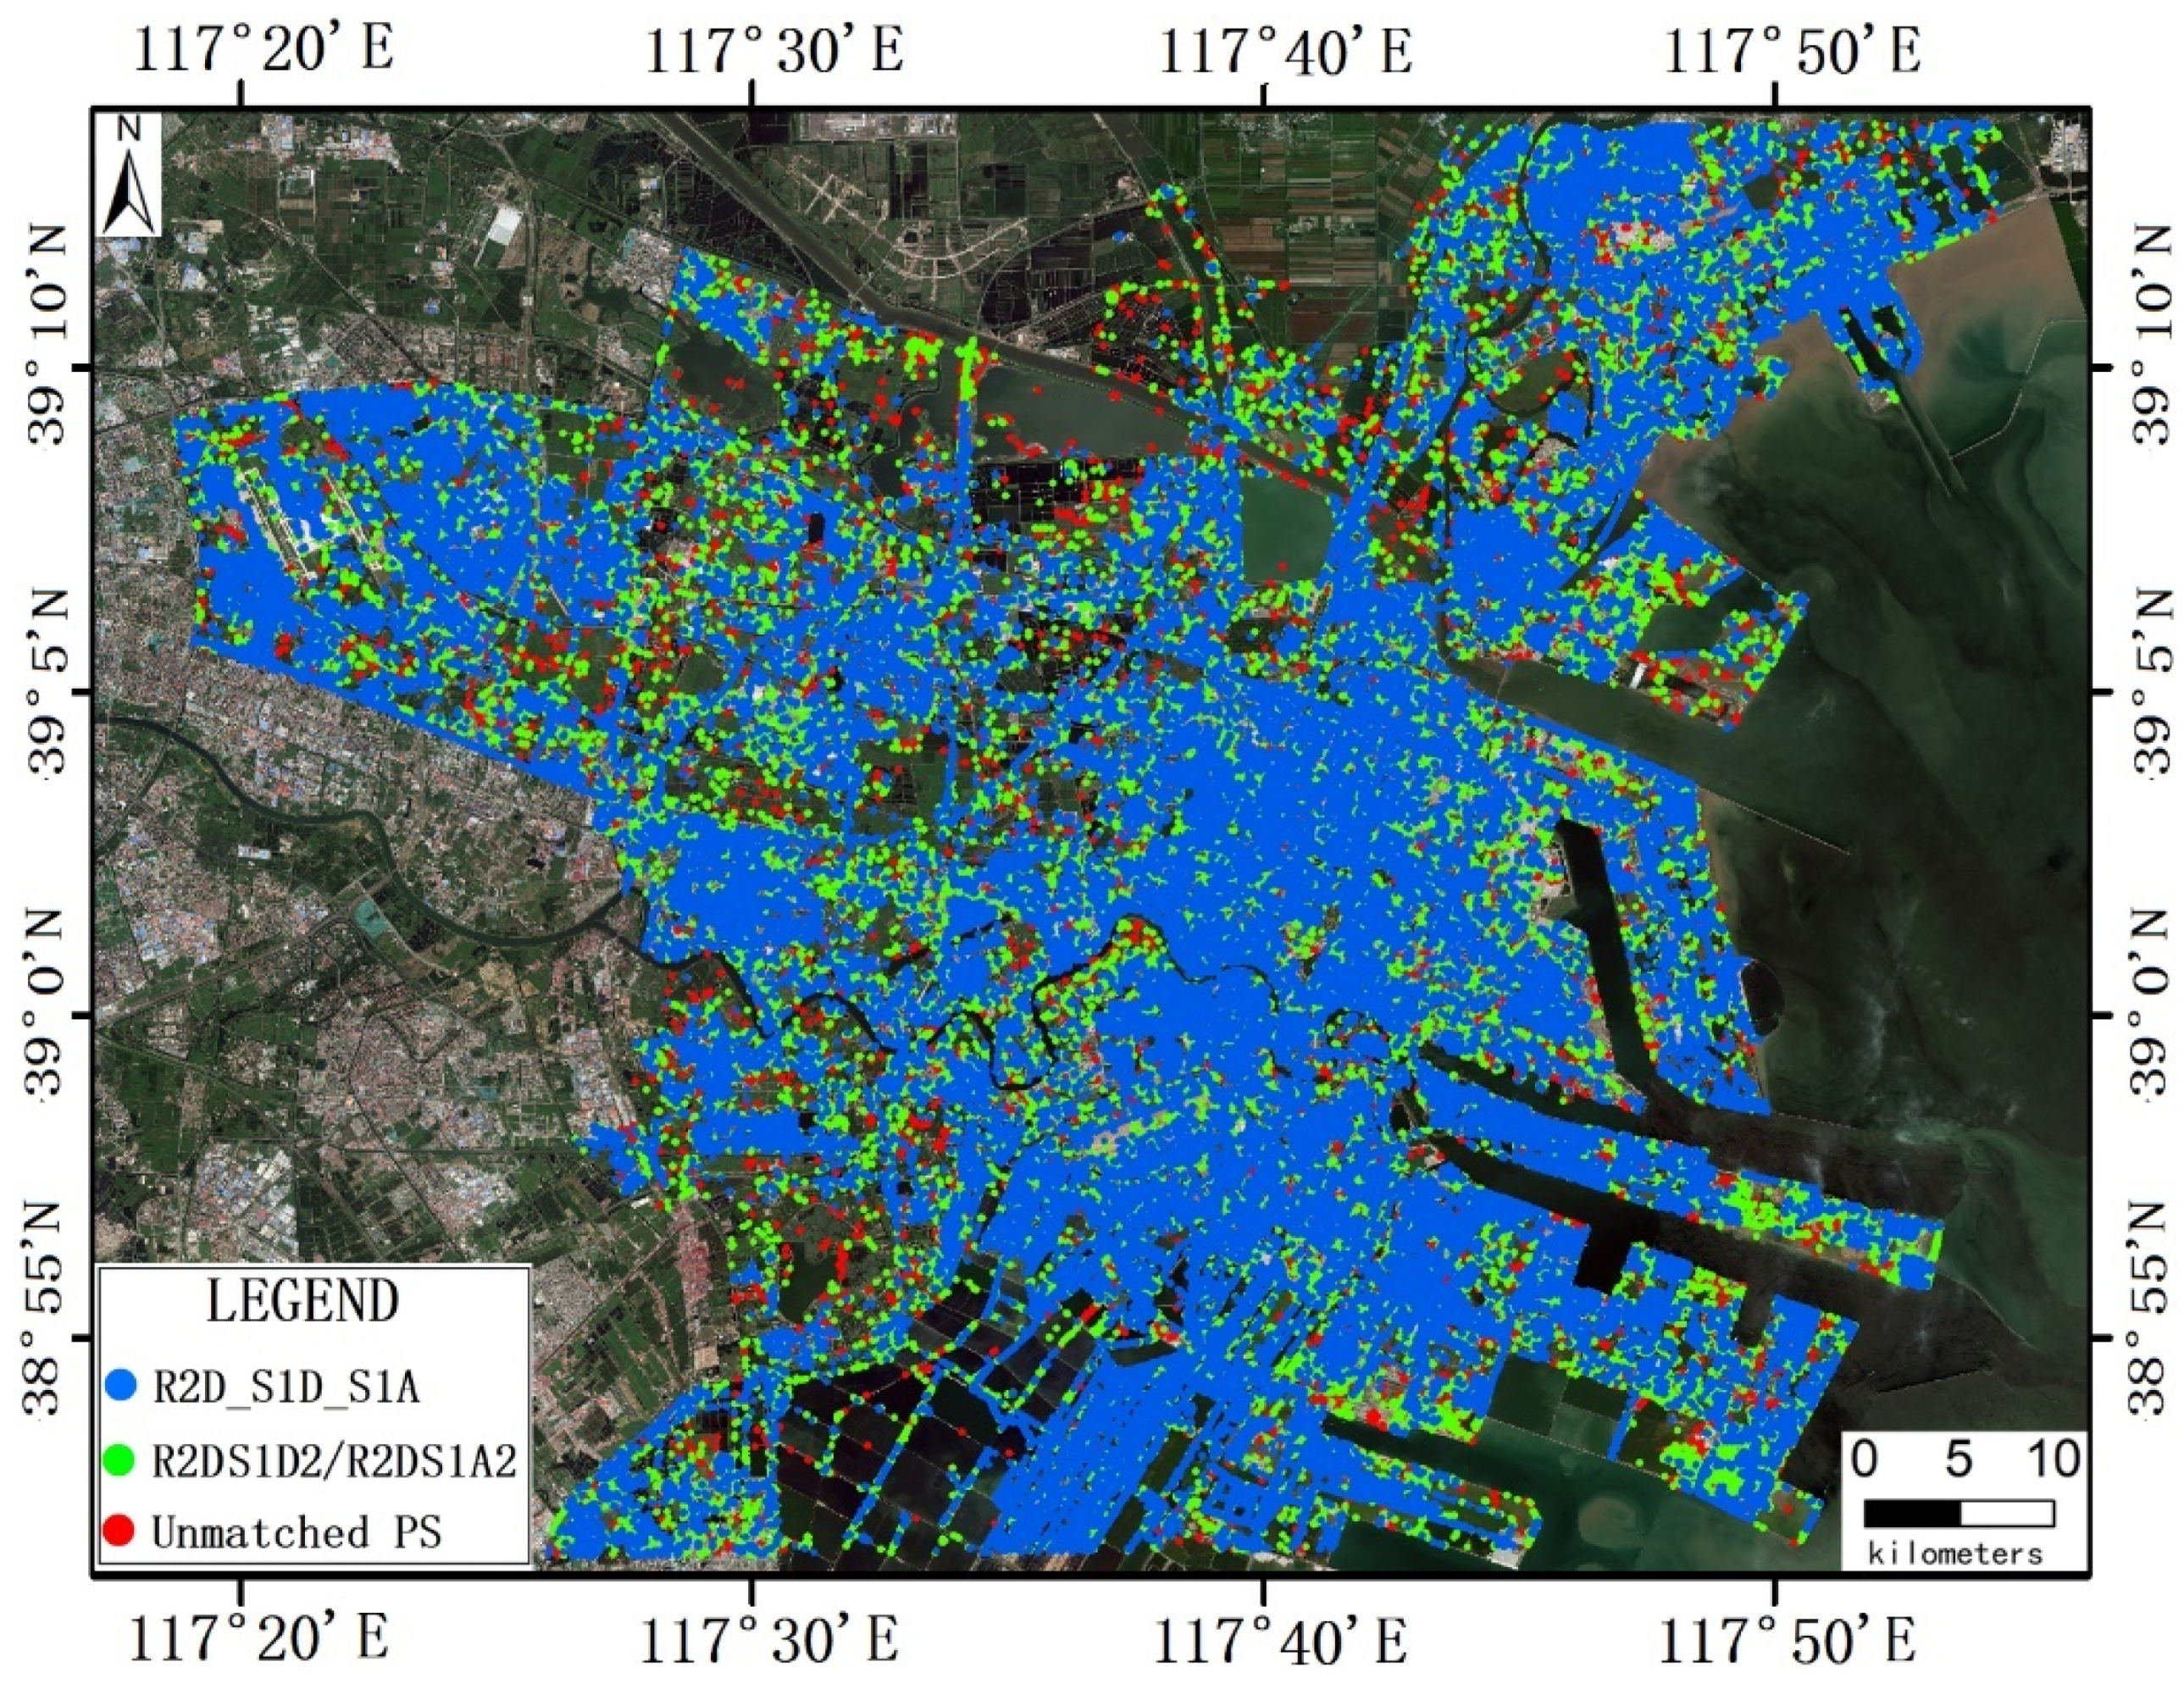
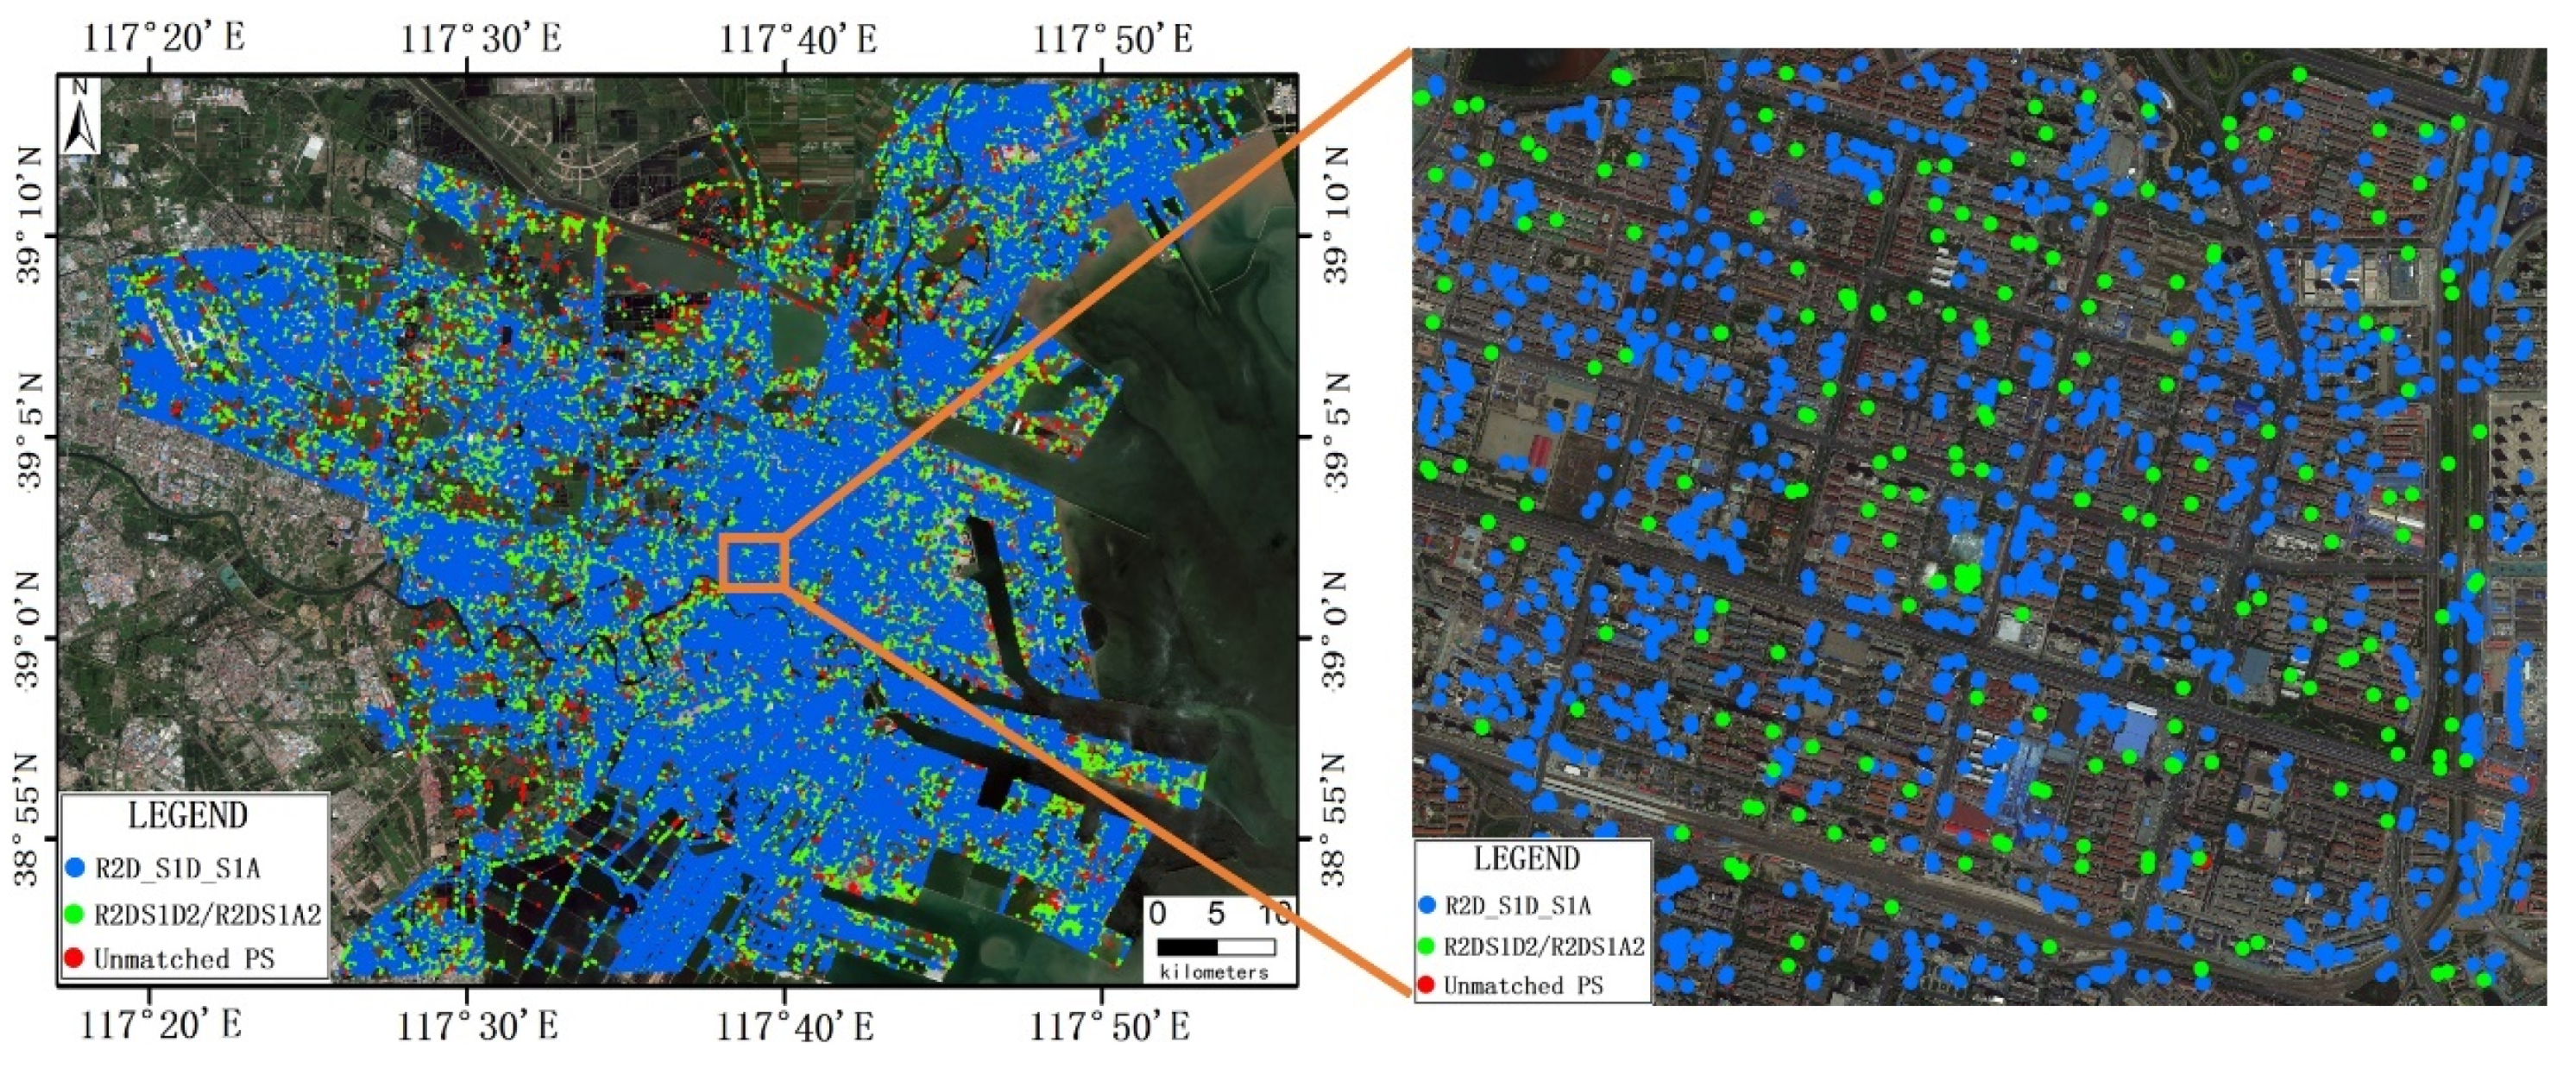
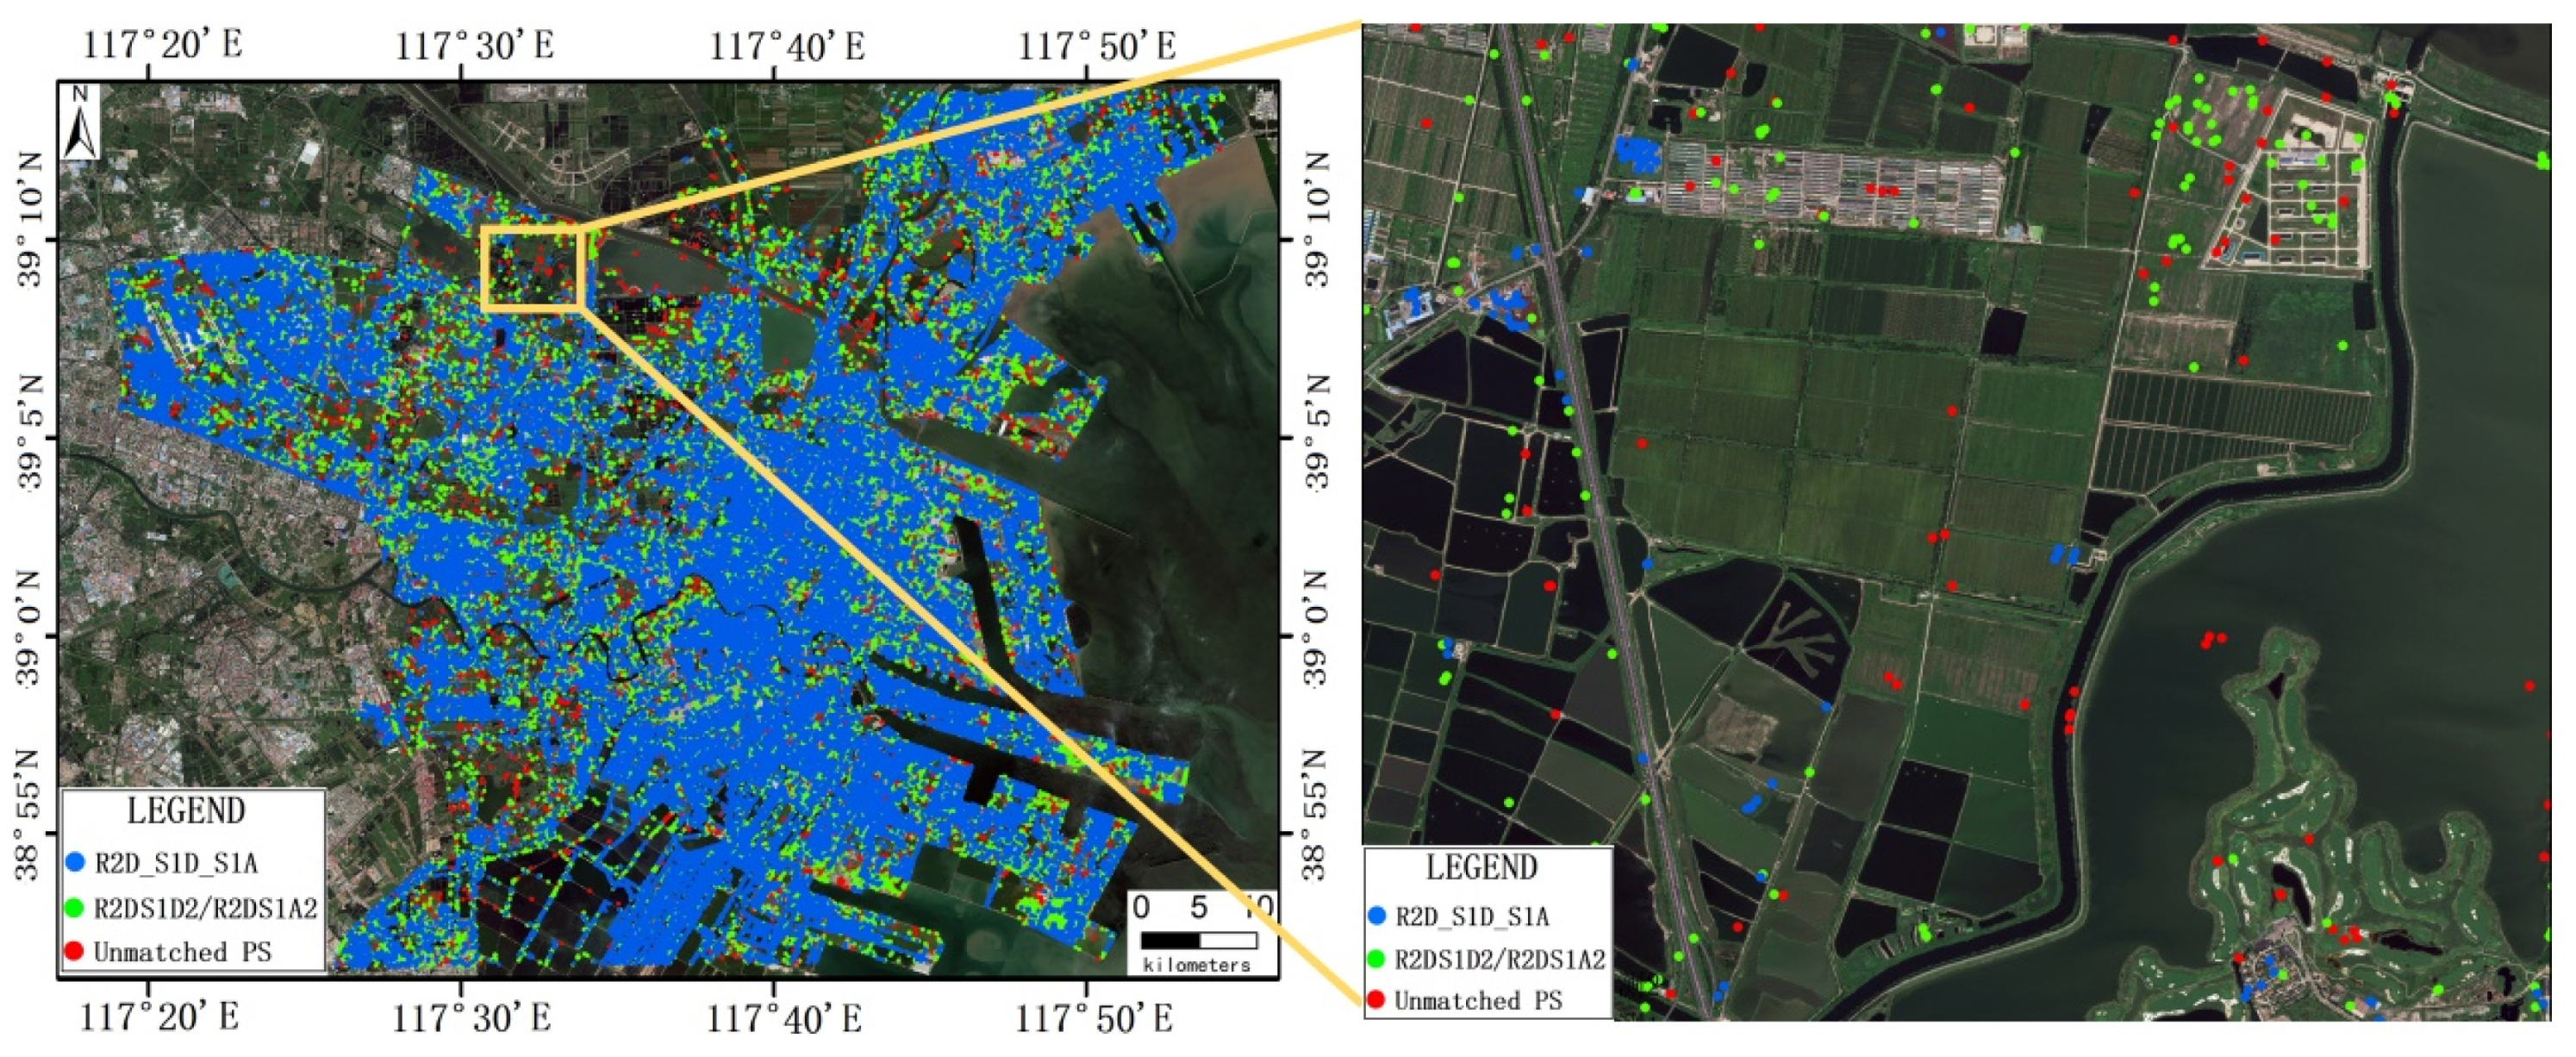
Both the R2D_S1D and R2D_S1A PS sets derive from the R2D dataset and possess identical spatial coordinates. By conducting an intersection analysis on these two sets, it becomes possible to identify a common subset of PS, which represents the overlapping features among the R2D, S1D, and S1A datasets. This common PS set was designated as R2D_S1D_S1A, as illustrated by the blue dots in Figure 9. Furthermore, the points in R2D_S1D and R2D_S1A that do not coincide with R2D_S1D_S1A were utilized as a set of secondary observation points for subsequent analyses, denoted as R2DS1D2 and R2DS1A2, respectively, and represented by the green dots in Figure 9.
This extension facilitates the identification of homonymous PS sets that were present in at least two of the SAR datasets, thereby substantially enhancing the redundancy and reliability of the displacement estimates. Such homonymous PS sets were particularly valuable for the detection and correction of significant errors that may occur due to misregistration or inconsistent displacement patterns across different SAR acquisitions.
The unmatched PS were represented as red dots in Figure 9. The presence of these unmatched PS within the primary R2D dataset was typically observed in regions characterized by distinct geophysical and temporal attributes. These characteristics include: (i) areas exhibiting low radar coherence, which generally arises from surface roughness, vegetation cover, or atmospheric disturbances that impede the consistent detection of stable reflectors across multiple acquisitions; (ii) regions experiencing significant temporal decorrelation between sensor acquisition periods, often attributable to rapid surface changes linked to tectonic activity, land displacement, or anthropogenic influences.

4.3. Multi-Source InSAR Data Fusion with Robust LSA

4.3.1. Implementation of Multi-Source InSAR Fusion Model

This section delineates a systematic methodology and empirical findings pertaining to the identification of substantial errors within multi-source InSAR LOS velocity datasets across the study area situated in the Binhai region. The proposed methodology leverages the inherent redundancy obtained from the integration of independent InSAR analyses within a multi-sensor data fusion framework, specifically applied to homonymous PS sets. The overarching aim of this approach was to detect both isolated significant errors in individual PS observations as well as systematic anomalies that may pervade the entire study area.
As elaborated in Section 3.1 and corroborated by previous geodetic investigations of the region [26,45], surface displacement within the Binhai study area was predominantly characterized by vertical displacement. The estimated velocity components in the east–west and vertical directions were comparatively minor in magnitude relative to the vertical component, a pattern that aligns with the previously recorded tectonic behavior and anthropogenic influences pertinent to the region. Considering the predominance of vertical displacement as the principal mode of surface motion within the study area, LOS displacement measurements were thus interpreted as vertical displacement for the purposes of subsequent analyses.
The dimensions of the observation vector L , design matrix A , and variance-covariance matrix Q L L were contingent upon the quantity of observations available for each homonymous PS set. In relation to the three SAR datasets utilized in this study, the design matrix (as articulated in Equation (13)) delineates a linear relationship between LOS velocity observations and vertical velocity components. This formulation was anchored in the conventional InSAR processing framework, wherein LOS velocity was represented as a function of actual vertical displacement and the satellite’s viewing geometry.
A = 0.77 0.80 0.90
Consequently, the variance-covariance matrix Q L L for observations associated with a given PS set was assumed to be a diagonal matrix, with its diagonal elements representing the variances of the uncertainties in the LOS velocity measurements (as articulated in Equation (14)). This assumption was predicated on the notion that the uncertainties corresponding to individual LOS velocity measurements were uncorrelated. However, it was imperative to acknowledge that, in more intricate scenarios involving spatially correlated noise or non-linear displacement patterns, the off-diagonal elements of the variance-covariance matrix may necessitate careful consideration.
Q L L = 1 0 0 0 1 0 0 0 1

4.3.2. Data Fusion Processing with Robust LSA in a Single PS Set

The methodology employed for the detection of gross errors within an individual PS set was exemplified through the analysis of a representative urban PS set, as illustrated in Figure 10. This specific PS set was characterized by three independent LOS velocity observations, which were obtained from distinct satellite acquisitions from the R2D, S1A, and S1D datasets.
The observation LOS vector for this PS set was denoted as L = [ 5.2 , 4.3 , 2.9 ] T , and its length is 3 in this case. By applying Equation (1) in conjunction with Equation (9), the components of redundancy and standardized residuals were computed as r = [ 0.67 , 0.67 , 0.67 ] T and w = [ 4.62 , 2.92 , 7.55 ] T , respectively. These residuals serve as essential indicators for the identification of potential gross errors within the dataset.
Observations with absolute values of the standardized residual w i > k α typically signal potential gross errors. In this study, a critical threshold k α of 3.0 was established. For the selected PS set, the first and third standardized residuals surpassed this threshold, thereby indicating the presence of significant outliers within the original dataset.
In accordance with the principle of sequential error removal, the third observation was excluded from subsequent analyses. The robust LSA process was subsequently re-evaluated using the remaining two observations. The resulting standardized residuals were found to be below the critical threshold of 3.0, thus confirming the absence of any further gross errors within the dataset.
Ultimately, the vertically estimated settlement rate for this PS set was determined to be 6.1 mm/yr, derived using the LSA method following the GED process. In contrast, the value obtained through traditional LSA methodology was calculated to be 3 mm/yr. The discrepancy between these two methodologies amounts to 3.1 mm/yr, which constitutes a 103% increase in comparison to the conventional analysis approach. The findings indicate that traditional OLS methods frequently fail to adequately account for the displacement roughness associated with disparate data sources and instead rely on direct statistical processing, a practice that can readily introduce errors in the presence of significant surrounding disturbances.

4.3.3. Data Fusion Processing with Robust LSA in Region-Wide PS Sets

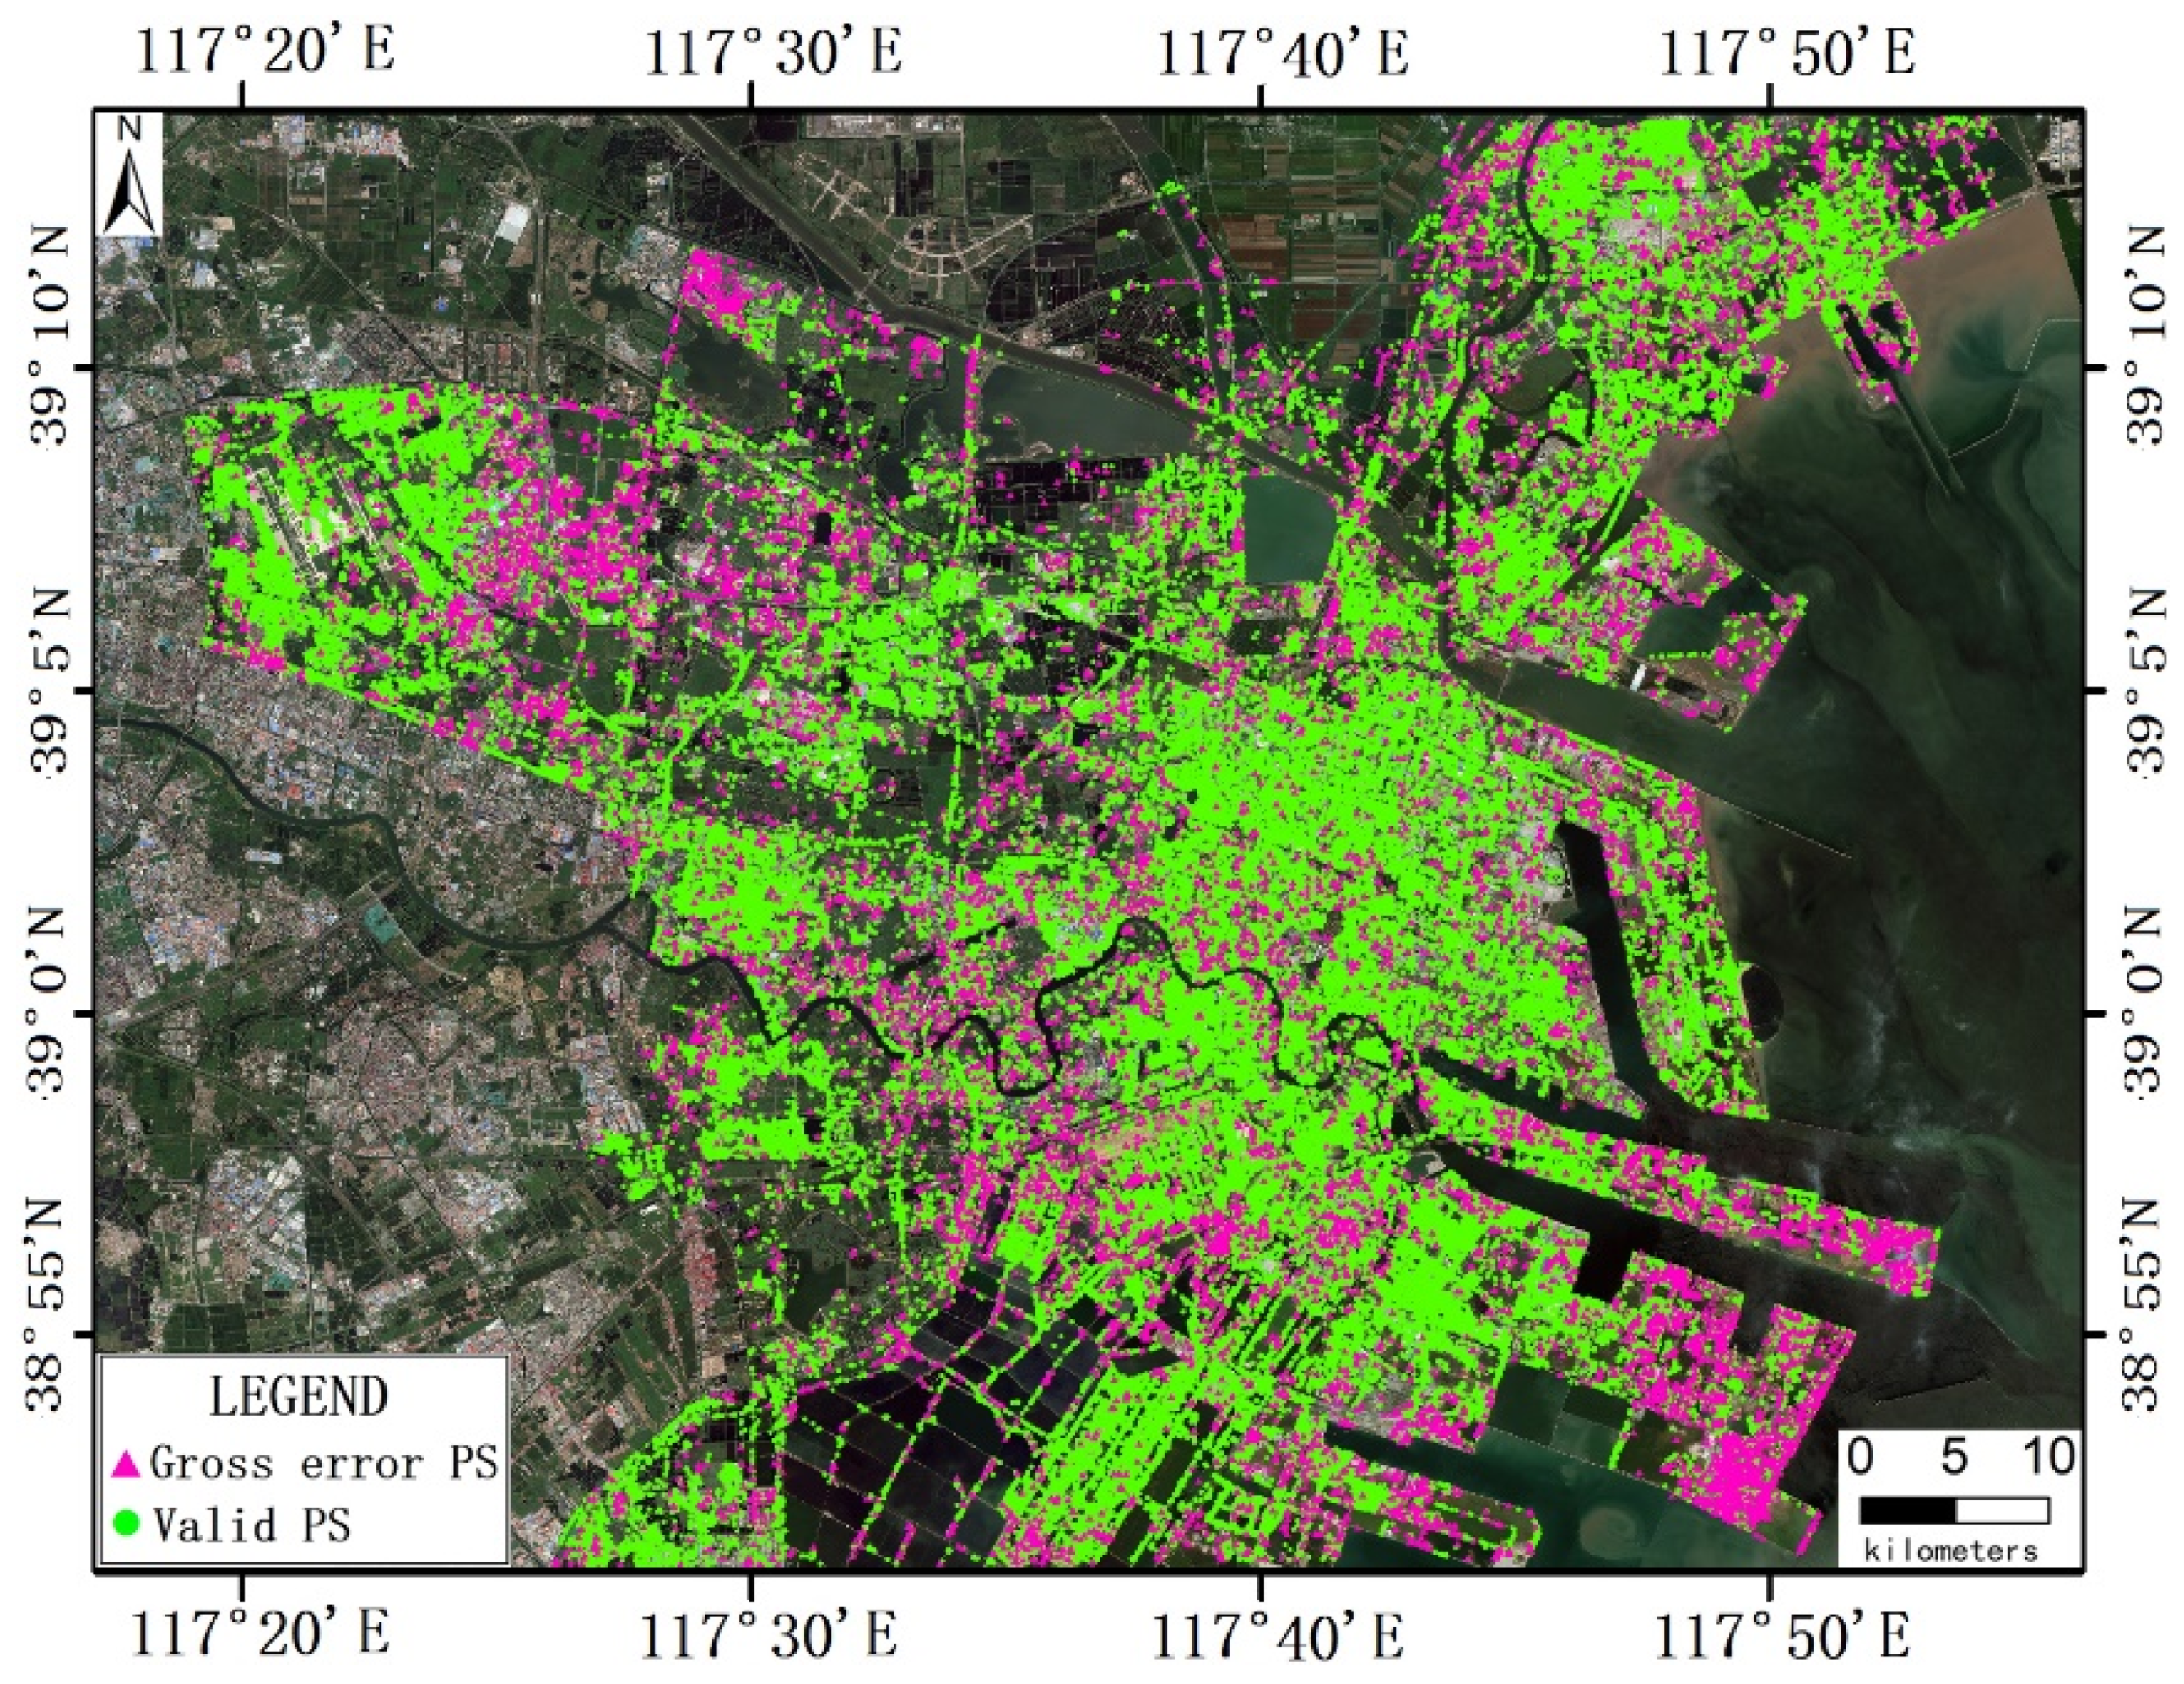
The robust LSA methodology was systematically applied to all homonymous PS sets within the study area that were observed on at least two occasions. A total of 17,316 PS sets were identified as containing gross errors, which constitutes 11.1% of the total number of homonymous PS sets. As illustrated in Figure 11, these errors demonstrate a non-random spatial distribution, suggestive of underlying geophysical or environmental factors that may be influencing the stability of the phase measurements.
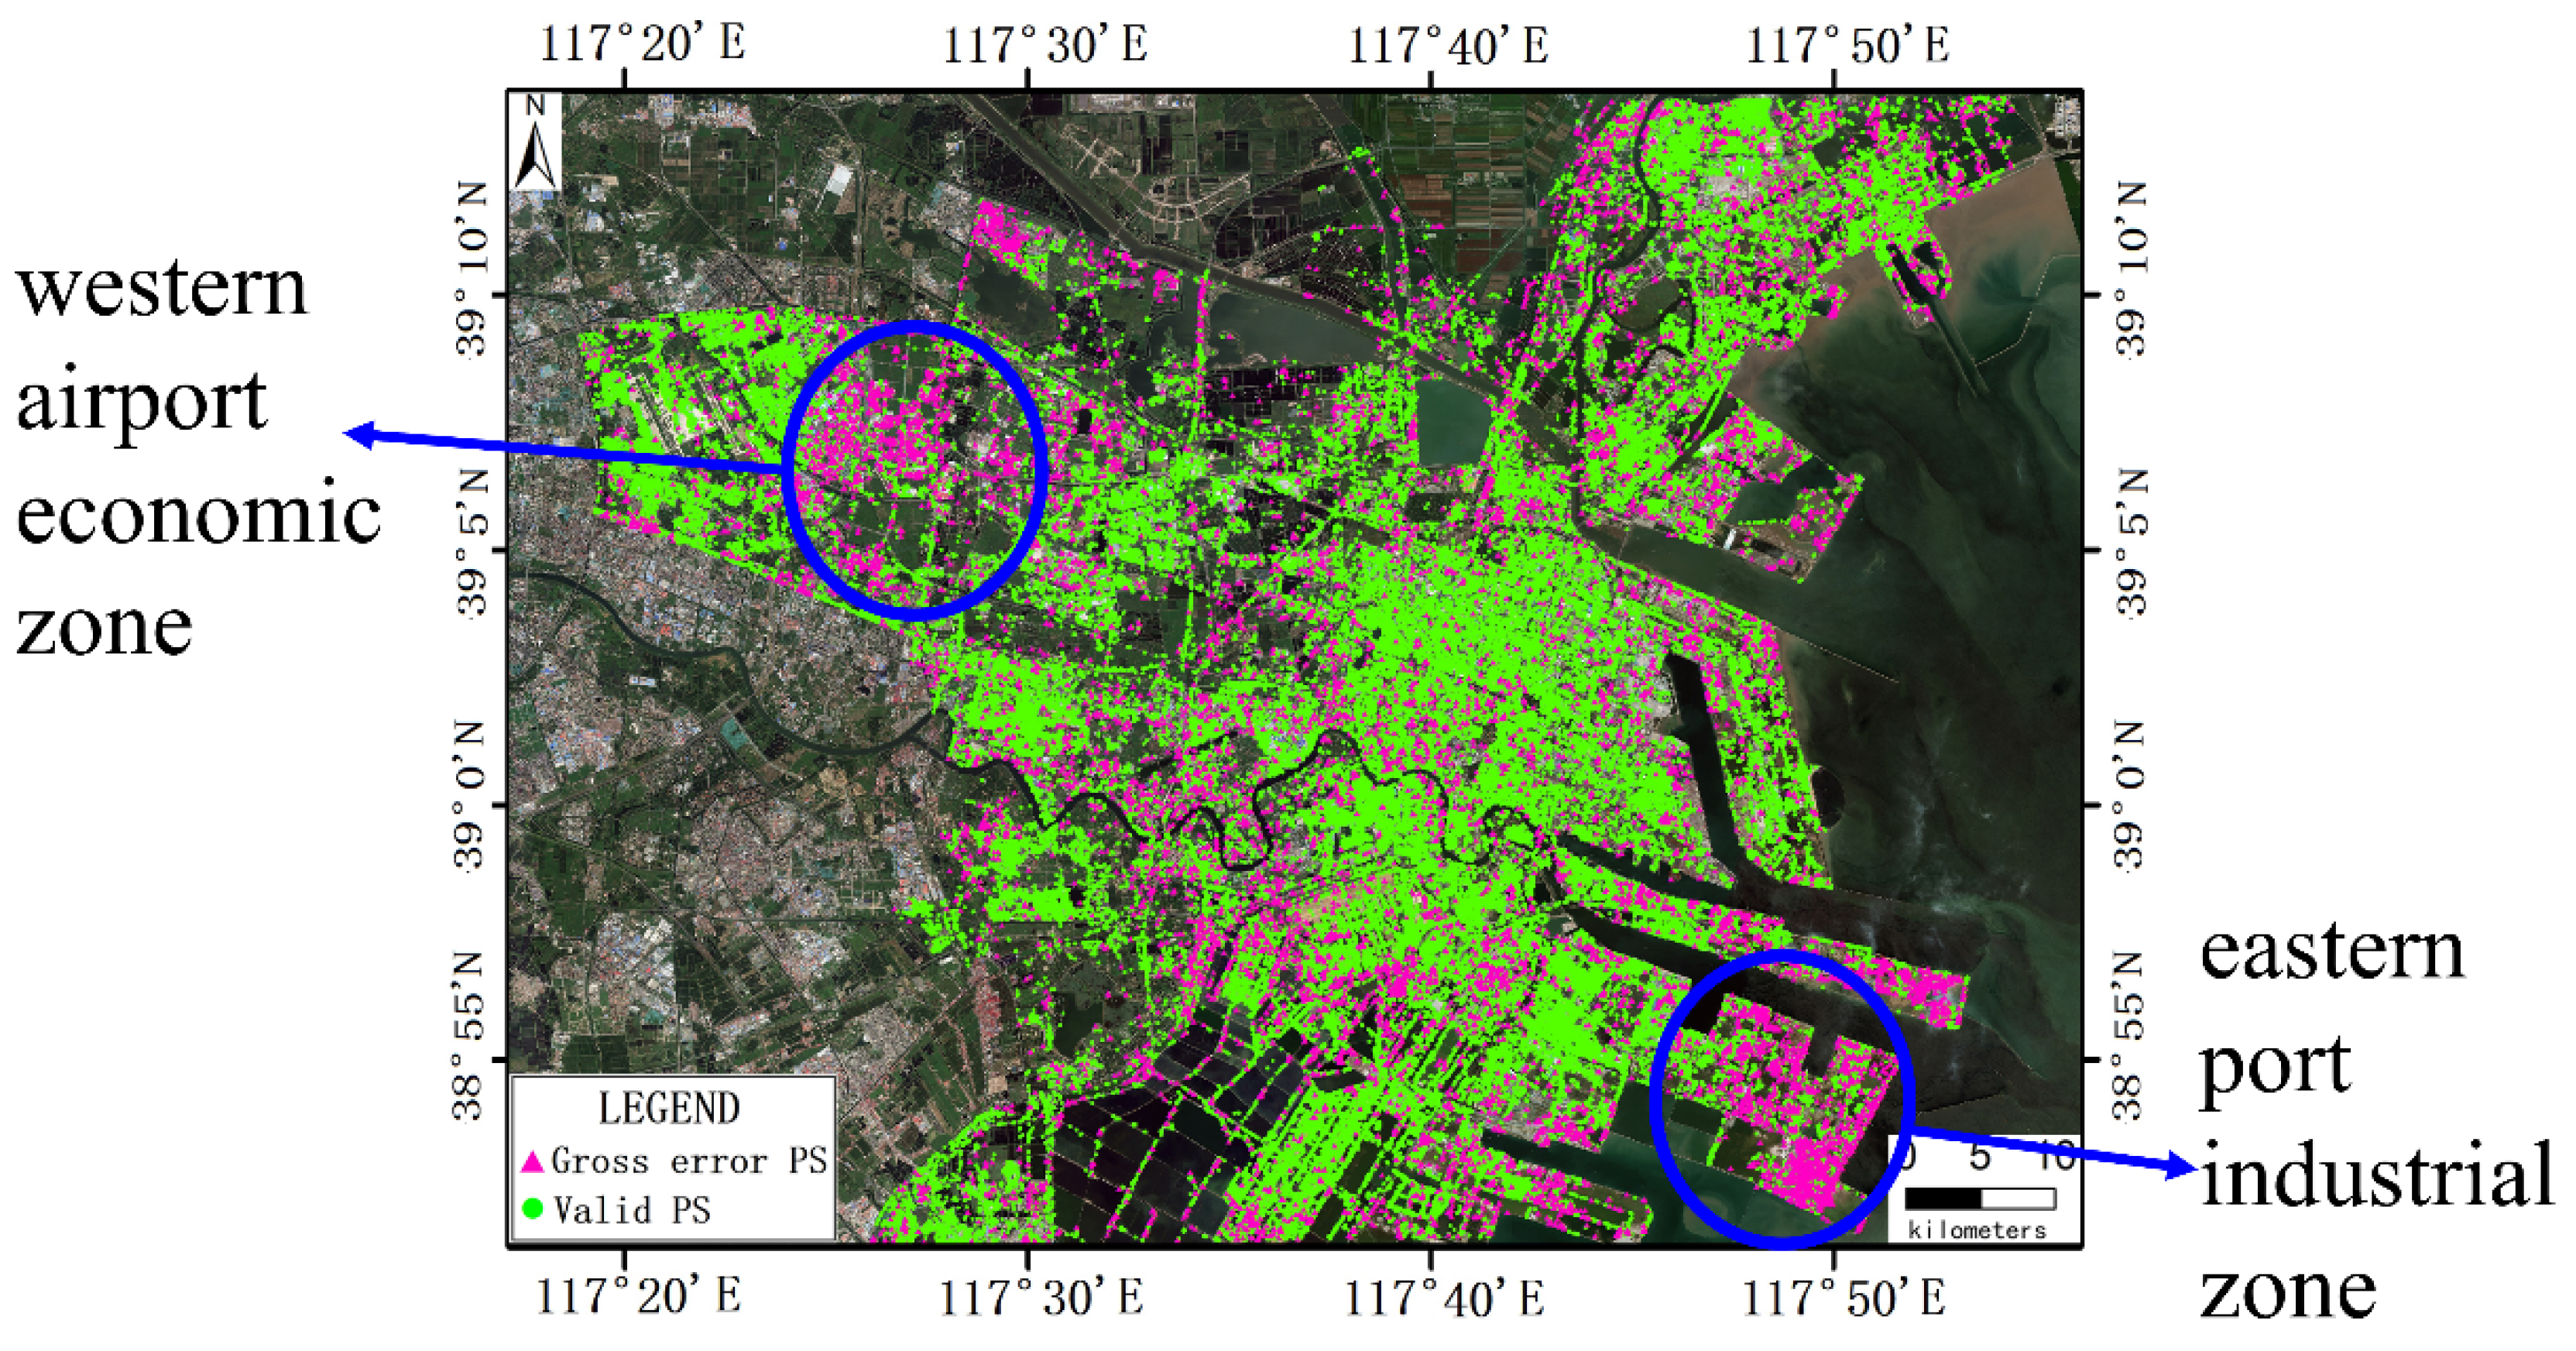
Significant concentrations of gross errors were prominently observed within the eastern Port Industrial Zone and the western Airport Economic Zone, as delineated by two blue ellipses in Figure 12. These areas were characterized by complex urban structures, frequent human activity, and the potential existence of subsurface infrastructure, all of which may contribute to localized displacement and phase instability. Additionally, a smaller yet noteworthy number of gross errors were distributed across suburban regions and areas with dense building infrastructure. Such patterns indicate that the presence of anthropogenic structures and alterations in land-use may play a critical role in the generation of phase inconsistencies.
These findings emphasize the necessity of incorporating GED methods into regional-scale InSAR analyses that account for spatially varying factors. This was particularly pertinent in heterogeneous environments where the impact of local factors on phase stability must not be underestimated. The implications of the spatial distribution of gross errors will be further investigated in Section 5, which will analyze the relationship between land-use characteristics and displacement behavior in greater detail.
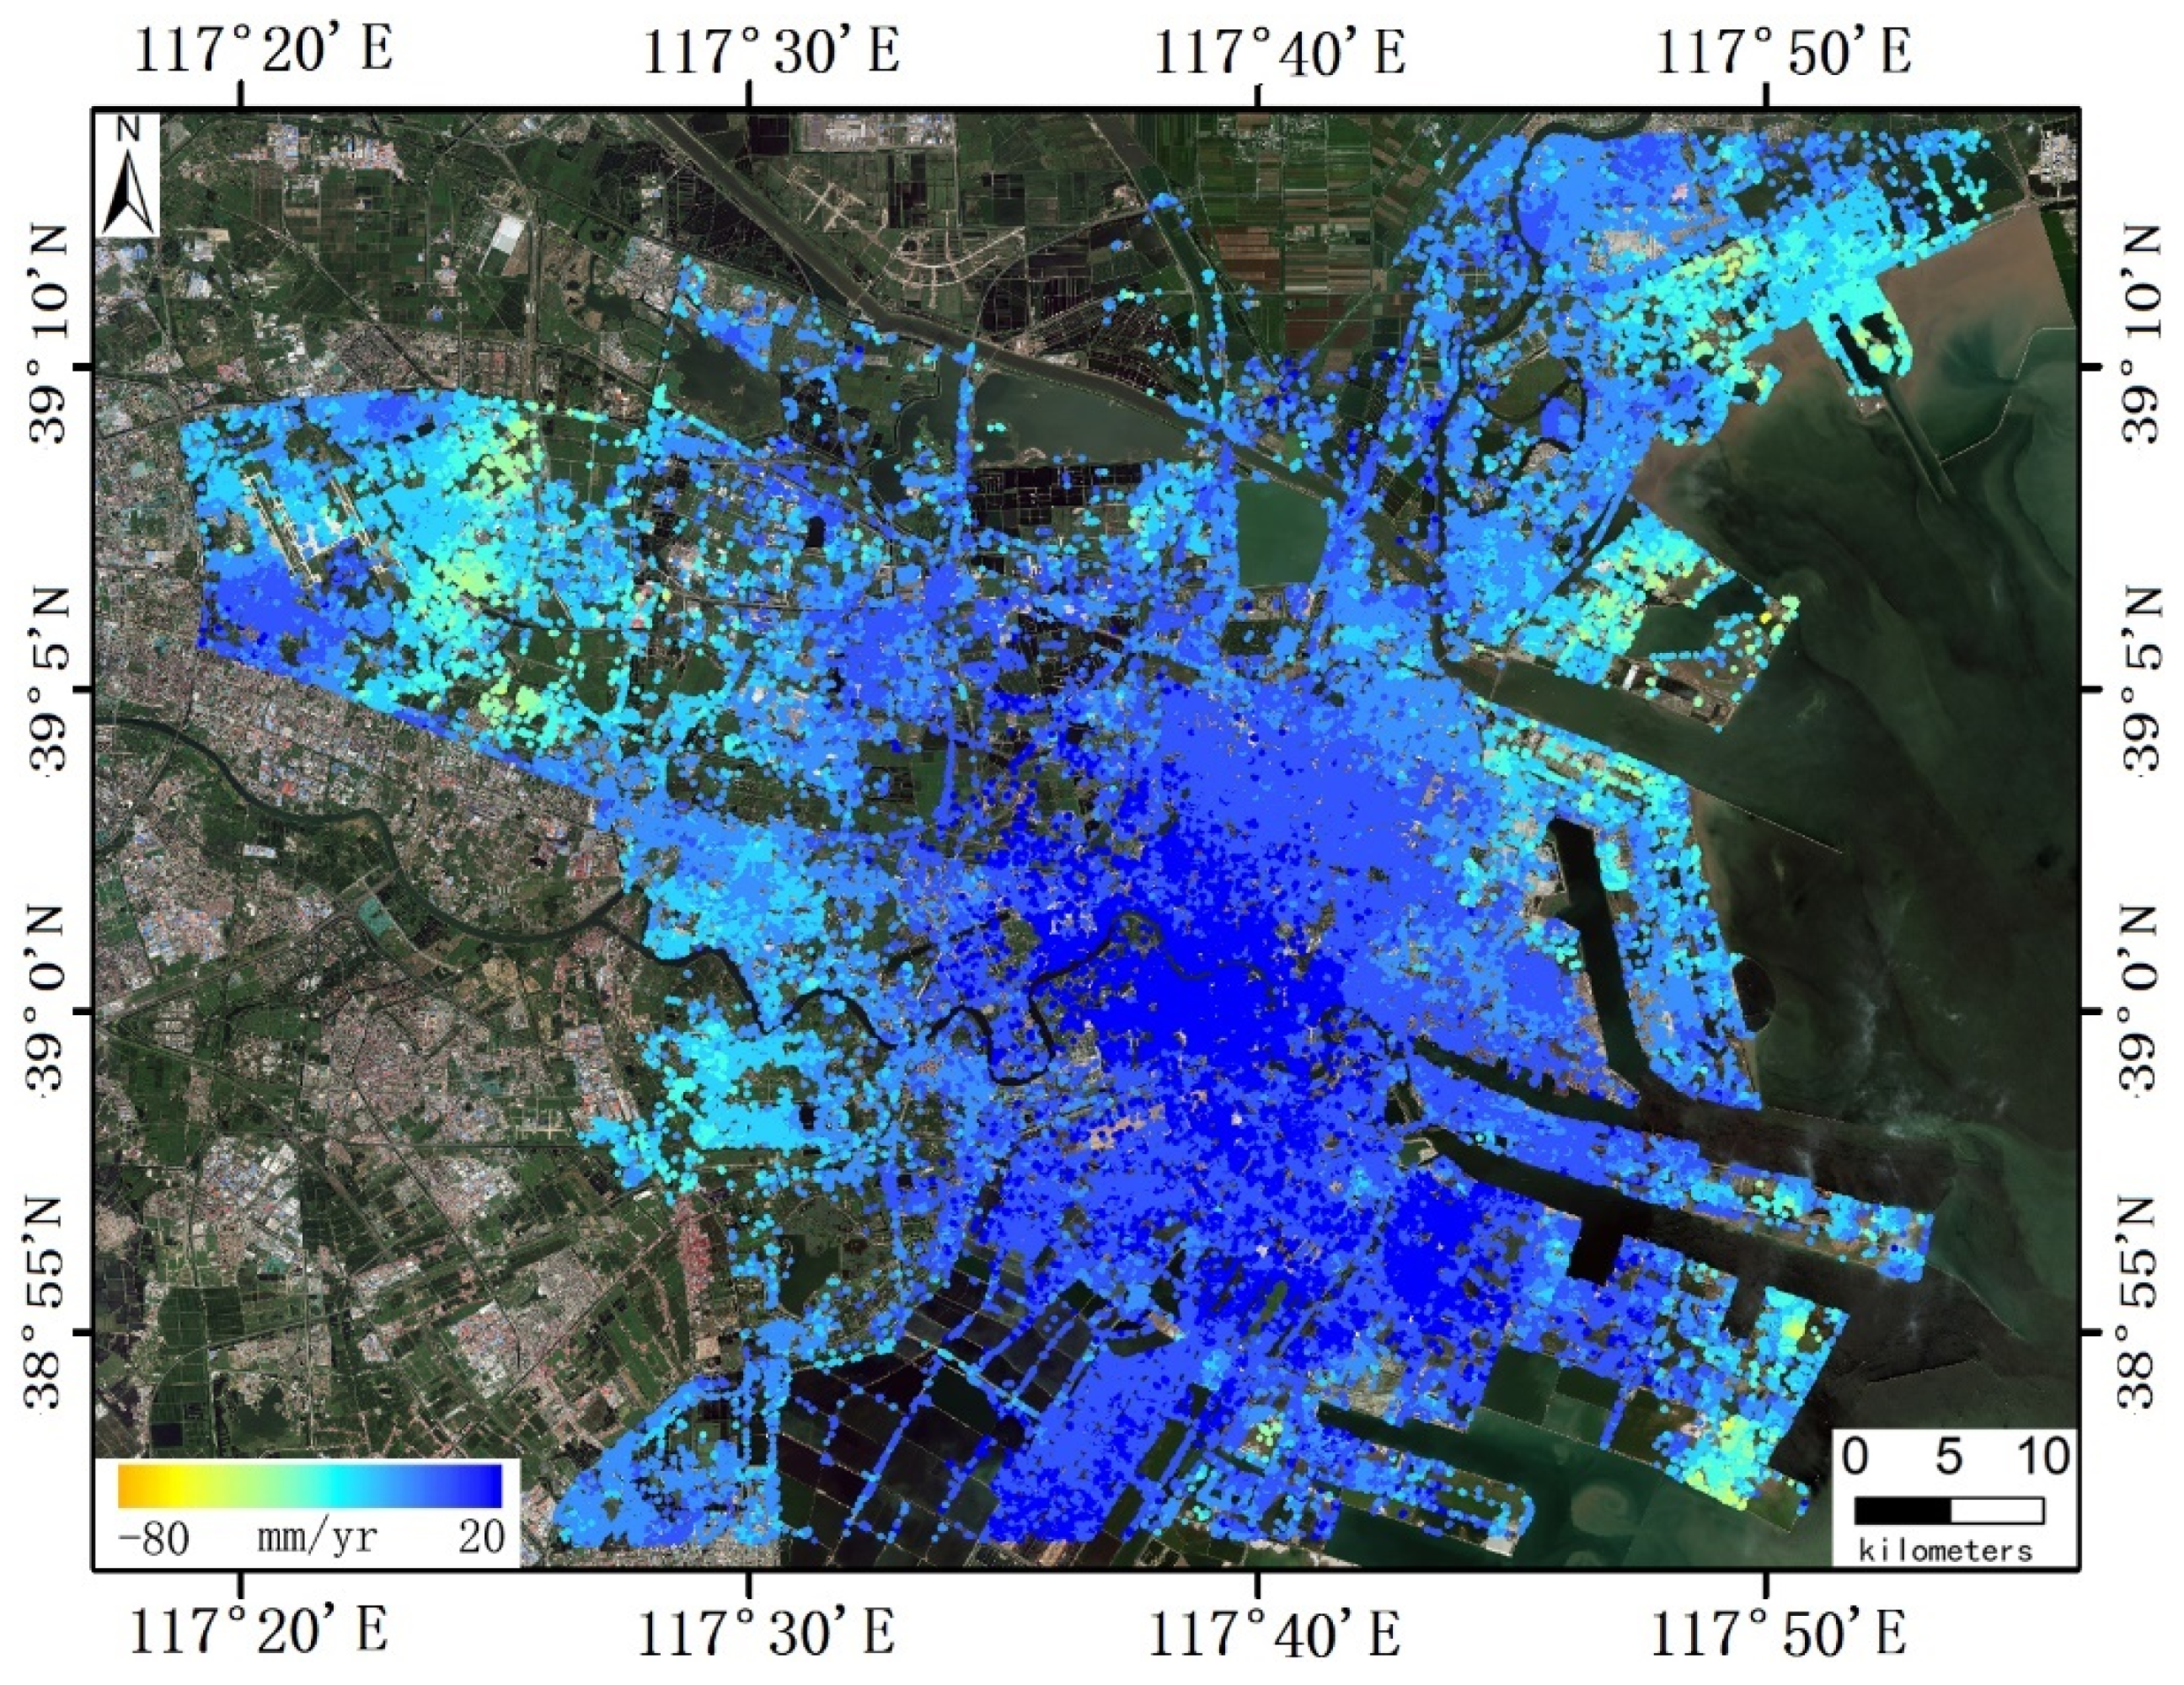
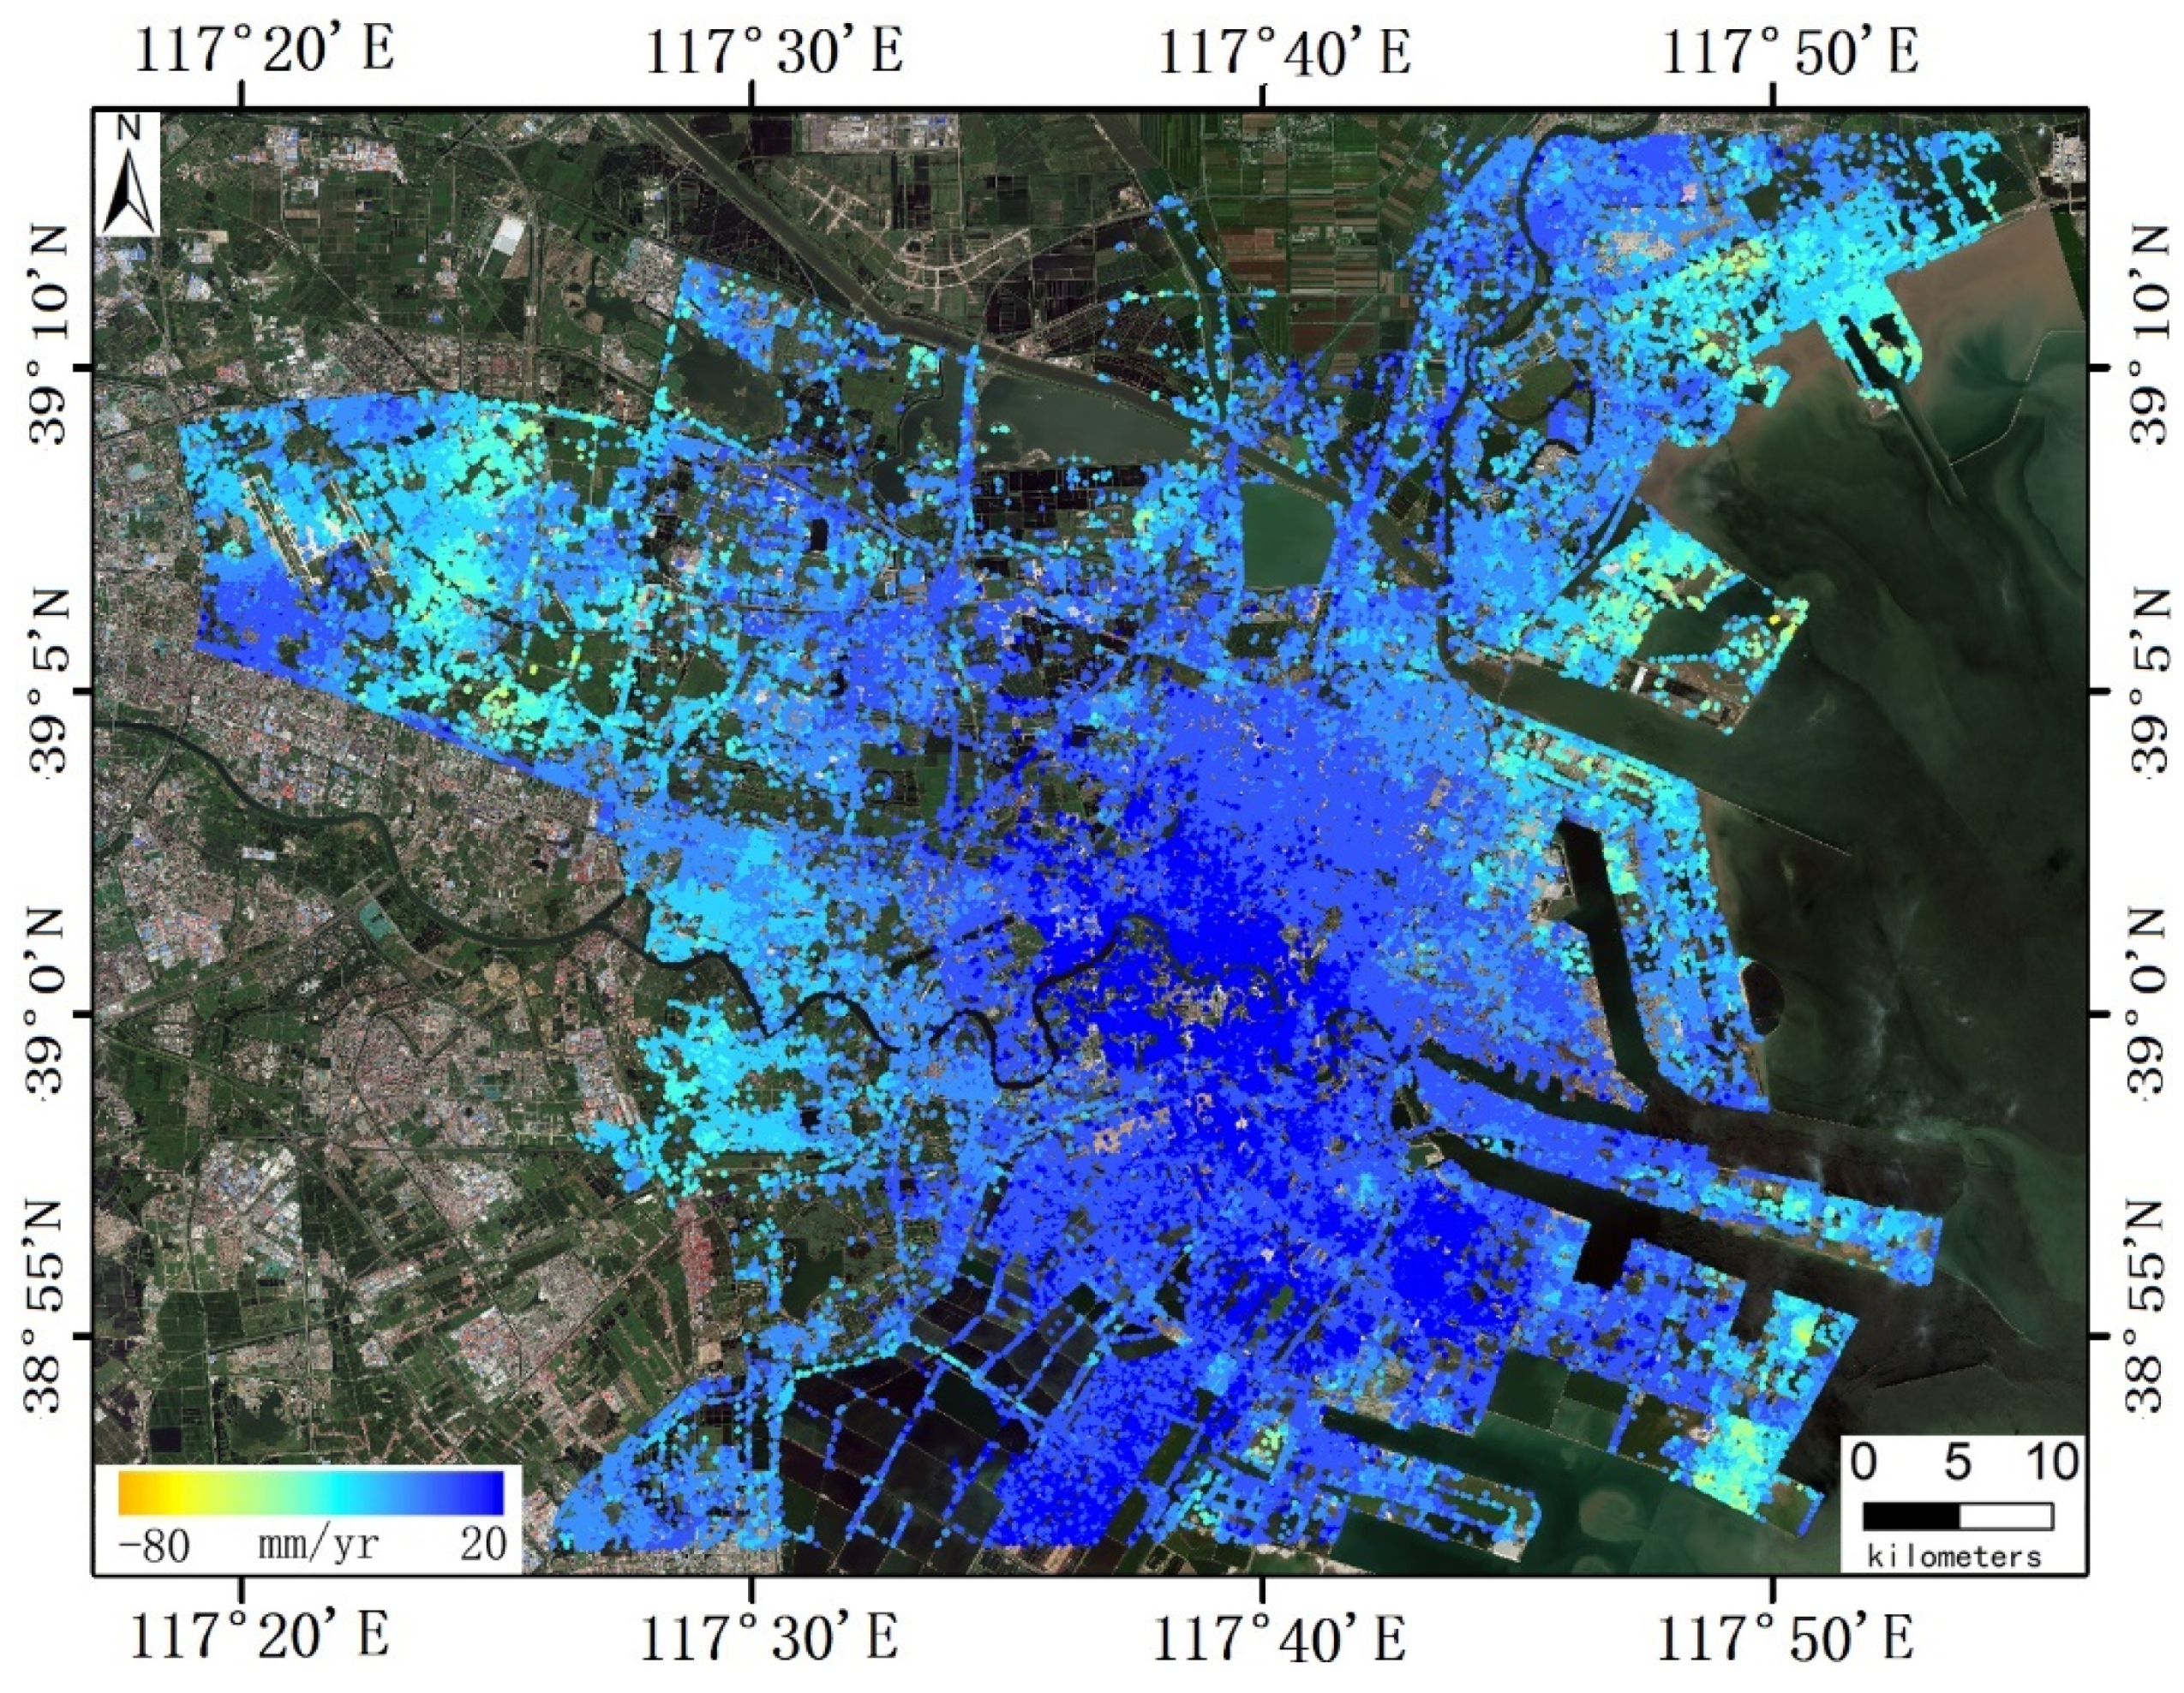
Following the removal of gross errors, as depicted by the crimson purple triangle in Figure 11, the displacement rate results were derived utilizing the LSA method. The mean vertical velocity maps of the final geocoded displacements produced from the data fusion workflow with robust LSA were presented in Figure 13. The final PS density attained in this analysis was 108 points per square kilometer, which was deemed adequate for capturing spatially distributed displacement patterns with a high degree of precision. The color gradient, transitioning from orange to blue, represents vertical velocities, encompassing negative values of −80 mm/yr to positive values of 20 mm/yr. This range reflects a slight variation in the LOS displacement depicted in Figure 7. And as illustrated in Figure 13, significant vertical displacement was observed in the eastern coastal reclamation zones, corroborating findings from previous studies that identify reclaimed land as particularly vulnerable to vertical displacement due to the compaction of loose sediments and the lack of natural consolidation processes [46]. Moreover, the western Airport Economic Zone exhibited noticeable displacement, a phenomenon characterized by extensive urban development and infrastructure construction, which may exacerbate ground displacement through increased loading [47].

4.3.4. Validation of Region Displacement Results

In this study, the effectiveness of the proposed multi-source data fusion methodology incorporating robust LSA was critically evaluated using a dataset comprising high-precision leveling data, as illustrated in Figure 3. It is essential to recognize that InSAR and leveling techniques contrastingly differ in their measurement mechanisms and reference frames.
Given the inherent limitations in the availability of leveling data coupled with the spatial distribution of corresponding PS observations, two viable strategies for selecting relevant PS points in proximity to each leveling benchmark were employed in similar literature: the nearest neighbor (NN) and averaging methods. Both approaches yielded consistent outcomes, reinforcing their validity in the context of cross-validation [27].
For this analysis, the NN method was specifically chosen to emphasize the comparative results obtained before and after the implementation of robust LSA. To ensure the reliability of this method, a maximum search radius of 100 m was defined, aligning with the image resolution and multi-look factors pertinent to the utilized SAR datasets. Through the NN methodology, the closest PS point to each leveling benchmark was identified, thereby facilitating a robust cross-validation process, as supported by references [26,29].
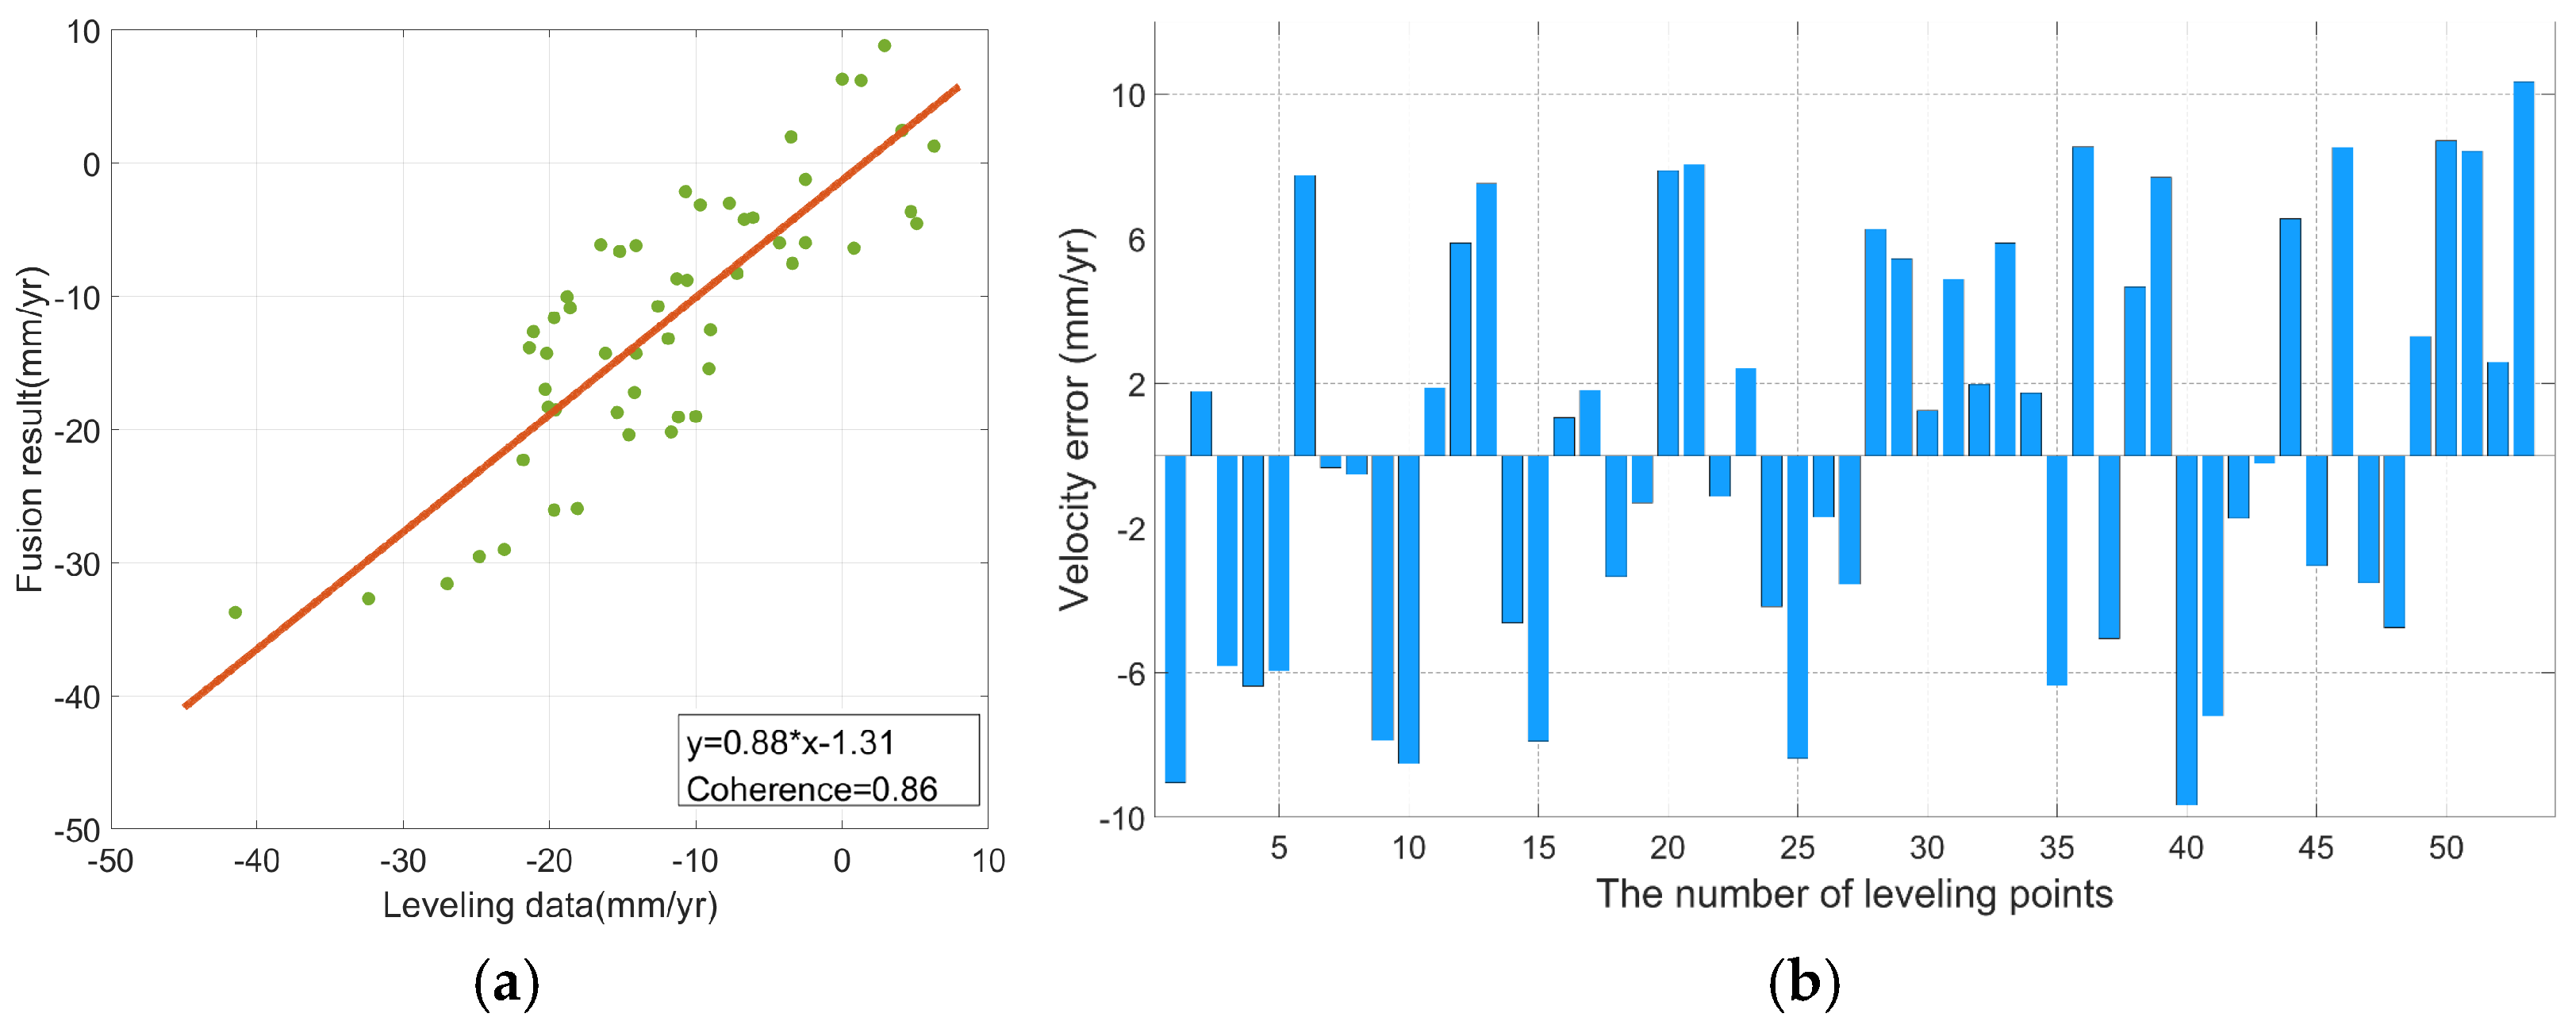
A total of 53 leveling points were selected for comparative analysis. The high-precision leveling data served as the reference standard against which the accuracy of the InSAR-derived vertical displacement rates was evaluated. The linear regressions of average subsidence rate are performed between fusion results and the leveling points as illustrated in Figure 14a. The correlation is 0.86, indicating good agreement between these two distinct measurements.
The error histograms (Figure 14b) by using these two methods are similar, ranging from −9.8 to 10.3 mm/year. It is notable that the subsidence rate range of this area is large, ranging from −80 to 20 mm/year. The maximum error recorded was 10.3 mm/yr at leveling point 53, situated in the eastern region, while the minimum error was 0.22 mm/yr at leveling point 43, located in northern China. The origin of errors in InSAR is multifaceted, primarily stemming from atmospheric phase delays, challenges associated with phase unwrapping, and varied terrain characteristics. An analysis of the terrain and environmental conditions surrounding points 53 and 43 reveals notable differences that significantly affect InSAR coherence and accuracy. Specifically, point 53 is situated near the coastline and is heavily influenced by atmospheric conditions, resulting in notable variability in the phase measurements. The presence of a vast grassland in the vicinity further contributes to reduced InSAR coherence in this area, leading to diminished accuracy in monitoring efforts. In contrast, point 43 benefits from its distance from the coast, which minimizes the potential for atmospheric disturbances. Additionally, being located within a village characterized by numerous low-rise structures, this point exhibits higher overall InSAR coherence. These favorable conditions enhance the accuracy of monitoring at point 43 relative to point 53. It is also important to consider that leveling measurements, which are intended to serve as ground truth reference points, inherently contain their own set of measurement errors [12]. This intrinsic variability further exacerbates the discrepancies observed in the error analysis between the two points. Thus, the considerable differences in error values between points 53 and 43 can be attributed to a combination of environmental factors, coherence issues, and the limitations of ground truth measurements.
By incorporating the error values from these 53 points into the calculations for measurement error statistics, a Root Mean Square Error (RMSE) value of 5.7 mm/yr was derived, which is similar to the values reported in previous studies with TS-InSAR analyses [25]. Moreover, the evaluation results depicted in Figure 14 correspond closely with the visual quality of the subsidence rate map illustrated in Figure 13. This correlation further substantiates the assertion that the deformation rates obtained from the three SAR datasets are generally accurate. Additionally, it reinforces the reliability of the multi-source data fusion workflow employing robust LSA.

5. Discussion

5.1. Performance Validation Against Traditional OLS

5.1.1. The Result of Traditional OLS

To rigorously evaluate the efficacy of the proposed multi-source data fusion methodology with robust LSA, a comparative analysis was conducted alongside the traditional OLS, which was extensively utilized in InSAR applications owing to its simplicity and computational efficiency [24]. In this study, the OLS method, implemented in conjunction with a multi-sensor InSAR data fusion model, was directly applied to three distinct SAR datasets: R2D, S1A, and S1D. The results obtained prior to any coarse error correction were presented in Figure 15.

5.1.2. The Difference Between Robust LSA and OLS

A comparative analysis of Figure 13 and Figure 15 reveals that the overall spatial patterns of displacement exhibited consistency across both methodologies employed. However, significant discrepancies were apparent in localized areas, as displayed by the numerous gross errors presented in Figure 11 and Figure 12. Considering the spatial arrangement of leveling points shown in Figure 3, along with the distribution of gross errors depicted in Figure 12, the Airport Economic Zone illustrated in Figure 16a, which was marked by a higher density of both leveling points and gross errors, was selected as a representative area for the comparative evaluation of the two methods. The results generated by the data fusion method with robust LSA were displayed in Figure 16b, while the outcomes of the OLS methodology for the same region were presented in Figure 16c. Both sets of results demonstrate a coherent spatial distribution, characterized by pronounced vertical displacement in the eastern region and comparatively diminished vertical displacement in the western region.
To further evaluate the performance of the two methodologies, eight benchmark points with numbers as their ID were used within the Airport Economic Zone, as illustrated in Figure 17. These points were subjected to analysis utilizing high-precision leveling data as the ground truth to assess the accuracy of results derived from both measurement from proposed data fusion method with robust LSA and traditional OLS result. The NN method was employed for this analysis, consistent with standard validation protocols in geodetic and remote sensing research, where in situ measurements were considered the most reliable reference point [29].
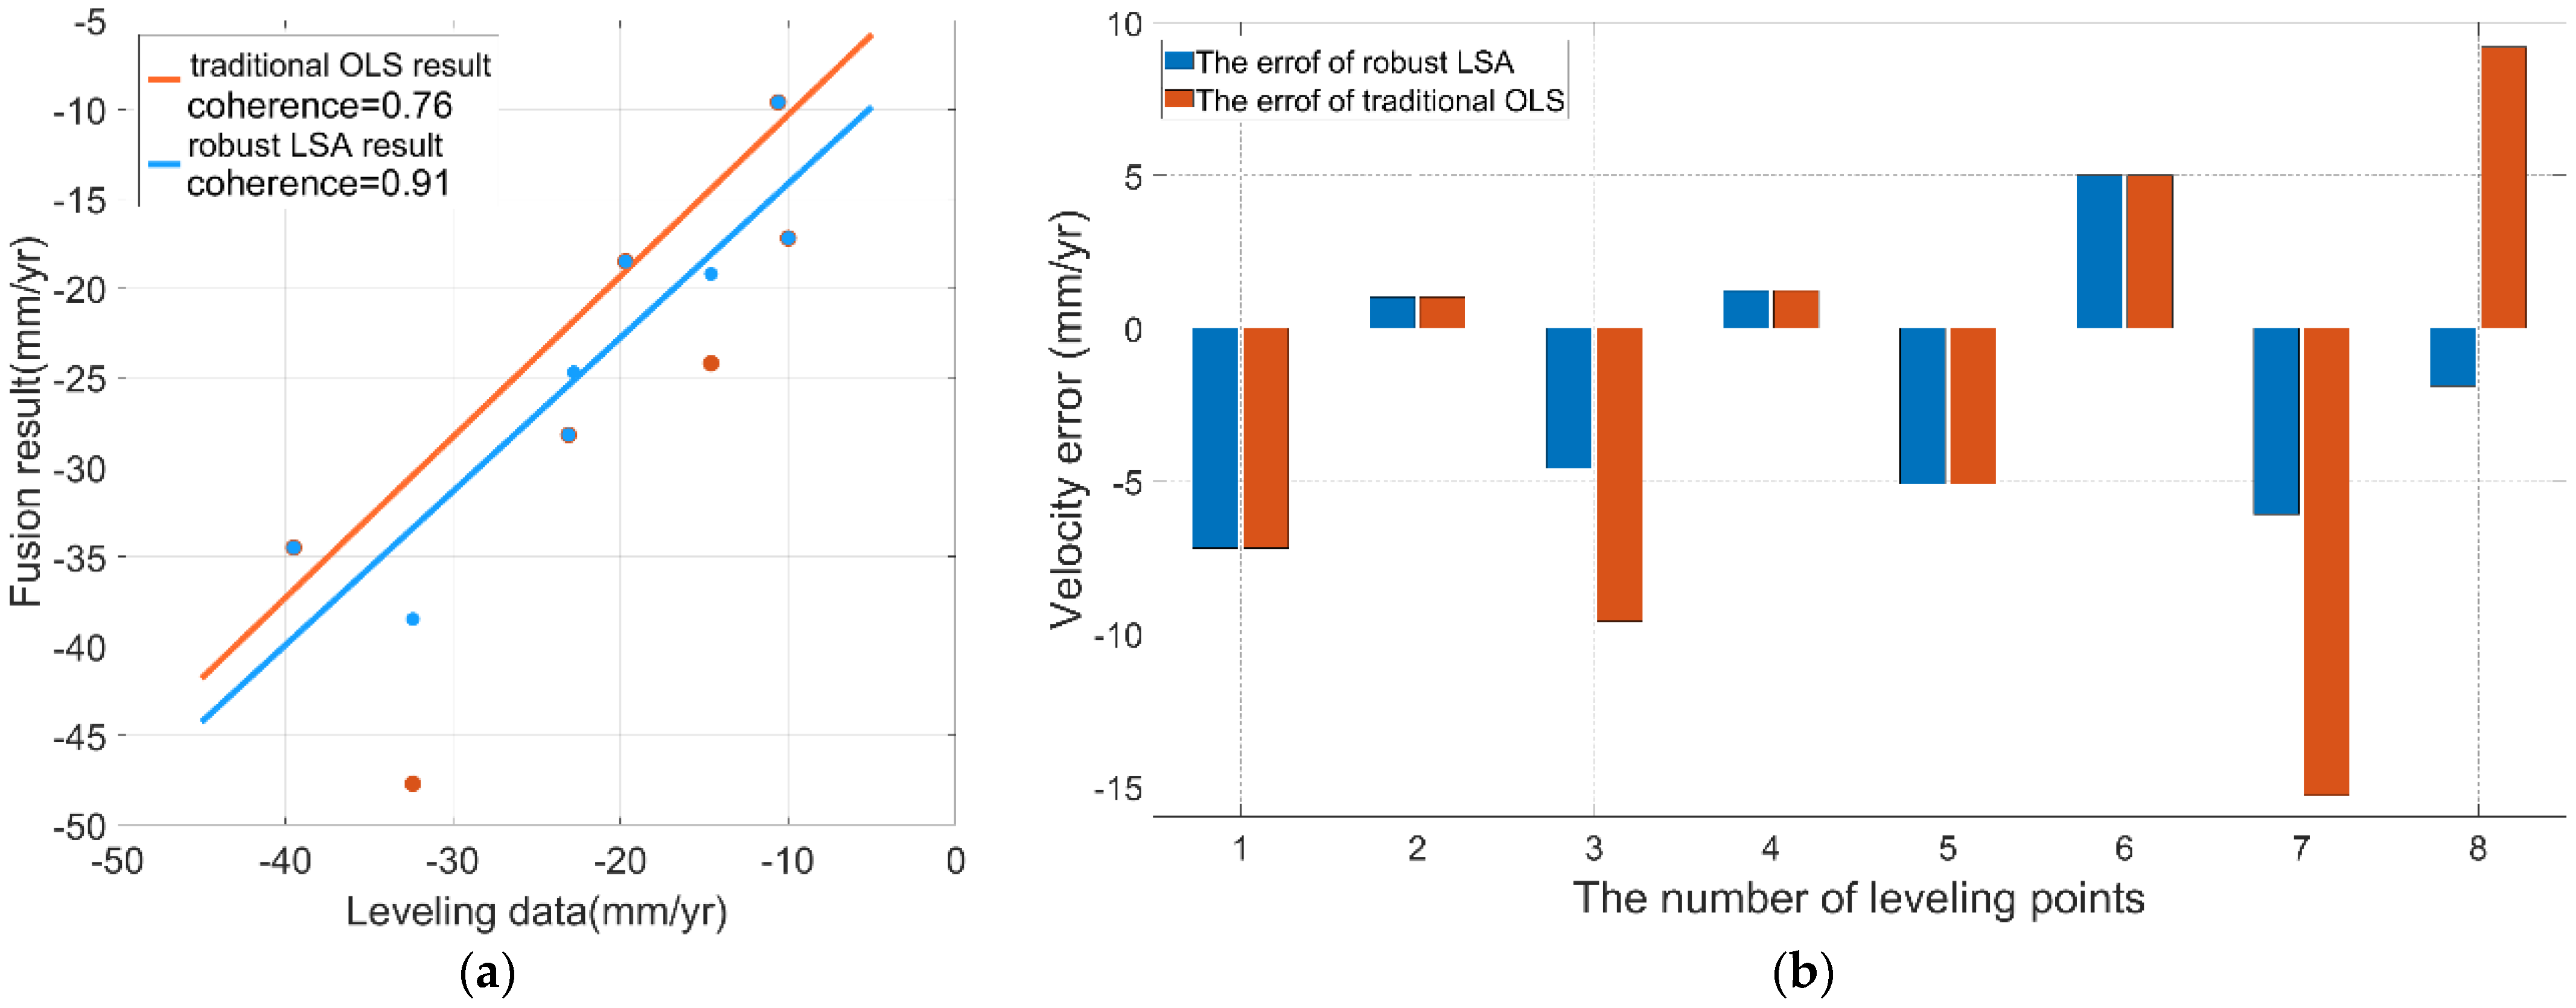
The linear regressions of average rate are performed between fusion results and the leveling points as illustrated in Figure 18a. The error histograms using these two methods are displayed in Figure 18b. The findings suggest that the proposed data fusion method with robust LSA exhibits significantly greater accuracy compared to the traditional OLS method. This enhancement was evidenced by several critical factors: (i) the maximum error of the proposed method was 7.2 mm/yr, in contrast to a maximum error of 15.3 mm/yr observed with the OLS method. This notable reduction in the upper error bound implies a more reliable estimation of displacement rates when utilizing data fusion method with robust LSA; (ii) the RMSE for the proposed method was 4.6 mm/yr, compared to 8.0 mm/yr for the OLS method. A lower RMSE value signifies a greater concordance between the estimated displacement values and the reference data, thereby indicating enhanced precision; (iii) the correlation coefficient between the high-precision leveling data and the outcomes of the proposed method was 0.92, whereas the correlation coefficient for the OLS method was only 0.76. This improvement in correlation further reinforces the assertion that the proposed method offers a more reliable representation of the actual displacement field.
These quantitative comparisons demonstrate that the data fusion method with robust LSA proposed in this study achieves superior accuracy compared to traditional OLS approaches, by effectively mitigating outliers arising from phase unwrapping failures. This improved performance is especially significant in complex environments, where multiple error sources may severely degrade the quality of InSAR-derived displacement maps.

5.1.3. The Time Series Analysis of Typical Set

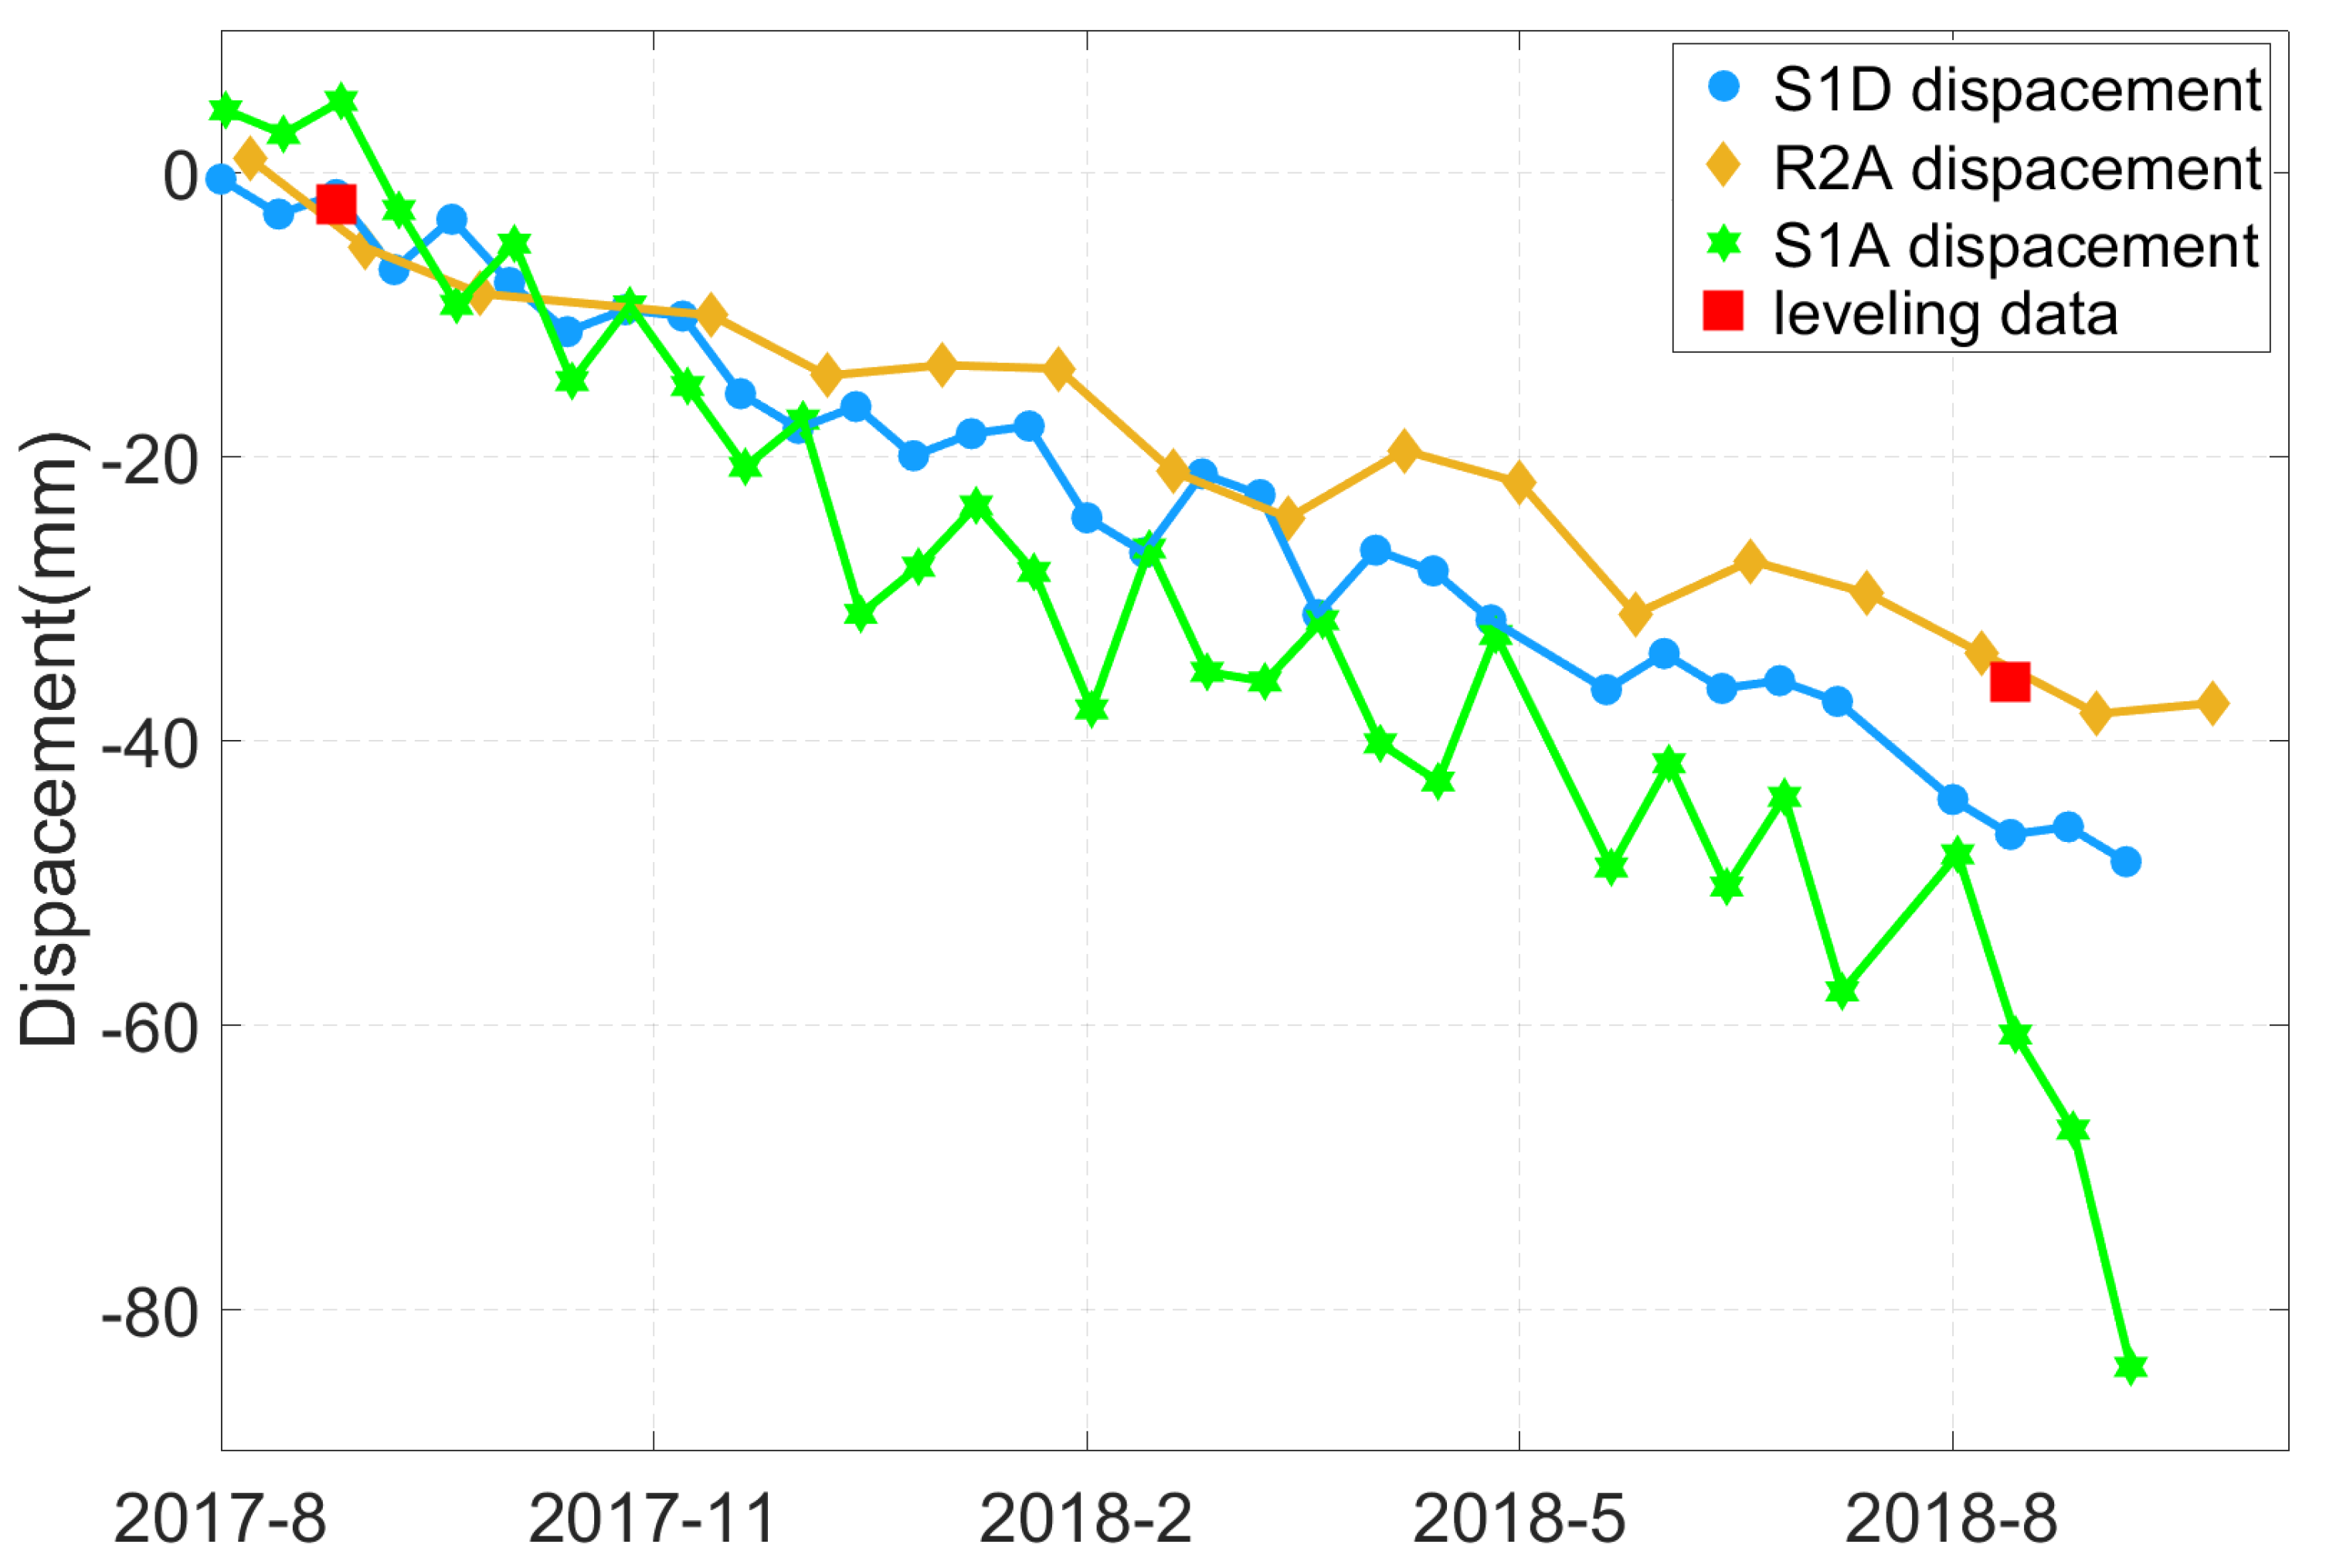
In the context of our investigation into data fusion with robust LSA, we specifically focus on typical PS set situated within the Airport Economic Zone. This PS set exhibits an error rate of 15.3 mm/yr in Figure 18b, which we further analyze through time series monitoring results derived from the integration of three distinct time series and benchmark leveling measurements from nearby point (Figure 19).
The S1D and R2A time series, illustrated in blue and yellow, respectively, display a relatively stable behavior that closely aligns with linear displacement trends corroborated by the leveling measurements. In stark contrast, the S1A time series reveals considerable non-linear deformation, particularly evident in the latest image taken on 18 September 2018. This significant non-linear behavior is predominantly attributed to artifacts resulting from phase unwrapping errors.
A comparative analysis among the three SAR time series originating from the same PS set reveals a noteworthy correlation between the non-linear deformation captured in S1A and the linear motion patterns represented in R2A and S1D. However, the amplitude of deformation in S1A is markedly greater than that observed in R2A and S1D. When juxtaposed with the actual leveling data, the discrepancies in the deformation derived from S1A approach nearly 50 mm. This substantial deviation underscores the inadequacy of relying solely on S1A for precise deformation monitoring.
These findings underscore the necessity of implementing robust adjustment methodologies, as proposed in this study. Sole reliance on traditional OLS techniques or a singular focus on the S1A analysis could engender erroneous conclusions regarding significant non-linear deformation. Such misinterpretations may wrongfully attribute observed deformations to external influences, such as construction activities, thereby compromising the integrity of ground subsidence mitigation strategies.
In conclusion, our study about time series analysis reinforces the critical role of multi-source InSAR data and advanced adjustment techniques in accurately detecting coarse errors within deformation monitoring. The implications of these findings extend beyond the immediate study site, providing valuable insights for future research and practical applications in similar geographical contexts.

5.2. Robust LSA Analysis Across Distinct Regions

5.2.1. Reliability Parameters

The identification of gross errors represents a critical component in ensuring the robustness of geodetic and remote sensing data processing [29,30,31,32], particularly within the framework of multi-source InSAR data integration [19]. To enable a quantitative evaluation of data consistency and integrity, reliability parameters that encompass both internal and external reliability indicators are proposed, in accordance with Baarda’s reliability theory [29,30,31,32].
(1) Internal Reliability Parameters
Internal reliability is defined as the capacity of survey adjustments to detect model errors, which include both systematic and gross errors. In accordance with Baarda’s theory [29,30,31,32], the minimum detectable gross error 0 L i for a specific observation L i can be determined through statistical testing, as represented by Equation (15), wherein δ 0 denotes the test statistic parameter [29,30,31,32].
0 L i = δ 0 r i δ L i
The internal reliability index, as delineated in Equation (15), encompasses both precision and reliability components. To enhance the interpretability of reliability, we use a redefinition of a controllability value δ 0 , i , as articulated in Equation (16). Owing to its unit independence, this metric serves as an effective tool for comparative analysis across a variety of datasets.
δ 0 , i = δ 0 r i
(2) External Reliability Parameters
In contrast, external reliability evaluates the impact of undetectable model errors on the estimated parameters of the surveying adjustment [29,30,31,32]. In accordance with Baarda’s theoretical framework, the effect of an unobservable gross error δ ¯ 0 , i on the adjustment unknowns can be quantified through the length of the influence vector, as mathematically represented by Equation (17).
δ ¯ 0 , i = δ 0 1 r i r i

5.2.2. Methodology for Calculating Reliability Parameters

Considering the limited number of unknowns typically resolved by the multi-sensor InSAR data fusion model, as discussed in Section 3.1, straightforward methodologies can be readily utilized to calculate the redundancy observation components. Employing this approach, both internal and external reliability indicators can be derived using Equations (16) and (17), respectively.
Assuming specific selections of statistical parameters, including the significance level α 0 = 0.1 % and testing efficacy β 0 = 80 % , the non-centralized parameter δ 0 can be calculated as delineated as 4.13. Subsequently, the controllability value δ 0 , i , which reflects internal reliability, can be directly derived using Equation (18).
δ 0 , i = 4.13 r i
Similarly, the length of the influence vector δ ¯ 0 , i , which encapsulates external reliability, can be computed as Equation (19):
δ ¯ 0 , i = 4.13 1 r i r i
Due to the relatively uniform reliability observed within the region, the formula for calculating the average redundancy component r ¯ is presented in Equation (20) [29,30,31,32].
r ¯ = r i n
where n indicates the number of homonymous PS sets. r i represents the number of redundancy components associated with the i -th homonymous PS set. Utilizing Equation (6) for the homonymous PS sets categorized as “R2D_S1D_S1A” in Figure 9, the computed redundancy value of r i is 0.67. For the homonymous PS sets classified as “R2DS1D2/R2DS1A2”, the redundancy value of r i is recorded at 0.5. In contrast, for the homonymous PS sets designated as “unmatched”, the redundant value amounted to 0.
By substituting this reliability value into Equations (16) and (17), the regional average internal reliability parameter δ 0 and the average external reliability parameter δ ¯ 0 can be derived for subsequent analyses utilizing Equations (18) and (19).
δ 0 = 4.13 r ¯
δ ¯ 0 = 4.13 1 r ¯ r ¯

5.2.3. Analysis of Reliability Parameters Between Distinct Regions

To evaluate the reliability of multi-source InSAR data fusion, representative urban and suburban regions were selected for the comparative analysis of reliability parameters, as illustrated in Figure 20 and Figure 21, respectively. The results of this analysis provide valuable insights into the performance of the robust LSA algorithm across diverse land types.
Figure 20 and Figure 21 present the spatial distribution of homonymous PS sets configurations. In urban zones, the predominant classification of PS sets was classified as “R2D_S1D_S1A”, whereas in suburban areas, a significant portion of PS sets were categorized as either “unmatched” or “R2DS1D2/R2DS1A2.” The reliability metrics, derived from the homonymous PS sets, were systematically calculated for both urban and suburban regions and were summarized in Table 2. The second column represents the regional average redundancy component, the third column provides the internal reliability value, and the fourth column specifies the external reliability parameter.
As shown in the second column, the average redundancy component r ¯ in urban areas was 0.56, which was 2.15 times higher than that observed in suburban areas. This significant difference can be primarily attributed to the higher density of PS in urban environments, which enhances the likelihood of identifying many homonymous PS sets. In contrast, suburban areas were characterized by lower coherence and sparser ground targets, thereby limiting the opportunities for homonymous PS sets. Consequently, both internal and external reliability indicators exhibit better performance in urban areas when compared to their suburban counterparts.
Moreover, focusing on the relatively reliable urban areas, further comparisons were conducted in this paper between scenarios utilizing a single InSAR dataset and those employing three InSAR datasets, as illustrated in Table 3. When only a single SAR dataset was available, the number of redundant observations in urban areas was zero, which corresponds to the minimum required observations, thereby resulting in infinite internal and external reliability indicators. Upon transitioning from a single SAR dataset to the fusion of three datasets, a significant improvement in reliability was observed, with the internal reliability parameter in urban areas decreasing to 8.1 and the external reliability parameter dropping to 4.0. This outcome underscores the effectiveness of the methodology proposed in this study in enhancing the reliability of InSAR monitoring results.

5.2.4. Analysis of GED Results Between Distinct Regions

Building upon the computation of reliable parameters outlined in the preceding section, a comparative analysis was conducted to evaluate the performance of gross margin recognition in urban and suburban areas, as depicted in Figure 22. This analysis aims to provide a systematic assessment of the spatial variability in robust LSA outcomes, thereby offering insights into the effectiveness of the proposed methodology under different land-use conditions.
In the urban setting illustrated in Figure 22a, a total of 101 PS sets were identified as containing gross errors, representing 7% of the corresponding homonymous PS sets. By contrast, as presented in Figure 22b, 79 PS sets were detected with gross errors in suburban areas, accounting for 32% of the homonymous PS sets. The markedly lower gross errors rate observed in urban areas, when compared to the significantly higher rate in suburban regions, indicates a 25% difference in gross margin ratios between these two distinct spatial contexts.
The integration of robust LSA parameters from these two regions for a comprehensive analysis reveals a higher prevalence of redundant observations in urban areas. Another plausible explanation was that PS sets in urban environments demonstrate enhanced phase stability, attributable to the dense distribution of targets, which in turn reduces phase unwrapping errors and diminishes the probability of gross errors. In contrast, the reduced number of redundant observations in suburban areas, combined with the sparse distribution of persistent scatterers and the lower coherence associated with the land cover types, increases the uncertainty in phase unwrapping, thereby making the surveying adjustment more vulnerable to errors [48]. This observation also provides an explanation for the relatively higher density of gross errors depicted in Figure 11 within suburban regions.

5.3. Limitations and Future Directions

In this study, a data fusion method with robust LSA method and corresponding workflow are proposed, utilizing multi-source InSAR data. The effectiveness of the proposed approach was demonstrated through validation using multiple sets of SAR data acquired from the Binhai New Area. Nevertheless, despite the promising results obtained, several limitations and shortcomings remain that necessitate further investigation and improvement in future research.
(1) In the context of data fusion for multi-source InSAR, this study emphasizes the critical role of robust LSA methods. The primary objective is to implement effective GED techniques that facilitate robust estimation processes, thus enhancing the accuracy and reliability of data integration from diverse sources. The methodology adopted in this research hinges on the assumption that uncertainties inherent to individual LOS velocity measurements are uncorrelated. Consequently, a diagonal variance-covariance matrix has been utilized. This specific choice is justified, as it does not significantly compromise the comparative analysis of performance metrics before and after the application of GED techniques. By employing a consistent weight matrix during least squares processing, we ensure a reliable and systematic evaluation of data fusion results.
Nonetheless, it is essential to recognize that in more intricate scenarios—such as those characterized by spatially correlated noise or complex, non-linear displacement patterns—the off-diagonal components of the variance-covariance matrix merit scrutiny. Taking these factors into account enables a more nuanced approach to estimating robust weights, which can lead to improved precision and a deeper mechanistic understanding of multi-source data fusion processes.
(2) A fundamental assumption underlying this investigation is that the LOS displacement was primarily attributable to vertical displacement. Accordingly, the methodology employed herein directly converts LOS displacement into vertical displacement for analytical purposes. Although this simplification may hold validity under specific conditions, it is essential to acknowledge that such an approach may inadequately represent the complexity of subsurface displacement mechanisms, particularly in areas where horizontal displacements are significant.
Moreover, the limited availability of in-orbit SAR data constrains opportunities for multi-temporal data acquisition over identical locations. In contrast to existing studies [23,24], this paper consolidates three distinct sets of SAR data that coincide temporally and spatially for the purpose of multi-source data fusion and proposes a robust LSA framework that is operationally viable. Nonetheless, the relatively small sample size, consisting of only three observation vectors, necessitates the integration of additional datasets within the proposed framework to enhance robust estimation capabilities with larger sample sizes and diverse viewing geometries.
The impending NASA-ISRO Synthetic Aperture Radar (NISAR) mission, alongside the growing Sentinel-1 data archive (which includes Sentinel-1C) [49,50], presents a substantial opportunity to acquire SAR data from various satellite tracks across the same region. This advancement will facilitate the integration of multi-geometry datasets, a methodology widely acknowledged as highly effective for reconstructing surface displacement patterns in vertical direction and east–west direction associated with subsurface geomechanical processes [23,24]. By leveraging an expansive array of diverse data sources, this study aims to achieve more precise estimations of both east–west and vertical displacements through the employment of a generalized robust LSA data fusion method. This approach will significantly mitigate the risk of misinterpretations and exclusions in geological hazard assessments [51], ultimately enhancing the reliability of coarse error detection in multi-source InSAR applications.
(3) This article primarily focuses on the fusion of multi-source data and the identification of gross errors from a post-processing standpoint, without addressing the underlying mechanisms responsible for the occurrence of such errors. High-precision monitoring outcomes and time-series analyses are attained through the direct integration and processing of heterogeneous data sources [16]. Future research would benefit from a more comprehensive investigation into the origins of gross errors, which could be further enhanced by incorporating supplementary environmental monitoring data.

6. Conclusions

This study addresses a critical challenge in TS-InSAR methodologies: the contamination of derived results by gross errors, particularly in the case of a small number of SAR datasets. To address this issue, we propose and develop a unified, reliability-driven fusion framework specifically designed for multi-source InSAR data, incorporating robust LSA. The principal contributions of this research are outlined as follows:
(1) A rigorous mathematical model and methodology for the fusion of multi-source InSAR data with robust LSA analysis was formulated. This framework introduces reliability parameters encompassing both internal and external reliability indicators, thereby establishing a theoretical foundation for the coherent integration and comprehensive analysis of heterogeneous datasets.
(2) A systematic data fusion with robust LSA workflow has been meticulously designed and implemented, incorporating three key components: MT-InSAR processing, the generation of homonymous PS sets, and an iterative Baarda’s data snooping procedure based on statistical hypothesis testing. This integrated workflow facilitates the concurrent identification of gross errors and the refinement of displacement parameters, thereby substantially improving the robustness and reliability of the data fusion process.
(3) The proposed workflow was rigorously validated using the Radarsat-2 and Sentinel-1 datasets within the complex and rapidly evolving Tianjin Binhai New Area. The experimental outcomes substantiate the efficacy of the methodology. Specifically, the robust LSA approach successfully identified and eliminated 11.1% of homonymous PS sets affected by gross errors. More notably, the displacement estimates derived from robust LSA and traditional OLS achieved a high level of accuracy, with an annual displacement rate of 5.7 mm/yr when compared to leveling validation data. Furthermore, a localized analysis incorporating both leveling validation and time series comparison was conducted in the Airport Economic Zone, and a conclusion that the accuracy of the proposed method was enhanced by 42.5% relative to the traditional OLS approach is acquired. Reliability assessment further corroborates that the integration of multiple InSAR datasets significantly improves both internal and external reliability metrics in comparison to single-source analyses.
The proposed data fusion framework with robust LSA offers a practical and reliable approach to mitigating the effects of gross errors that arise from phase unwrapping failures, thereby enhancing the reliability and credibility of InSAR-derived displacement measurements. Future research will aim to extend the framework to fully leverage multi-geometry data for 3D displacement retrieval with future SAR. In addition, more in-depth investigations into the physical mechanisms underlying gross errors will be conducted, potentially incorporating auxiliary environmental monitoring data to further improve error source identification and modeling robustness.

Author Contributions

Methodology, K.Y. and L.Y.; Validation, J.L. and X.W.; Investigation, X.W.; Data curation, J.L.; Writing—original draft, K.Y.; Writing—review & editing, J.L. and X.W.; Supervision, L.Y.; Funding acquisition, K.Y. All authors have read and agreed to the published version of the manuscript.

Funding

This research was funded by the research grant from the Pilot Project of Cooperation between Ministry of Natural Resources and Provinces of China [grant numbers 2023ZRBSHZ053], and the Tianjin North China Geological Exploration Bureau [grant numbers HK2022-B2].

Data Availability Statement

The raw data supporting the conclusions of this article will be made available by the authors on request. Some in-situ data were obtained under data-use agreements with partner organizations and cannot be publicly shared.

Conflicts of Interest

Authors Jun Liang and Xiaoye Wang were employed by Tianjin North China Geological Exploration General Institute Limited Company. The remaining authors declare that the research was conducted in the absence of any commercial or financial relationships that could be construed as a potential conflict of interest.

References

  1. Crosetto, M.; Monserrat, O.; Cuevas-González, M.; Devanthéry, N.; Crippa, B. Persistent scatterer interferometry: A review. ISPRS J. Photogramm. Remote Sens. 2016, 115, 78–89. [Google Scholar] [CrossRef]
  2. Li, S.; Xu, W.; Li, Z. Review of the SBAS InSAR Time-series algorithms, applications, and challenges—ScienceDirect. Geod. Geodyn. 2022, 13, 114–126. [Google Scholar] [CrossRef]
  3. Cheng, Y.; Pang, H.; Li, Y.; Fan, L.; Wei, S.; Yuan, Z.; Fang, Y. Applications and Advancements of Spaceborne InSAR in Landslide Monitoring and Susceptibility Mapping: A Systematic Review. Remote Sens. 2025, 17, 999. [Google Scholar] [CrossRef]
  4. Ferretti, A.; Prati, C.; Rocca, F. Permanent scatterers in SAR interferometry. IEEE Trans. Geosci. Remote Sens. 2001, 39, 8–20. [Google Scholar] [CrossRef]
  5. Lanari, R.; Mora, O.; Manunta, M.; Mallorqui, J.J.; Berardino, P.; Sansosti, E. A small-baseline approach for investigating deformations on full-resolution differential SAR interferograms. IEEE Trans. Geosci. Remote Sens. 2004, 42, 1377–1386. [Google Scholar] [CrossRef]
  6. Ao, Z.; Hu, X.; Tao, S.; Hu, X.; Wang, G.; Li, M.; Wang, F.; Hu, L.; Liang, X.; Xiao, J.; et al. A national-scale assessment of land subsidence in China’s major cities. Science 2024, 384, 301–306. [Google Scholar] [CrossRef]
  7. De Giorgi, L.; Barbolla, D.F.; Torre, C.; Settembrini, S.; Leucci, G. Evaluation of a Ground Subsidence Zone in an Urban Area Using Geophysical Methods. Sensors 2024, 24, 3757. [Google Scholar] [CrossRef]
  8. Sonbul, O.S.; Rashid, M. Algorithms and Techniques for the Structural Health Monitoring of Bridges: Systematic Literature Review. Sensors 2023, 23, 4230. [Google Scholar] [CrossRef]
  9. Koohmishi, M.; Kaewunruen, S.; Chang, L.; Guo, Y. Advancing railway track health monitoring: Integrating GPR, InSAR and machine learning for enhanced asset management. Autom. Constr. 2024, 162, 105378. [Google Scholar] [CrossRef]
  10. Casagli, N.; Intrieri, E.; Tofani, V.; Gigli, G.; Raspini, F. Landslide detection, monitoring and prediction with remote-sensing techniques. Nat. Rev. Earth Environ. 2023, 4, 51–64. [Google Scholar] [CrossRef]
  11. Du, J.; Li, Z.; Song, C.; Zhu, W.; Tomás, R. Coupling effect of impoundment and irrigation on landslide movement in Maoergai Reservoir area revealed by multi-platform InSAR observations. Int. J. Appl. Earth Obs. Geoinf. 2024, 129, 103802. [Google Scholar] [CrossRef]
  12. Declercq, P.; Dusar, M.; Pirard, E.; Verbeurgt, G.; Choopani, A.; Devleeschouwer, X. Post mining ground deformations transition related to coal mines closure in the Campine Coal Basin, Belgium, evidenced by three decades of MT-InSAR data. Remote Sens. 2023, 15, 725. [Google Scholar] [CrossRef]
  13. Wang, X.; Chen, S.; Xia, Y.; Niu, Y.; Gong, J.; Yang, Y. Analysis of surface deformation and related factors over mining areas based on InSAR: A case study of Fengcheng mine. Int. Arch. Photogramm. Remote Sens. Spat. Inf. Sci. 2024, 48, 697–712. [Google Scholar] [CrossRef]
  14. Hu, J.; Yan, Y.; Dai, H.; He, X.; Lv, B.; Han, M.; Zhu, Y.; Zhang, Y. Prediction Method for Dynamic Subsidence Basin in Mining Area Based on SBAS-InSAR and Time Function. Remote Sens. 2024, 16, 1938. [Google Scholar] [CrossRef]
  15. Hu, M.; Xu, B.; Wei, J.; Zuo, B.; Su, Y.; Zeng, Y. Correcting the location error of persistent scatterers in an urban area based on adaptive building contours matching: A case study of Changsha. Remote Sens. 2024, 16, 1543. [Google Scholar] [CrossRef]
  16. Wu, Y.-Y.; Madson, A. Error sources of interferometric synthetic aperture radar satellites. Remote Sens. 2024, 16, 354. [Google Scholar] [CrossRef]
  17. Liu, Y.; Zhang, Y.; Zhao, F.; Ding, R.; Zhao, L.; Niu, Y.; Qu, F.; Ling, Z. Multi-Source SAR-Based Surface Deformation Monitoring and Groundwater Relationship Analysis in the Yellow River Delta, China. Remote Sens. 2023, 15, 3290. [Google Scholar] [CrossRef]
  18. Higgins, M.; Wdowinski, S. InSAR Detection of Slow Ground Deformation: Taking Advantage of Sentinel-1 Time Series Length in Reducing Error Sources. Remote Sens. 2025, 17, 2420. [Google Scholar] [CrossRef]
  19. Hanssen, R.F. Radar Interferometry-Data Interpretation and Error Analysis; Kluwer Academic Publishers: New York, NY, USA, 2002; pp. 12–65. [Google Scholar]
  20. Jiang, H.; Balz, T.; Cigna, F.; Tapete, D.; Li, J.; Han, Y. Multi-sensor InSAR time series fusion for long-term land subsidence monitoring. Geo-Spat. Inf. Sci. 2024, 27, 1424. [Google Scholar] [CrossRef]
  21. Zhang, X.; Sun, Q.; Gui, R.; Hu, J.; Yang, Q.; Su, G. Long-time surface deformation in Beijing, China for three decades by multi-sensor, multi-track and multi-temporal InSAR seamless connection. Geomat. Nat. Hazards Risk 2025, 16, 2478950. [Google Scholar] [CrossRef]
  22. Chen, B.; Gong, H.; Chen, Y.; Lei, K.; Zhou, C.; Si, Y.; Li, X.; Pan, Y.; Gao, M. Investigating land subsidence and its causes along Beijing high-speed railway using multi-platform InSAR and a maximum entropy model. Int. J. Appl. Earth Obs. Geoinf. 2021, 96, 102284. [Google Scholar] [CrossRef]
  23. Fuhrmann, T.; Garthwaite, M.C. Resolving Three-Dimensional Surface Motion with InSAR: Constraints from Multi-Geometry Data Fusion. Remote Sens. 2019, 11, 241. [Google Scholar] [CrossRef]
  24. Aimaiti, Y.; Yamazaki, F.; Liu, W. Multi-Sensor InSAR Analysis of Progressive Land Subsidence over the Coastal City of Urayasu, Japan. Remote Sens. 2018, 10, 1304. [Google Scholar] [CrossRef]
  25. Zhang, Y.; Wu, H.; Kang, Y.; Zhu, C. Ground Subsidence in the Beijing-Tianjin-Hebei Region from 1992 to 2014 Revealed by Multiple SAR Stacks. Remote Sens. 2016, 8, 675. [Google Scholar] [CrossRef]
  26. Luo, Q.; Perissin, D.; Zhang, Y.; Jia, Y. L- and X-Band multi-temporal InSAR analysis of Tianjin subsidence. Remote Sens. 2014, 6, 7933–7951. [Google Scholar] [CrossRef]
  27. Luo, Q.; Li, M.; Yin, Z.; Ma, P.; Perissin, D.; Zhang, Y. Land Subsidence Velocity and High-Speed Railway Risks in the Coastal Cities of Beijing–Tianjin–Hebei, China, with 2015–2021 ALOS PALSAR-2 MultiTemporal InSAR Analysis. Remote Sens. 2024, 16, 4774. [Google Scholar] [CrossRef]
  28. Geudtner, D.; Torres, R. Sentinel-1 system overview and performance. In Proceedings of the 2012 IEEE International Geoscience and Remote Sensing Symposium, Munich, Germany, 22–27 July 2012. [Google Scholar] [CrossRef]
  29. Fang, C.; Wang, X.; Li, J.; Wu, L.; Wang, J.; Gu, H. A Novel Intelligent Learning Method for Identifying Gross Errors in Dam Deformation Monitoring Series. Water 2025, 17, 148. [Google Scholar] [CrossRef]
  30. Baarda, W. Statistical Concept in Geodesy; Publications on Geodesy (New Series) Geodetic Commission: Delft, The Netherlands, 1967; Volume 2, p. 4. [Google Scholar]
  31. Baarda, W. A Testing Procedure for Use in Geodetic Networks; Publications on Geodesy (New Series) Geodetic Commission: Delft, The Netherlands, 1968; Volume 2, p. 5. [Google Scholar]
  32. Deren, L. Theorie und Untersuchung der Trennbarkeit von Groben Paßpunktfehlern und Systematischen Bildfehlern bei der Photogrammetrischen Punktbestimmung. Doctoral Dissertation, Universität Stuttgart, Stuttgart, Germany, 1985. Available online: https://www.ifp.uni-stuttgart.de/dokumente/Dissertationen/diss_deren_li_c-324.pdf (accessed on 12 October 2025).
  33. Rofatto, V.F.; Matsuoka, M.T.; Klein, I.; Veronez, M.R.; Bonimani, M.L.; Lehmann, R. A half-century of Baarda’s concept of reliability: A review, new perspectives, and applications. Surv. Rev. 2020, 52, 18. [Google Scholar] [CrossRef]
  34. Amiri-Simkooei, A.R.; Jazaeri, S. Data-snooping procedure applied to errors-in-variables models. Stud. Geophys. Geod. 2013, 57, 426–441. [Google Scholar] [CrossRef]
  35. Wegmuller, U.; Walter, D.; Spreckels, V.; Werner, C.L. Nonuniform ground motion monitoring with TerraSAR-X persistent scatterer interferometry. IEEE Trans. Geosci. Remote Sens. 2010, 48, 895–904. [Google Scholar] [CrossRef]
  36. Bonaldo, G.; Caprino, A.; Lorenzoni, F.; Porto, F. Monitoring displacements and damage detection through satellite MT-InSAR techniques: A new methodology and application to a case study in Rome (Italy). Remote Sens. 2023, 15, 1177. [Google Scholar] [CrossRef]
  37. Berardino, P.; Fornaro, G.; Lanari, R.; Sansosti, E. A new algorithm for surface deformation monitoring based on small baseline differential SAR interferograms. IEEE Trans. Geosci. Remote Sens. 2002, 40, 2375–2383. [Google Scholar] [CrossRef]
  38. Yang, K.; Yan, L.; Huang, G.; Chen, C.; Wu, Z. Monitoring building deformation with InSAR: Experiments and validation. Sensor 2016, 16, 2182. [Google Scholar] [CrossRef]
  39. Ketelaar, G. Satellite Radar Interferometry Subsidence Monitoring Techniques; Springer: Dordrecht, The Netherlands, 2009. [Google Scholar]
  40. Zhu, M.; Wan, X.; Fei, B.; Qiao, Z.; Ge, C.; Minati, F.; Vecchioli, F.; Li, J.; Costantini, M. Detection of building and infrastructure instabilities by automatic spatiotemporal analysis of satellite SAR interferometry measurements. Remote Sens. 2018, 10, 1816. [Google Scholar] [CrossRef]
  41. Ferretti, A.; Savio, G.; Barzaghi, R.; Borghi, A.; Musazzi, S.; Novali, F. Submillimeter Accuracy of InSAR Time Series: Experimental Validation. IEEE Trans. Geosci. Remote Sens. 2007, 45, 1142–1153. [Google Scholar] [CrossRef]
  42. Yague-Martinez, N.; De Zan, F.; Prats-Iraola, P. Coregistration of Interferometric Stacks of Sentinel-1 TOPS Data. IEEE Geosci. Remote Sens. Lett. 2017, 14, 1002–1006. [Google Scholar] [CrossRef]
  43. Pepe, A. Theory and Statistical Description of the Enhanced Multi-Temporal InSAR (E-MTInSAR) Noise-Filtering Algorithm. Remote Sens. 2019, 11, 363. [Google Scholar] [CrossRef]
  44. Moreira, A. A golden age for spaceborne SAR systems. In Proceedings of the 20th International Conference on Microwaves, Radar and Wireless Communications (MIKON), Gdańsk, Poland, 16–18 June 2014; pp. 1–4. [Google Scholar] [CrossRef]
  45. Guo, N.; Zhan, W. Influence of different data fusion methods on the accuracy of three-dimensional displacements field. Adv. Space Res. 2020, 65, 1580–1590. [Google Scholar] [CrossRef]
  46. Yu, H.; Gong, H.; Chen, B. Analysis of the superposition effect of land subsidence and sea-level rise in the Tianjin coastal area and its emerging risks. Remote Sens. 2023, 15, 3341. [Google Scholar] [CrossRef]
  47. Chen, R.; Sun, H.; Zhu, Z.; Jiang, X.; Chen, S.; Chen, J. Research Progress and Future Prospects of Land Subsidence in the Yellow River Delta. Coast. Eng. 2024, 43, 1–23. [Google Scholar] [CrossRef]
  48. Zhang, P.; Guo, Z.; Guo, S.; Xia, J. Land Subsidence Monitoring Method in Regions of Variable Radar Reflection Characteristics by Integrating PS-InSAR and SBAS-InSAR Techniques. Remote Sens. 2022, 14, 3265. [Google Scholar] [CrossRef]
  49. Rosen, P.A.; Hensley, S.; Shaffer, S.; Veilleux, L.; Chakraborty, M.; Misra, T. Global persistent SAR sampling with the NASA-ISRO SAR (NISAR) mission. In Proceedings of the 2017 IEEE Radar Conference, Seattle, WA, USA, 8–12 May 2017; pp. 410–414. [Google Scholar] [CrossRef]
  50. Torres, R.; Lokas, S.; Cosimo, G.D.; Geudtner, D.; Bibby, D. Sentinel 1 evolution: Sentinel-1C and -1D models. In Proceedings of the 2017 International Geoscience and Remote Sensing Symposium, Fort Worth, TX, USA, 23–28 July 2017. [Google Scholar] [CrossRef]
  51. Zhong, J.; Li, Q.; Zhang, J.; Luo, P.; Zhu, W. Risk Assessment of Geological Landslide Hazards Using D-InSAR and Remote Sensing. Remote Sens. 2024, 16, 345. [Google Scholar] [CrossRef]
Figure 1. The map of the study area, Binhai New Area, China.
Remotesensing 17 03469 g001
Figure 2. (a) Spatial configuration of multi-source SAR data acquisition; (b) temporal distribution of multi-source SAR data acquisition dates.
Remotesensing 17 03469 g002
Figure 3. Spatial distribution of leveling points within the study area.
Remotesensing 17 03469 g003
Figure 4. Schematic representation of the workflow for multi-source data fusion with robust LSA approach.
Remotesensing 17 03469 g004
Figure 5. Schematic diagram of the MT-InSAR processing workflow.
Remotesensing 17 03469 g005
Figure 6. (a) Selection of primary SAR and auxiliary datasets; (b) identification of preliminary homonymous PS set incorporating spatial positional information; (c) selection of final homonymous PS set integrated with elevation data.
Remotesensing 17 03469 g006
Figure 7. Average LOS displacement velocity maps obtained through MTInSAR processing: (a) S1A, (b) S1D, (c) R2D.
Remotesensing 17 03469 g007aRemotesensing 17 03469 g007b
Figure 8. Spatial distribution of homonymous PS sets between the R2D and S1D datasets.
Remotesensing 17 03469 g008
Figure 9. Spatial distribution of homonymous PS sets between the three InSAR datasets (R2D, S1D and S1A).
Remotesensing 17 03469 g009
Figure 10. Spatial distribution of representative PS Set employed in the single robust LSA analysis.
Remotesensing 17 03469 g010
Figure 11. Spatial distribution of PS sets containing gross errors and valid PS sets within the study area.
Remotesensing 17 03469 g011
Figure 12. Substantial accumulations of gross errors were distinctly identified, as demarcated by the blue elliptical annotations.
Remotesensing 17 03469 g012
Figure 13. Mean vertical displacement velocity distributions derived from the multi-source data fusion workflow with robust LSA.
Remotesensing 17 03469 g013
Figure 14. A comparative analysis of measurement errors following the multi-source data fusion method with robust LSA, (a) regression of velocity displacement between fusion results and leveling results, (b) velocity error histogram of fusion results.
Remotesensing 17 03469 g014
Figure 15. Mean vertical velocity distributions derived from the traditional OLS.
Remotesensing 17 03469 g015
Figure 16. (a) Spatial distribution of the Airport Economic Zone, (b) mean vertical velocity distributions from the data fusion method with robust LSA, and (c) mean vertical velocity distributions from the traditional OLS processing.
Remotesensing 17 03469 g016
Figure 17. Spatial distribution of leveling points within the Airport Economic Zone.
Remotesensing 17 03469 g017
Figure 18. A comparative analysis of measurement errors between the proposed data fusion method with robust LSA and the traditional OLS processing within the Airport Economic Zone, (a) regression of velocity displacement between fusion results and leveling results, (b) velocity error histogram of fusion results.
Remotesensing 17 03469 g018
Figure 19. A comparative analysis of different time series and leveling within the Airport Economic Zone.
Remotesensing 17 03469 g019
Figure 20. Spatial distribution of urban region for reliability parameters analysis and the corresponding alignment of homonymous PS sets across the three InSAR datasets.
Remotesensing 17 03469 g020
Figure 21. Spatial distribution of suburban region for reliability parameters analysis and the corresponding alignment of homonymous PS sets across the three InSAR datasets.
Remotesensing 17 03469 g021
Figure 22. Spatial distribution of PS sets with gross errors and valid PS sets in urban and suburban areas, (a) urban region, (b) suburban region.
Remotesensing 17 03469 g022
Table 1. Key parameters of multi-source SAR datasets.
NameS1DS1AR2D
WavelengthC (~5.6 cm)C (~5.6 cm)C (~5.6 cm)
Incidence Angle36.7°39.2°25.6°
Acquisition ModeTOPSTOPSSM
Resolution15 m15 m5 m
Table 2. Reliability parameters across typical urban and suburban regions.
Region r ¯ δ 0 δ ¯ 0
Urban0.565.52.4
Suburban0.268.14.0
Table 3. Reliability parameters of single and three InSAR datasets in typical urban areas.
RegionNumber of InSAR Datasets r ¯ δ 0 δ ¯ 0
Urban10
30.268.14.0
Disclaimer/Publisher’s Note: The statements, opinions and data contained in all publications are solely those of the individual author(s) and contributor(s) and not of MDPI and/or the editor(s). MDPI and/or the editor(s) disclaim responsibility for any injury to people or property resulting from any ideas, methods, instructions or products referred to in the content.