Article

Fusing BDS and Dihedral Corner Reflectors for High-Precision 3D Deformation Measurement: A Case Study in the Jinsha River Reservoir Area

by
Zhiyong Qi
1,2,
Yanpian Mao
1,2,*,
Zhengyang Tang
1,2,
Tao Li
3,
Rongxin Fang
3,
You Mou
1,
Xuhuang Du
1 and
Zongyi Peng
1
1
China Yangtze Power Co., Ltd., Wuhan 430014, China
2
Hubei Smart Hydropower Technology Innovation Center, No. 88 Sanyang Road, Wuhan 430014, China
3
GNSS Research Center, Wuhan University, Wuhan 430072, China
*
Author to whom correspondence should be addressed.
Remote Sens. 2025, 17(17), 3000; https://doi.org/10.3390/rs17173000
Submission received: 16 July 2025 / Revised: 14 August 2025 / Accepted: 26 August 2025 / Published: 28 August 2025
(This article belongs to the Special Issue Applications of Radar Remote Sensing in Earth Observation)

Abstract

In mountainous canyon regions, BeiDou Navigation Satellite System (BDS)/Global Navigation Satellite System (GNSS) receivers are susceptible to multireflection and tropospheric factors, which frequently reduce the accuracy in monitoring vertical deformation monitoring under short-baseline methods. This limitation hinders the application of BDS/GNSS in high-precision monitoring scenarios in those cases. To address this issue, this study proposes a three-dimensional (3D) deformation measurement method that integrates BDS/GNSS positioning with dihedral corner reflectors (CRs). By incorporating high-precision horizontal positioning results obtained from BDS/GNSS into the radar line-of-sight (LOS) correction process and utilizing ascending and descending Synthetic Aperture Radar (SAR) data for joint monitoring, the method achieves millimeter-level- accuracy in measuring vertical deformation at corner reflector sites. At the same time, it enhances the 3D positioning accuracy of BDS/GNSS to the 1 mm level under short-baseline configurations. Based on monitoring stations deployed at the Jinsha River dam site, the proposed deformation fusion monitoring method was validated using high-resolution SAR imagery from Germany’s TerraSAR-X (TSX) satellite. Simulated horizontal and vertical displacements were introduced at the stations. The results demonstrate that BDS/GNSS achieves better than 1 mm horizontal monitoring accuracy and a vertical accuracy of around 5 mm. Interferometric SAR (InSAR) CRs achieve approximately 2 mm in horizontal accuracy and 1 mm in vertical accuracy. The integrated method yields a 3D deformation monitoring accuracy better than 1 mm. This paper’s results show high potential for achieving high-precision deformation observations by fusing BDS/GNSS and dihedral CRs, offering promising prospects for deformation monitoring in reservoir canyon regions.

1. Introduction

Interferometric Synthetic Aperture Radar (InSAR) technology has been widely applied in surface deformation monitoring. However, the deformation obtained from interferograms only corresponds to the displacement in the radar line-of-sight (LOS) direction, meaning that the observation is the projection of the true three-dimensional (3D) deformation vector onto the radar LOS direction [1,2,3,4]. Based on the geometric conditions of ascending and descending radar LOS observations and the known direction of the target’s 3D deformation vector, InSAR measurements can be inverted to recover the true 3D deformation. The theoretical derivations and associated formulas for this inversion are well established [2,4,5]. Wietske S. [5] pointed out that in order to accurately reflect 3D deformation during InSAR decomposition, the deformation vector in real space projected on the null line is invisible; this is valuable to know before starting an InSAR survey and obtaining the accompanying results. Specifically, for artificial corner reflector (CR) targets in SAR imagery, when co-located with BeiDou/GNSS receivers, it is possible to use the 3D deformation vector obtained from GNSS to project the LOS-measured deformation into 3D geometry, thereby enabling fusion with GNSS monitoring results [6,7,8,9]. Scholars have also explored fusing InSAR results from multiple incidence angles and viewing geometries, which has enabled broad applications in tectonic motion, land subsidence, and landslide monitoring [10,11,12,13,14,15].
Recent advancements in passive and active corner reflector technologies have led to numerous test cases in geodesy and landslide monitoring [16,17,18,19,20,21]. To enable the retrieval of 3D deformation information from CR monitoring points, some researchers and organizations have redesigned reflectors, developing symmetric CRs that support both ascending and descending SAR observations. Some of these reflectors can also co-host GNSS receivers [18,22,23,24,25]. Theoretically, full 3D deformation can be retrieved when a CR is observed under three different viewing angles. This approach is particularly suitable for active transponders, which can reflect radar signals omnidirectionally. This method is limited by the need for large volumes of multi-angle SAR data [24].
Czikhardt et al. [6] developed a CR processing pipeline using dual-symmetric triangular reflectors, achieving full processing from geometric positioning to phase measurement. They also released the corresponding Python3-based open-source software GECORIS (https://bitbucket.org/memorid/gecoris (accessed on 25 August 2025)). However, the geometric projection transformation used in this software for ascending/descending LOS data is based on an approximate formula that neglects the influence of azimuth angle. This simplification may introduce errors in high-precision deformation monitoring scenarios. Wietske S. et al. [5] proposed a comprehensive geometric analysis for forward and inverse transformation of 3D deformation vectors, recommending that accurate 3D projection relationships be constructed based on LOS vectors and zero-Doppler planes for reliable transformation and inversion of spatial deformation.
Dihedral corner reflectors have also demonstrated high-precision deformation monitoring capabilities under ascending/descending modes. Ferretti et al. [26] and G. Quin [27] verified with COSMO-SkyMed data that deformation accuracy can reach sub-millimeter levels. Z. Xia et al. [20] used dihedral reflectors in ascending and descending tracks to monitor landslides, and the results from TerraSAR-X and Sentinel-1 data showed strong consistency with mm-level precision. However, dihedral reflectors have limitations due to their strict alignment requirements with satellite azimuth angles, making construction more challenging in engineering applications. Liu Hui et al. [28] developed both dihedral and triangular symmetric reflectors. Their experiments showed that triangular reflectors yielded higher monitoring accuracy, whereas dihedral reflectors had relatively lower performance. These studies indicate that dihedral reflectors may yield different deformation accuracies depending on their design and deployment.
With the advancement of deformation monitoring in reservoir and dam areas towards comprehensive, automated, and intelligent systems, the Global Navigation Satellite System (GNSS) has gradually become a critical technology for high-precision deformation monitoring in such regions. Existing studies have shown that the GNSS can achieve better than 1 mm planar deformation accuracy and better than 3 mm vertical accuracy, meeting the requirements of technical standards for dam monitoring and yielding preliminary success [29,30,31,32,33]. As early as 1996, Liu Jingnan et al. [34] built the first fully automated GNSS deformation monitoring system for dam appearance and high slopes at the Geheyan Dam, achieving horizontal precision of 0.5 mm and vertical precision of 1.0 mm; the system was able to operate continuously without human intervention. He et al. [35] developed a multi-antenna GNSS monitoring system, significantly reducing hardware costs compared to traditional one-antenna/one-receiver systems. Jiang Weiping et al. [33] successfully extracted the component signals in deformation time series by incorporating external load data, explaining the long-term deformation of the Xilongchi Dam. Carla et al. [36] performed long-term GNSS monitoring of the Super-Sauze landslide in the Southern French Alps, achieving mm-level baseline solution accuracy over 1 km in hourly intervals. Konakoglu [37] conducted long-term GNSS deformation monitoring at the Deriner Dam in Turkey, confirming a strong correlation between dam deformation and reservoir water level.
Additionally, with the rapid development of the BeiDou Navigation Satellite System (BDS), the number of available satellites, signal quality, and positioning capability of GNSSs have improved significantly, further enhancing deformation monitoring accuracy. Yuan Youcang et al. [38] addressed GNSS signal occlusion in high slopes by processing BDS+GPS dual-system data for deformation monitoring at high-slope areas in hydropower stations. Huang et al. [39] quantitatively analyzed improvements in the availability and reliability of BDS under different masking conditions at dams, showing that, when most GEO/IGSO satellites are unobstructed, availability increases from 50% (GPS only) to 95% with BDS+GPS. Han et al. [40] established a millimeter-level BeiDou-based deformation monitoring system at the Sarez Lake Dam and analyzed monitoring data from October 2021 to March 2023. The results showed that horizontal deformation was directed toward the center of the lake, while vertical deformation exhibited subsidence. The system also successfully detected a magnitude 7.2 earthquake 52 km from the dam, resulting in a southward displacement of 22.5 mm.
In this study, several deformation monitoring stations combining BDS/GNSS and the dihedral CR developed by China Yangtze Power Co., Ltd., Wuhan, China, were deployed on slopes in the upstream reservoir area of the Jinsha River for high-precision deformation monitoring. The goal was to fuse the mm-level BDS/GNSS deformation results with LOS deformation measurements from CRs, achieving complementary advantages of both systems. Precise monitoring of 1 mm is needed for those stations because some of them are control points for slope and dam deformation monitoring.

2. Methodology

2.1. Static Baseline Solution Method for BDS/GNSS

In this study, the double-difference method is used to obtain the baseline solutions. Since the BDS/GNSS stations are fixed in position and spaced less than 1.5 km apart, there is strong correlation between the major systematic errors associated with the GNSS. By employing double differencing between both stations and satellites, the major error sources (e.g., ionospheric delay, tropospheric delay, and satellite/receiver clock errors) can be effectively mitigated or eliminated in canyon environments, thereby enabling high-precision baseline solutions.
The double-difference calculation method not only eliminates common errors at the satellite and BDS/GNSS receivers but also further mitigates the effects of ionospheric and tropospheric delays. The formula is as follows:
Δ P j , r s h i = Δ ρ r s h i + Δ T j , r s h i + Δ I j , r s h i + Δ ε p λ j Δ φ j , r s h i = Δ ρ r s h i + Δ T j , r s h i Δ I j , r s h i + λ j Δ N j , r s h i + Δ ε ϕ
The above equations represent the double-difference observation equations for the pseudorange and carrier phase, respectively. denotes the double-difference operator; h and i represent two BDS/GNSS satellites, while r and s denote two BDS/GNSS stations; P and φ are the pseudorange and carrier phase observations, respectively; λ j is the wavelength of the carrier phase; j and ρ represent the geometric distance from the center of the satellite’s transmitting antenna phase to the center of the BDS/GNSS antenna phase; T and I denote the tropospheric and ionospheric delay corrections; N is the integer ambiguity; and ε represents random noise that cannot be modeled.

2.2. Geometric Projection Principle for LOS Deformation to Three-Dimensional Deformation

For any ground point target visible under arbitrary radar viewing angles, its 3D deformation vector R denoted by the local East, North, Up (ENU) coordinate system can be projected onto the SAR LOS direction by the SAR satellite’s heading angle and local incidence angle.
The LOS projection d L o S can be expressed as follows [5]:
d L o S = P L o S d E N U
In the equation, P L o S = [ sin η   sin ϕ , sin η   cos ϕ , cos η ] represents the projection function that maps the three orthogonal components of the local ENU coordinate system onto the LOS deformation, and d E N U = [ d e , d n , d u ] denotes the three orthogonal projection components of the 3D deformation vector R in the local ENU coordinate system. η is the radar satellite’s local incidence angle and φ is the angle between the zero-Doppler plane (ZDP) of the radar image azimuth direction and the north direction in the local ENU coordinate system.
As shown in Figure 1, in the local ENU coordinate system, the 3D deformation components of the target point are denoted as the northward component d n , the eastward component d e , and the vertical component R u . For ease of discussion, the three orthogonal projection components of the 3D deformation vector R in the local ENU coordinate system are expressed here as the horizontal component R s . The horizontal component can be defined as R s = d e 2 + d n 2 with azimuth angle θ in the EN plane. The vertical component is defined as R u .
Additionally, η a r denotes the radar ascending right-looking local incidence angle, while η d r represents the descending right-looking local incidence angle. φ is the angle between the satellite heading direction and the northward direction (considering that this angle is nearly identical for polar-orbiting satellites in low- to mid-latitude regions, this paper assumes that it remains approximately consistent for both ascending and descending tracks).
For the horizontal deformation component R s , only its projection onto the plane defined by the radar line of sight (LOS) can be observed from the interferogram. This projection is denoted as R s a for ascending-track imagery and as R s d for descending-track imagery. Their calculation formulas are as follows:
R s a = R s × cos θ φ R s d = R s × cos θ + φ
In contrast, the projection of the vertical deformation component R u onto the radar LOS direction depends solely on the radar’s local incidence angle. The LOS-projected vertical component is denoted as V u a r for ascending right-looking geometry, and as V u d r   for descending right-looking geometry. The following are the corresponding formulas:
V u a r = R u × c o s ( η a r ) V u d r = R u × c o s ( η d r )

2.3. LOS Deformation Decomposition Model in Local Orthogonal Plane

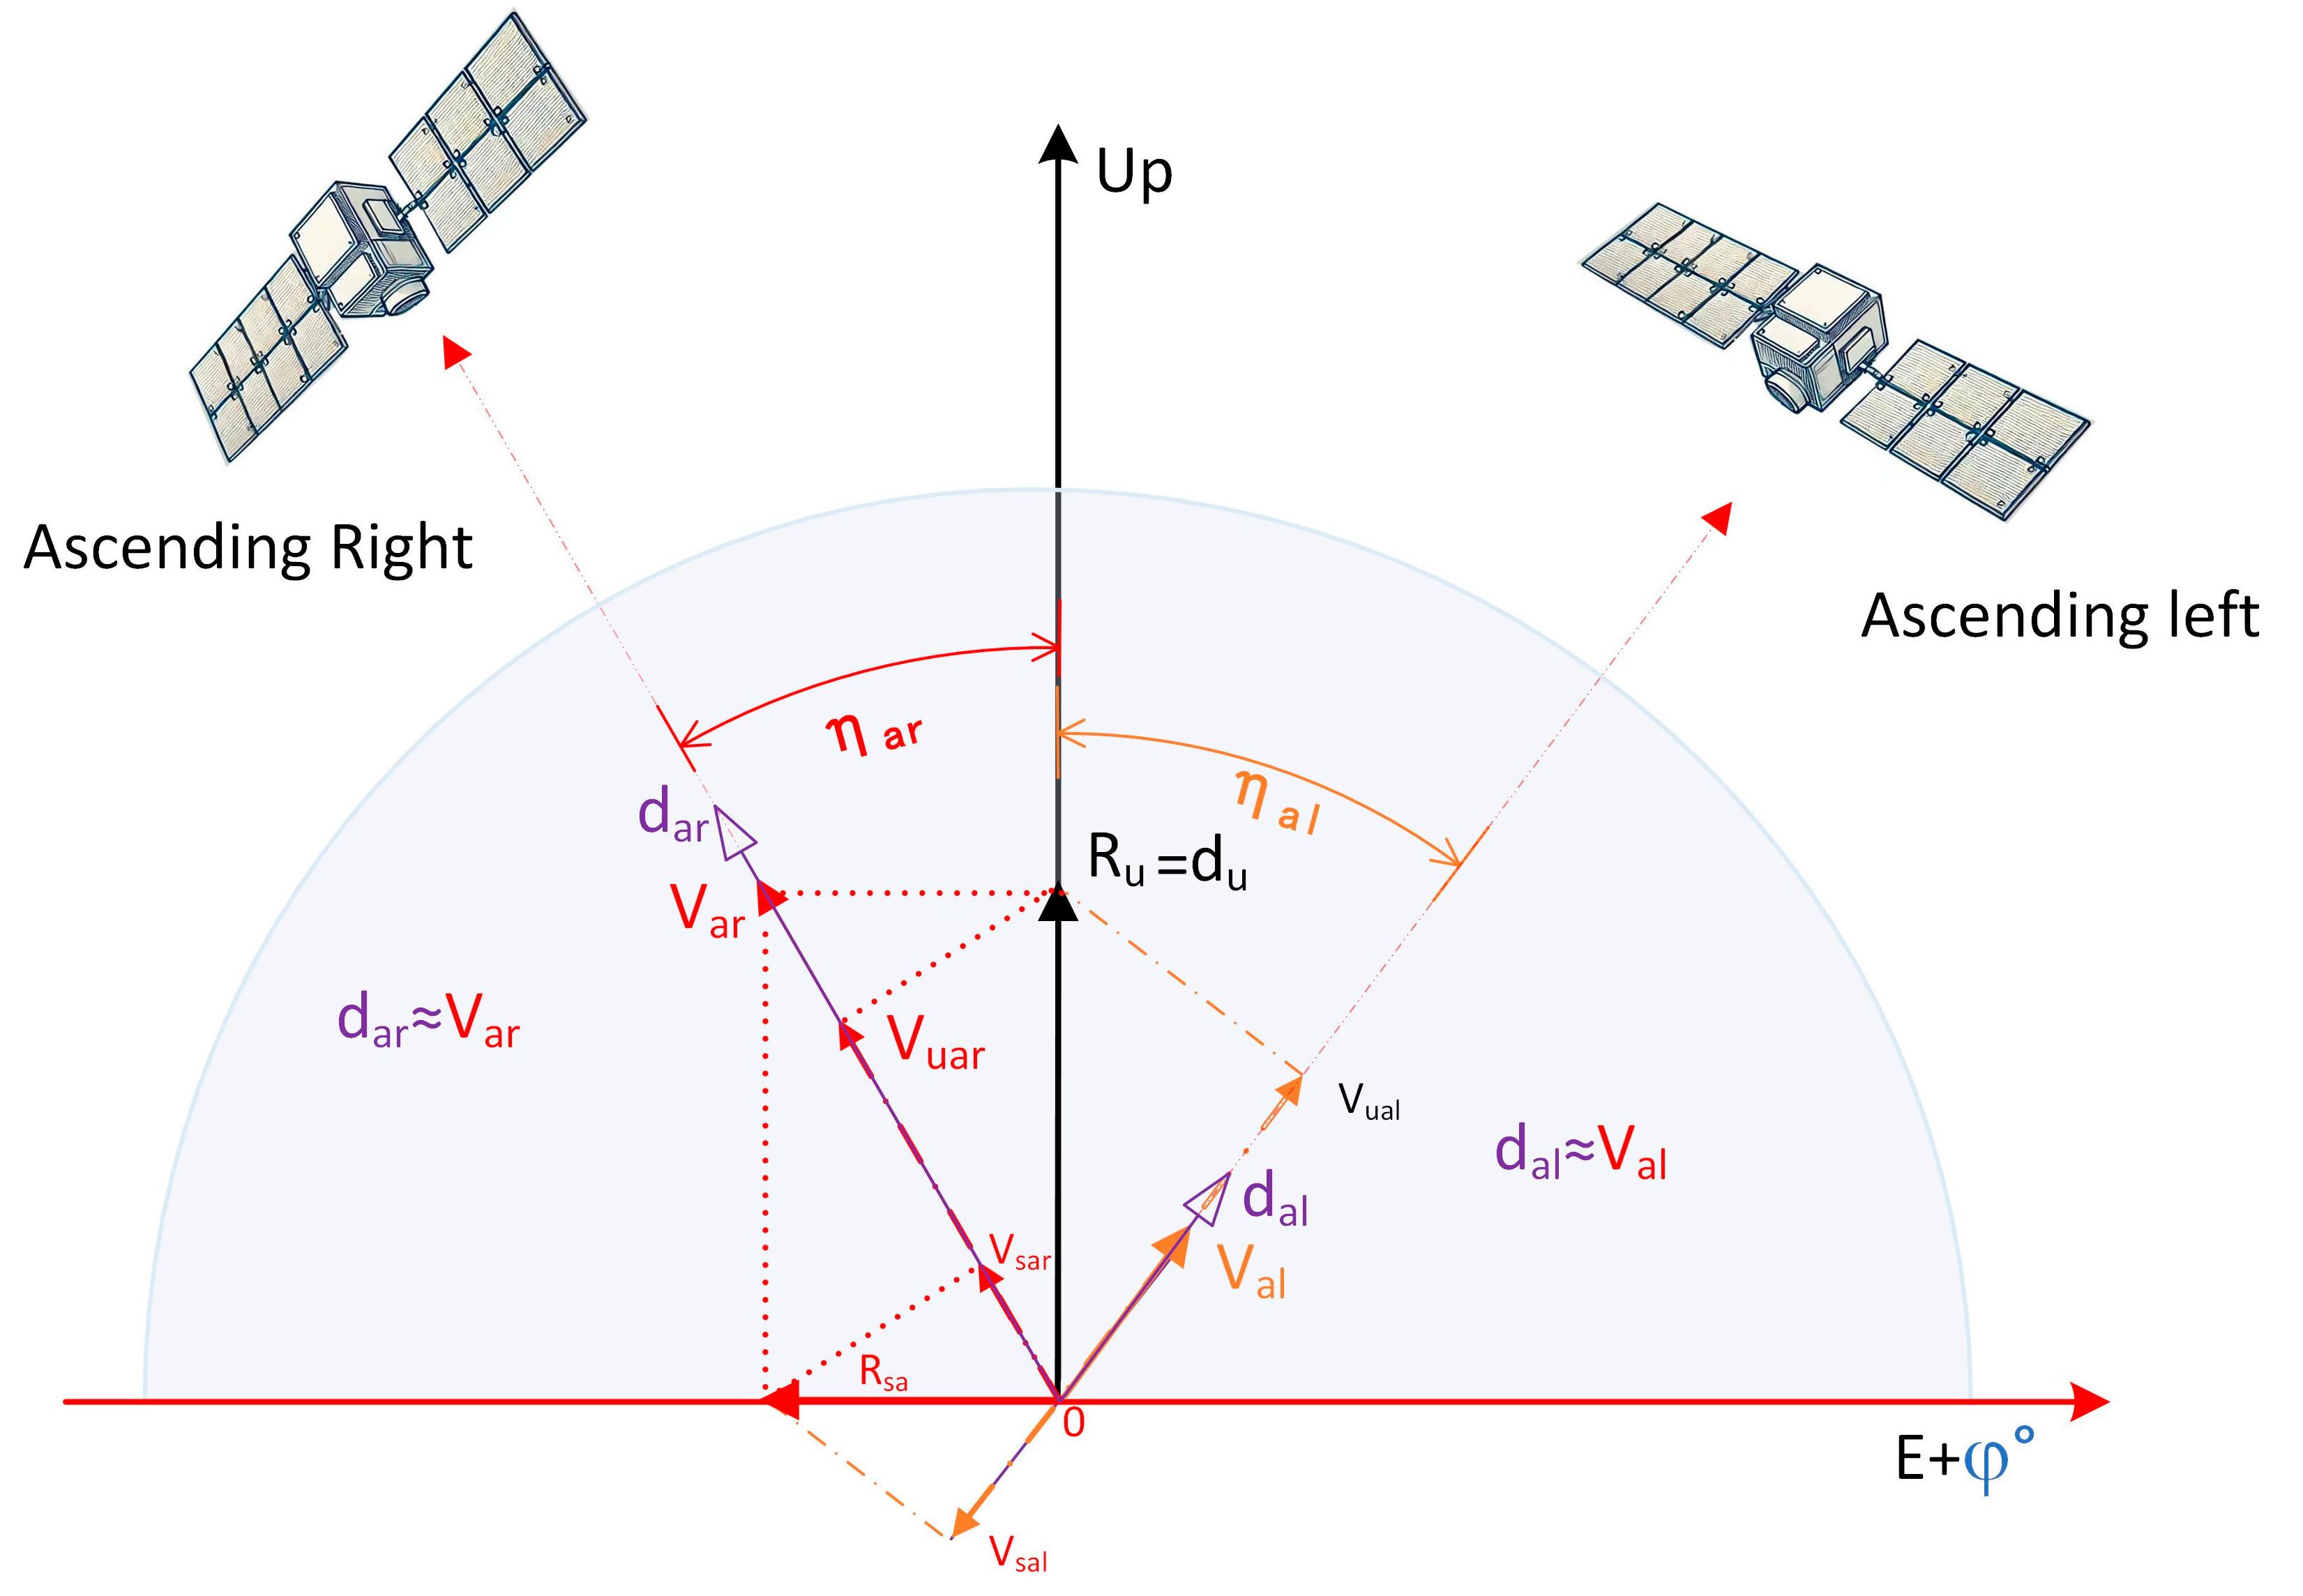
The deformation projections in the radar LOS direction exhibit certain differences under ascending/descending and right-/left-looking conditions. These discrepancies primarily arise from variations in the satellite’s incidence angle and the directional nature of horizontal deformation. Symmetry between ascending and descending tracks only occurs when their incidence angles and heading angles are identical. Figure 2 illustrates the projection of horizontal and vertical deformation vectors onto the radar LOS plane under ascending right- and left-looking geometries. It should be pointed out that the geometry presented in Figure 2 is very rare in both the Sentinel-1 and TerraSAR-X datasets. For Chinese SAR satellites such as Fucheng-1, Gaojing-2, and Hongtu-1, both the left-looking and right-looking geometries are supported. For polar-orbiting SAR satellites, the ascending right- and left-looking observations lie within the same LOS local orthogonal plane (as shown in Figure 2), where d a r represents the deformation observed in the ascending right-looking mode, and d a l denotes the deformation observed in the ascending left-looking mode. Due to the presence of the horizontal deformation component R s a , its superposition with the vertical component leads to an enhancement in right-looking observations and a reduction in left-looking observations.
While the relative true 3D deformation between CRs can be accurately derived through the above projection transformations, InSAR measurements still contain noise δ compared to the actual values. This relationship can be expressed as follows:
d a r = V a r + δ   d a l = V a l + δ  
In Equation (5), d a r represents the line-of-sight deformation measurement obtained from ascending right-looking radar interferometry, V a r denotes the projection of the actual three-dimensional deformation at the target point onto the radar line-of-sight direction, and δ signifies noise. The noise sources include radar thermal noise, random noise, speckle noise, sidelobe effects, and other errors that are difficult to eliminate through modeling. Generally, when the SAR system is sufficiently stable and the radar cross-section (RCS) of the CR is high enough, the influence of δ can be neglected.
Figure 2 illustrates the plane formed by the ascending orbit SAR LOS direction orthogonal to the zero-Doppler plane (ZDP), which are perpendicular to each other. The projection of the horizontal deformation component R s onto this plane is denoted as R s a . η a r represents the local incidence angle for an ascending right-looking radar, η a l is the local incidence angle for an ascending left-looking radar, and R u is the vertical deformation component. The deformation of the target point in the radar line-of-sight plane can be described as a superposition of the horizontal and vertical deformation components. These components are constructive projections under right-looking radar conditions, whereas they are destructive under left-looking conditions. The calculation formulas are as follows:
V a r = V u a r + V s a r V a l = V u a l V s a l                                                              
From geometric relationships, it can be determined that the projection of the vertical component R u in the ascending right-looking radar LOS direction is V u a r . The projection in the ascending left-looking radar LOS direction is V u a l . Similarly to Equation (4), these can be calculated using the following formulas:
V u a r = R u × cos η a r = d u × cos η a r   V u a l = R u × cos η a l = d u × cos η a l          
where η a r and η a l represent the local incidence angles for ascending right-looking and left-looking radar configurations, respectively.
The horizontal deformation component R s a projected onto the radar LOS plane exhibits differential effects under ascending right-/left-looking conditions due to variations in local incidence angles. Its projection in the LOS direction is calculated as follows:
V s a r = R s a r × sin η a r V s a l = R s a l × sin η a l                                            
Similarly, when the horizontal deformation vector of the target is projected onto the Cartesian coordinate system in different quadrants, the deformation projection decomposition and combination formulas for all four acquisition modes (ascending/descending and right-looking/left-looking) can be derived through the above data processing chain.
The millimeter-level accuracy in horizontal displacement monitoring achieved by the BDS/GNSS receivers in this study enables us to derive horizontal movement components from BDS/GNSS short-baseline calculations, inversely compute V u a r and V u a l using the aforementioned formulas, and substitute these values into Equation (7) to ultimately obtain high-precision vertical deformation measurements through InSAR monitoring on the dihedral CRs.

3. Simulated Horizontal and Vertical Deformation Observation Results

3.1. Overview of the Test Area and SAR Data Acquisition

High-precision deformation monitoring in the dam areas of large hydropower stations along the upper Jingsha River has traditionally relied on periodic measurements using conventional high-precision leveling and total stations. In this study, we selected eight BDS/GNSS stations combined with dihedral corner reflectors deployed in the near-dam area of a hydropower station in Southwest China to conduct assessments of deformation monitoring accuracy and simulated deformation experiments.
As shown in Table 1, both the ascending and descending orbits had the same intersection angle φ in the north direction, while the local incidence angle differs by nearly 6° between the ascending and descending orbits. Additionally, due to variations in orbital altitude between the ascending and descending tracks, there exist some differences in range resolution and azimuth resolution.
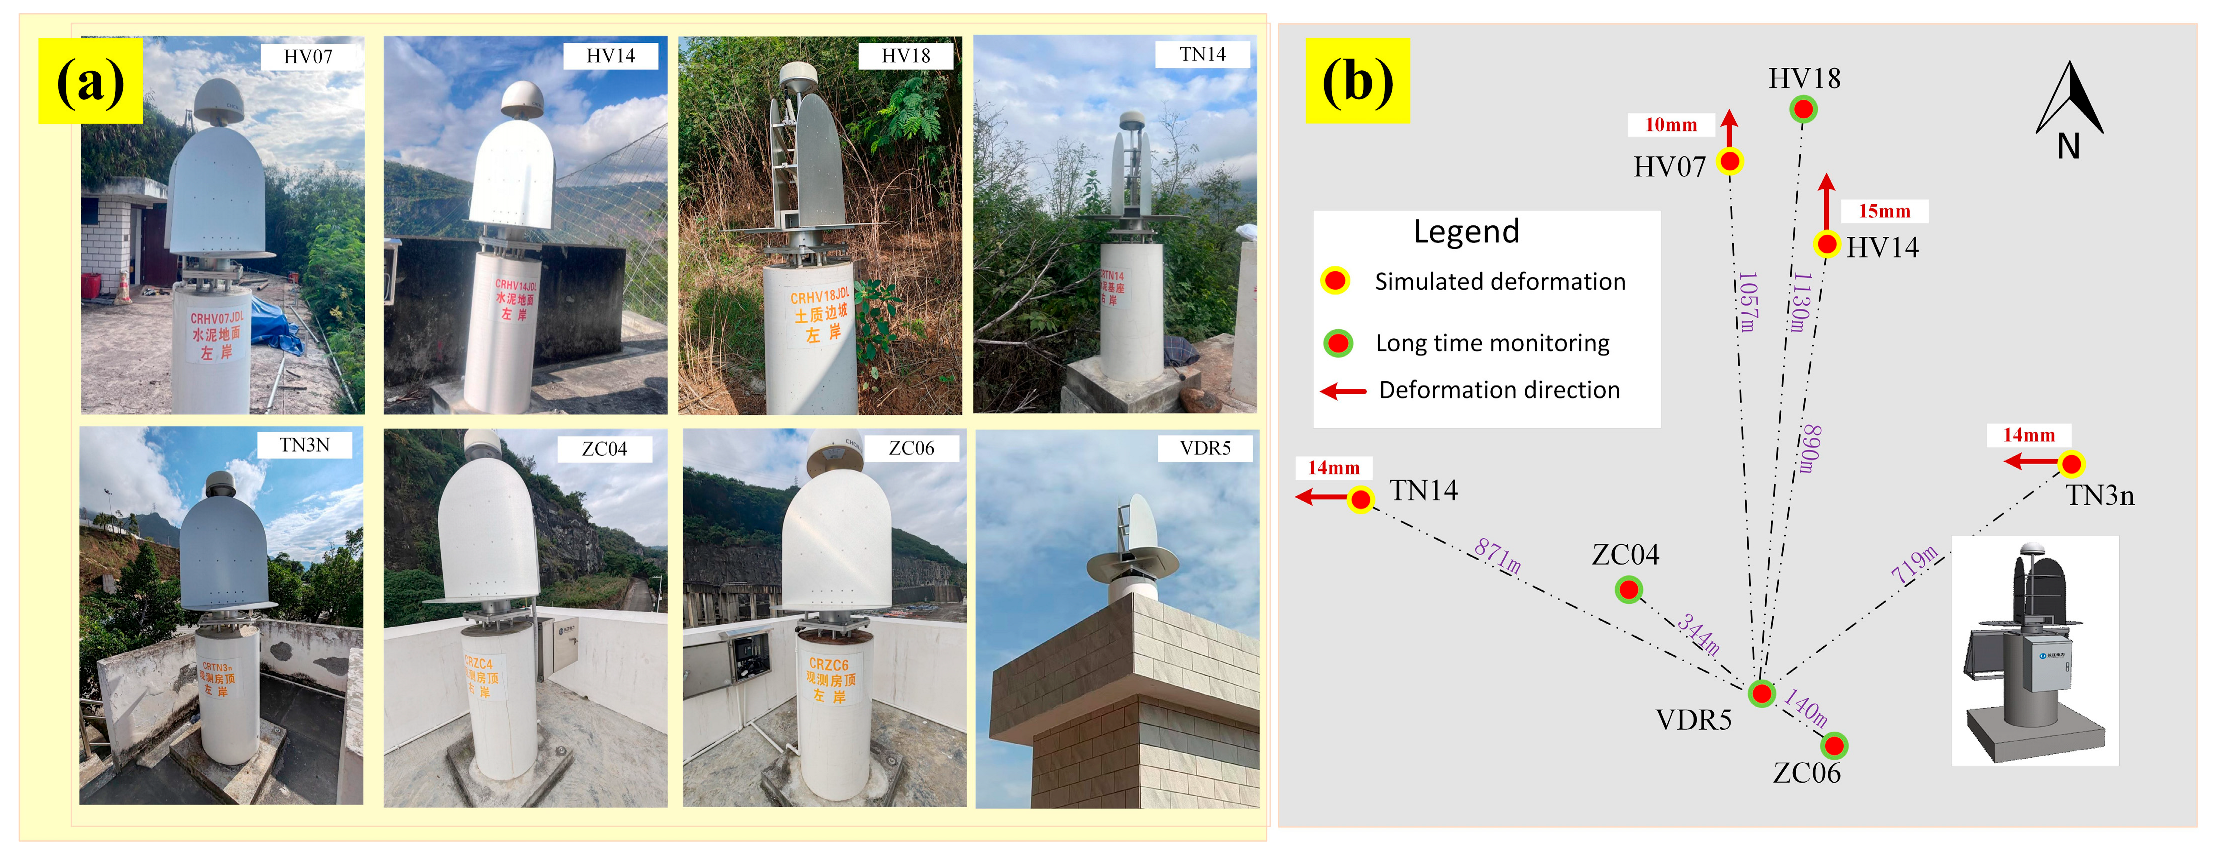
The combined BDS/GNSS and dihedral CR stations employed in this study consist of high-precision BDS intelligent devices designed by Yangtze River Power. These stations combined with dihedral corners are compatible with both ascending and descending right-looking SAR satellite orbits and are equipped with high-precision BDS receivers. These BDS/GNSS stations are co-located near traditional surveying benchmarks, facilitating cross-validation with conventional geodetic measurements. In terms of their spatial distribution is illustrated in Figure 3, four stations are deployed on the left and right banks of the dam, respectively. Taking the VDR5 as the reference station, the shortest baseline is 140 m and the longest is 1.1 km for BDS/GNSS data processing and differential processing of the CR phase.
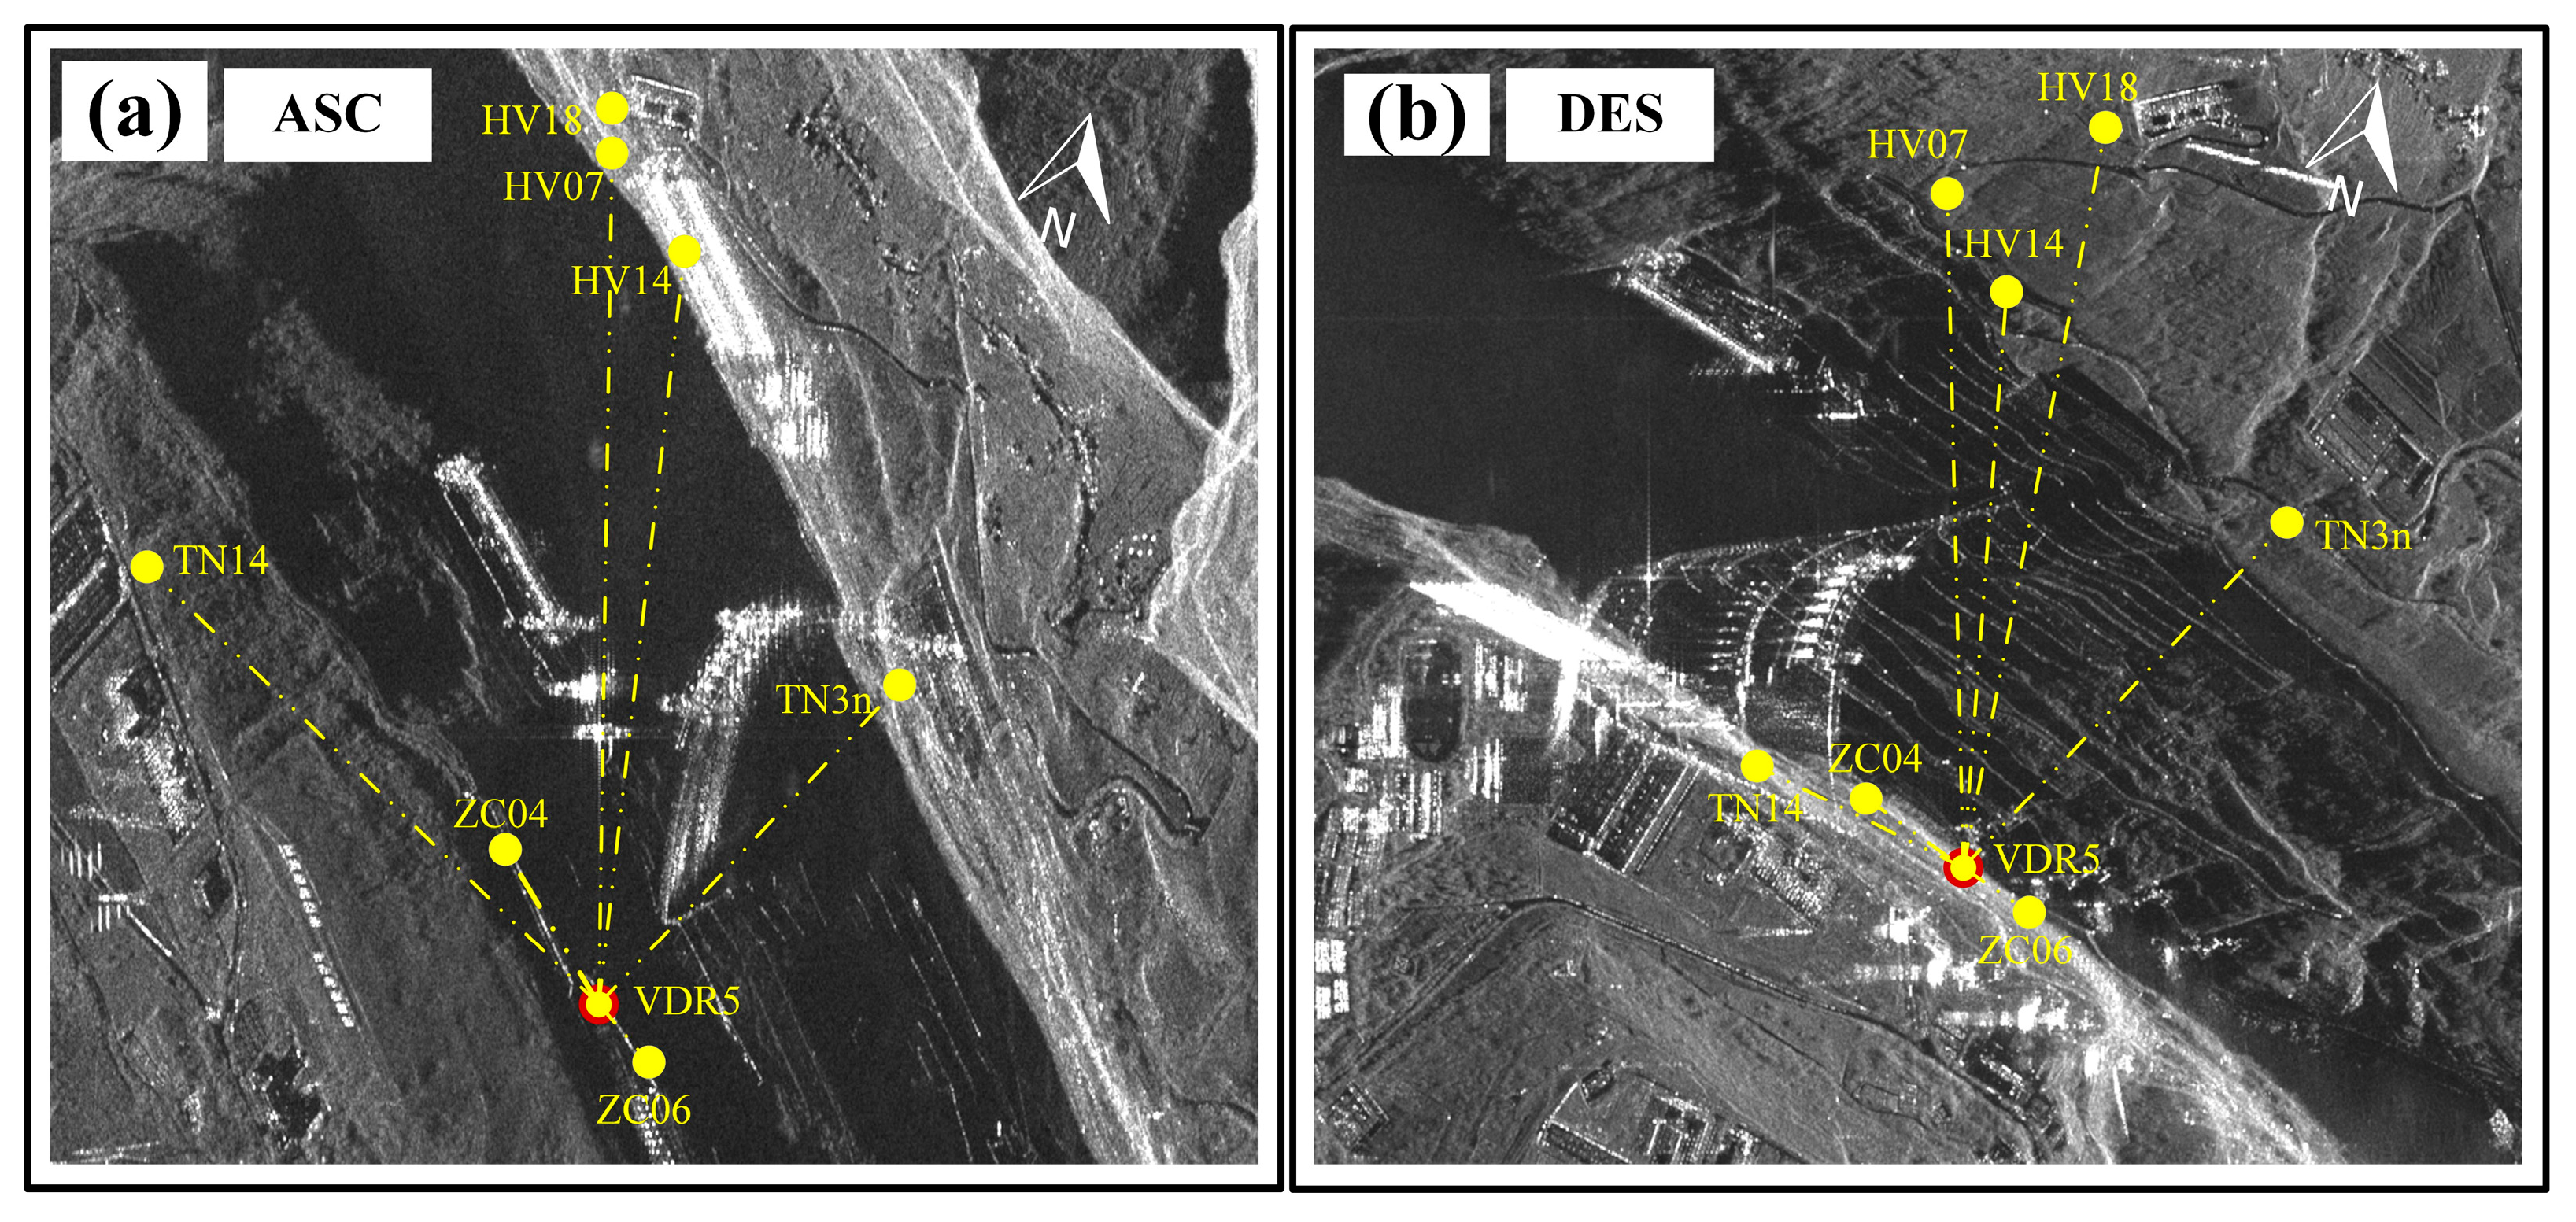
The geometric layout of the eight dihedral CRs in the TerraSAR-X image is shown in Figure 4. Due to the layover of high slopes in the canyon regions around the dam, the background intensity of these dihedral CRs differs significantly between ascending and descending images. The layover of the mountain on the left bank of the dam area results in four dihedral CRs generally being in an area with higher background intensity, while the four dihedral CRs on the right bank generally have lower background intensity. The symmetrically placed dihedral CRs are suitable for both ascending and descending orbit, which helped achieve an applicable signal-to-clutter ratio (SCR) for millimeter-level precision monitoring.
Figure 4a is a map of the average intensity of the ascending orbit, while Figure 4b corresponds to the descending orbit. The background intensities of CRs on the left and right banks between the ascending and descending orbits are completely opposite to one another. After calibrating the positions of the corner reflectors in the radar images, it can be seen that there are significant differences in the geometric layout between the SAR and optical images. Meanwhile, the geometric layout between the ascending and descending orbit images are also different from each other. This is mainly due to radar’s side-looking geometry and the layover/distortion effects in steep terrain in ascending and descending orbits. If the automated triangular network construction scheme proposed by Richard et al. [6] is adopted, the network configuration conditions under ascending and descending orbits are completely inconsistent. Therefore, this paper uses a star topology network with one center point (VDR5) for comparative verification with BDS/GNSS monitoring and traditional surveying and mapping methods.
Considering the point scattering characteristics of dihedral CRs, they can be singled out easily from the background. In this paper, we use the range Doppler algorithm (RDA) equation and the coordinates of the dihedral CRs to extract each CR from the SAR images for analysis [6]. Through a 7 * 7 pixel slice of the CRs’ intensity figures, it can be seen that the central scattering intensity of the most of the dihedral CRs is almost the same in both the ascending and descending orbits. However, the RCS of half of the dihedral CRs differs significantly between the ascending and descending orbit conditions, which may be influenced by various factors such as the manufacturing processes, on-site installation, and sidelobe effects. Comparing the SCR of the dihedral CRs, it can be seen that the overall SCR is higher than 20 dB, approximately 68% of the CRs have an SCR greater than 25 dB, and the highest value can reach 31 dB.
Taking the center position of each dihedral CR as the map center, Figure 5a illustrates the scattering intensity of the dihedral CRs in the averaged SAR image. In Figure 5a, the averaged dihedral intensity figures show that the background intensity values of the four points on the left bank are significantly higher than those on the right bank. Similarly, in the descending orbit image, the background intensity of the four stations on the right bank is slightly higher than that on the left bank. Figure 5b presents the averaged RCS statistics for each CR. It should be noted that although HV07 and ZC04 demonstrate approximately 60 dB intensity in the descending orbit SAR images, their intensities are nearly 70 dB in the ascending orbit. The 10 dB difference means these two dihedral CRs do not possess good qualities for symmetric manufacturing. However, the signal-to-clutter ratio (SCR) of these two CRs can still reach more than 20 dB. Additionally, the TN14 station also has a difference of nearly 10 dB RCS between the ascending and descending orbits. Furthermore, considering the higher background intensity in the descending orbit, the SCRs of TN14 are similar at about 20 dB.
To evaluate whether the dihedral CRs installed during this study fully meet the requirements of high-precision deformation monitoring, we analyzed their accuracy based on their SCR values. This was performed with reference to the theory of radar line-of-sight deformation monitoring accuracy for CRs provided in paper [26].
The formula for evaluating the deformation monitoring accuracy of corner reflectors in the LOS direction based on the SCR can be calculated as follows:
δ = d e r r λ 4 π 1 S C R
In the formula, λ represents the radar wavelength, which is 3.11 cm for TSX data. The SCR’s unit is the real ratio data rather than the dB measurement unit.
By substituting the measured SCR of CRs from the ascending and descending orbit SAR images into Equation (9), the theoretical estimated deformation monitoring accuracy index for each corner reflector can be obtained. For SCR = 15 dB, the theoretical deformation accuracy of CRs in the radar line-of-sight (LOS) direction is less than 0.3 mm. As Figure 5d shows, all of the CRs’ SCRs are higher than 15 dB; this means that the effect of the noise δ component of the CRs studied in this paper is negligible.

3.2. Simulated Deformation in SAR LOS Geometry

To verify the deformation monitoring accuracy of the combined BDS/GNSS and dihedral CR stations in this paper, two stations were horizontally displaced 14 mm westward. Another two stations were raised by 10 mm and 15 mm, as shown in Figure 3. Both the BDS/GNSS time series data and ascending/descending orbit TerraSAR-X data were collected for the accuracy analysis and precision evaluation.
We chose VDR5 as the reference point to select the reference benchmark for both BDS/GNSS and SAR data processing. For one, this was because its intensity in the ascending and descending orbit images is consistent at 70 dB, and its SCR is higher than 25 dB; additionally, the location of this point is on the bedrock near the canyon.
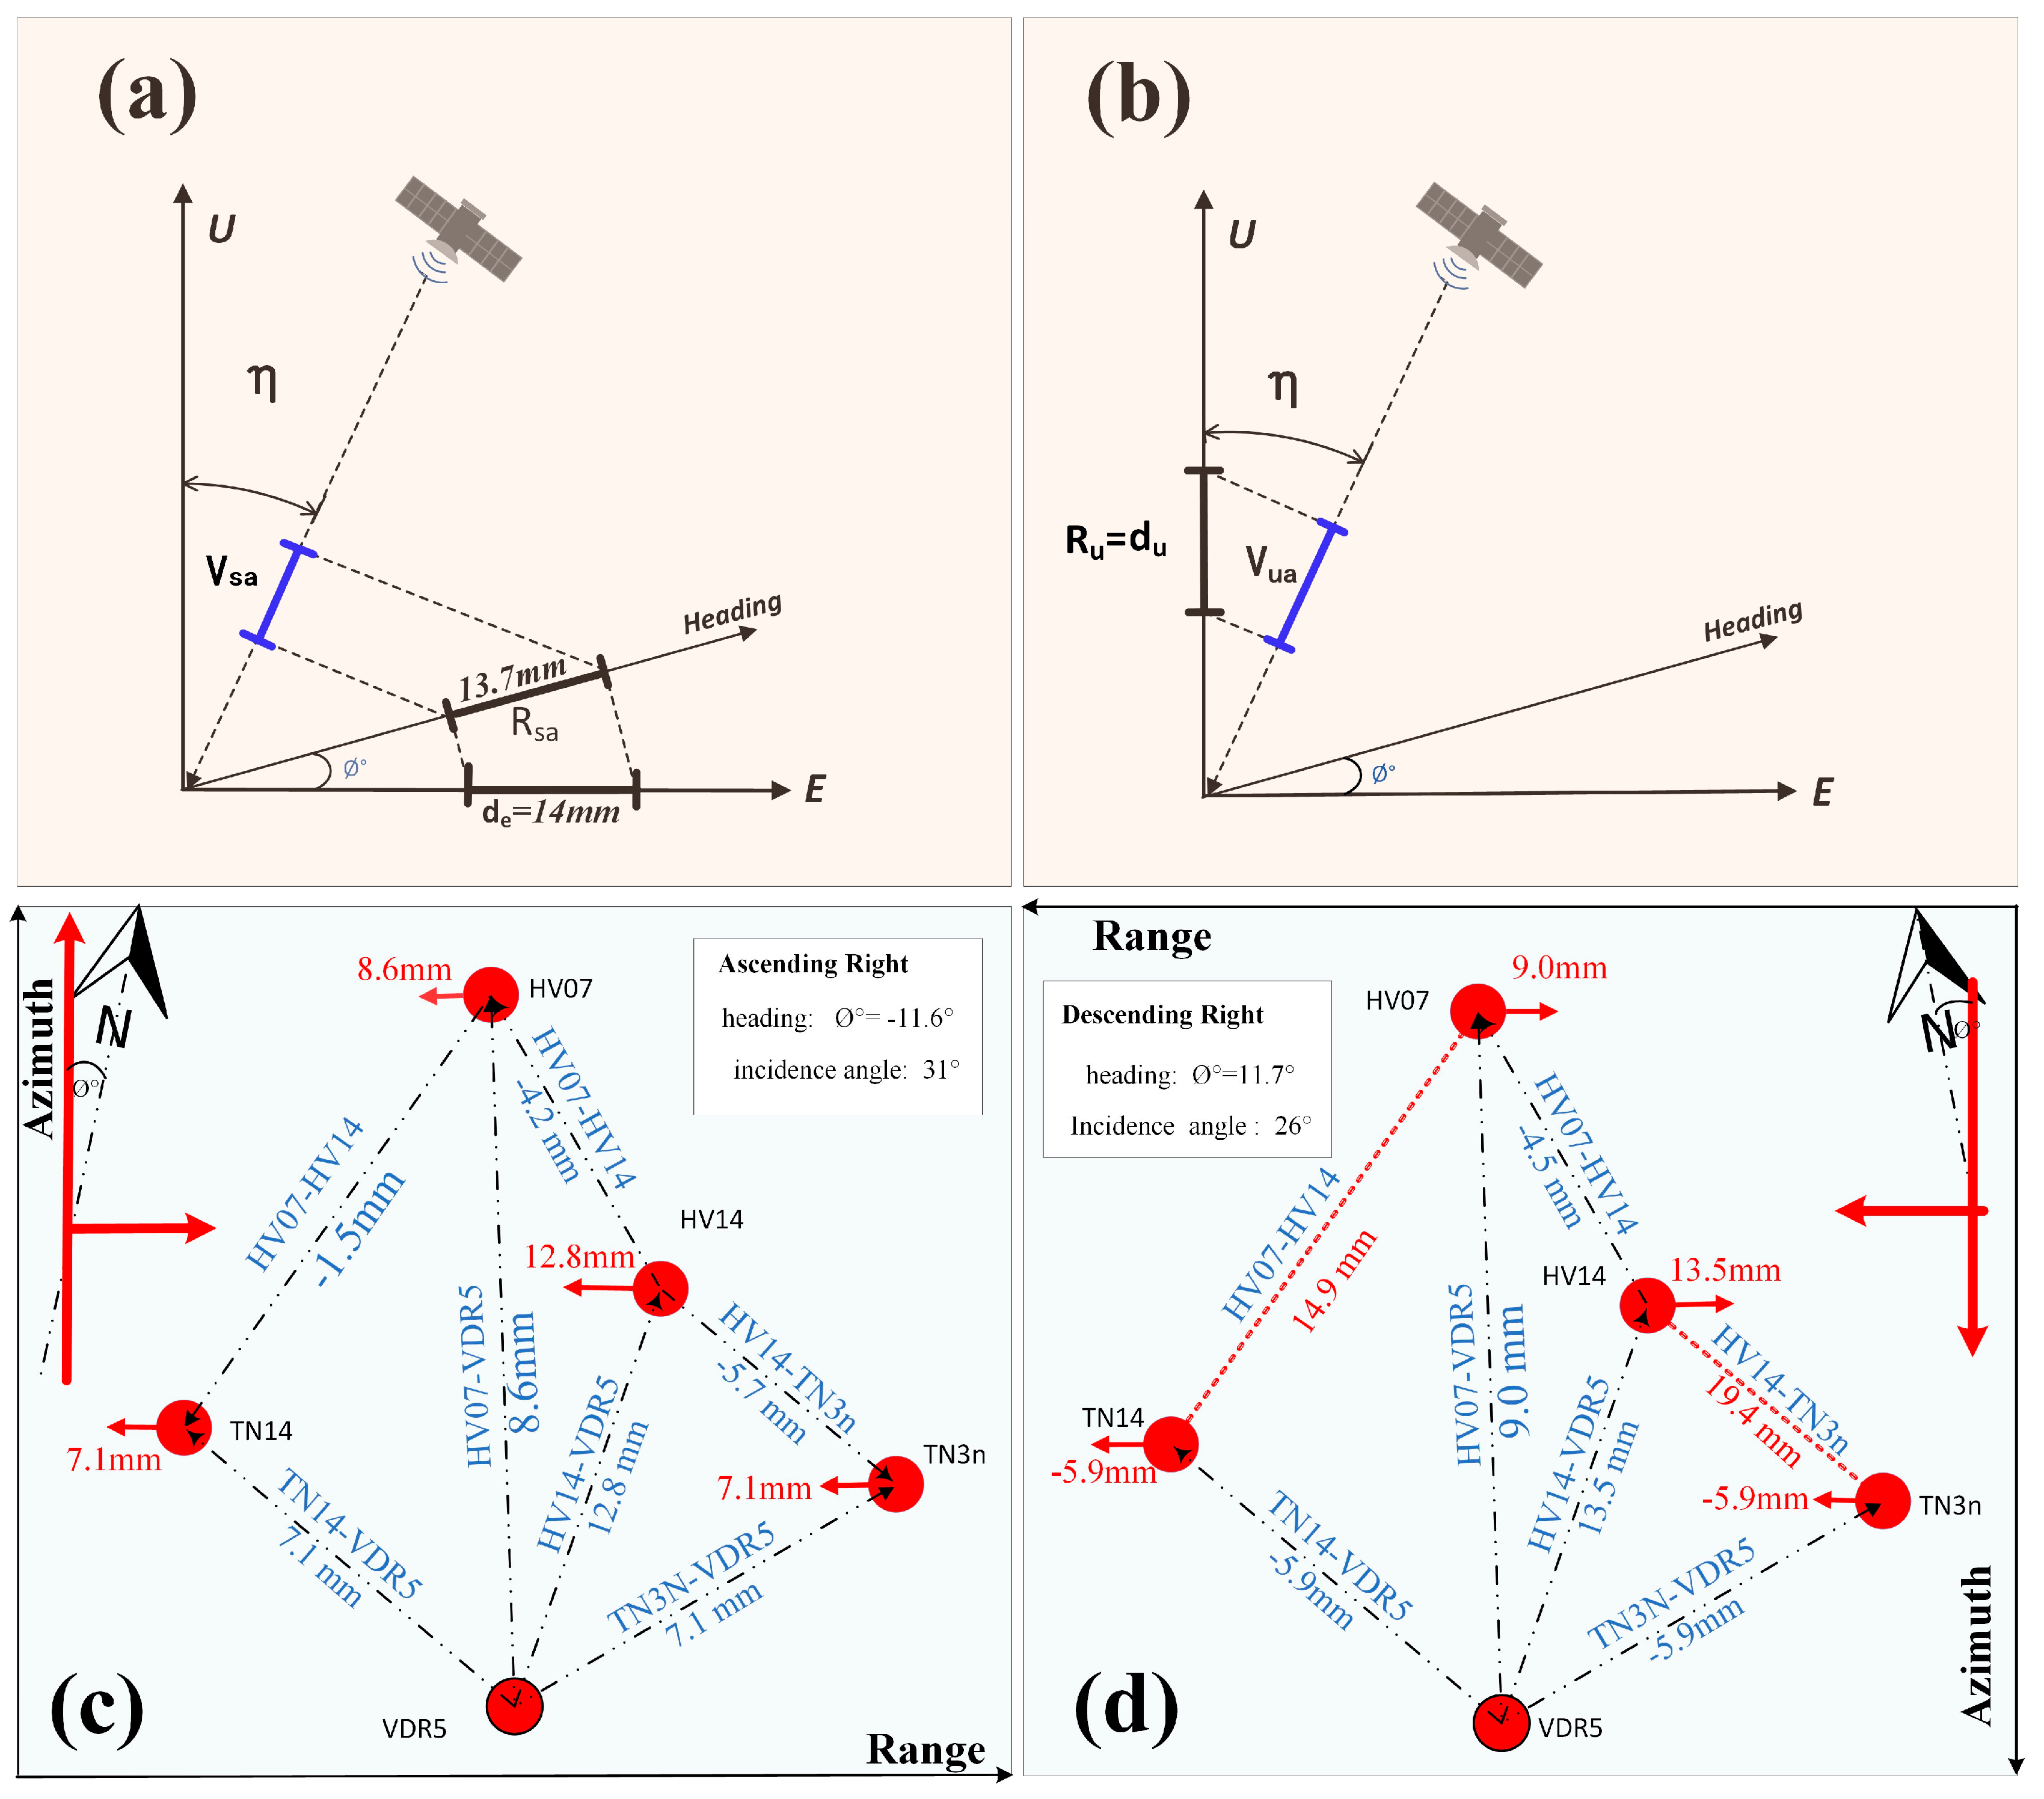
As shown in Figure 6, using VDR5 as the reference point, we calculated the deformation vectors of the four simulated deformation points in the radar LOS direction, and formed a triangular network topological structure with these five points. To distinguish from the deformation directions in the real three-dimensional space, we converted the horizontal and vertical deformation amounts into the radar LOS direction to make them consistent with the differential phases between the CRs in the interferogram for corresponding calculations and analyses. Here, we define deformation toward the radar LOS direction as positive (i.e., deformation toward the satellite incidence direction is positive, and deformation away from the satellite incidence direction is negative). It can be seen that the TN14 and HV14 points moved horizontally westward; their displacements are positive in the ascending orbit right-looking image but negative in the descending orbit. As the vertical displacements are upward, the LOS deformation is positive in both the ascending and descending orbit images, but the lengths of the LOS deformation differ due to the influence of local incidence angles.
Figure 6a shows that the heading angle of 11° reduces the horizontal movement from 14 mm to 13.7 mm. Figure 6b shows that the vertical deformation is not affected by the heading angle but only corresponds to the local incidence angle.
In Figure 6c,d, the LOS deformation between every two CRs is marked on the connecting lines in the topological network. In the ascending orbit right-looking image, these LOS deformations are less than half a wavelength, 15.1 mm. However, in the descending orbit right-looking image, the LOS deformation between HV14 and TN3N exceeds half a wavelength. At this time, in the actual LOS deformation observation of the corner reflector, there is a phase ambiguity between those two points. The deformation-induced phase shift exceeds half a wavelength in the TSX data, which will induce a phase unwrapping error in this case. When LOS deformation exceeds half a wavelength (~15.5 mm for TSX), phase wrapping introduces ambiguity that requires phase unwrapping or auxiliary measurements (e.g., GNSS) to resolve.
In order to carry out accurate LOS deformation measurement, it is simpler to find a suitable and stable reference point to form a star-shaped network for calculation rather than performing the network analysis presented in Figure 6c,d and proposed by [6]. However, this option is only suitable for engineering designs with stable benchmarks, so may not be able to deal with areas prone to earthquakes or landslides.

3.2.1. Transfer of BDS/GNSS Horizontal Deformation to SAR LOS Deformation

In this paper, the BDS/GNSS receivers on the eight stations are of a high quality, and the double-difference baseline results show a nearly 1 mm-precision horizontal deformation monitoring ability. VDR5 was used as the reference point for static double-difference baseline processing of all the BDS/GNSS station data, and the remaining seven stations obtained time series deformation results. The BDS/GNSS data adopts a 30-second sampling rate to conduct station–satellite double-difference observation equations and calculate daily static short-baseline vectors. This post-processing method not only subtracts the ionospheric and tropospheric delays but also effectively improves the accuracy rate in fixing ambiguity. The cutoff elevation angle for satellite observations is set at 15° to effectively reduce errors at low elevation and weighted processing is performed on satellites at different elevation angles. The elevation-dependent weighting law assigns a unit weight for elevations above 30°, and a weight of 2*sin(elevation) for those below 30°. The complex observation environment and occlusion conditions in mountainous canyon areas may lead to GNSS signal interruptions or a loss of lock, causing cycle slips. To achieve efficient and reliable cycle slip detection, both the LG combination (Geometry-Free Combination) and MW combination (Melbourne–Wübbena Combination) methods were used in this study for cycle slip detection [29], and epochs with cycle slips were accurately marked to ensure the accuracy and stability of subsequent high-precision data processing and calculation.
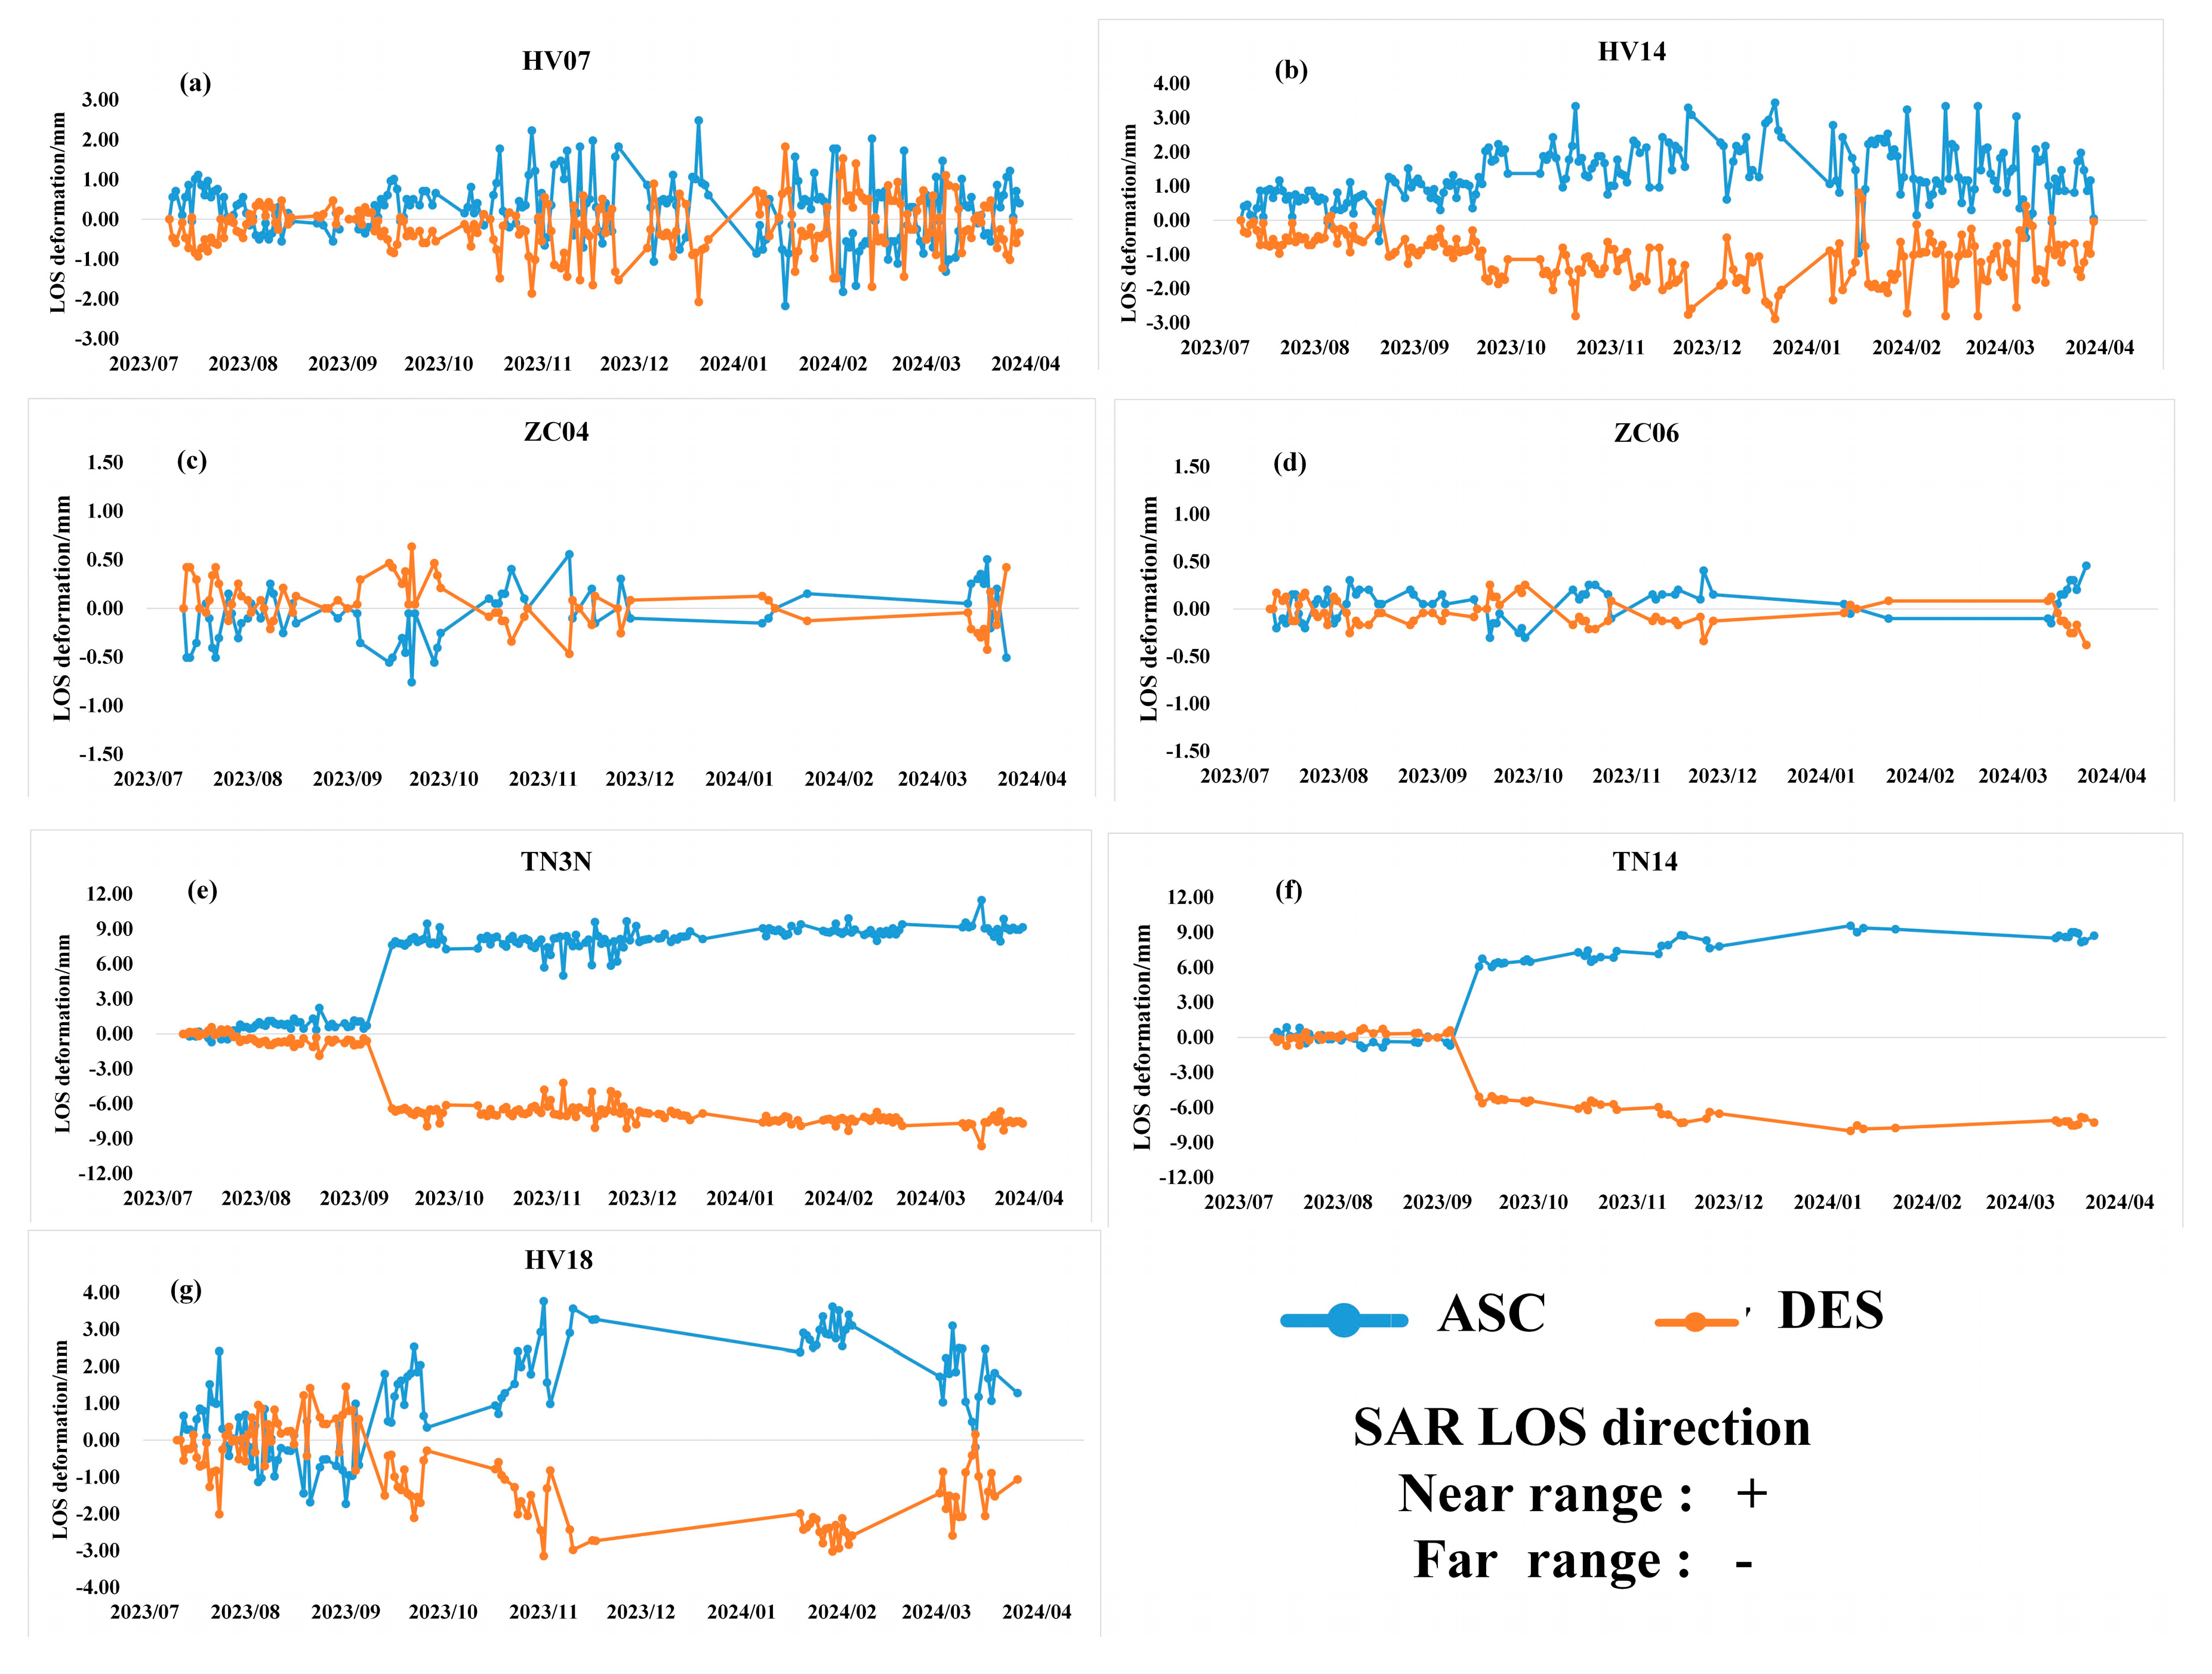
Using the geometry of the side-looking images in both ascending and descending orbit for TerraSAR-X, the mm-level precision BDS/GNSS horizontal deformation results can be projected to SAR LOS deformation via Equation (8). Figure 7 shows the LOS deformation time series of the seven stations derived from the BDS/GNSS horizontal deformation results. The ZC04 and ZC06 stations are located on bedrock, and the derived LOS deformation shows that they are very stable, with no trends of movement relative to the VDR5 station in one year. HV07, HV14, and HV18 are located on thick deposit, and the time series results of these three points exhibit periodic horizontal movement, with a difference of approximately 5–10 mm between winter and summer. However, over an annual cycle, they generally show a regression trend. The geological structure of these stations suggests that this annual periodic variation in the GNSS time series results is somewhat related to changes in water content within the loose deposit.
In Figure 7, the LOS deformation derived from the BDS/GNSS horizontal deformation of the two stations ZC06 and ZC04 is very small, and shows noise of approximately ±0.5 mm in RMS analysis. The HV07, HV14, and HV18 stations exhibit a trend of significant westward movement. Among them, the maximum value at point HV18 can reach 3–4 mm, and the maximum winter variation at HV14 is approximately 2.5 mm westward. It should be noted that HV07 and HV14 underwent vertical displacement on 11 September 2023, but their horizontal monitoring results obtained by the GNSS were not significantly affected.
The TN3N station, which is built on bedrock, was horizontally moved westward by 14 mm on 11 September 2023; a clear opposite LOS jump between ascending and descending orbits can be seen in Figure 7e on that date. Except for the influence of simulated deformation, the GNSS horizontal deformation results of this point in other periods are also relatively stable in the radar LOS direction, with fluctuations of approximately 1–2 mm. The TN14 point is located on the deposit on the right bank and was also horizontally moved westward by 14 mm on 11 September 2023, which shows a similar trend to TN3N. In order to further analyze the accuracy of the simulated horizontal deformation monitoring, we selected BDS/GNSS results from seven days before and after the movement test for further analysis in the following subsections.

3.2.2. BDS/GNSS-Monitored Man-Made Horizontal Deformation and LOS Projection

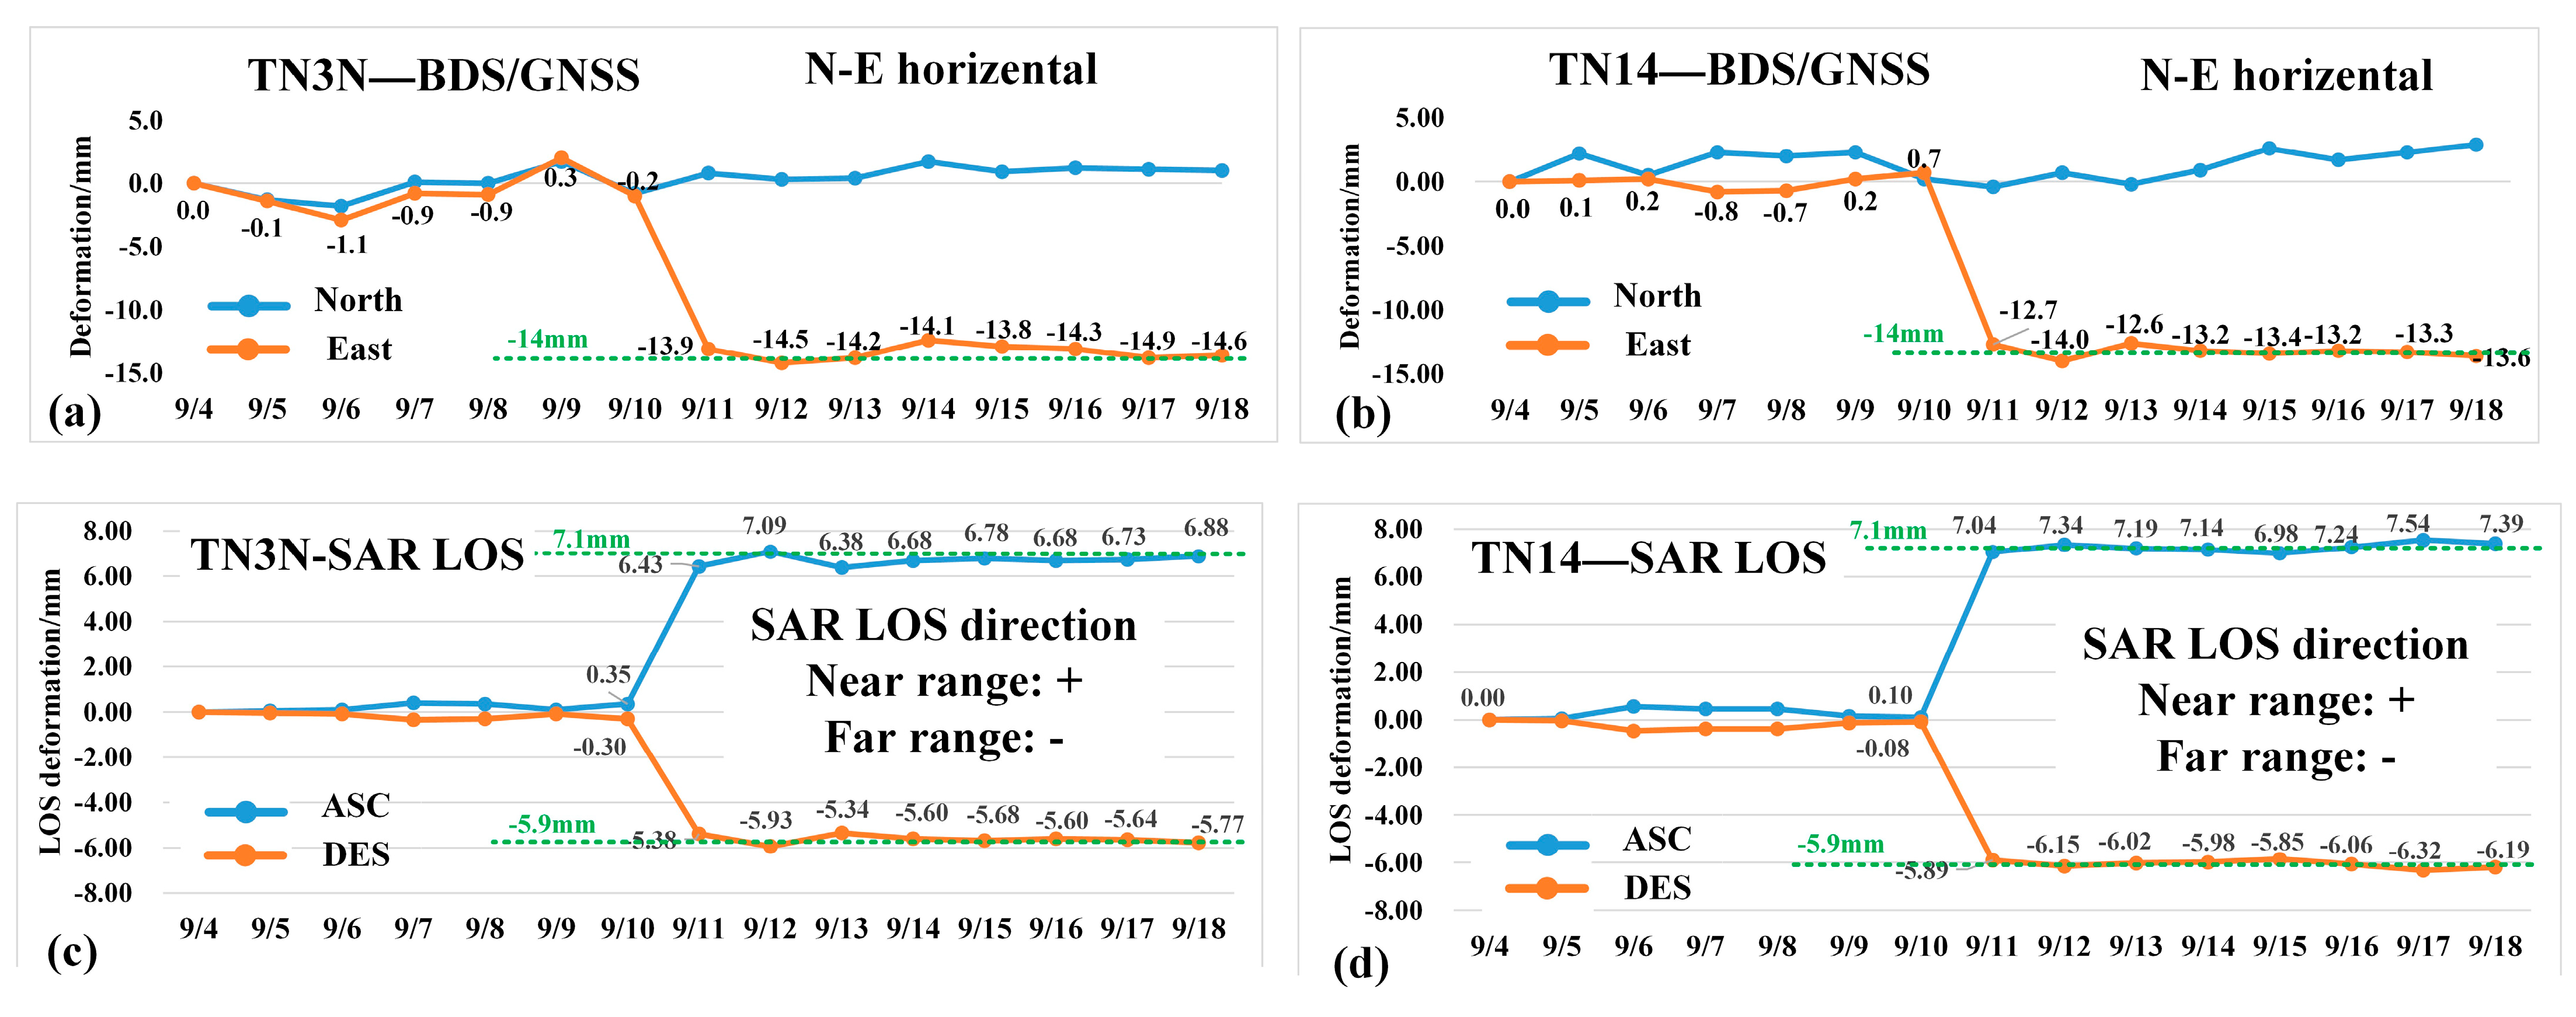
For the TN3N and TN14 points that were horizontally moved westward by 14 mm on 11 September 2023, we used the double differential baseline algorithm to calculate their horizontal displacement time series, with the GNSS data processing interval defined as 24 h to obtain one solution. Figure 8a,b show the horizontal displacement time series of TN3N and TN14 with VDR5 as the reference station for 7 days before and after the artificial movement. The results indicate that the GNSS observation results have millimeter-level accuracy. The deformation in the north direction is less than 1 mm, while that in the east direction fluctuates around 14 mm with a fluctuation range of less than 1 mm.
According to the projection function calculation method in Equation (8), we projected the horizontal displacement monitoring results obtained by the GNSS onto the ascending and descending orbit radar line-of-sight (LOS) directions to obtain the deformation values in the SAR LOS direction, as shown in Figure 8c,d. Due to the 1–2 mm fluctuation in the daily GNSS deformation monitoring results, the LOS deformation calculated using the GNSS also exhibits approximately 1 mm of fluctuation. According to Equation (8), the contribution of horizontal displacement to the radar LOS direction is affected by the sine function of the local incidence angle η , showing a trend of sin η proportional reduction. Similarly, this also causes the contribution of the GNSS horizontal displacement observation errors to the LOS direction to be reduced proportionally. This means that a smaller local radar incidence angle corresponds to lower sensitivity to the influence of horizontal displacement error.

3.2.3. BDS/GNSS-Monitored Man-Made Vertical Deformation and LOS Projection

For the HV07 point moved upward by 10 mm and the HV14 point moved upward by 15 mm on 11 September 2023, we used the RTK static differential baseline algorithm to calculate their vertical displacement time series, with the GNSS data processing interval defined as 24 h to obtain one solution. Figure 9a,b show the GNSS vertical deformation time series results of HV07 and HV14 with VDR5 as the reference for 7 days before and after the artificial movement. Since the vertical monitoring accuracy of the GNSS is lower than the horizontal accuracy, the vertical monitoring results have larger fluctuations, approximately ±3 mm.
According to the projection function calculation method in Equation (7), the vertical displacement monitored with BDS/GNSS was projected into the LOS directions in both ascending and descending orbit radar, as shown in Figure 9c,d. Since the local incidence angles of the ascending and descending orbit SAR images differ by only approximately 7°, the resulting LOS displacements differ by less than 1 mm. The LOS displacements derived from the GNSS results between ascending and descending orbit differ by 0.4~0.7 mm.

4. Fusing BDS and Dihedral CR Results

For the ZC06, ZC04, and HV18 stations without a man-made movement test, we conducted data fusion analysis of BDS/GNSS and InSAR observations using VDR5 as the reference point. The difference in elevation between ZC06 and VDR5 is very small, and both stations are located on the right bank of the Jinsha River under bedrock. Due to the very short 140 m baseline between VDR5 and ZC06, atmospheric phase delays are negligible, so observed interferometric phase differences mainly reflect random noise and CR signal stability. Since ZC04 and HV18 were not affected by the man-made movement test, the long-term time series results of the fusion between the BDS/GNSS and InSAR corner reflectors demonstrate this good performance of the methodology presented in this paper.

4.1. Very-Short-Baseline Differential Results for the Symmetric Diheral Corner Reflectors

Since the VDR5 and ZC06 stations are approximately 140 m apart with a height difference of less than 1 meter, there are no phase unwrapping issues for the differential interferometric phase in the interferograms. Additionally, atmospheric error factors can be ignored over such a short distance [16], so their phase difference directly reflects the random phase noise of the symmetric dihedral corner reflectors used in this paper. The ascending and descending orbit SAR data from TSX were, respectively, registered, interferometrically processed, geometrically positioned, and phase-extracted. Using VDR5 as the reference point, we calculated the differential interferometric phase series of ZC06 relative to VDR5 in the ascending and descending orbit images for corner reflectors. To gain a better understanding, we converted the differential phase between the two CRs into the vertical direction deformation within the local Cartesian coordinate system, as shown in Figure 10.
Figure 10 shows the vertical deformation converted from differential phase between VDR5 and ZC06 stations; both the ascending and descending orbit SAR data exhibit a similar trend over nearly one year. Nearly 0.5 mm LOS deformation contributions were derived from the BDS/GNSS time series results (as shown in Figure 7d); these vertical deformation results mainly originated from the vertical direction. Most of the vertical deformation values are lower than 1 mm, with an overall RMS (root mean square) of approximately ±0.5 mm. This result demonstrates that, based on the TSX strip-map mode SAR data, when the signal-to-clutter ratio (SCR) of the dihedral corner reflectors used in this study exceeds 20 dB, and under short distance conditions, the actual deformation monitoring accuracy is better than 1 mm.

4.2. Man-Made Horizontal Deformation in LOS Direction Monitored with Symmetric Dihedral CR

Using VDR5 as the reference point, the LOS deformation results corresponding to the differential phases between points TN3N and TN14 are calculated (as shown in Figure 11). In order to make this more understandable for users, we used the equivalent millimeters to indicate the differential phase in the LOS direction. According to Equation (7), a horizontal westward displacement of 14 mm corresponds to a radar LOS displacement of 7.1 mm in the ascending orbit image and approximately −5.9 mm in the descending orbit image. The differential results observed by two dihedral corner reflectors in ascending and descending orbits have opposite deformation directions. The InSAR LOS deformation results obtained in this man-made horizontal movement test are consistent with the LOS deformation results derived from BDS/GNSS horizontal measurement (as shown in Figure 7e,f).
In Figure 11, the LOS deformation results of point TN3N have some fluctuations in ascending and descending orbit, with RMS lower than ±1 mm. The fluctuations of point TN14 are slightly larger, with RMS ±1.5 mm in ascending and descending orbit.
Using VDR5 as the reference point, the LOS deformation results corresponding to the differential phases between points HV07 and HV14 were calculated (as shown in Figure 12). According to Equation (6), vertical displacements of 10 mm correspond to radar LOS displacements of 8.6 mm in ascending orbit and 9.0 mm in descending orbit. Meanwhile, the 15 mm vertical displacements correspond to radar LOS displacements of 12.8 mm in ascending orbit and 13.5 mm in descending orbit. It can be inferred that there was a very small difference between ascending and descending orbit in the vertical deformation conversion in this study.
In Figure 12, the measured results show that the LOS deformations of HV07 and HV14 are in good agreement with the man-made vertical movement that occurred on 11 September 2023. As the HV07 and HV14 stations are located on thick deposit, the results derived from BDS/GNSS suggest that this movement caused approximately 2~3 mm of LOS deformation (as shown in Figure 7). Overall, the accuracy of the measurements of the man-made vertical deformation monitored using dihedral CRs is consistent in both the ascending and descending orbit results, with RMS approximately 2 mm in the LOS direction.

4.3. Fusion of BDS/GNSS and Symmetric Dihedral CR Results for Two Stations

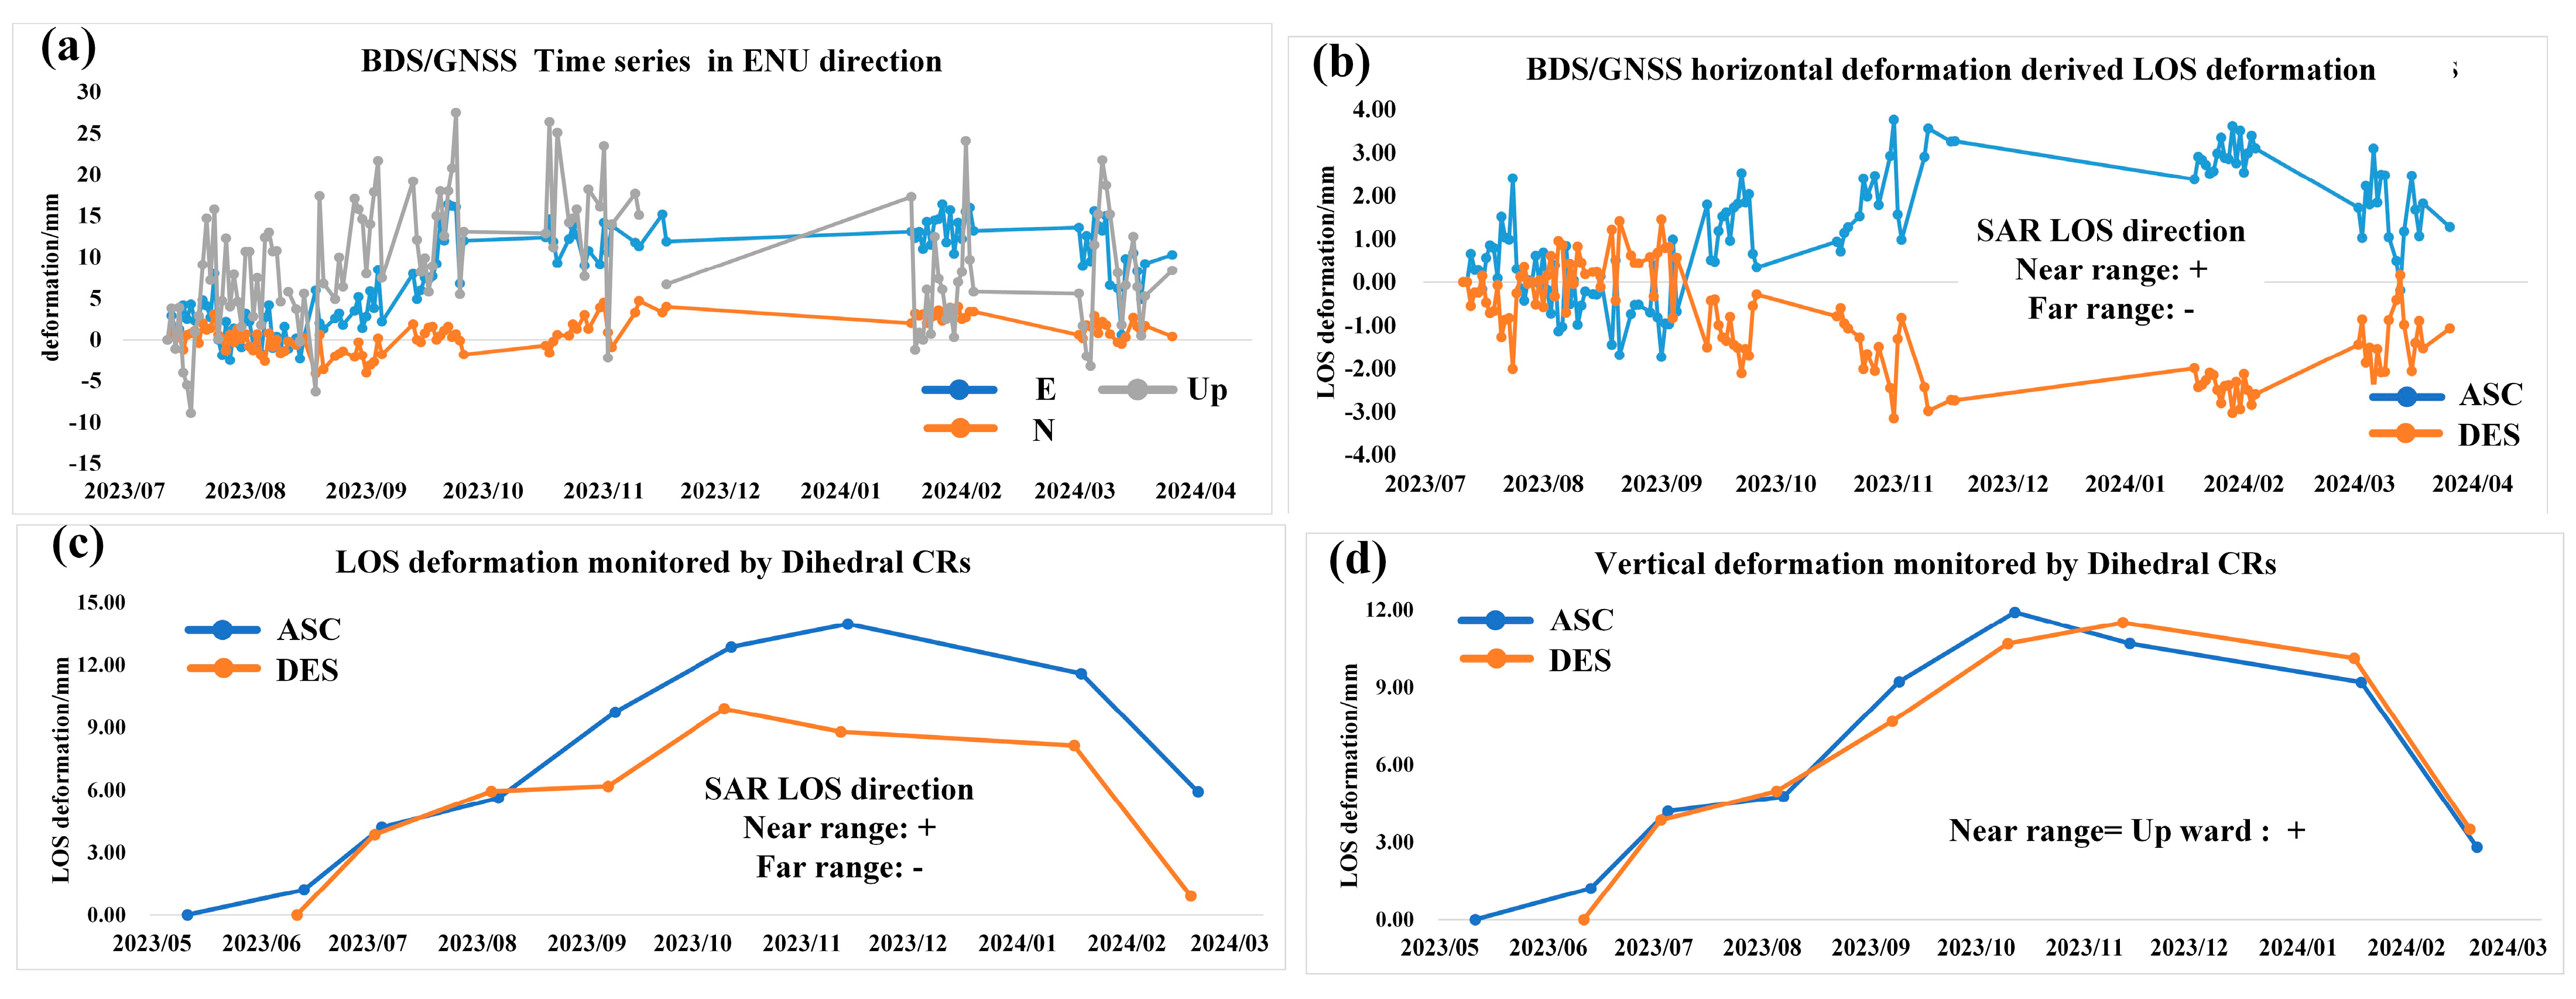
In this study, the HV18 and ZC04 stations experienced no man-made movement, so the GNSS statistic differential baseline and the differential results for the dihedral corner reflector indicate long time series deformation of these two stations. Since the HV18 station is built on an area of thick deposit, its horizontal displacement results from the GNSS time series show periodic westwardly movement, with a maximum of 8 mm (as shown in Figure 13a), and this horizontal deformation effect projected onto the LOS direction is approximately 2–3 mm (as shown in Figure 13b). In this section, we did not project the BD/GNSS-monitored vertical deformation results of the ZC04 station to the LOS direction due to the poor precision and noisy conditions.
The LOS deformation time series derived from the dihedral CR between the HV18 and VDR5 is shown in Figure 13c. The results indicate that the LOS deformation exhibits a periodic upward trend, i.e., upward displacement in autumn, reaching a peak in winter, and a downward trend in spring. This periodicity is consistent with the periodic process of horizontal LOS deformation derived from BDS/GNSS. That periodic deformation process may have been caused by the internal water content of the thick deposit increasing in the summer and decreasing in the winter. In the winter, the internal water content of the deposit decreased and the clay under the CR station moved upward and westward. Meanwhile, in summer, more precipitation penetrated into the deposit body, and the clay body also gradually shrank downward.
Figure 13d shows the deformation direction derived from the differential phase between the HV18 and VDR5 stations, with the correction of the LOS deformation derived from horizontal deformation measured by BDS/GNSS. With the BDS/GNSS correction, the values of vertical deformation derived by CR are consistent in both ascending and descending orbit.
The ZC04 station is located on bedrock, and the GNSS time series of its horizontal displacement remains highly stable over a one-year period, with baseline horizontal displacement of less than 1 mm. Correspondingly, the horizontal displacement measured by the GNSS is projected to be less than 0.5 mm in the radar LOS direction (as shown in Figure 7c). Considering that the GNSS monitoring accuracy is ±1 mm, we did not incorporate the ZC04 horizontal displacement into the CR differential phase processing, but directly compared the ascending/descending orbit LOS deformation results, as shown in Figure 14. The signal-to-clutter ratio (SCR) of ZC04 in the ascending orbit data is nearly 10 dB higher than that in descending orbit data. The LOS displacement measured using the ascending orbit data appears to be more stable in the deformation time series, while the descending orbit results show slightly higher fluctuations.

4.4. Workflow Combining BDS/GNSS and Double CRs

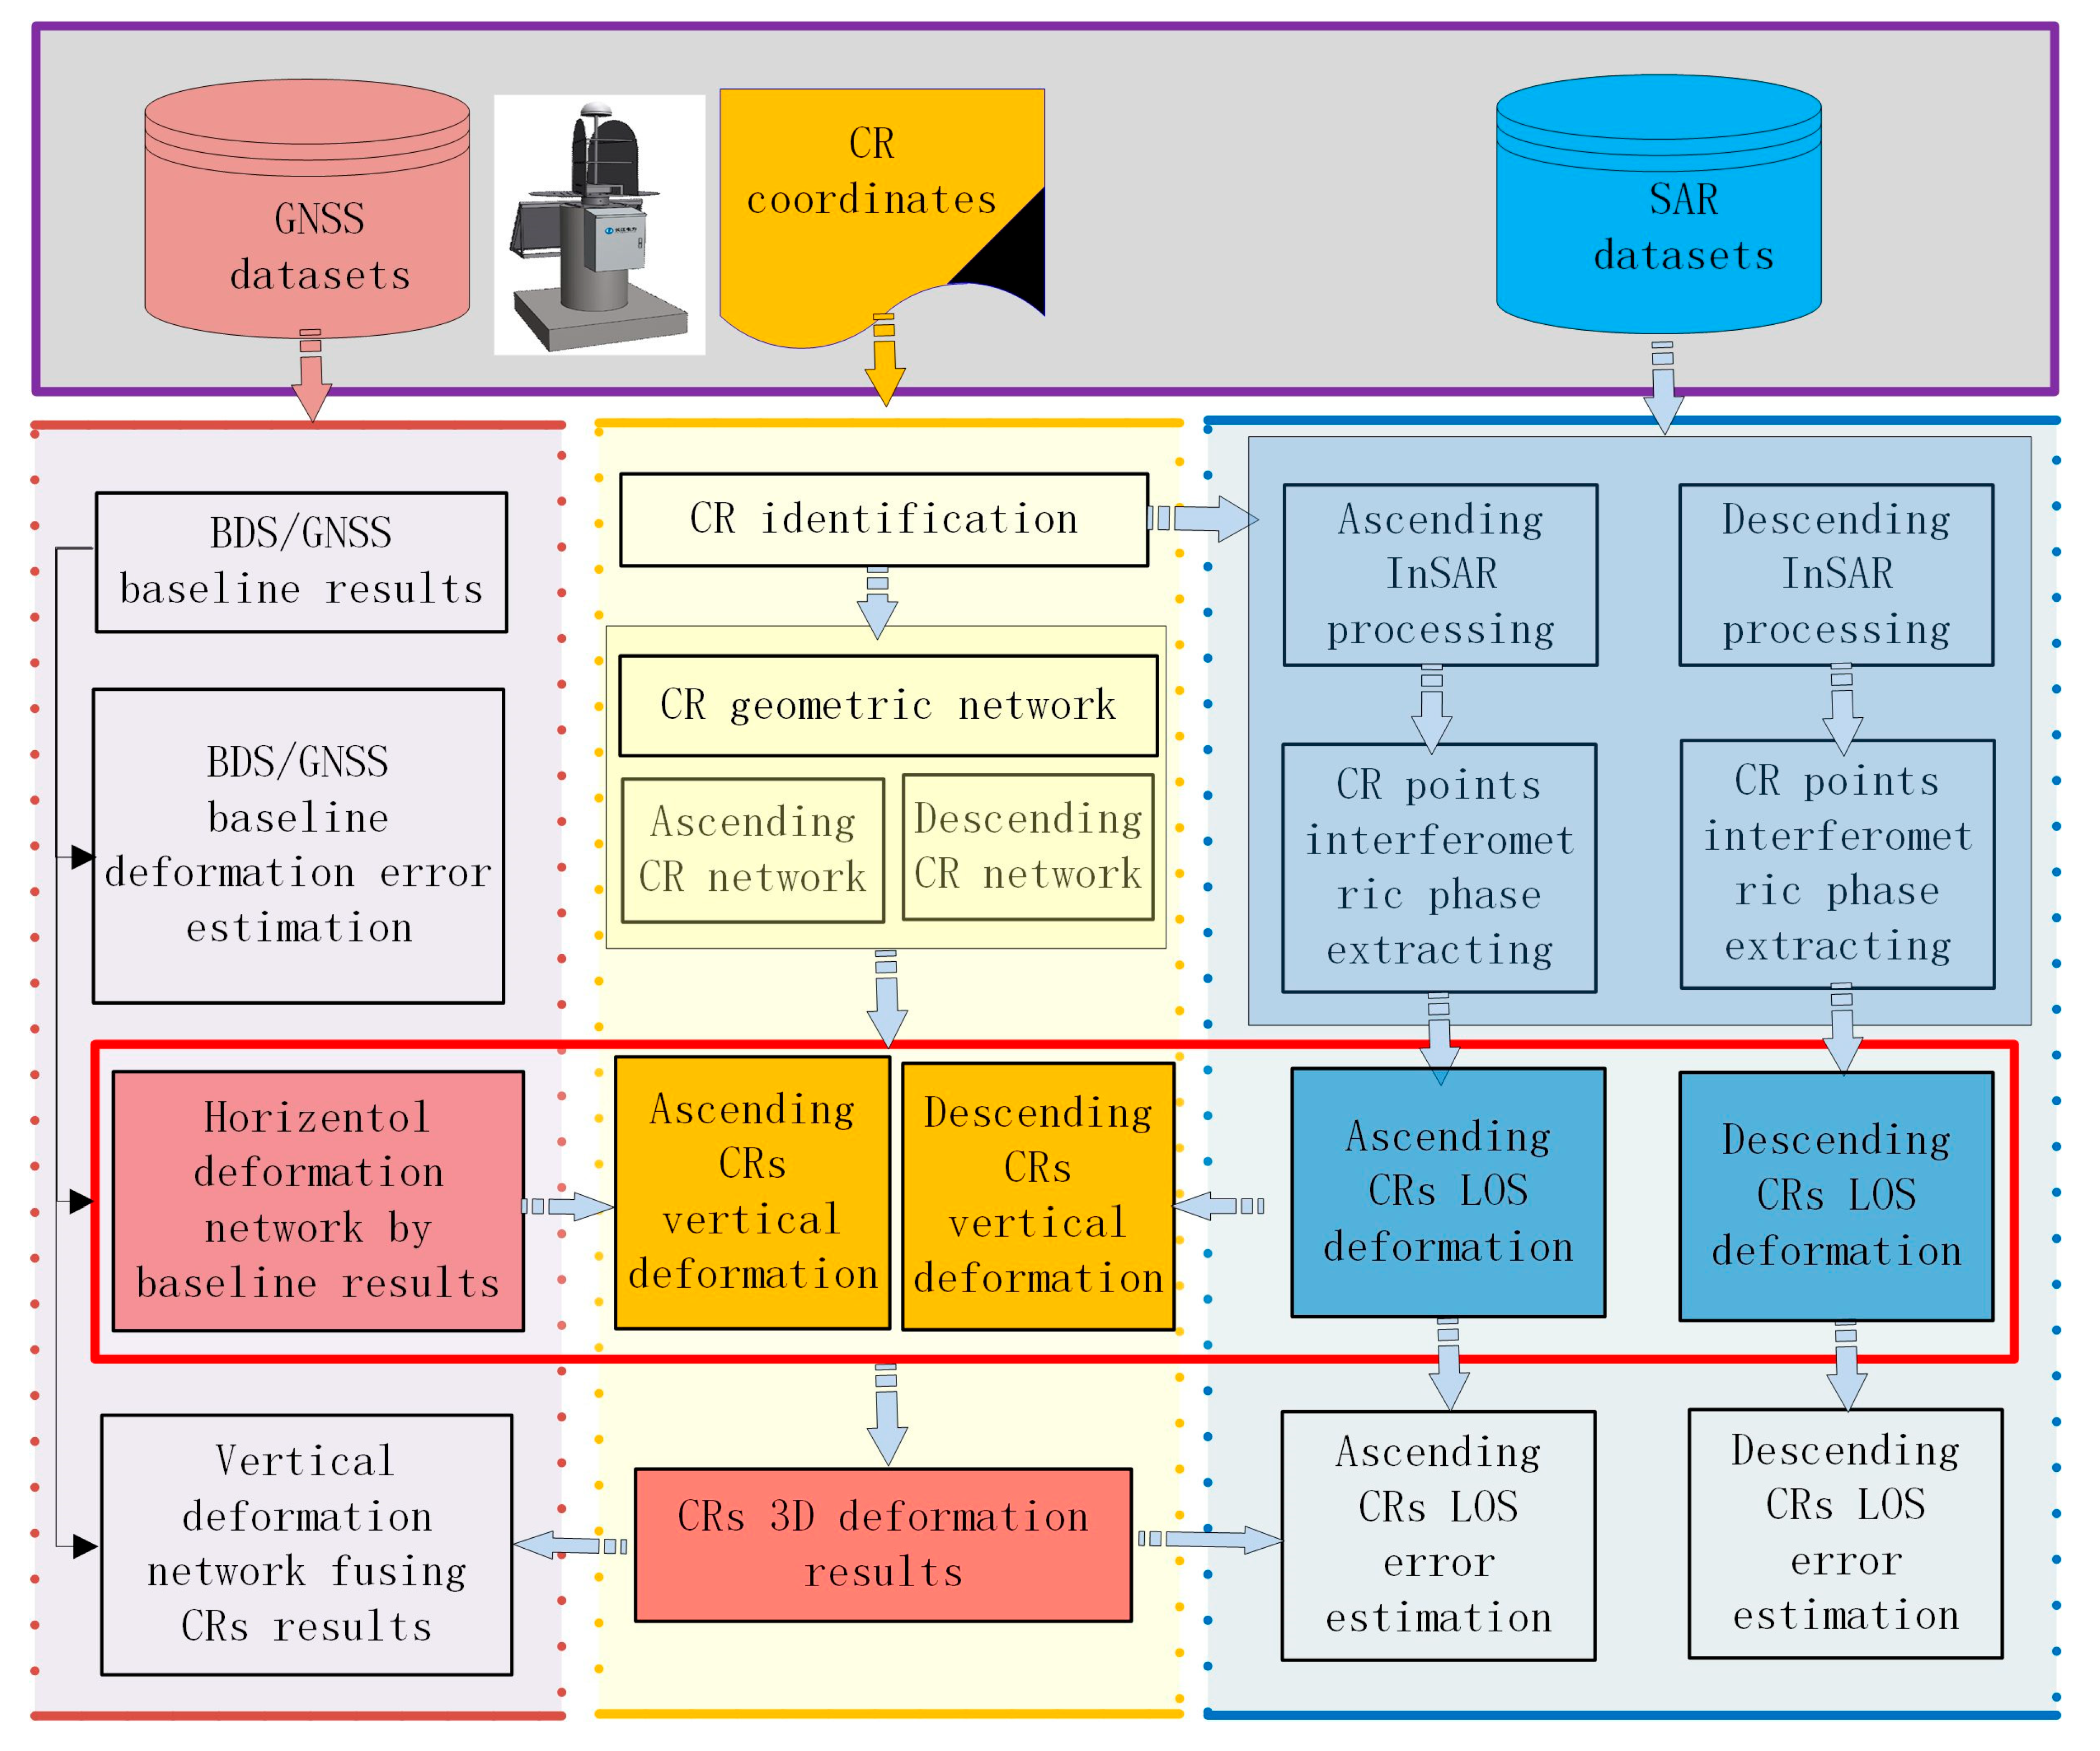
In order to illustrate the processing of GNSS data, SAR data, and the combination of ascending and descending orbit CR results, a flowchart showing the detailed workflow is shown in Figure 15. Symmetric dihedral CRs are installed at the BD/GNSS stations; with these, can obtain the CR coordinates with 2~3-centimeter precision, with reference to RTIF. The CR’s geometric network is defined by each station’s geological conditions and traditional surveying.
The SAR satellite’s data acquisition should be designed according to the direction of the symmetric dihedral CRs. In this case study, we installed the CRs in the ascending right and descending right heading directions. The heading angle and local incidence angle of the SAR are key parameters for horizontal and vertical deformation analysis using CRs. This can be modeled in the CRs’ network. Horizontal deformation is introduced between the CRs to obtain their vertical deformation combined with their LOS deformation. This makes it possible to obtain the 1~2 mm-precision 3D deformation monitoring results achieved in this study. With consistent checks of the ascending and descending vertical deformation of the symmetric dihedral CRs, the final vertical deformation results can be introduced into BDS/GNSS time series results for correction.

5. Conclusions

In this paper, a methodology for fusing the data from the BDS/GNSS and symmetric dihedral CR station created by Yangtze Power Co., Ltd., was validated. With eight on-site combined BDS/GNSS CR stations deployed in the canyon area of a large hydropower station reservoir along the Jinsha River, TerraSAR-X strip mode ascending and descending data were collected for over one year.
Through the man-made upward and westward movement experiments, the accuracy of the BDS/GNSS and symmetric dihedral CRs in deformation monitoring was tested. Additionally, using the ascending/descending orbit SAR data and long-term BDS/GNSS monitoring results, the methodology of fused three-dimensional deformation monitoring proposed in this paper was verified. The following conclusions were obtained:
1. The signal-to-clutter ratios (SCRs) of the symmetric dihedral corner reflectors deployed in this paper all exceed 20 dB in the canyon area, with a theoretically achievable deformation monitoring accuracy of 0.3 mm.
2. In the canyon regions around the reservoir along the Jinsha River, the horizontal deformation monitoring accuracy of the BDS/GNSS can reach ±1 mm, but the vertical monitoring accuracy is approximately ±3~5 mm.
3. The deformation monitoring accuracy of the symmetric dihedral CR station in the LOS direction, calculated based on TSX strip-map mode interferometric data, is better than ±1 mm under very-short-baseline conditions.
4. By fusing the BDS/GNSS horizontal displacement results and the corner reflector vertical monitoring results, the BDS/GNSS combined CR stations can achieve 1 mm precision in three dimensions (horizontal and vertical).
5. The results of this study demonstrate that based on the ascending/descending orbit data of Germany’s TerraSAR-X satellite and the BDS/GNSS high-precision receivers combined with symmetric dihedral CRs, the stations created by Yangtze Power can achieve 1 mm three-dimensional deformation monitoring accuracy. Meanwhile, 1 mm precision in the upwards direction is essential for these control points, as only traditional high-precision leveling can achieve this. Stations with CRs can use the results of InSAR to replace the leveling measurement, which will save significant labor and improve efficiency when SAR data are easy to acquire. In future work, the manufacturing quality of the dihedral CRs should be improved, as half of the products experienced significant RCS loss in one of the side-looking geometries in this case study.
With the improvement in China’s SAR satellite technology, it is expected that more frequent monitoring of reservoir slopes will be achieved in the future, thereby realizing near-real-time 3D deformation monitoring using BDS combined with CRs in canyon regions that help to protect super engineering infrastructure such as dams and bridges. The method proposed in this paper has broad application prospects and important application value in the field of safety monitoring for artificial slopes in high dams and large reservoirs in China.

Author Contributions

Conceptualization, Y.M. (Yanpan Mao); methodology, Z.Q. and Z.T.; software, R.F.; formal analysis, T.L.; investigation, X.D.; writing—original draft preparation, Y.M. (Yanpan Mao) and Z.Q.; writing—review and editing, Y.M. (You Mou) and Z.P.; project administration, Z.Q.; funding acquisition, Y.M. (Yanpan Mao) and T.L. All authors have read and agreed to the published version of the manuscript.

Funding

This study was supported by funding from the following: Project funded by China Yangtze Power Co., Ltd. (No. Z152202016); Project of the National Key Research and Development Program “Key Technologies and Equipment for Construction and Transformation of Intelligent Dam Thorough Perception System” (2024YFC3210704); and the National Natural Science Foundation of China (42074031, 42274025).

Data Availability Statement

The TerraSAR data area were acquired from Airbus company that can not be shared to third party. The GNSS data area were collected by China Yangtze Power Co., Ltd. only for internal use that can not be shared to third party.

Conflicts of Interest

Author Z.Q., Y.M.,Z.T., Y.M., X.D. and Z.P. were employed by the company China Yangtze Power Co., Ltd. The remaining authors declare that the research was conducted in the absence of any commercial or financial relationships that could be construed as a potential conflict of interest.

References

  1. Wright, T.J.; Parsons, B.E.; Lu, Z. Toward mapping surface deformation in three dimensions using InSAR. Geophys. Res. Lett. 2004, 31, L01607. [Google Scholar] [CrossRef]
  2. Hu, J.; Li, Z.W.; Ding, X.L.; Zhu, J.J.; Zhang, L.; Sun, Q. Resolving three-dimensional surface displacements from InSAR measurements: A review. Earth Sci. Rev. 2014, 133, 1–17. [Google Scholar] [CrossRef]
  3. Dai, K.; Liu, G.; Li, Z.; Li, T.; Yu, B.; Wang, X.; Singleton, A. Extracting vertical displacement rates in Shanghai (China) with multi-platform SAR images. Remote Sens. 2015, 7, 9542. [Google Scholar] [CrossRef]
  4. Fuhrmann, T.; Garthwaite, M.C. Resolving three-dimensional surface motion with InSAR: Constraints from multi-geometry data fusion. Remote Sens. 2019, 11, 241. [Google Scholar] [CrossRef]
  5. Brouwer, W.S.; Hanssen, R.F. A treatise on InSAR geometry and 3-D displacement estimation. IEEE Trans. Geosci. Remote Sens. 2023, 61, 1–11. [Google Scholar] [CrossRef]
  6. Czikhardt, R.; van der Marel, H.; Papco, J. GECORIS: An open-source toolbox for analyzing time series of corner reflectors in InSAR geodesy. Remote Sens. 2021, 13, 926. [Google Scholar] [CrossRef]
  7. Samsonov, S.; Tiampo, K.; Rundle, J.; Li, Z. Application of DInSAR-GPS optimization for derivation of fine-scale surface motion maps of southern California. IEEE Trans. Geosci. Remote Sens. 2007, 45, 512–521. [Google Scholar] [CrossRef]
  8. Liu, Y.; Wang, G.; Yu, X.; Wang, K. Sentinel-1 InSAR and GPS-integrated long-term and seasonal subsidence monitoring in Houston, Texas, USA. Remote Sens. 2022, 14, 6184. [Google Scholar] [CrossRef]
  9. Komac, M.; Holley, R.; Mahapatra, P.; van der Marel, H.; Bavec, M. Coupling of GPS/GNSS and radar interferometric data for a 3D surface displacement monitoring of landslides. Landslides 2015, 12, 241–257. [Google Scholar] [CrossRef]
  10. Huang, J.; Du, W.; Jin, S.; Xie, M. Integrated PSInSAR and GNSS for 3D displacement in the Wudongde area. Land 2024, 13, 429. [Google Scholar] [CrossRef]
  11. Pepe, A.; Calò, F. A review of interferometric synthetic aperture RADAR (InSAR) multi-track approaches for the retrieval of Earth’s surface displacements. Appl. Sci. 2017, 7, 1264. [Google Scholar] [CrossRef]
  12. Alatza, S.; Papoutsis, I.; Paradissis, D.; Kontoes, C.; Papadopoulos, G.A. Multi-temporal InSAR analysis for monitoring ground deformation in Amorgos Island, Greece. Sensors 2020, 20, 338. [Google Scholar] [CrossRef]
  13. Hu, X.; Bürgmann, R.; Schulz, W.H.; Fielding, E.J. Four-dimensional surface motions of the Slumgullion landslide and quantification of hydrometeorological forcing. Nat. Commun. 2020, 11, 2792. [Google Scholar] [CrossRef]
  14. Brouwer, W.; Hanssen, R. Estimating three-dimensional displacements with InSAR: The strapdown approach. J. Geod. 2024, 98, 110. [Google Scholar] [CrossRef]
  15. Chang, F.; Dong, S.; Yin, H.; Ye, X.; Wu, Z.; Zhang, W.; Zhu, H. 3D displacement time series prediction of a north-facing reservoir landslide powered by InSAR and machine learning. J. Rock Mech. Geotech. Eng. 2025, 17, 4445–4461. [Google Scholar] [CrossRef]
  16. Ye, X.; Kaufmann, H.; Guo, X.F. Landslide monitoring in the Three Gorges area using D-INSAR and corner reflectors. Photogramm. Eng. Remote Sens. 2004, 70, 1167–1172. [Google Scholar] [CrossRef]
  17. Garthwaite, M. On the design of radar corner reflectors for deformation monitoring in multi-frequency InSAR. Remote Sens. 2017, 9, 648. [Google Scholar] [CrossRef]
  18. Schlögel, R.; Thiebes, B.; Mulas, M.; Cuozzo, G.; Notarnicola, C.; Schneiderbauer, S.; Crespi, M.; Mazzoni, A.; Mair, V.; Corsini, A. Multi-temporal X-band radar interferometry using corner reflectors: Application and validation at the Corvara landslide (Dolomites, Italy). Remote Sens. 2017, 9, 739. [Google Scholar] [CrossRef]
  19. Wang, Y.; Bai, Z.; Lin, Y.; Yang, L. On the evaluation and verification of bidirectional rectangle corner reflectors for deformatiomonitoring in time-series InSAR. Geomat. Inf. Sci. Wuhan Univ. 2021, 46, 1471–1477. [Google Scholar] [CrossRef]
  20. Xia, Z.; Motagh, M.; Li, T. Performance analysis of dihedral corner reflectors for slope movements: A case study from Aniangzhai landslide in China. IEEE Geosci. Remote Sens. Lett. 2022, 19, 4515605. [Google Scholar] [CrossRef]
  21. Beltramone, L.; Rindinella, A.; Vanneschi, C.; Salvini, R. Multitemporal Monitoring of Rocky Walls Using Robotic Total Station Surveying and Persistent Scatterer Interferometry. Remote Sens. 2024, 16, 3848. [Google Scholar] [CrossRef]
  22. Kelevitz, K.; Wright, T.J.; Hooper, A.J.; Selvakumaran, S. Novel corner-reflector array application in essential infrastructure monitoring. IEEE Trans. Geosci. Remote Sens. 2022, 60, 1–18. [Google Scholar] [CrossRef]
  23. Bányai, L.; Nagy, L.; Hooper, A.; Bozsó, I.; Szűcs, E.; Wesztergom, V. Investigation of integrated twin corner reflectors designed for 3-D InSAR applications. IEEE Geosci. Remote Sens. Lett. 2020, 17, 1013–1016. [Google Scholar] [CrossRef]
  24. Luzi, G.; Barra, A.; Gao, Q.; Espín-López, P.F.; Palamà, R.; Monserrat, O.; Crosetto, M.; Colell, X. A low-cost active reflector and a passive corner reflector network for assisting landslide monitoring using multi-temporal InSAR. Remote Sens. Lett. 2022, 13, 1080–1089. [Google Scholar] [CrossRef]
  25. Liu, J.; Li, T.; Ma, S.; Wen, Y.; Xu, Y.; Nie, G. Analysis of the dihedral corner reflector’s RCS features in multi-resource SAR. Appl. Sci. 2024, 14, 5054. [Google Scholar] [CrossRef]
  26. Ferretti, A.; Savio, G.; Barzaghi, R.; Borghi, A.; Musazzi, S.; Novali, F. Submillimeter accuracy of InSAR time series: Experimental validation. IEEE Trans. Geosci. Remote Sens. 2007, 45, 1142–1153. [Google Scholar] [CrossRef]
  27. Quin, G.; Loreaux, P. Submillimeter accuracy of multipass corner reflector monitoring by PS technique. IEEE Trans. Geosci. Remote Sens. 2013, 51, 1775–1783. [Google Scholar] [CrossRef]
  28. Liu, H.; Zhou, B.; Miao, C.; Li, S.; Xu, L.; Zheng, K. Refinement analysis of real dihedral and trihedral CR-InSAR based on TerraSAR-X and Sentinel-1A images. IEEE J. Sel. Top. Appl. Earth Obs. Remote Sens. 2024, 17, 18739–18750. [Google Scholar] [CrossRef]
  29. Liu, Z. A new automated cycle slip detection and repair method for a single dual-frequency GPS receiver. J. Geod. 2011, 85, 171–183. [Google Scholar] [CrossRef]
  30. Jiang, W.; Liu, H.; Liu, W.; He, Y. CORS development for Xilongchi dam deformation monitoring. Geomat. Inf. Sci. Wuhan Univ. 2012, 37, 949–952. [Google Scholar]
  31. Li, X.; Ge, M.; Dai, X.; Ren, X.; Fritsche, M.; Wickert, J.; Schuh, H. Accuracy and reliability of multi-GNSS real-time precise positioning: GPS, GLONASS, BeiDou, and Galileo. J. Geod. 2015, 89, 607–635. [Google Scholar] [CrossRef]
  32. Xi, R.; Chen, H.; Meng, X.; Jiang, W.; Chen, Q. Reliable dynamic monitoring of bridges with integrated GPS and BeiDou. J. Surv. Eng. 2018, 144, 04018008. [Google Scholar] [CrossRef]
  33. Jiang, W.; Liu, H.; Zhou, X.; Li, Z. Analysis of long-term reservoir deformation using continuous GPS observation data. Acta Geod. Cartogr. Sin. 2012, 41, 682–689. [Google Scholar]
  34. Xu, S.; Li, Z.; Liu, J.; Li, Z. Reliability analysis of the GPS automatic monitoring system for the appearance deformation of Geheyan Dam. GNSS World China 2000, 25, 25–28. [Google Scholar]
  35. He, X.; Yang, G.; Ding, X.; Chen, Y. Application and evaluation of a GPS multi-antenna system for dam deformation monitoring. Earth Planets Space 2004, 56, 1035–1039. [Google Scholar] [CrossRef]
  36. Carlà, T.; Tofani, V.; Lombardi, L.; Raspini, F.; Bianchini, S.; Bertolo, D.; Thuegaz, P.; Casagli, N. Combination of GNSS, satellite InSAR, and GBInSAR remote sensing monitoring to improve the understanding of a large landslide in high alpine environment. Geomorphology 2019, 335, 62–75. [Google Scholar] [CrossRef]
  37. Konakoglu, B. Deformation analysis using static, kinematic and dynamic geodetic deformation models with GNSS: Deriner Dam, Artvin, Turkey. Exp. Tech. 2021, 45, 645–660. [Google Scholar] [CrossRef]
  38. Yuan, Y.; Gong, J.; Wang, Y. Application of BeiDou + GPS dual-satellite system in safety monitoring of high slopes at Changheba Hydropower Station. Sichuan Water Power 2013, 32, 112–116. [Google Scholar]
  39. Huang, S.; Chen, J.; Wang, H. Contribution of the BDS to availability and reliability improvement: A case study of dam surface displacement monitoring in China. Geod. Geodyn. 2019, 10, 256–264. [Google Scholar] [CrossRef]
  40. Han, J.; Tu, R.; Lu, X.; Fan, L.; Zhuang, W.; Wang, W.; Zhao, F.; Dalai, B.; Shonazarovich, G.M.; Safarov, M. Analysis of BDS/GPS deformation monitoring for the Lake Sarez Dam. Remote Sens. 2023, 15, 4773. [Google Scholar] [CrossRef]
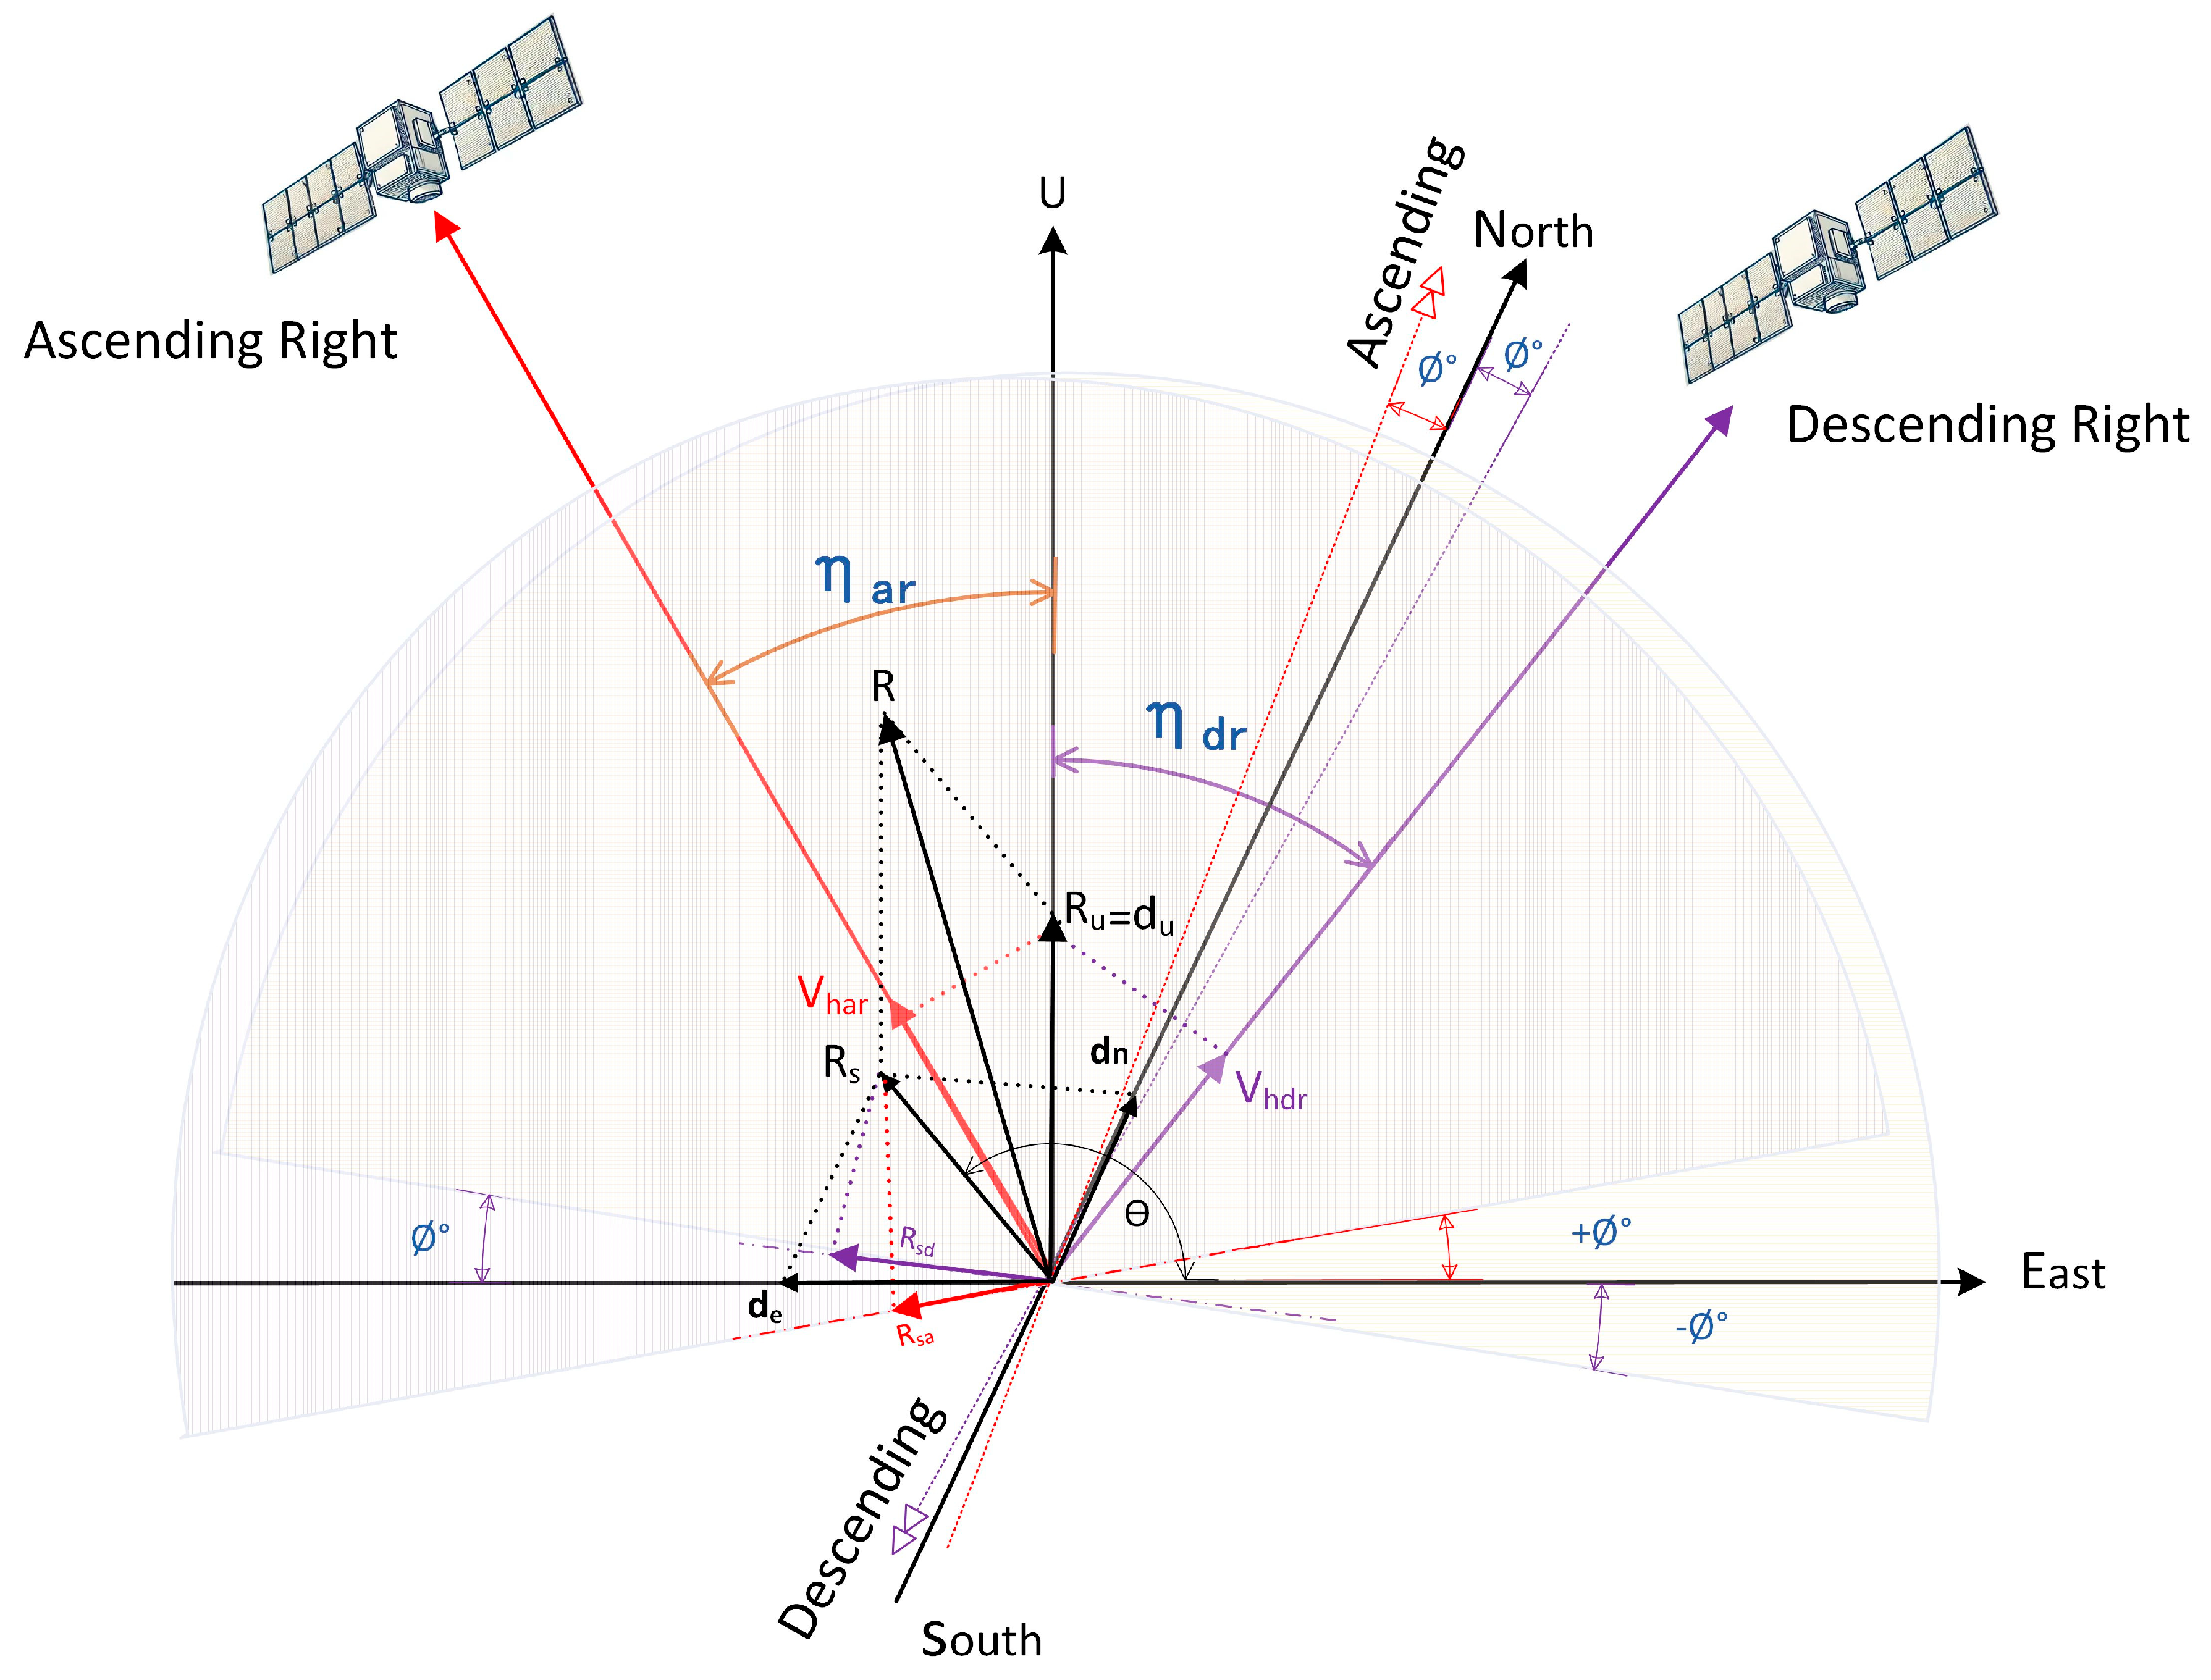
Figure 1. Schematic overview of geometric relationships for radar line-of-sight deformation projection in ascending and descending orbits according to right-looking SAR geometry.
Remotesensing 17 03000 g001
Figure 2. Schematic overview of geometric relationships for radar line-of-sight deformation projection in ascending orbit of left- and right-looking geometric directions in local orthogonal plane to the ZPD plane.
Remotesensing 17 03000 g002
Figure 3. (a) Photographs of the 8 stations with BDS/GNSS and dihedral corner reflectors. (b) Diagram of the star topology of 8 the stations in ENU coordinates.
Remotesensing 17 03000 g003
Figure 4. The geometric layout of stations with BDS/GNSS and dihedral CRs in averaged SAR image around the dam: (a) ascending orbit; (b) descending orbit.
Remotesensing 17 03000 g004
Figure 5. The RCS and SCR of symmetrical dihedral corner reflectors: Intensity of (a) ascending and (b) descending CRs. Statistics on CRs’ (c) averaged RCS and (d) averaged SCR.
Remotesensing 17 03000 g005
Figure 6. LOS deformation and the geographic geometry of the CR network. (a) Horizontal deformation towards LOS direction R s and (b) vertical deformation towards LOS direction R u . LOS deformation between the CRs and the network in (c) ascending geographic geometry and (d) descending geographic geometry.
Remotesensing 17 03000 g006
Figure 7. BDS/GNSS horizontal deformation time series projected into SAR LOS directions in both ascending and descending orbits ((ag): the 7 stations from HV07 to HV18).
Remotesensing 17 03000 g007
Figure 8. Man-made horizontal deformation and its LOS projection monitored using BDS/GNSS for (a) TN3N in the north west direction; (b) TN14 in the north west direction; (c), TN3N projected into SAR LOS directions under ascending/descending orbit; and (d) TN14 projected into SAR LOS directions under ascending/descending orbit.
Remotesensing 17 03000 g008
Figure 9. Man-made vertical deformation and its LOS projection monitored using BDS/GNSS for (a) HV07; (b), HV14; (c) HV07 projected into SAR LOS directions under ascending/descending orbit; and (d) HV14 projected into the SAR LOS directions under ascending/descending orbit.
Remotesensing 17 03000 g009
Figure 10. LOS deformation between ZC06 and VDR5 in both ascending and descending orbit from the TerraSAR-X interferogram.
Remotesensing 17 03000 g010
Figure 11. Man-made horizontal deformation of the TN3N and TN14 stations in both ascending and descending orbit monitored with dihedral CRs, with VDR5 as the reference. LOS deformation time series of (a) TN3N and (b) TN14 observed by dihedral CR.
Remotesensing 17 03000 g011
Figure 12. Man-made vertical deformation of the HV07 and HV14 stations in both ascending and descending orbit monitored with dihedral CRs, with VDR5 as the reference. LOS deformation time series for (a) HV07 and (b) HV14 observed by dihedral CR.
Remotesensing 17 03000 g012
Figure 13. BDS/GNSS and dihedral CRs monitoring results for the HV18 station, with VDR5 as the reference. (a) BDS/GNSS 3D deformation in ENU coordinates; (b) LOS horizontal deformation derived from BDS/GNSS monitoring in both ascending and descending orbit; (c) LOS deformation monitored by dihedral CRs; (d) LOS deformation monitored by dihedral CRs, corrected with the horizontal deformation measured by BDS/GNSS.
Remotesensing 17 03000 g013
Figure 14. LOS deformation monitored using symmetric dihedral CRs at ZC04, with VDR5 as the reference.
Remotesensing 17 03000 g014
Figure 15. Workflow of deformation monitoring using BDS/GNSS and symmetric dihedral CRs.
Remotesensing 17 03000 g015
Table 1. The main parameters of the TerraSAR-X satellite SAR in the experimental area.
OrbitAscending RightDescending Right
Band/WavelengthX/3.11 cm
Satellite Heading Angle−11.7°191.7°
Local Incidence Angle31.1°25.7°
Range Resolution1.4 m0.9 m
Azimuth Resolution1.6 m2.0 m
Data Acquisition TimeApril 2023–March 2024 (one image/month)
Simulated Test Time11 September 2023~12 September 2023
CR installation time May 2023~June 2023
Disclaimer/Publisher’s Note: The statements, opinions and data contained in all publications are solely those of the individual author(s) and contributor(s) and not of MDPI and/or the editor(s). MDPI and/or the editor(s) disclaim responsibility for any injury to people or property resulting from any ideas, methods, instructions or products referred to in the content.