Highlights
What are the main findings?
- Fields such as remote sensing, statistical methods, and deep learning rely on the availability of high-quality tree datasets for effective analysis.
- Publicly available high-resolution aerial tree datasets, highlighting their characteristics and alignment with FAIR principles.
What is the implication of the main findings?
- Identifying and evaluating these datasets can support future research in tree monitoring and management at scale.
- Both the availability of datasets and their alignment with FAIR principles are crucial for model development and the advancement of analytical methods in agroforestry.
Abstract
Trees are vital to both environmental health and human well-being. They purify the air we breathe, support biodiversity by providing habitats for wildlife, prevent soil erosion to maintain fertile land, and supply wood for construction, fuel, and a multitude of essential products such as fruits, to name a few. Therefore, it is important to monitor and preserve them to protect the natural environment for future generations and ensure the sustainability of our planet. Remote sensing is the rapidly advancing and powerful tool that enables us to monitor and manage trees and forests efficiently and at large scale. Statistical methods, machine learning, and more recently deep learning are essential for analyzing the vast amounts of data collected, making data the fundamental component of these methodologies. The advancement of these methods goes hand in hand with the availability of sample data; therefore, a review study on available high-resolution aerial datasets of trees can help pave the way for further development of analytical methods in this field. This study aims to shed light on publicly available datasets by conducting a systematic search and filter and an in-depth analysis of them, including their alignment with the FAIR—findable, accessible, interoperable, and reusable—principles and the latest trends concerning applications for such datasets.
1. Introduction
Trees are fundamental components of our terrestrial ecosystems, providing a multitude of ecological, economic, and social values. Ecologically, they function as significant carbon sinks, absorbing atmospheric carbon dioxide and thereby mitigating climate change impacts [1]. Trees also have a role in maintaining biodiversity, offering habitats for a vast array of plants and animals, and sustaining complex ecological interactions [2]. From an economic perspective, trees supply renewable resources, including timber, non-timber forest products, fruits, and medicinal compounds, which are used in various industries and local economies [3]. Socially, forests contribute to human well-being by providing recreational spaces and cultural significance [4]. Given these multitude of values, the conservation and management of trees and forest ecosystems and protecting them against natural or human-induced disasters such as wildfires are imperative for maintaining ecological balance and supporting human livelihoods.
Remote sensing has played an important role in forestry applications for several decades, starting from the early aerial photos for forest inventory assessment in the 1950s and 1960s [5] to the multimodal data collected by modern remote sensing platforms [6]. Furthermore, aerial remote sensing has transformed the way we monitor and manage our forests. It offers a bird’s-eye view of vast expanses of woodland that would be impractical to survey on foot. These data, captured from drones, piloted aircraft, or satellites, provide valuable insights into the health, composition, and dynamics of forests; the importance of aerial remote sensing data of trees [7] cannot be overstated. From identifying invasive species and monitoring tree growth to assessing the impact of natural disasters and climate change, aerial data equip forest managers and conservationists with the tools needed to make informed decisions. Moreover, with the integration of statistical methods and machine learning algorithms, these data can be analyzed at scale, automating the detection of forest disturbances, estimating tree biomass, and predicting future forest conditions. As we continue to face challenges such as deforestation and biodiversity loss, the role of data, particularly aerial data, becomes a crucial asset in our efforts to manage and protect our trees for generations to come. Data are also the foundational resource for developing new analytical methods and tools, making the availability of benchmark datasets vital for their continued advancement. Numerous studies have examined various aspects of forestry using remote sensing data such as forest diseases [8], tree species identification [9], and biomass estimation [10], to mention a few. There have also been studies that focus on reviewing available datasets in other scientific fields, such as agriculture [11], medicine [12], and cybersecurity [13]. However, to the best of our knowledge, there has been no comprehensive review study focusing on aerial data used in forestry and agroforestry with an emphasis on individual trees as the objects of interest. Agroforestry, which combines trees into agricultural landscapes to achieve environmental, economic, and social benefits, represents a critical application area where remote sensing data are particularly valuable [14]. While most datasets discussed in this paper are related to trees in general, some specifically focus on fruit trees, which are key components of agroforestry systems.
With the growing importance of data in forestry, and the significance of aerial remote sensing in forest management and conservation of trees, it becomes evident that a review article on tree-related datasets and repositories is not just necessary but essential. Such a review may serve as a resource for researchers and practitioners, offering a compilation of the most relevant and up-to-date sources of aerial data. This paper, with an emphasis on high-resolution data that allow the identification of individual trees, aims to provide insights into the diversity of available data, their alignment with the FAIR—findable, accessible, interoperable, and reusable—principles, and their potential applications, facilitating more efficient and informed decision-making in agroforestry-related works. Furthermore, by highlighting the strengths and limitations of existing repositories and datasets, this paper can help guide future data collection efforts and foster collaborations among the scientific community.
While many other important forestry resources exist, such as long-term ecological inventory networks (e.g., ForestGEO, CTFS, and forestplots.net) and dynamic vegetation models, these fall outside the scope of this review. Our emphasis is strictly on high-resolution aerial visual datasets (RGB, multispectral, hyperspectral, LiDAR, and thermal) that directly support individual-tree analysis and machine learning workflows. These complementary resources are highly important for ecological and carbon stock estimation research, but they were not included in our systematic search for the mentioned reasons.
2. Methodology
In the context of initiating a review study on data, the first critical step involves defining the eligibility criteria. In this section, we will present our rationale for this matter.
As mentioned before, to the best of our knowledge, there has not been a review study on aerial data with individual trees being visible. Therefore, resolution becomes a crucial factor. While resolution may not directly impact the used methodologies in data analysis, it dictates the level of detail achievable in the analysis. In our study, we establish a criterion based on the visibility of individual trees in the data, resulting in high- and ultra-high resolution (UHR) data [15]:
- Ultra-High Resolution (UHR): 1 cm to 5 cm ground sampling distance (GSD).This level of detail allows individual leaves, small branches, and tree crowns to be visible, which is useful for forest monitoring tasks like precise species identification, disease detection, and structural analysis. Drones are typically capable of achieving this GSD due to their ability to fly at low altitudes with high-quality sensors.
- High Resolution: 5 cm to 30 cm GSD.This range is common for manned aircraft and some higher-altitude drone operations. Individual tree crowns are distinguishable, but smaller details within the canopy are often less clear.
It is important to note that these classifications are not universally standardized.
Data used in machine learning and deep learning approaches are typically pre-processed, labeled, and organized into a structured format compatible with the specific framework used. With the growing prominence of machine learning, especially deep learning methods in recent years, one might consider including only these labeled datasets. However, it is important to note that unannotated data are still frequently used in forestry applications, depending on the specific task at hand. Therefore, our study considers both annotated and not annotated data sources that we have identified.
We chose the Google Dataset Search engine as our primary data searching tool. However, using this engine for a direct data search is not the only way to find data; peer-reviewed scientific papers that acquired remote sensing data in their study can also be a source of data. We can categorize these papers into two groups. First are the ones that have acquired data and published it or have used already published data. We combine this group with the result of the direct data search from the Google Dataset Search and categorize them as published data. The second category is the papers that have acquired data through the course of their study but have not published them. Consequently, our search procedure contains two separate search queries that merge: one direct data search with the Google Dataset Search engine and the other with the Google Scholar engine for scientific articles. Figure 1 illustrates our search and filtering procedure, explained in the following.
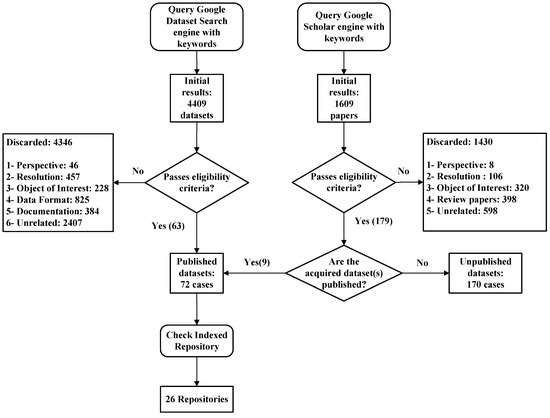
Figure 1.
Search and filter procedure.
To perform the search, a set of keywords was selected based on four aspects of the subject, namely, Context, Source, Sensor, and Purpose, resulting in the following search query: “(Tree OR Forest OR Forestry) AND (UAV OR “Unmanned Aerial Vehicle” OR UAS OR “Unmanned Aerial System” OR Aerial) AND (RGB OR Multispectral OR Hyperspectral OR LiDAR) AND (“Artificial Intelligence” OR “Machine Learning” OR “Deep Learning” OR Segmentation OR Classification)”. Table 1 relates the selected keywords with the respective aspect.

Table 1.
Keywords selection based on different aspects.
The time period of the search was set to 2013 to 2025, and the search was closed on July 2025.
After acquiring the initial result on both search pipelines, we screened the outcome through a manual process by excluding low-resolution datasets, non-tree objects of interest, and resources outside the scope of aerial visual data (such as plot-based forest inventories, e.g., forestplots.net, ForestGEO, and dynamic vegetation simulation models). While these are highly valuable for ecological and carbon stock research, they do not provide the type of high-resolution visual data at the individual-tree level that we focus on in this review. After this exclusion, we further filtered for eligibility based on context derived from title, keywords, abstract, and used methodology. In the case of the published data, these sets are published in online database repositories (DBRs), which were identified and recorded. The 26 identified DBRs are presented in Section 3.3. The final number of total sources found is 4409 entries from the dataset search and 1609 entries from the paper search. The final number of identified eligible sources is 242, including 72 cases for published data and 170 cases for unpublished data. These numbers provide an overview of the identified eligible entities, showcasing the distribution across published data, unpublished data, and data repositories. For a visual representation, refer to Figure 2.
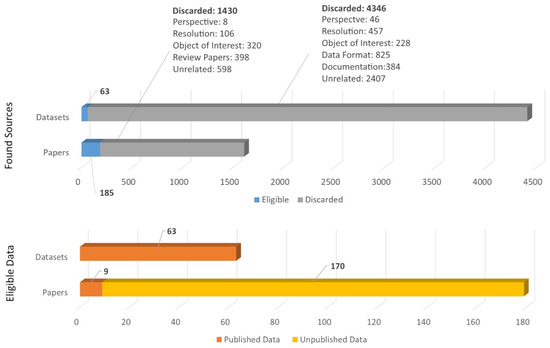
Figure 2.
Distribution of identified sources, highlighting the screening result.
FAIRness Analysis
Furthermore, we adopted a scoring scheme based on the FAIR data principles [16] to evaluate the alignment of the found datasets with them.
The FAIR principles (findable, accessible, interoperable, and reusable) are guidelines for promoting the usability of datasets across diverse domains. They offer a robust framework that promotes enhanced data sharing, comprehension, and utilization. However, amidst the exponential growth in data production, a fundamental challenge persists: the lack of a universal scoring system for quantifying the FAIRness of datasets. This absence of a standardized metric poses a significant hurdle in the assessment and comparison of datasets. Currently, the evaluation of a dataset’s adherence to FAIR principles remains largely subjective, relegated to abstract qualitative judgments. Without a tangible scoring system, researchers, institutions, and industries face a daunting task: the inability to objectively measure, compare, or improve the FAIRness of their datasets. This critical gap in quantifying FAIRness not only obstructs efforts toward efficient data sharing and collaboration but also hinders the establishment of best practices for dataset management and utilization.
While acknowledging the absence of a widely accepted scoring system, this paper does not claim to introduce a universal solution. Rather, it proposes a scoring methodology as a step towards addressing this issue. It does not claim to provide a conclusive solution but an attempt to stimulate dialogue and collaborative efforts towards comprehensive and universally applicable quantification of FAIRness in data.
Definitions for the FAIR principles in this study were sourced from the foundational principles outlined by the Global Open Science and FAIR community, as articulated on the official website [17]. Our interpretation of these definitions and the logic of scoring the datasets are presented in Table 2.
Table 2.
Assessment of FAIR data principles: definitions [17] and interpretations.
We aggregated the assigned scores using the FAIR score proposed Formula (1), averaging them and rounding the numbers to two decimal points, resulting in values ranging from 0 to 4. The compiled results are presented in Table 3.
Table 3.
Aggregate FAIR assessment scores for datasets: general evaluation of data findability, accessibility, interoperability, and reusability.
3. Datasets
Among the two categories mentioned, published and unpublished data, the first one stands as the foremost and pivotal source. Unpublished data, though potentially valuable and accessible, remain more prospective than realized in their impact. We start by reviewing the published datasets found.
3.1. Published Datasets
Table 4 lists the published datasets, characterized by applications (possible examples), data source type, platform used in data acquisition, size of the dataset, data annotation availability, if dataset is open access, corresponding author country of origin, and country of geographical extent. The datasets are sorted from most to least frequent application (detailed in the following).
Table 4.
Published datasets. (*) CA, GE, N/A, and PA, respectively, stand for Corresponding Author, Geographical Extent, Not Available, and Piloted Aircraft.
To begin, a set of parameters was extracted from the sources, namely, the following:
- Application: This parameter refers to the specific use or purpose of a dataset according to the dataset author, offering insights for individuals seeking tailored or annotated data suited for particular applications. Notably, this criterion operates as the subsequent categorization factor following the distinction between published and unpublished datasets. Table 5 shows the applications of the identified datasets, described ahead in this section.
Table 5. Overview of applications.Figure 3 shows the distribution of use case applications in the identified datasets. Apart from miscellaneous, the most frequent applications include ITCD, SI, and SS.
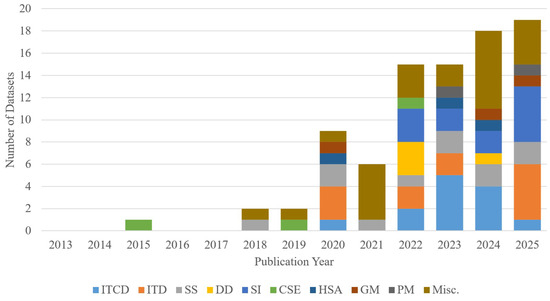 Figure 3. Distribution of use case applications across dataset instances and publication year.
 - Source: Describing the data’s structure and format. The term “sensor” is intentionally omitted in this context to encompass various data acquisition methods; for instance, point cloud data can be obtained through laser scanning or generated via structure from motion, namely, the photogrammetric point clouds (PPCs). Figure 4 demonstrates the distribution of data source of the identified datasets. The most-used source is the RGB camera, followed by the multispectral camera and LiDAR (Light Detection and Ranging). It must be mentioned that thermal cameras are regularly used in forestry-related studies [7]; however, none of the datasets we found present purely thermal-spectrum data, and any dataset with thermal band modality is included in the multispectral category.
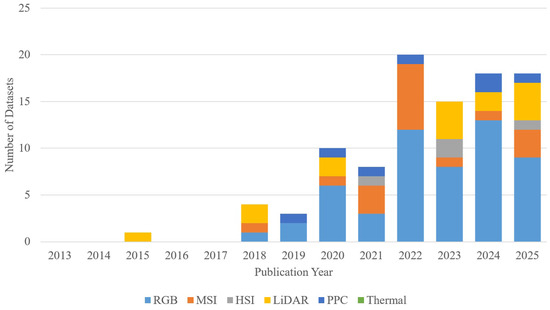 Figure 4. Distribution of data source across dataset instances per publication year. Category S-RGB stands for Synthetic-RGB.
 - Platform: Refers to the remote sensing platform that carries the sensor payload. Understanding the platform is crucial as it determines the data perspective, resolution (not definitive), and the feasibility of data collection in diverse environmental conditions. It significantly influences the quality and scope of the acquired data, impacting subsequent analysis and applications. Figure 5 shows distribution of platforms carrying the sensors in selected datasets. The graph highlights the predominant platforms utilized for sensor deployment, with UAVs being the most extensively employed, followed by piloted aircraft and satellites. While our filtering criteria prioritize aerial perspective datasets, the graph also encompasses terrestrial point-of-view (POV) data. This inclusion is prompted by instances where datasets offer both aerial and terrestrial data as complementary sources, thus meeting the eligibility criteria. Moreover, the presence of three instances of synthetic data is worthy of note. Two of these particular datasets offer synthesized data from a UAV’s POV, and the third offers 3D models of trees, which can be used from any POV; therefore, they are presented under the UAV category. Further insights into synthetic datasets are explored in more detail in Section 3.1.11.
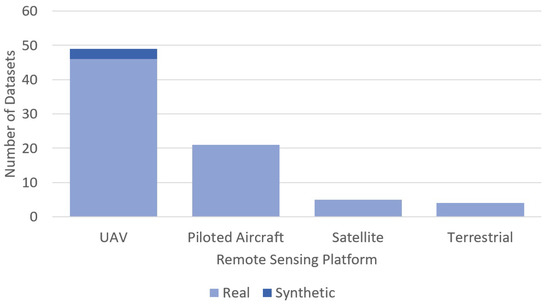 Figure 5. Distribution of remote sensing platforms across dataset instances.
 - Dataset Size: Indicates the volume or scale of the dataset, which plays a pivotal role in various aspects of analysis and application. Understanding the dataset size is fundamental as it influences computational requirements, model training, and the feasibility of certain analytical approaches.As an example, larger datasets may demand advanced computational resources, while smaller ones might be more manageable for specific analyses or applications. Assessing dataset size aids in determining the data’s comprehensiveness and potential limitations, guiding researchers in selecting appropriate methodologies and tools for analysis.
- Annotation: Represents the level of labeling, tagging, or additional information embedded within the dataset. Annotation serves as a crucial aspect, especially in supervised learning or applications requiring labeled data, or even just to assess the developed algorithm performance. Understanding the annotation level informs researchers about the data’s usability for specific tasks such as object detection, classification, or segmentation. Higher levels of annotation often indicate enhanced data richness but may also involve increased resource investment. Assessing annotation levels guides the selection of datasets aligned with the required granularity for precise analysis or model training. Figure 6 shows distribution of different annotation types in the selected datasets across the years they were published. Among the identified datasets, a predominant observation is the prevalence of unannotated data. When annotations are present, semantic-level annotations are the most frequently encountered type, followed by polygons and bounding box annotation. The distinction between polygon and semantic-level annotation arises from the nuanced application of polygons in certain cases, where they are utilized to achieve a higher degree of precision in object detection techniques compared to the more common use of bounding boxes.
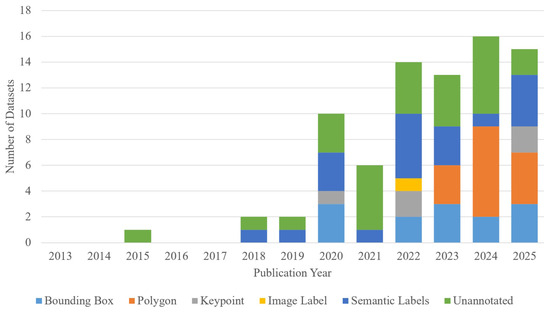 Figure 6. Distribution of data annotations across publication year of selected datasets.
 - Open Access Status: Indicates whether the dataset is publicly available or restricted in its accessibility. This parameter holds immense significance in fostering collaboration, reproducibility, and the advancement of research. Open access datasets promote transparency and facilitate broader utilization by the scientific community, accelerating innovation and knowledge dissemination. Understanding the open access status aids researchers in identifying available resources for validation, comparison, or extension of existing studies. Moreover, it influences the reproducibility and credibility of research findings, emphasizing the importance of accessible data in driving scientific progress.
- Country: Denotes two key parameters, which are the country of corresponding author’s affiliated institution and the country associated with the dataset’s geographical extent. Understanding the author’s country provides insights into regional focuses, environmental contexts, or unique challenges that might impact the study’s scope or applicability. Simultaneously, recognizing the country representing the geographical extent of the dataset contributes to the broader understanding of global perspectives and diverse approaches within the field, highlighting regional contributions and fostering collaborative opportunities across different geographical areas. Figure 7 depicts the distribution of published datasets by the author’s country, showcasing the prevalence of dataset contributions. Germany leads with 10 published datasets, followed by the United States and China with 9 and 7, respectively. Figure 8 shows the distribution of published datasets by the geographical extent of the dataset. The most frequent countries are the United States with 9, Germany with 8, followed by China and New Zealand each with 5.
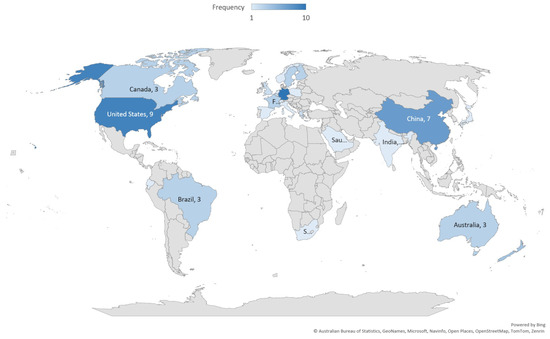 Figure 7. Distribution of publishing countries based on corresponding author’s affiliation.
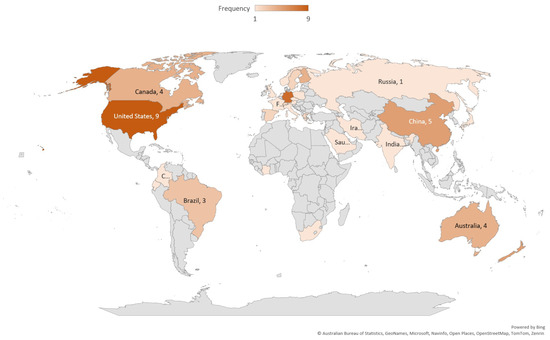 Figure 8. Distribution of countries from which the datasets were acquired.Examining the parameters “Corresponding Author’s Country” (CA) and “Geographical Extent Country” (GE), it is evident that they exhibit congruent coverage, indicating a substantial overlap in the regions they represent.
The following sections describe the different applications considered in Table 4.
3.1.1. Individual Tree Crown Delineation
Individual tree crown delineation (ITCD) is the process of outlining the perimeters of trees within remote sensing imagery or point cloud data, including both two-dimensional (2D) and three-dimensional (3D) spatial representations. This method is widely used in several domains, notably in forest inventory, ecological studies, and advanced land management practices. ITCD helps with the identification and mapping of individual tree crowns within forested areas, facilitating not just accurate quantification, but the holistic characterization of various tree attributes such as crown size, canopy cover, species distribution, and tree health. It allows for the systematic and rapid processing of extensive data, a critical requirement in today’s vast and data-rich domains.
This technique is typically applied to 2D data, but with the advancement in computational capacity and the emergence of sophisticated methods such as CNNs, 3D data are being explored for ITCD. While CNNs have been highly effective in 2D imagery, their extension to 3D point cloud data is less direct. Architectures such as PointNet++ can segment 3D point sets, but they require fixed-size subsampling (e.g., 1024–2048 points) and often depend on a preprocessing step such as clustering or crown isolation to make per-tree delineation feasible. These constraints highlight why 3D ITCD methods remain less mature than 2D approaches. Refs. [24,37,41,44,45,46,82,83,88] are labeled RGB dataset examples, Ref. [31] presents labeled LiDAR-based tree point clouds with detailed annotation, and Ref. [85] offers annotated Multispectral data. Here, ITCD refers to a forestry-specific application that uses data processing techniques such as semantic or instance segmentation. However, these labeled datasets extend beyond this application, serving as valuable resources for AI and image processing development. Further details on semantic segmentation can be found in Section 3.1.3.
Figure 9 illustrates an example of ITCD application with visualized annotation.
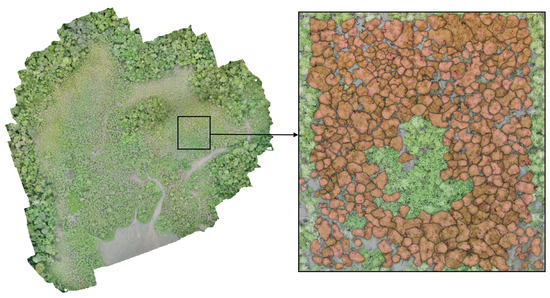
Figure 9.
An example of annotated RGB data for ITCD application from the dataset by [37]. Polygons with red shades on the right are annotation polygons outlining the canopy of individual trees.
3.1.2. Individual Tree Detection
Individual tree detection (ITD) is the identification and localization of individual trees within remote sensing data, utilizing both 2D and 3D spatial representations. Unlike ITCD, which intricately outlines tree crowns, ITD primarily focuses on pinpointing tree positions within a designated area.
This technique is fundamental in forest inventory, ecological monitoring, and land management practices, providing critical insights into tree distribution, density, and spatial arrangement. In 2D applications, such as satellite imagery or aerial photographs, tree detection involves locating tree positions based on spectral signatures and spatial patterns. This aids in broader-scale assessments of forest cover, landscape dynamics, and large-scale forest management. In contrast, 3D data, often derived from technologies like LiDAR, enhance tree detection by providing detailed three-dimensional information. Three-dimensional data facilitate the accurate localization of individual trees within the vertical canopy profile, allowing for precise measurements of tree height, canopy structure, and spatial arrangement in the vertical dimension. In practical applications, individual tree detection from 3D point clouds typically relies on analytical approaches such as local maxima filtering, watershed segmentation, or clustering around canopy apex points. Direct application of deep learning models to large-scale 3D forest scenes remains challenging due to the need for subsampling and preprocessing to isolate individual crowns. As a result, 3D ITD methods are still less mature and less widely adopted than 2D image-based approaches.
Refs. [40,47,48,49,64,68,71,72,80] present RGB data, acquired for ITD application, while [78], in addition to RGB data, also offers a photogrammetric point cloud of the scenery. This point cloud can be utilized in methods such as local maxima filter to identify the tree tops in 3D space. An example of ITD is visualized in Figure 10.
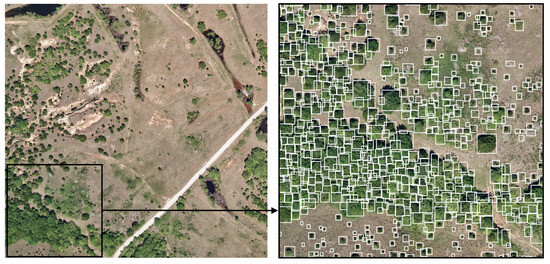
Figure 10.
An example of ITD in RGB data with bounding box annotation, visualized from the NEON tree crown dataset by [64].
3.1.3. Semantic Segmentation
Semantic segmentation (SS) is a technique in which every pixel in 2D data or point/voxel in 3D space is assigned a label. While ITCD outlines every tree crown within an image and in point cloud data, SS covers broader classifications, e.g., various tree parts including canopy, understory branches, trunk, and other fine details (see Figure 11). This, method prioritizes the precise classification of these specific components present in the scene, leveraging advanced neural network architectures. The advancements in state-of-the-art neural networks, exemplified by architectures like U-Net, have significantly contributed to the refinement and precision of semantic segmentation methodologies. While these advances have strongly benefited 2D imagery, extending semantic segmentation to 3D point clouds remains more challenging. Models such as PointNet++ or KPConv can process 3D data, but they typically rely on fixed-size subsampling of points, which reduces resolution and limits per-class detail when multiple classes are present. As a result, 2D semantic segmentation with CNNs is highly established, whereas 3D methods remain less mature and continue to face scalability and accuracy constraints in complex forest scenes. This focused approach in semantic segmentation complements ITCD by enabling a more versatile analysis across varied data formats and object types within forested landscapes. Moreover, its widespread use in multiple disciplines underscores its adaptability and significance in delineating and understanding specific objects within complex visual scenes.
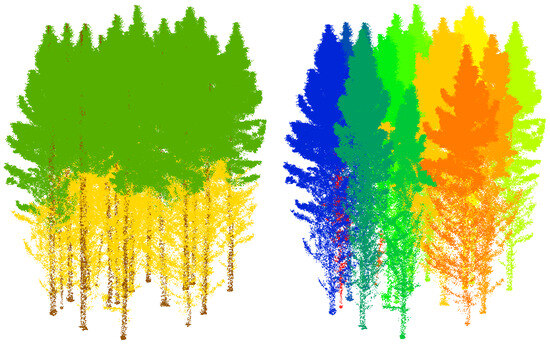
Figure 11.
Semantic (left) vs. instance (right) segmentation annotation of the point cloud dataset by [31].
The datasets by [26,39,52,65,69,87] encompass high-resolution aerial data depicting various landscapes containing objects beyond trees. These datasets are accompanied by corresponding masks, specifically tailored for semantic segmentation purposes. The FOR dataset by [31] offers fine detailed annotation for instance and semantic segmentation of different tree types. Ref. [38] provides a synthetic Siberian Larch tree crown dataset, constructed from drone imagery.
3.1.4. Disease Detection
Disease detection (DD) in trees involves the identification and continual monitoring of various diseases and pathogens that pose threats to them, using remote sensing technologies. This process is instrumental in the early detection, assessment, and effective management of diseases that hold the potential to substantially impair forest health and productivity.
Using 2D data, such as hyperspectral imagery, enables the identification of spectral anomalies and subtle changes in vegetation health, aiding in pinpointing disease hotspots and affected areas across wide forested landscapes. Meanwhile, leveraging 3D data, particularly from LiDAR scans, offers insights into the vertical structure of forests, facilitating the detection of structural changes or deformities within tree canopies caused by diseases or stress factors.
It is important to note, however, that disease detection in 3D data is generally constrained to tree- or scene-level classification. Current point-cloud deep learning methods are not yet capable of robustly segmenting partial diseased structures (e.g., specific branches or sub-crown regions) within complex forest scenes. As a result, while 2D spectral approaches remain the dominant and most effective method for identifying subtle disease symptoms, 3D analyses are typically limited to detecting broader structural changes or canopy-level impacts.
Nevertheless, by combining the strengths of 2D and 3D data, disease detection methodologies enable comprehensive analyses of disease distribution patterns, supporting proactive intervention strategies and informed decision-making in trees’ health management. Ref. [42] (Banana Fusarium wilt), [22] (Cherry Armillaria root rot), [23] (Anarsia lineatella and Grapholita molesta), and [54] (Bark Beetle) are datasets for disease detection, harnessing the significance of multispectral data, which offers an expanded range of spectral bands beyond RGB, thereby enhancing the precision and efficacy of spectral analysis in identifying tree diseases.
3.1.5. Species Identification
Species identification (SI) is defined as discerning and categorizing tree species within forested regions based on the remote sensing data. This process utilizes an array of spectral, textural, and structural information garnered by diverse sensors employed in this field. By analyzing the unique spectral signatures and structural attributes of tree canopies, this method aims to classify the tree species coexisting within a landscape.
Machine learning algorithms facilitate the differentiation of tree species based on their distinct spectral responses and structural attributes captured by the remote sensing data. This automation allows for the precise delineation and classification of diverse tree species across vast forested regions, fostering a detailed understanding of biodiversity, species distribution patterns, and intricate ecosystem dynamics.
See Figure 12 for an example visualization of SI application.
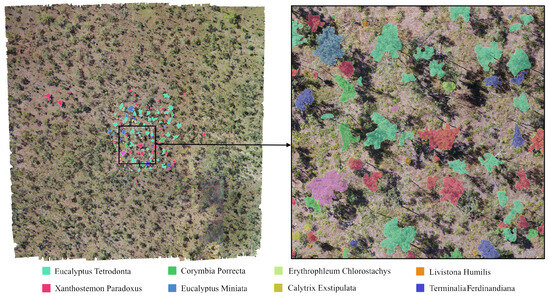
Figure 12.
Visualization of an RGB dataset labeled for SI application, derived from the dataset by [25]. Different colors indicate different tree species, annotated in the study site.
As examples, datasets by [25,45,86] offer labeled RGB and multispectral data for tree SI.
3.1.6. Geometrical Measurement
Geometrical measurement (GM), as the name suggests, is the quantification of diverse spatial and structural attributes defining forest and tree elements, extracted from the remote sensing data. These measurements include parameters like tree height, crown diameter, canopy cover, and tree spacing, among others.
The significance of these measurements extends across various domains including forest inventory, accurate biomass estimation, and continual monitoring of shifts in forest structure over time, ultimately aiding in the formulation of adaptive and sustainable forest management practices. Ref. [36] offers terrestrial LiDAR data along with UAV-born photogrammetric point cloud of Scots pine trees, which they used to measure the geometrical attributes of trees in their study.
3.1.7. Carbon Stock Estimation
Carbon stock estimation (CSE) is the quantification of carbon accumulated within forests, including both the above-ground and below-ground biomass. This process relies on remote sensing data to estimate the volume of carbon stored by trees and vegetation. By analyzing forest parameters such as tree height, canopy structure, and biomass density, this estimation offers valuable insights into the total carbon content stored within forested regions or tree plantations.
This evaluation of carbon stocks is crucial in comprehending the role forests and in general trees play in mitigating climate change and aiding carbon offset initiatives. See Figure 13 for a visualization of the dataset by [33] in which bounding box annotation fused with ground truth data (geometrical measurements along with allometric calculations) is used to pinpoint tree locations with their corresponding carbon stock.
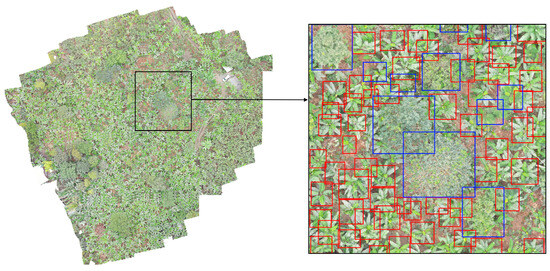
Figure 13.
Visualization of the RGB dataset by [33], labeled for CSE application. CSE is calculated through ground measurements and allometric equations, and the result is fused into annotation of data for training of ML algorithms.
The dataset by [84] offers a relatively small LiDAR-based point cloud dataset for CSE, and [33] presents an RGB dataset for this application. The dataset by [73] offers RGB orthomosaic and photogrammetric point cloud for Mangrove tree biomass estimation (while biomass and carbon stock estimation are distinct yet related concepts in forestry and ecological studies, for this study, we have consolidated them into a single category).
3.1.8. Health Status Analysis
Health status analysis (HSA) goes beyond the singular focus of disease detection. It includes a broader evaluation of the overall condition and vigor of trees. This process aims to identify and assess a spectrum of indicators including factors such as stress, disturbances, and general tree health. Various sensors, capable of detecting anomalies in vegetation health, canopy structure, or even subtle phenological changes, contribute to this analysis. By facilitating the timely implementation of mitigation measures, this assessment contributes significantly to maintaining or restoring trees’ health. The datasets provided by [28,29] collectively comprise RGB, hyperspectral, and LiDAR data obtained from a drought-stressed European beech forest reserve in Germany.
3.1.9. Phenology Monitoring
Phenology monitoring (PM) is tracking and analyzing seasonal changes and patterns in vegetation and forest ecosystems. It utilizes temporal remote sensing data to observe the timing of recurring biological events like leaf emergence, flowering, or leaf senescence within forests. By capturing these temporal dynamics, phenology monitoring provides insights into ecosystem responses to environmental factors, climate variations, and disturbances. It helps us understand the relationships between vegetation phenology and environmental changes, contributing to assessments of ecosystem health, productivity, and biodiversity.
The dataset by [27] offers multispectral data for monitoring individual tree phenology in a multi-species forest. See Figure 14 for a visualization of this dataset.
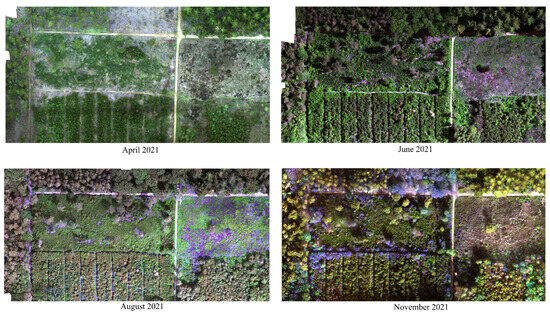
Figure 14.
Multispectral imagery taken from the study site through different times in a year to study phenological changes of individual trees. Visualized from the dataset by [27].
3.1.10. Miscellaneous
Any entry that did not align with the mentioned applications or did not provide a clear reason for creating the dataset is categorized under miscellaneous.
The work by [79] offers UAV-born LiDAR data of a forest park in China. Datasets by [20,21] offer RGB and multispectral data captured by UAV over a subtropical forest area in Brazil. Datasets by [18,19] provide multispectral point cloud and orthomosiac of Nybygget in Swewden.
The dataset provided by [66] comprises high-resolution georeferenced UAV images featuring trees. While the dataset’s primary objective focuses on localization through image processing, these images also hold potential for various other tasks and applications.
Datasets by [34,35] offer multispectral datasets for mapping of vegetation and hydromorphology along Federal waterways in Germany. Datasets by [30,32] offer high-resolution UAV-born hyperspectral data and the ground truth from tropical forest ecosystems. The dataset by [70] offers an airborn LiDAR dataset for forest research. Lastly, the synthetic dataset by [67] offers several data modalities from the point of view of a low-altitude-flying UAV. More on this dataset and synthetic datasets is presented in the next section.
3.1.11. Synthetic Data
Synthetic data’s emergent trend lies predominantly within academic research rather than in published datasets at this stage. This type of data, while less observable in this dataset compilation, holds significant promise due to the capabilities it offers, such as controlled variability and simulation advantages for testing scenarios and expanding analytical capabilities.
Aside from its influence on model training, one of synthetic data’s most significant advantages is the fact that data labeling is much less labor intensive compared to manual data annotation.
Within the identified datasets, three of them stand out particularly due to their synthetic nature, deviating from the predominant composition of real-world datasets.
First, the MidAir synthetic dataset by [67], which is categorized as miscellaneous. This dataset serves multiple purposes, tailored for low-altitude drone operations. It offers a substantial volume of synchronized data aligned with flight records. This inclusive dataset encompasses information from various vision and navigation sensors installed on a quadcopter in flight. The vision sensors capture a diverse array of data, including RGB images, surface orientation details, depth perception, SS masks, object characteristics, and stereo disparity (Figure 15). Although the dataset’s point of view does not precisely meet our filtering conditions, we have included it in this paper for two main reasons: Firstly, it offers high-resolution data of individual trees; therefore, it is not totally unrelated to the subject. Secondly, it showcases the potential of synthetic data generation.
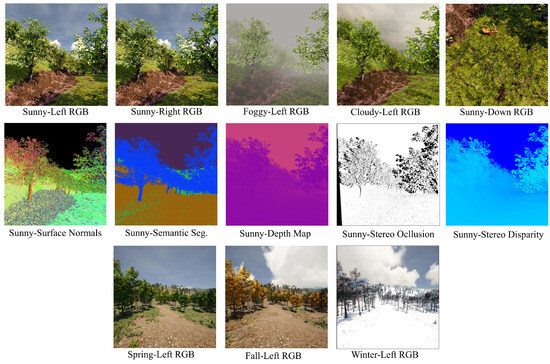
Figure 15.
Sample frames from the MidAir synthetic dataset by [67].
The second synthetic dataset, by [38], was introduced in Section 3.1.3, being a dataset for SS application. The authors utilized RGB imagery from a UAV platform to create a training set by placing cropped-out Larch trees onto various backgrounds. This set is designed for training models to identify Larch trees in aerial imagery with forest backgrounds. Starting with 117 cropped-out Larch trees as foregrounds and three sets of 35 of backgrounds, by shuffling these foregrounds and backgrounds, this dataset offers 10.000 images for training purposes and 2000 images for validation purposes. See Figure 16 for a visualization of this dataset.
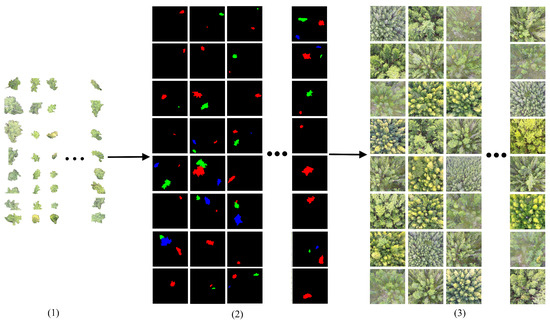
Figure 16.
Visualization of dataset by [38]: training examples (3) are synthesized by assembling segmented Larch trees (1) onto preexisting backgrounds, according to specific masks (2).
The third work [58] introduces the first large-scale dataset of simulation-ready 3D tree models, featuring 600,000 models reconstructed from single RGB images using diffusion-based priors. The authors propose a novel pipeline that leverages text-prompted, tree-genus-conditioned diffusion models to reconstruct 3D envelopes of trees from single images and then uses a space colonization algorithm to estimate detailed branching structures. The resulting dataset provides richly detailed, environmentally aware 3D tree models suitable for simulations and ecological studies, standardizing benchmarking for forestry applications and enabling tasks such as phenotyping, biomass estimation, species identification, and more. Figure 17 visualizes examples of this dataset.
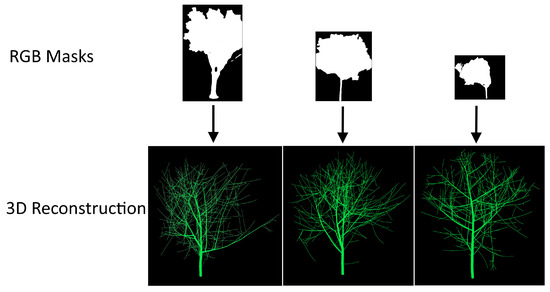
Figure 17.
Visualization of dataset by [58]: RGB masks used to reconstruct the 3D models of trees.
3.2. Unpublished Data
In academic research, a specific subset of published papers contains valuable yet undisclosed data. These papers, while publicly accessible, withhold the detailed datasets acquired during the course of their investigations. Often authors (for one reason or another) decide to keep the data associated to their published papers undisclosed, impairing further critical discussion on their methods and findings. However, their significance cannot be understated. These datasets, despite being in an inactive state, constitute unexplored potential, presenting opportunities for critical insights and unexplored possibilities in research. Contacting the authors of such papers and asking for their data provides the opportunity to enhance current research paradigms and potentially help with the developments within the academic landscape.
The structure of this section is the same as the previous one, and the same set of parameters were extracted from the entries and analyzed. Since here the data are not published and rather used and explained, the information is extracted from the papers rather than the datasets themselves. Therefore, two parameters, namely, the “Dataset size” and “Open access” statuses were excluded. Table 6 displays the selected papers that have acquired data but have not published them. The entries are organized based on the frequency of application and then arranged alphabetically.
Table 6.
Unpublished data. (*) CA, GE, N/A, and PA, respectively, stand for Corresponding Author, Geographical Extent, Not Available, and Piloted Aircraft.
Figure 18 demonstrates distribution of application of acquired data in the selected papers. The most frequently observed applications are ITCD, followed by ITD, DD, SI, HSA, Misc., GM, CSE, SS, and PM. This prevalence underscores the significance of ITCD and its versatile applications within forestry, highlighting its prominence in the field.
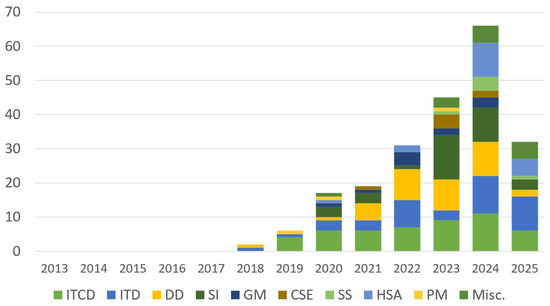
Figure 18.
Distribution of applications across publication year of selected papers.
Figure 19 shows the distribution of data sources across the publication year of selected papers. The prevalence of the RGB sensor use case is clearly visible. The next most used sensors are MSI, LiDAR, HSI, PPC, and Thermal.
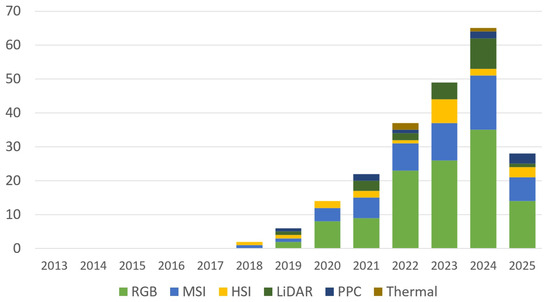
Figure 19.
Number of data sources across publication year of selected papers.
Figure 20 shows the distribution of platforms carrying the sensors across the number of publications of selected papers. The substantial prevalence of UAVs compared to piloted aircraft and satellites is clearly evident in the data. This dominance signifies a notable shift in sensor deployment methods, showcasing UAVs as the primary choice for data acquisition. Factors such as cost-effectiveness, accessibility, and maneuverability contribute to this marked preference, highlighting the evolving landscape of aerial data collection in forestry-related applications.
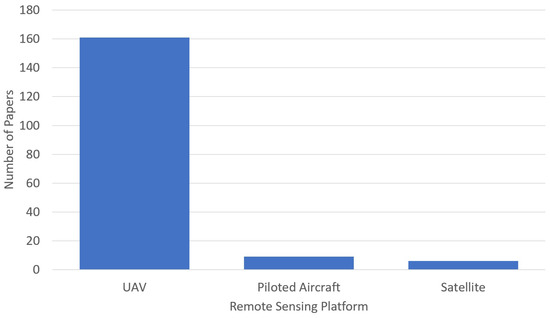
Figure 20.
Distribution of remote sensing platforms across number of publications of selected papers.
Figure 21 presents the distribution of annotation levels across the publication years of selected papers. Notably, the most prevalent annotation type observed is polygons, followed by semantic labels, bounding box, image level, and keypoint annotation. Semantic labels extend beyond the traditional 2D pixel-level annotations, often relating to semantic segmentation tasks that encapsulate not only 2D visual data but also pertain to semantic understanding within 3D data. This emphasizes the multifaceted nature of semantic labeling, addressing both 2D and 3D semantic contexts within the annotation spectrum.
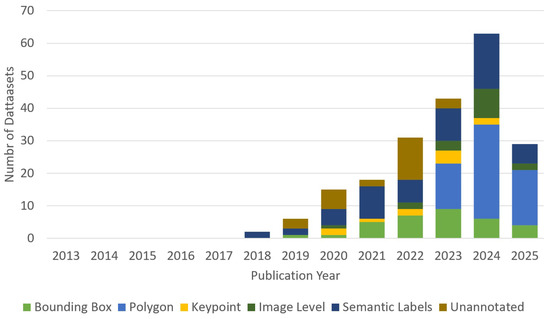
Figure 21.
Distribution of data annotations across publication year of selected papers.
Figure 22 illustrates the frequency of publications by the corresponding author’s affiliated institution country, indicating potential data sources for undisclosed datasets. Notably, it showcases China with 71 instances, followed by Brazil with 12 and United States with 8, signifying the prevalence of potential data reservoirs within these countries.
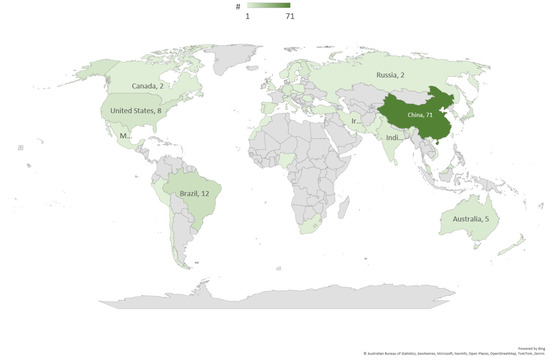
Figure 22.
Distribution of publishing countries based on corresponding author’s affiliation.
Figure 23 shows the distribution of countries to which the geographical extent of acquired datasets belong. China with 68 cases is first, followed by Brazil with 12 and United States with 9.
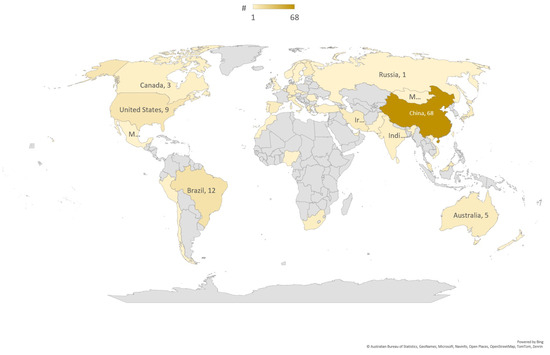
Figure 23.
Distribution of countries where the datasets were acquired.
3.3. Repositories
The identification and utilization of data repositories has a crucial role in scientific research by supporting the integrity and accessibility of scholarly information. These repositories, often diverse and distributed across various platforms, hold valuable information generated through thorough research efforts. Their significance is not only in providing a centralized reservoir of data but also in fostering transparency, reproducibility, and the potential for collaborative exploration. The identification and management of these repositories is important to fortify the foundations of academic inquiry, ensuring that valuable datasets are not only preserved but also made readily available for further analysis, verification, and innovation. Within this context, Table 7 delineates a compilation of identified repositories, showing their distinctive attributes. A set of parameters is extracted from the identified repositories, namely, the following key aspects:
Table 7.
Identified repositories. The “$” sign in front of the repository names indicates the existence of paid-access or restricted-access datasets in that repository. N/A stands for Not Available.
- Operating Country: Understanding the operational location of a repository sheds light on regional focus, legal considerations, and potential data limitations based on geographical boundaries or regulations.
- Size Limit: This parameter delineates the maximum capacity for data storage within a repository, crucial for users assessing data contribution or access possibilities.
- Number of Datasets: Reflecting the repository’s scale and diversity, a higher count often indicates a broader range of available datasets, appealing to a larger user base.
- Establishment Date: Signifying the repository’s maturity and experience, the creation date offers insights into its reliability and history of dataset curation.
- Geographical Extent: Describing the coverage area of datasets, this parameter assists researchers in evaluating the data’s relevance to specific regions or global applicability.
4. Conclusions
High-resolution aerial datasets are essential in advancing agroforestry research by providing detailed insights into these complex ecosystems. This study conducts an exploration of the availability of such datasets, examining existing and unpublished sources as well as data repositories to show the current landscape of data publication and accessibility. Our analysis reveals a significant increase in dataset availability over the past five years, which correlates with the advancements in machine learning and deep learning methods that require diverse and high-quality data for training and validation. This shows the dynamic interplay between technological development and data availability in research.
Other than the vivid growth in data publication and availability, following is the summary of the most important insights of this study:
- UAVs are the dominant platform when it comes to HR and UHR data: The deployment of UAVs has witnessed a remarkable and ever-growing prominence in the data acquisition phase for forestry-related studies. These aerial platforms offer a versatile and efficient means to gather high-resolution and comprehensive datasets, pushing the envelope of conventional approaches to forest monitoring. UAVs equipped with various sensors, such as RGB, multispectral, hyperspectral cameras, LiDAR, and thermal sensors, provide researchers with a diverse array of data modalities. The ability to navigate through challenging terrains and rapidly capture detailed information about forest ecosystems makes drones indispensable tools in forestry research. Their cost-effectiveness, agility, and capacity to cover vast areas make them ideal for tasks ranging from tree species classification to monitoring forest health and assessing environmental changes over time. As technology continues to advance, the utilization of UAVs in forestry studies is poised to expand further, fostering more precise and comprehensive insights into the dynamics of forest ecosystems.
- There are more unpublished data than published: The visible imbalance between the amount of published and unpublished data uncovered through our study underscores a challenge in forestry-related remote sensing datasets. It becomes evident that a substantial amount of valuable data remains unshared, inaccessible to the wider research community. While the past years have witnessed a growth in the publication of forestry-related remote sensing data, there remains a pressing need for increased efforts to motivate researchers to share their data openly. The prevalence of unpublished data suggests untapped potential and unexplored possibilities for advancing forestry, robotics, and computer vision research. Initiatives promoting data sharing, fostering collaborative platforms, and highlighting the benefits of open data practices are essential to bridge this gap. Encouraging a culture of data transparency and openness is crucial to harness the full potential of available datasets, fostering innovation and contributing to a more comprehensive understanding of forest ecosystems.
- The scarcity of co-aligned datasets: The scarcity of co-aligned data with different modalities is a notable gap in forestry-related datasets. Pursuing a comprehensive understanding of forest ecosystems requires the fusion of data from various sources and modalities. Integrated datasets, encompassing information captured through diverse sensors like RGB, multispectral and hypespectral cameras, and LiDAR sensors, offer a holistic perspective on forest characteristics. Data fusion not only enhances the accuracy of forestry analyses but also enables the extraction of richer insights through the collaborative utilization of complementary information. In machine learning, particularly deep learning and neural networks, the integration of different data modalities becomes imperative. Techniques such as attention mechanisms benefit significantly from diverse data sources, allowing models to focus on relevant features and relationships. Addressing the scarcity of co-aligned data can help advancing research methodologies, optimizing the performance of machine learning algorithms, and unlocking the full potential of data-driven approaches in forestry studies and more.
- Synthetic data have immense potential: Synthetic data emerge as a transformative solution in addressing the complexities and limitations associated with current data acquisition methods in forestry research. By offering a controlled and versatile environment for generating datasets that mirror real-world scenarios, its role extends beyond mere supplementation. The controlled nature of synthetic data allows researchers to manipulate variables such as environmental conditions, tree species distribution, and terrain characteristics, providing a tailored and efficient means to curate datasets. One of its notable contributions is in the generation of annotation masks, which is essential for training machine learning models. Synthetic datasets facilitate the creation of diverse and precisely labeled datasets, streamlining the process of developing robust algorithms for tasks like object detection and classification. This comprehensive simulation extends to various sensors, enhancing the applicability of synthetic data in different modalities. As technology continues to advance, the integration of synthetic data into forestry research methodologies seems very promising in propelling the field toward more accurate and comprehensive insights into forestry. However, it is crucial to acknowledge that synthetic data are still in their early stages, requiring substantial further development and refinement for them to become a comprehensive and widely adopted solution in forestry research.
Author Contributions
Conceptualization, B.C., A.M., and C.V.; methodology, B.C., A.M., and C.V.; investigation, B.C.; writing—original draft preparation, B.C.; writing—review and editing, B.C., A.M., and C.V.; visualization, B.C., A.M., and C.V.; supervision, A.M. and C.V.; project administration, C.V.; funding acquisition, A.M. and C.V. All authors have read and agreed to the published version of the manuscript.
Funding
This research was funded by Fundação para a Ciência e a Tecnologia, I.P. (FCT, https://ror.org/00snfqn58) under LAETA, through IDMEC: project UIDB/50022/2020 (DOI: 10.54499/UIDB/50022/2020) and scholarship BI 18.CSI.2023.IDMEC and through ADAI: project LA/P/0079/2020 (DOI: 10.54499/LA/P/0079/2020). It was also co-financed by National and European Funds through the programs Compete 2020 and Portugal 2020, under the project Safeforest–Semi-Autonomous Robotic System for Forest Cleaning and Fire Prevention (Ref. CENTRO-01-0247-FEDER-045931) and the project F4F—Forest for Future (Ref. CENTRO-08-5864-FSE-000031). For the purpose of open access, the authors have applied a CC-BY public copyright license to any Author’s Accepted Manuscript (AAM) version arising from this submission. All authors have read and agreed to the published version of the manuscript.
Data Availability Statement
No new data were created or analyzed in this study. Data sharing is not applicable to this article.
Conflicts of Interest
The authors declare no conflicts of interest.
Abbreviations
The following abbreviations are used in this manuscript:
| AI | Artificial Intelligence |
| CA | Corresponding Author |
| CSE | Carbon Stock Estimation |
| DB | Database |
| DBR | Database Repository |
| DD | Disease Detection |
| DL | Deep Learning |
| DS | Dataset |
| GB | Gigabyte |
| GE | Geographical Extent |
| GM | Geometrical Measurement |
| GSD | Ground Sampling Distance |
| HSA | Health Status Analysis |
| HSI | Hyperspectral Imaging |
| ITCD | Individual Tree Crown Delineation |
| ITD | Individual Tree Detection |
| LiDAR | Light Detection and Ranging |
| Misc. | Miscellaneous |
| ML | Machine Learning |
| MSI | Multispectral Imaging |
| N/A | Not Available |
| PM | Phenology Monitoring |
| POV | Point Of View |
| PPC | Photogrammetric Point Cloud |
| RGB | Red Green Blue |
| SI | Species Identification |
| SS | Semantic Segmentation |
| UAV | Unmanned Aerial Vehicle |
| UHR | Ultra-High Resolution |
References
- Okorie, N.; Aba, S.; Amu, C.; Baiyeri, K. The role of trees and plantation agriculture in mitigating global climate change. Afr. J. Food Agric. Nutr. Dev. 2017, 17, 12691–12707. [Google Scholar] [CrossRef]
- Prevedello, J.A.; Almeida-Gomes, M.; Lindenmayer, D.B. The importance of scattered trees for biodiversity conservation: A global meta-analysis. J. Appl. Ecol. 2018, 55, 205–214. [Google Scholar] [CrossRef]
- Seth, M.K. Trees and their economic importance. Bot. Rev. 2003, 69, 321–376. [Google Scholar] [CrossRef]
- Turner-Skoff, J.B.; Cavender, N. The benefits of trees for livable and sustainable communities. Plants People Planet 2019, 1, 323–335. [Google Scholar] [CrossRef]
- Nyyssönen, A. An international review of forestry and forest products. Unasylva 1962, 16, 5–14. [Google Scholar]
- Toth, C.; Jóźków, G. Remote sensing platforms and sensors: A survey. ISPRS J. Photogramm. Remote Sens. 2016, 115, 22–36. [Google Scholar] [CrossRef]
- Chehreh, B.; Moutinho, A.; Viegas, C. Latest Trends on Tree Classification and Segmentation Using UAV Data—A Review of Agroforestry Applications. Remote Sens. 2023, 15, 2263. [Google Scholar] [CrossRef]
- Cotrozzi, L. Spectroscopic detection of forest diseases: A review (1970–2020). J. For. Res. 2022, 33, 21–38. [Google Scholar] [CrossRef]
- Fassnacht, F.E.; Latifi, H.; Stereńczak, K.; Modzelewska, A.; Lefsky, M.; Waser, L.T.; Straub, C.; Ghosh, A. Review of studies on tree species classification from remotely sensed data. Remote Sens. Environ. 2016, 186, 64–87. [Google Scholar] [CrossRef]
- Tian, L.; Wu, X.; Tao, Y.; Li, M.; Qian, C.; Liao, L.; Fu, W. Review of Remote Sensing-Based Methods for Forest Aboveground Biomass Estimation: Progress, Challenges, and Prospects. Forests 2023, 14, 1086. [Google Scholar] [CrossRef]
- Lu, Y.; Young, S. A survey of public datasets for computer vision tasks in precision agriculture. Comput. Electron. Agric. 2020, 178, 105760. [Google Scholar] [CrossRef]
- Wen, D.; Khan, S.M.; Xu, A.J.; Ibrahim, H.; Smith, L.; Caballero, J.; Zepeda, L.; de Blas Perez, C.; Denniston, A.K.; Liu, X.; et al. Characteristics of publicly available skin cancer image datasets: A systematic review. Lancet Digit. Health 2022, 4, e64–e74. [Google Scholar] [CrossRef] [PubMed]
- Yavanoglu, O.; Aydos, M. A Review on Cyber Security Datasets for Machine Learning Algorithms. In Proceedings of the 2017 IEEE International Conference on Big Data (Big Data), Boston, MA, USA, 11–14 December 2017; pp. 2186–2193. [Google Scholar]
- Ozdarici-ok, A.; Ok, A.O. Using remote sensing to identify individual tree species in orchards: A review. Sci. Hortic. 2023, 321, 112333. [Google Scholar] [CrossRef]
- Ecke, S.; Dempewolf, J.; Frey, J.; Schwaller, A.; Endres, E.; Klemmt, H.J.; Tiede, D.; Seifert, T. UAV-Based Forest Health Monitoring: A Systematic Review. Remote Sens. 2022, 14, 3205. [Google Scholar] [CrossRef]
- Wilkinson, M.D.; Dumontier, M.; Aalbersberg, I.J.; Appleton, G.; Axton, M.; Baak, A.; Blomberg, N.; Boiten, J.W.; da Silva Santos, L.B.; Bourne, P.E.; et al. The FAIR Guiding Principles for scientific data management and stewardship. Sci. Data 2016, 3, 160018. [Google Scholar] [CrossRef]
- GO FAIR Initiative. 2023. Available online: https://www.go-fair.org/ (accessed on 15 November 2023).
- Asa Research Station. UAV—Multispectral Orthomosaic from Nybygget, 2018-05-04. 2021. Available online: https://hdl.handle.net/11676.1/mVvMKy2o4mTDYanOrJXCQVEV (accessed on 18 November 2023).
- Asa Research Station. UAV—Multispectral Point Cloud from Nybygget, 2018-04-25. 2021. Available online: https://hdl.handle.net/11676.1/1PBN9iyK3Y2n2pK3J3nDH2vI (accessed on 18 November 2023).
- Breunig, F.M. Unmanned Aerial Vehicle (UAV) data acquired over an experimental area of the UFSM campus Frederico Westphalen on December 13, 2017 in Rio Grande do Sul, Brazil. 2021. [Google Scholar] [CrossRef]
- Breunig, F.M.; Rieder, E. Unmanned Aerial Vehicle (UAV) data acquired over a subtropical forest area of the UFSM campus Frederico Westphalen, at February 18, 2021, Rio Grande do Sul, Brazil. 2021. [Google Scholar] [CrossRef]
- Chaschatzis, C.; Siniosoglou, I.; Triantafyllou, A.; Karaiskou, C.; Liatifis, A.; Radoglou-Grammatikis, P.; Pliatsios, D.; Kelli, V.; Lagkas, T.; Argyriou, V.; et al. Cherry Tree Disease Detection Dataset. 2022. [Google Scholar] [CrossRef]
- Chaschatzis, C.; Siniosoglou, I.; Triantafyllou, A.; Karaiskou, C.; Liatifis, A.; Radoglou-Grammatikis, P.; Pliatsios, D.; Kelli, V.; Lagkas, T.; Argyriou, V.; et al. Peach Tree Disease Detection Dataset. 2022. [Google Scholar] [CrossRef]
- Gonçalves, V.P.; Ribeiro, E.A.W.; Imai, N.N. Mapping Areas Invaded by Pinus sp. from Geographic Object-Based Image Analysis (GEOBIA) Applied on RPAS (Drone) Color Images. Remote Sens. 2022, 14, 2805. [Google Scholar] [CrossRef]
- Jansen, A.; Nicholson, J.; Esparon, A.; Whiteside, T.; Welch, M.; Tunstill, M.; Paramjyothi, H.; Gadhiraju, V.; van Bodegraven, S.; Bartolo, R. A Deep Learning Dataset for Savanna Tree Species in Northern Australia. 2022. [Google Scholar] [CrossRef]
- Kentsch, S.; Diez, Y. 2 Datasets of Forests for Computer Vision and Deep Learning Techniques. 2020. [Google Scholar] [CrossRef]
- Kleinsmann, J.; Verbesselt, J.; Kooistra, L. Monitoring Individual Tree Phenology in a Multi-Species Forest Using High Resolution UAV Images. Remote Sens. 2023, 15, 3599. [Google Scholar] [CrossRef]
- Morley, P.; Jump, A.; Donoghue, D. Co-Aligned Hyperspectral and LiDAR Data Collected in Drought-Stressed European Beech Forest, Rhön Biosphere Reserve, Germany, 2020. 2023. [Google Scholar] [CrossRef]
- Morley, P.; Jump, A.; Donoghue, D. Unmanned Aerial Vehicle Images of Drought-stressed European Beech Forests in the Rhön Biosphere Reserve, Germany, 2020. 2023. [Google Scholar] [CrossRef]
- Mõttus, M.; Markiet, V.; Hernández-Clemente, R.; Perheentupa, V.; Majasalmi, T. SPYSTUF Hyperspectral Data. 2021. [Google Scholar] [CrossRef]
- Puliti, S.; Pearse, G.; Surový, P.; Wallace, L.; Hollaus, M.; Wielgosz, M.; Astrup, R. FOR-instance: A UAV Laser Scanning Benchmark Dataset for Semantic and Instance Segmentation of Individual Trees. 2023. [Google Scholar] [CrossRef]
- Rajesh, C.B.; Changalagari, M.; Jha, S.; Ramachandran, K.I.; Nidamanuri, R.R. Agriculture_Forest_Hyperspectral_Data. Mendeley Data, V1. 2023. Available online: https://data.mendeley.com/datasets/p7n6ktjdx7/1 (accessed on 18 November 2023).
- Reiersen, G.; Dao, D.; Lütjens, B.; Klemmer, K.; Amara, K.; Zhang, C.; Zhu, X. ReforesTree: A Dataset for Estimating Tropical Forest Carbon Stock with Deep Learning and Aerial Imagery. 2022. [Google Scholar]
- Rock, G.; Mölter, T.; Deffert, P.; Dzunic, F.; Giese, L.; Rommel, E.; Kathoefer, F. mDRONES4rivers-project: UAV-Imagery of the Project Area Kuehkopf Knoblochsaue at the Rhine River, Germany. 2022. [Google Scholar] [CrossRef]
- Rock, G.; Mölter, T.; Deffert, P.; Dzunic, F.; Giese, L.; Rommel, E.; Kathoefer, F. mDRONES4rivers-project: UAV-Imagery of the Project area Nonnenwerth at the Rhine River, Germany. 2022. [Google Scholar] [CrossRef]
- Saarinen, N.; Kankare, V.; Yrttimaa, T.; Viljanen, N.; Honkavaara, E.; Holopainen, M.; Hyyppä, J.; Huuskonen, S.; Hynynen, J.; Vastaranta, M. Detailed Point Cloud Data on Stem Size and Shape of Scots Pine Trees. 2020. [Google Scholar] [CrossRef]
- Schürholz, D.; Castellanos-Galindo, G.A.; Casella, E.; Mejía-Rentería, J.C.; Chennu, A. Seeing the Forest for the Trees: Mapping Cover and Counting Trees from Aerial Images of a Mangrove Forest Using Artificial Intelligence. Remote Sens. 2023, 15, 3334. [Google Scholar] [CrossRef]
- van Geffen, F.; Brieger, F.; Pestryakova, L.A.; Zakharov, E.S.; Herzschuh, U.; Kruse, S. SiDroForest: Synthetic Siberian Larch Tree Crown Dataset of 10.000 Instances in the Microsoft’s Common Objects in Context Dataset (Coco) Format. 2021. [Google Scholar] [CrossRef]
- Varney, N.; Asari, V.K.; Graehling, Q. DALES: A Large-scale Aerial LiDAR Data Set for Semantic Segmentation. In Proceedings of the IEEE/CVF Conference on Computer Vision and Pattern Recognition Workshops, Seattle, WA, USA, 13–19 June 2020; pp. 186–187. [Google Scholar]
- Weintein, B. DeepForest—Street Trees Dataset. 2020. [Google Scholar] [CrossRef]
- Yang, R.; Fang, W.; Sun, X.; Jing, X.; Fu, L.; Wei, X.; Li, R. An Aerial Point Cloud Dataset of Apple Tree Detection and Segmentation with Integrating RGB Information and Coordinate Information. 2023. [Google Scholar] [CrossRef]
- Ye, H.; Chen, S.; Guo, A.; Nie, C.; Wang, J. A Dataset of UAV Multispectral Images for Banana Fusarium Wilt Survey. 2023. [Google Scholar] [CrossRef]
- Lefebvre, I.; Laliberté, E. UAV LiDAR, UAV Imagery, Tree Segmentations and Ground Measurements for Estimating Tree Biomass in Canadian (Quebec) Plantations. 2024. [Google Scholar] [CrossRef]
- Ramesh, V.; Ouaknine, A.; Rolnick, D. Forest Monitoring Dataset. 2024. [Google Scholar] [CrossRef]
- Schulz, C.; Ahlswede, S.; Gava, C.; Helber, P.; Bischke, B.; Arias, F.; Förster, M.; Hees, J.; Demir, B.; Kleinschmit, B. TreeSatAI Benchmark Archive for Deep Learning in Forest Applications. 2022. [Google Scholar] [CrossRef]
- Veitch-Michaelis, J.; Cottam, A.; Schweizer, D.; Broadbent, E.N.; Dao, D.; Zhang, C.; Zambrano, A.A.; Max, S. OAM-TCD: A globally diverse dataset of high-resolution tree cover maps. Adv. Neural Inf. Process. Syst. 2024, 37, 49749–49767. [Google Scholar]
- Beloiu Schwenke, M.; Xia, Z.; Novoselova, I.; Gessler, A.; Kattenborn, T.; Mosig, C.; Puliti, S.; Waser, L.; Rehush, N.; Cheng, Y.; et al. TreeAI Global Initiative—Advancing Tree Species Identification from aerial Images with Deep Learning. 2025. [Google Scholar] [CrossRef]
- Zhang, J.; Lei, F.; Fan, X. Parameter-Efficient Fine-Tuning for Individual Tree Crown Detection and Species Classification Using UAV-Acquired Imagery. Remote Sens. 2025, 17, 1272. [Google Scholar] [CrossRef]
- Niedz, R.; Bowman, K.D. UAV Image and Ground Data of Two Citrus ‘Valencia’ orange (Citrus sinensis [L.] Osbeck) Rootstock Trials. 2024. [Google Scholar] [CrossRef]
- Degenhardt, D. UAV-Based LiDAR and Multispectral Point Cloud Data for Reclaimed Wellsites in Alberta, Canada. 2025. Available online: https://github.com/NRCan/TreeAIBox (accessed on 17 July 2025).
- Pacheco-Prado, D.; Bravo-López, E.; Martínez, E.; Ruiz, L.Á. Urban Tree Species Identification Based on Crown RGB Point Clouds Using Random Forest and PointNet. Remote Sens. 2025, 17, 1863. [Google Scholar] [CrossRef]
- Popp, M.R.; Kalwij, J.M. Consumer-grade UAV imagery facilitates semantic segmentation of species-rich savanna tree layers. Sci. Rep. 2023, 13, 13892. [Google Scholar] [CrossRef]
- Allen, M.J.; Moreno-Fernández, D.; Ruiz-Benito, P.; Grieve, S.W.; Lines, E.R. Low-cost tree crown dieback estimation using deep learning-based segmentation. Environ. Data Sci. 2024, 3, e18. [Google Scholar] [CrossRef]
- Junttila, S.; Näsi, R.; Koivumäki, N.; Imangholiloo, M.; Saarinen, N.; Raisio, J.; Holopainen, M.; Hyyppä, H.; Hyyppä, J.; Lyytikäinen-Saarenmaa, P.; et al. Data for Estimating Spruce Tree Health Using Drone-Based RGB and Multispectral Imagery. 2024. [Google Scholar] [CrossRef]
- Gaydon, C.; Roche, F. PureForest: A Large-Scale Aerial Lidar and Aerial Imagery Dataset for Tree Species Classification in Monospecific Forests. arXiv 2024, arXiv:2404.12064. [Google Scholar]
- Mirela, B.; Lucca, H.; Nataliia, R.; Arthur, G.; Verena, G. Tree Species Annotations for Deep Learning. 2023. [Google Scholar] [CrossRef]
- Li, Y.; Qi, H.; Chen, H.; Liang, X.; Zhao, G. Deep Change Monitoring: A Hyperbolic Representative Learning Framework and a Dataset for Long-term Fine-grained Tree Change Detection. In Proceedings of the IEEE/CVF Conference on Computer Vision and Pattern Recognition (CVPR), Nashville, TN, USA, 11–15 June 2025; pp. 27346–27356. [Google Scholar]
- Lee, J.J.; Li, B.; Beery, S.; Huang, J.; Fei, S.; Yeh, R.A.; Benes, B. Tree-D Fusion: Simulation-Ready Tree Dataset from Single Images with Diffusion Priors. In Computer Vision—ECCV 2024; Springer: Cham, Switzerland, 2025; pp. 439–460. [Google Scholar] [CrossRef]
- Tupinamba-Simoes, F.; Bravo, F. Virtual Forest Twins Based on Marteloscope Point Cloud Data from Different Forest Ecosystem Types and Its Associated Teaching Workload. 2023. [Google Scholar] [CrossRef]
- Lammoglia, S.K.; Danumah, J.H.; Akpa, Y.L.; Assoua Brou, Y.L.; Kassi, N.J. Dataset of RGB and Multispectral Aerial Images of Cocoa Agroforestry Plots (Divo, Côte d’Ivoire). 2024. [Google Scholar] [CrossRef]
- Jackisch, R. UAV-Based Lidar Point Clouds of Experimental Station Britz, Brandenburg. 2024. [Google Scholar] [CrossRef]
- Pirotti, F. LiDAR and Photogrammetry Point Clouds. 2023. [Google Scholar] [CrossRef]
- Agricultural Research Service. UAV Image and Ground Data of Citrus Bingo Mandarin Hybrid (Citrus reticulata Blanco) Rootstock Trial, Fort Pierce, Florida, USA. 2025. Available online: https://catalog.data.gov/dataset/uav-image-and-ground-data-of-citrus-bingo-mandarin-hybrid-icitrus-ireticulata-blanco-roots (accessed on 17 July 2024).
- Weinstein, B.; Marconi, S.; Zare, A.; Bohlman, S.; Graves, S.; Singh, A.; White, E. NEON Tree Crowns Dataset. 2020. [Google Scholar] [CrossRef]
- Boguszewski, A.; Batorski, D.; Ziemba-Jankowska, N.; Dziedzic, T.; Zambrzycka, A. LandCover.ai: Dataset for Automatic Mapping of Buildings, Woodlands, Water and Roads from Aerial Imagery. In Proceedings of the IEEE/CVF Conference on Computer Vision and Pattern Recognition, Nashville, TN, USA, 20–25 June 2021; pp. 1102–1110. [Google Scholar]
- Gurgu, M.M.; Queralta, J.P.; Westerlund, T. Vision-Based GNSS-Free Localization for UAVs in the Wild. In Proceedings of the 2022 7th International Conference on Mechanical Engineering and Robotics Research (ICMERR), Krakow, Poland, 9–11 December 2022. [Google Scholar]
- Fonder, M.; Van Droogenbroeck, M. Mid-Air: A Multi-Modal Dataset for Extremely Low Altitude Drone Flights. In Proceedings of the 2019 IEEE/CVF Conference on Computer Vision and Pattern Recognition Workshops (CVPRW), Long Beach, CA, USA, 15–20 June 2019; pp. 553–562. [Google Scholar] [CrossRef]
- TreeDataset. Tree-Top-View Dataset. 2023. Available online: https://universe.roboflow.com/treedataset-clsqo/tree-top-view (accessed on 19 October 2023).
- Kemker, R.; Salvaggio, C.; Kanan, C. Algorithms for semantic segmentation of multispectral remote sensing imagery using deep learning. ISPRS J. Photogramm. Remote Sens. 2018, 145, 60–77. [Google Scholar] [CrossRef]
- Parkan, M.; Junod, P.; Lugrin, R.; Ginzler, C. A Reference Airborne Lidar Dataset For Forest Research. 2018. [Google Scholar] [CrossRef]
- Project. Tree Counting Dataset. 2023. Available online: https://universe.roboflow.com/project-s402o/tree-counting-qiw3h (accessed on 19 October 2023).
- Ammar, A.; Koubaa, A. Aerial Images of Palm Trees. 2023. [Google Scholar] [CrossRef]
- Jones, A. Drone Imagery Mangrove Biomass Datasets. 2019. [Google Scholar] [CrossRef]
- (LINZ), L.I.N.Z. Southland 0.25 m Rural Aerial Photos (2023–2024). 2024. Available online: https://data.linz.govt.nz/layer/114532-southland-025m-rural-aerial-photos-2023-2024/ (accessed on 17 July 2024).
- (LINZ), L.I.N.Z. Auckland 0.25 m Rural Aerial Photos (2024). 2024. Available online: https://data.linz.govt.nz/layer/119795-auckland-025m-rural-aerial-photos-2024/ (accessed on 17 July 2024).
- (LINZ), L.I.N.Z. Gisborne 0.2 m Rural Aerial Photos (2023–2024). 2024. Available online: https://data.linz.govt.nz/layer/118823-gisborne-02m-rural-aerial-photos-2023-2024/ (accessed on 17 July 2024).
- (LINZ), L.I.N.Z. Gisborne 0.1 m Rural Aerial Photos (2023–2024). 2024. Available online: https://data.linz.govt.nz/layer/117730-gisborne-01m-rural-aerial-photos-2023-2024/ (accessed on 17 July 2024).
- Ahmadi, S.A.; Ghorbanian, A.; Golparvar, F.; Mohammadzadeh, A.; Jamali, S. Individual tree detection from unmanned aerial vehicle (UAV) derived point cloud data in a mixed broadleaf forest using hierarchical graph approach. Eur. J. Remote Sens. 2022, 55, 520–539. [Google Scholar] [CrossRef]
- Liu, M. LiDAR dataset of Forest Park. 2020. [Google Scholar] [CrossRef]
- Culman, M.; Delalieux, S.; Van Tricht, K. Individual Palm Tree Detection Using Deep Learning on RGB Imagery to Support Tree Inventory. Remote Sens. 2020, 12, 3476. [Google Scholar] [CrossRef]
- Pan, L. sUAV RGB Dataset. 2024. [Google Scholar] [CrossRef]
- Image AI Development. Forest Analysis Dataset. 2023. Available online: https://universe.roboflow.com/image-ai-development/forest-analysis (accessed on 17 July 2024).
- Arura UAV. UAV Tree Identification—NEW Dataset. 2023. Available online: https://universe.roboflow.com/arura-uav/uav-tree-identification-new (accessed on 19 October 2023).
- Kristensen, T. Mapping Above- and Below-Ground Carbon Pools in Boreal Forests: The Case for Airborne Lidar. Dataset. 2015. [Google Scholar] [CrossRef]
- Timilsina, S.; Aryal, J.; Kirkpatrick, J.B. Mapping Urban Tree Cover Changes Using Object-Based Convolution Neural Network (OB-CNN). Remote Sens. 2020, 12, 3017. [Google Scholar] [CrossRef]
- Guo, X.; Li, H.; Jing, L.; Wang, P. Individual Tree Species Classification Based on Convolutional Neural Networks and Multitemporal High-Resolution Remote Sensing Images. Sensors 2022, 22, 3157. [Google Scholar] [CrossRef]
- Weishaupt, M. Tree Species Classification from Very High-Resolution UAV Images Using Deep Learning: Integrating Approaches Using Individual Tree Crowns for Semantic Segmentation. Master’s Thesis, School of Life Science, Technical University of Munich, Munich, Germany, 20 December 2024. [Google Scholar]
- Yang, M.; Mou, Y.; Liu, S.; Meng, Y.; Liu, Z.; Li, P.; Xiang, W.; Zhou, X.; Peng, C. Detecting and mapping tree crowns based on convolutional neural network and Google Earth images. Int. J. Appl. Earth Obs. Geoinf. 2022, 108, 102764. [Google Scholar] [CrossRef]
- Man, Q.; Yang, X.; Liu, H.; Zhang, B.; Dong, P.; Wu, J.; Liu, C.; Han, C.; Zhou, C.; Tan, Z.; et al. Comparison of UAV-Based LiDAR and Photogrammetric Point Cloud for Individual Tree Species Classification of Urban Areas. Remote Sens. 2025, 17, 1212. [Google Scholar] [CrossRef]
- Gibril, M.B.A.; Shafri, H.Z.M.; Shanableh, A.; Al-Ruzouq, R.; bin Hashim, S.J.; Wayayok, A.; Sachit, M.S. Large-scale assessment of date palm plantations based on UAV remote sensing and multiscale vision transformer. Remote Sens. Appl. Soc. Environ. 2024, 34, 101195. [Google Scholar] [CrossRef]
- Al-Ruzouq, R.; Gibril, M.B.A.; Shanableh, A.; Bolcek, J.; Lamghari, F.; Hammour, N.A.; El-Keblawy, A.; Jena, R. Spectral–Spatial transformer-based semantic segmentation for large-scale mapping of individual date palm trees using very high-resolution satellite data. Ecol. Indic. 2024, 163, 112110. [Google Scholar] [CrossRef]
- Kwong, Q.B.; Kon, Y.T.; Rusik, W.R.W.; Shabudin, M.N.A.; Rahman, S.S.A.; Kulaveerasingam, H.; Appleton, D.R. Enhancing oil palm segmentation model with GAN-based augmentation. J. Big Data 2024, 11, 126. [Google Scholar] [CrossRef]
- Moysiadis, V.; Siniosoglou, I.; Kokkonis, G.; Argyriou, V.; Lagkas, T.; Goudos, S.K.; Sarigiannidis, P. Cherry Tree Crown Extraction Using Machine Learning Based on Images from UAVs. Agriculture 2024, 14, 322. [Google Scholar] [CrossRef]
- He, H.; Zhou, F.; Zhang, Y.; Chen, T.; Wei, Y. GACNet: A Geometric and Attribute Co-Evolutionary Network for Citrus Tree Height Extraction From UAV Photogrammetry-Derived Data. IEEE J. Sel. Top. Appl. Earth Obs. Remote Sens. 2025, 18, 6363–6381. [Google Scholar] [CrossRef]
- Rodrıguez-Malpica, A.E.L.; Zouaghi, H.; Moshkenani, M.M.; Peng, W. Tree crown prediction of spruce tree using a machine-learning-based hybrid image processing method. Urban For. Urban Green. 2025, 107, 128815. [Google Scholar] [CrossRef]
- Yao, Z.; Chai, G.; Lei, L.; Jia, X.; Zhang, X. Individual Tree Species Identification and Crown Parameters Extraction Based on Mask R-CNN: Assessing the Applicability of Unmanned Aerial Vehicle Optical Images. Remote Sens. 2023, 15, 5164. [Google Scholar] [CrossRef]
- Htun, N.M.; Owari, T.; Tsuyuki, S.; Hiroshima, T. Mapping the Distribution of High-Value Broadleaf Tree Crowns through Unmanned Aerial Vehicle Image Analysis Using Deep Learning. Algorithms 2024, 17, 84. [Google Scholar] [CrossRef]
- Long, Y.; Ye, S.; Wang, L.; Wang, W.; Liao, X.; Jia, S. Scale Pyramid Graph Network for Hyperspectral Individual Tree Segmentation. IEEE Trans. Geosci. Remote Sens. 2024, 62, 1–14. [Google Scholar] [CrossRef]
- Amarasingam, N.; Hele, M.; Alvarez, F.V.; Warfield, A.; Trotter, P.; Granados, R.B.; Gonzalez, L.F. Broad-Leaved Pepper and Pandanus Classification and Mapping Using Drone Imagery—Proof of Concept Trial. In Proceedings of the 2nd Pest Animal and Weed Symposium 2023 (PAWS 2023), Dalby, QLD, Australia, 28–31 August 2023; pp. 196–208. [Google Scholar]
- Hayashi, Y.; Deng, S.; Katoh, M.; Nakamura, R. Individual tree canopy detection and species classification of conifers by deep learning. Jpn. J. For. Plan. 2021, 55, 3–22. [Google Scholar] [CrossRef]
- Ferreira, M.P.; de Almeida, D.R.A.; de Almeida Papa, D.; Minervino, J.B.S.; Veras, H.F.P.; Formighieri, A.; Santos, C.A.N.; Ferreira, M.A.D.; Figueiredo, E.O.; Ferreira, E.J.L. Individual tree detection and species classification of Amazonian palms using UAV images and deep learning. For. Ecol. Manag. 2020, 475, 118397. [Google Scholar] [CrossRef]
- Kouvaras, L.; Petropoulos, G.P. A Novel Technique Based on Machine Learning for Detecting and Segmenting Trees in Very High Resolution Digital Images from Unmanned Aerial Vehicles. Drones 2024, 8, 43. [Google Scholar] [CrossRef]
- Cheng, J.; Zhu, Y.; Zhao, Y.; Li, T.; Chen, M.; Sun, Q.; Gu, Q.; Zhang, X. Application of an improved U-Net with image-to-image translation and transfer learning in peach orchard segmentation. Int. J. Appl. Earth Obs. Geoinf. 2024, 130, 103871. [Google Scholar] [CrossRef]
- Ampatzidis, Y.; Partel, V. UAV-based High Throughput Phenotyping in Citrus Utilizing Multispectral Imaging and Artificial Intelligence. Remote Sens. 2019, 11, 410. [Google Scholar] [CrossRef]
- Hosingholizade, A.; Erfanifard, Y.; Alavipanah, S.K.; Millan, V.E.G.; Mielcarek, M.; Pirasteh, S.; Stereńczak, K. Assessment of Pine Tree Crown Delineation Algorithms on UAV Data: From K-Means Clustering to CNN Segmentation. Forests 2025, 16, 228. [Google Scholar] [CrossRef]
- Ma, J.; Yan, L.; Chen, B.; Zhang, L. A Tree Crown Segmentation Approach for Unmanned Aerial Vehicle Remote Sensing Images on Field Programmable Gate Array (FPGA) Neural Network Accelerator. Sensors 2025, 25, 2729. [Google Scholar] [CrossRef] [PubMed]
- Castro, W.; Avila-George, H.; Nauray, W.; Guerra, R.; Rodriguez, J.; Castro, J.; de-la Torre, M. Deep Classification of Algarrobo Trees in Seasonally Dry Forests of Peru Using Aerial Imagery. IEEE Access 2025, 13, 54960–54975. [Google Scholar] [CrossRef]
- Hao, Z.; Yao, S.; Post, C.J.; Mikhailova, E.A.; Lin, L. Comparative performance of convolutional neural networks for detecting and mapping a young Casuarina equisetifolia L. forest from unmanned aerial vehicle (UAV) imagery. New For. 2025, 56, 40. [Google Scholar] [CrossRef]
- Zhang, Y.; Wang, M.; Mango, J.; Xin, L.; Meng, C.; Li, X. Individual tree detection and counting based on high-resolution imagery and the canopy height model data. Geo-Spat. Inf. Sci. 2024, 27, 2162–2178. [Google Scholar] [CrossRef]
- Ozdarici-Ok, A.; Ok, A.O.; Zeybek, M.; Atesoglu, A. Automated extraction and validation of Stone Pine (Pinus pinea L.) trees from UAV-based digital surface models. Geo-Spat. Inf. Sci. 2024, 27, 142–162. [Google Scholar] [CrossRef]
- Wang, R.; Hu, C.; Han, J.; Hu, X.; Zhao, Y.; Wang, Q.; Sun, H.; Xie, Y. A Hierarchic Method of Individual Tree Canopy Segmentation Combing UAV Image and LiDAR. Arab. J. Sci. Eng. 2025, 50, 7567–7585. [Google Scholar] [CrossRef]
- Dersch, S.; Schöttl, A.; Krzystek, P.; Heurich, M. Towards complete tree crown delineation by instance segmentation with Mask R–CNN and DETR using UAV-based multispectral imagery and lidar data. ISPRS Open J. Photogramm. Remote Sens. 2023, 8, 100037. [Google Scholar] [CrossRef]
- Lv, L.; Li, X.; Mao, F.; Zhou, L.; Xuan, J.; Zhao, Y.; Yu, J.; Song, M.; Huang, L.; Du, H. A Deep Learning Network for Individual Tree Segmentation in UAV Images with a Coupled CSPNet and Attention Mechanism. Remote Sens. 2023, 15, 4420. [Google Scholar] [CrossRef]
- Yang, K.; Ye, Z.; Liu, H.; Su, X.; Yu, C.; Zhang, H.; Lai, R. A new framework for GEOBIA: Accurate individual plant extraction and detection using high-resolution RGB data from UAVs. Int. J. Digit. Earth 2023, 16, 2599–2622. [Google Scholar] [CrossRef]
- Carnegie, A.J.; Eslick, H.; Barber, P.; Nagel, M.; Stone, C. Airborne multispectral imagery and deep learning for biosecurity surveillance of invasive forest pests in urban landscapes. Urban For. Urban Green. 2023, 81, 127859. [Google Scholar] [CrossRef]
- Cheng, Z.; Qi, L.; Cheng, Y.; Wu, Y.; Zhang, H. Interlacing Orchard Canopy Separation and Assessment using UAV Images. Remote Sens. 2020, 12, 767. [Google Scholar] [CrossRef]
- Correa Martins, J.A.; Menezes, G.; Gonçalves, W.; Sant’Ana, D.A.; Osco, L.P.; Liesenberg, V.; Li, J.; Ma, L.; Oliveira, P.T.; Astolfi, G.; et al. Machine learning and SLIC for Tree Canopies Segmentation in Urban Areas. Ecol. Inform. 2021, 66, 101465. [Google Scholar] [CrossRef]
- Dong, X.; Zhang, Z.; Yu, R.; Tian, Q.; Zhu, X. Extraction of Information about Individual Trees from High-Spatial-Resolution UAV-Acquired Images of an Orchard. Remote Sens. 2020, 12, 133. [Google Scholar] [CrossRef]
- Di Gennaro, S.F.; Nati, C.; Dainelli, R.; Pastonchi, L.; Berton, A.; Toscano, P.; Matese, A. An Automatic UAV Based Segmentation Approach for Pruning Biomass Estimation in Irregularly Spaced Chestnut Orchards. Forests 2020, 11, 308. [Google Scholar] [CrossRef]
- Fawcett, D.; Azlan, B.; Hill, T.C.; Kho, L.K.; Bennie, J.; Anderson, K. Unmanned aerial vehicle (UAV) derived structure-from-motion photogrammetry point clouds for oil palm (Elaeis guineensis) canopy segmentation and height estimation. Int. J. Remote Sens. 2019, 40, 7538–7560. [Google Scholar] [CrossRef]
- Gan, Y.; Wang, Q.; Iio, A. Tree Crown Detection and Delineation in a Temperate Deciduous Forest from UAV RGB Imagery Using Deep Learning Approaches: Effects of Spatial Resolution and Species Characteristics. Remote Sens. 2023, 15, 778. [Google Scholar] [CrossRef]
- Ghasemi, M.; Latifi, H.; Pourhashemi, M. A Novel Method for Detecting and Delineating Coppice Trees in UAV Images to Monitor Tree Decline. Remote Sens. 2022, 14, 5910. [Google Scholar] [CrossRef]
- Illana Rico, S.; Martínez Gila, D.M.; Cano Marchal, P.; Gómez Ortega, J. Automatic Detection of Olive Tree Canopies for Groves with Thick Plant Cover on the Ground. Sensors 2022, 22, 6219. [Google Scholar] [CrossRef]
- Ji, Y.; Yan, E.; Yin, X.; Song, Y.; Wei, W.; Mo, D. Automated extraction of Camellia oleifera crown using unmanned aerial vehicle visible images and the ResU-Net deep learning model. Front. Plant Sci. 2022, 13, 958940. [Google Scholar] [CrossRef] [PubMed]
- Kolanuvada, S.R.; Ilango, K.K. Automatic Extraction of Tree Crown for the Estimation of Biomass from UAV Imagery Using Neural Networks. J. Indian Soc. Remote Sens. 2021, 49, 651–658. [Google Scholar] [CrossRef]
- Liang, Y.; Sun, Y.; Kou, W.; Xu, W.; Wang, J.; Wang, Q.; Wang, H.; Lu, N. Rubber Tree Recognition Based on UAV RGB Multi-Angle Imagery and Deep Learning. Drones 2023, 7, 547. [Google Scholar] [CrossRef]
- Ma, K.; Chen, Z.; Fu, L.; Tian, W.; Jiang, F.; Yi, J.; Du, Z.; Sun, H. Performance and Sensitivity of Individual Tree Segmentation Methods for UAV-LiDAR in Multiple Forest Types. Remote Sens. 2022, 14, 298. [Google Scholar] [CrossRef]
- Moradi, F.; Javan, F.D.; Samadzadegan, F. Potential evaluation of visible-thermal UAV image fusion for individual tree detection based on convolutional neural network. Int. J. Appl. Earth Obs. Geoinf. 2022, 113, 103011. [Google Scholar] [CrossRef]
- Parkan, M.J. Combined Use of Airborne Laser Scanning and Hyperspectral Imaging for Forest Inventories; Infoscience.epfl.ch. 2019. [Google Scholar] [CrossRef]
- Ponce, J.M.; Aquino, A.; Tejada, D.; Al-Hadithi, B.M.; Andújar, J.M. A Methodology for the Automated Delineation of Crop Tree Crowns from UAV-Based Aerial Imagery by Means of Morphological Image Analysis. Agronomy 2022, 12, 43. [Google Scholar] [CrossRef]
- Qi, Y.; Dong, X.; Chen, P.; Lee, K.H.; Lan, Y.; Lu, X.; Jia, R.; Deng, J.; Zhang, Y. Canopy Volume Extraction of Citrus reticulate Blanco cv. Shatangju Trees Using UAV Image-Based Point Cloud Deep Learning. Remote Sens. 2021, 13, 3437. [Google Scholar] [CrossRef]
- Roslan, Z.; Long, Z.A.; Ismail, R. Individual Tree Crown Detection using GAN and RetinaNet on Tropical Forest. In Proceedings of the 2021 15th International Conference on Ubiquitous Information Management and Communication (IMCOM), Seoul, Republic of Korea, 4–6 January 2021; pp. 1–7. [Google Scholar] [CrossRef]
- Șandric, I.; Irimia, R.; Petropoulos, G.P.; Stateras, D.; Kalivas, D.; Pleșoianu, A. Drone Imagery in Support of Orchards Trees Vegetation Assessment Based on Spectral Indices and Deep Learning. In Information and Communication Technologies for Agriculture—Theme I: Sensors; Springer International Publishing: Cham, Switzerland, 2022; pp. 233–248. [Google Scholar] [CrossRef]
- Torres, D.L.; Feitosa, R.Q.; La Rosa, L.E.C.; Happ, P.N.; Marcato, J.; Gonçalves, W.; Martins, J.; Liesenberg, V. Semantic Segmentation Of Endangered Tree Species In Brazilian Savanna Using Deeplabv3+ Variants. In Proceedings of the 2020 IEEE Latin American GRSS & ISPRS Remote Sensing Conference (LAGIRS), Santiago, Chile, 22–26 March 2020; pp. 515–520. [Google Scholar] [CrossRef]
- Wu, J.; Yang, G.; Yang, H.; Zhu, Y.; Li, Z.; Lei, L.; Zhao, C. Extracting apple tree crown information from remote imagery using deep learning. Comput. Electron. Agric. 2020, 174, 105504. [Google Scholar] [CrossRef]
- Zaforemska, A.; Xiao, W.; Gaulton, R. Individual Tree Detection From UAV LIDAR Data In A Mixed Species Woodland. Int. Arch. Photogramm. Remote Sensing And Spat. Inf. Sci. 2019, XLII-2/W13, 657–663. [Google Scholar] [CrossRef]
- Zhang, W.; Chen, X.; Qi, J.; Yang, S. Automatic instance segmentation of orchard canopy in unmanned aerial vehicle imagery using deep learning. Front. Plant Sci. 2022, 13, 1041791. [Google Scholar] [CrossRef]
- Zheng, J.; Yuan, S.; Wu, W.; Li, W.; Yu, L.; Fu, H.; Coomes, D. Surveying coconut trees using high-resolution satellite imagery in remote atolls of the Pacific Ocean. Remote Sens. Environ. 2023, 287, 113485. [Google Scholar] [CrossRef]
- Thapa, N.; Khanal, R.; Bhattarai, B.; Lee, J. Pine Wilt Disease Segmentation with Deep Metric Learning Species Classification for Early-Stage Disease and Potential False Positive Identification. Electronics 2024, 13, 1951. [Google Scholar] [CrossRef]
- Wang, J.; Lin, Q.; Meng, S.; Huang, H.; Liu, Y. Individual Tree-Level Monitoring of Pest Infestation Combining Airborne Thermal Imagery and Light Detection and Ranging. Forests 2024, 15, 112. [Google Scholar] [CrossRef]
- Xiang, Z.; Li, T.; Lv, Y.; Wang, R.; Sun, T.; Gao, Y.; Wu, H. Identification of Damaged Canopies in Farmland Artificial Shelterbelts Based on Fusion of Unmanned Aerial Vehicle LiDAR and Multispectral Features. Forests 2024, 15, 891. [Google Scholar] [CrossRef]
- Ye, X.; Pan, J.; Liu, G.; Shao, F. Exploring the Close-Range Detection of UAV-Based Images on Pine Wilt Disease by an Improved Deep Learning Method. Plant Phenomics 2023, 5, 0129. [Google Scholar] [CrossRef]
- Kavithamani, V.; UmaMaheswari, S. Investigation of deep learning for whitefly identification in coconut tree leaves. Intell. Syst. Appl. 2023, 20, 200290. [Google Scholar] [CrossRef]
- Woolfson, L.S. Detecting Disease in Citrus Trees using Multispectral UAV Data and Deep Learning Algorithm. Master’s Thesis, University of the Witwatersrand, Johannesburg, South Africa, 2024. [Google Scholar]
- Guo, H.; Cheng, Y.; Liu, J.; Wang, Z. Low-cost and precise traditional Chinese medicinal tree pest and disease monitoring using UAV RGB image only. Sci. Rep. 2024, 14, 25562. [Google Scholar] [CrossRef]
- Feng, H.; Li, Q.; Wang, W.; Bashir, A.K.; Singh, A.K.; Xu, J.; Fang, K. Security of target recognition for UAV forestry remote sensing based on multi-source data fusion transformer framework. Inf. Fusion 2024, 112, 102555. [Google Scholar] [CrossRef]
- Liu, W.T.; Xie, Z.R.; Du, J.; Li, Y.H.; Long, Y.B.; Lan, Y.B.; Liu, T.Y.; Sun, S.; Zhao, J. Early detection of pine wilt disease based on UAV reconstructed hyperspectral image. Front. Plant 2024, 15, 1453761. [Google Scholar] [CrossRef]
- Hu, K.; Liu, J.; Xiao, H.; Zeng, Q.; Liu, J.; Zhang, L.; Li, M.; Wang, Z. A new BWO-based RGB vegetation index and ensemble learning strategy for the pests and diseases monitoring of CCB trees using unmanned aerial vehicle. Front. Plant Sci. 2024, 15, 1464723. [Google Scholar] [CrossRef] [PubMed]
- Li, H.; Tan, B.; Sun, L.; Liu, H.; Zhang, H.; Liu, B. Multi-Source Image Fusion Based Regional Classification Method for Apple Diseases and Pests. Appl. Sci. 2024, 14, 7695. [Google Scholar] [CrossRef]
- Yao, J.; Song, B.; Chen, X.; Zhang, M.; Dong, X.; Liu, H.; Liu, F.; Zhang, L.; Lu, Y.; Xu, C.; et al. Pine-YOLO: A Method for Detecting Pine Wilt Disease in Unmanned Aerial Vehicle Remote Sensing Images. Forests 2024, 15, 737. [Google Scholar] [CrossRef]
- Yu, R.; Liu, Y.; Gao, B.; Ren, L.; Luo, Y. Detection of pine wood nematode infections in Chinese pine (Pinus tabuliformis) using hyperspectral drone images. Pest Manag. Sci. 2025, 81, 5659–5674. [Google Scholar] [CrossRef]
- Bozzini, A.; Huo, L.; Brugnaro, S.; Morgante, G.; Persson, H.J.; Finozzi, V.; Battisti, A.; Faccoli, M. Multispectral drone images for the early detection of bark beetle infestations: Assessment over large forest areas in the Italian South-Eastern Alps. Front. For. Glob. Chang. 2025, 8, 1532954. [Google Scholar] [CrossRef]
- Blekos, K.; Tsakas, A.; Xouris, C.; Evdokidis, I.; Alexandropoulos, D.; Alexakos, C.; Katakis, S.; Makedonas, A.; Theoharatos, C.; Lalos, A. Analysis, Modeling and Multi-Spectral Sensing for the Predictive Management of Verticillium Wilt in Olive Groves. J. Sens. Actuator Netw. 2021, 10, 15. [Google Scholar] [CrossRef]
- Cai, P.; Chen, G.; Yang, H.; Li, X.; Zhu, K.; Wang, T.; Liao, P.; Han, M.; Gong, Y.; Wang, Q.; et al. Detecting Individual Plants Infected with Pine Wilt Disease Using Drones and Satellite Imagery: A Case Study in Xianning, China. Remote Sens. 2023, 15, 2671. [Google Scholar] [CrossRef]
- Gao, B.; Yu, L.; Ren, L.; Zhan, Z.; Luo, Y. Early Detection of Dendroctonus valens Infestation at Tree Level with a Hyperspectral UAV Image. Remote Sens. 2023, 15, 407. [Google Scholar] [CrossRef]
- Hu, G.; Wang, T.; Wan, M.; Bao, W.; Zeng, W. UAV remote sensing monitoring of pine forest diseases based on improved Mask R-CNN. Int. J. Remote Sens. 2022, 43, 1274–1305. [Google Scholar] [CrossRef]
- Izzudin, M.A.; Hamzah, A.; Nisfariza, M.N.; Idris, A.S. Analysis of Multispectral Imagery from Unmanned Aerial Vehicle (UAV) using Oject-Based Image Analysis for Detection of Ganoderma Disease in Oil Palm. J. Oil Palm Res. 2020, 32, 497–508. [Google Scholar] [CrossRef]
- Junttila, S.; Näsi, R.; Koivumäki, N.; Imangholiloo, M.; Saarinen, N.; Raisio, J.; Holopainen, M.; Hyyppä, H.; Hyyppä, J.; Lyytikäinen-Saarenmaa, P.; et al. Multispectral Imagery Provides Benefits for Mapping Spruce Tree Decline Due to Bark Beetle Infestation When Acquired Late in the Season. Remote Sens. 2022, 14, 909. [Google Scholar] [CrossRef]
- Lim, W.; Choi, K.; Cho, W.; Chang, B.; Ko, D.W. Efficient dead pine tree detecting method in the Forest damaged by pine wood nematode (Bursaphelenchus xylophilus) through utilizing unmanned aerial vehicles and deep learning-based object detection techniques. For. Sci. Technol. 2022, 18, 36–43. [Google Scholar] [CrossRef]
- Ma, L.; Huang, X.; Hai, Q.; Gang, B.; Tong, S.; Bao, Y.; Dashzebeg, G.; Nanzad, T.; Dorjsuren, A.; Enkhnasan, D.; et al. Model-Based Identification of Larix sibirica Ledeb. Damage Caused by Erannis jacobsoni Djak. Based on UAV Multispectral Features and Machine Learning. Forests 2022, 13, 2104. [Google Scholar] [CrossRef]
- Minařík, R.; Langhammer, J.; Lendzioch, T. Detection of Bark Beetle Disturbance at Tree Level Using UAS Multispectral Imagery and Deep Learning. Remote Sens. 2021, 13, 4768. [Google Scholar] [CrossRef]
- Pan, J.; Lin, J.; Xie, T. Exploring the Potential of UAV-Based Hyperspectral Imagery on Pine Wilt Disease Detection: Influence of Spatio-Temporal Scales. Remote Sens. 2023, 15, 2281. [Google Scholar] [CrossRef]
- Pulakkatu-thodi, I.; Dzurisin, J.; Follett, P. Evaluation of macadamia felted coccid (Hemiptera: Eriococcidae) damage and cultivar susceptibility using imagery from a small unmanned aerial vehicle (sUAV), combined with ground truthing. Pest Manag. Sci. 2022, 78, 4533–4543. [Google Scholar] [CrossRef]
- Sandino, J.; Pegg, G.; Gonzalez, F.; Smith, G. Aerial Mapping of Forests Affected by Pathogens Using UAVs, Hyperspectral Sensors, and Artificial Intelligence. Sensors 2018, 18, 944. [Google Scholar] [CrossRef] [PubMed]
- Trang, N.H. Evaluation And Identification Of Bark Beetle-Induced Forest Degradation Using RGB Acquired UAV Images And Machine Learning Techniques. Ph.D. Thesis, Iwate University, Morioka, Japan, 2022. [Google Scholar] [CrossRef]
- Turkulainen, E. Comparison of Deep Neural Networks in Classification of Spruce Trees Damaged by the Bark Beetle Using UAS RGB, Multi- and Hyperspectral Imagery. Master’s Thesis, School of Science, Aalto University, Helsinki, Finland, 2023. [Google Scholar]
- Wu, D.; Yu, L.; Yu, R.; Zhou, Q.; Li, J.; Zhang, X.; Ren, L.; Luo, Y. Detection of the Monitoring Window for Pine Wilt Disease Using Multi-Temporal UAV-Based Multispectral Imagery and Machine Learning Algorithms. Remote Sens. 2023, 15, 444. [Google Scholar] [CrossRef]
- Wu, Z.; Jiang, X. Extraction of Pine Wilt Disease Regions Using UAV RGB Imagery and Improved Mask R-CNN Models Fused with ConvNeXt. Forests 2023, 14, 1672. [Google Scholar] [CrossRef]
- Yu, R.; Huo, L.; Huang, H.; Yuan, Y.; Gao, B.; Liu, Y.; Yu, L.; Li, H.; Yang, L.; Ren, L.; et al. Early detection of pine wilt disease tree candidates using time-series of spectral signatures. Front. Plant Sci. 2022, 13, 1000093. [Google Scholar] [CrossRef]
- Yu, R.; Ren, L.; Luo, Y. Early detection of pine wilt disease in Pinus tabuliformis in North China using a field portable spectrometer and UAV-based hyperspectral imagery. For. Ecosyst. 2021, 8, 44. [Google Scholar] [CrossRef]
- Yu, R.; Luo, Y.; Li, H.; Yang, L.; Huang, H.; Yu, L.; Ren, L. Three-Dimensional Convolutional Neural Network Model for Early Detection of Pine Wilt Disease Using UAV-Based Hyperspectral Images. Remote Sens. 2021, 13, 4065. [Google Scholar] [CrossRef]
- Yu, R.; Luo, Y.; Zhou, Q.; Zhang, X.; Wu, D.; Ren, L. Early detection of pine wilt disease using deep learning algorithms and UAV-based multispectral imagery. For. Ecol. Manag. 2021, 497, 119493. [Google Scholar] [CrossRef]
- Zhang, S.; Huang, H.; Huang, Y.; Cheng, D.; Huang, J. A GA and SVM Classification Model for Pine Wilt Disease Detection Using UAV-Based Hyperspectral Imagery. Appl. Sci. 2022, 12, 6676. [Google Scholar] [CrossRef]
- Zhou, Y.; Liu, W.; Bi, H.; Chen, R.; Zong, S.; Luo, Y. A Detection Method for Individual Infected Pine Trees with Pine Wilt Disease Based on Deep Learning. Forests 2022, 13, 1880. [Google Scholar] [CrossRef]
- Zhu, X.; Wang, R.; Shi, W.; Yu, Q.; Li, X.; Chen, X. Automatic Detection and Classification of Dead Nematode-Infested Pine Wood in Stages Based on YOLO v4 and GoogLeNet. Forests 2023, 14, 601. [Google Scholar] [CrossRef]
- Bulut, S.; Günlü, A.; Aksoy, H.; Bolat, F.; Sönmez, M.Y. Integration of field measurements with unmanned aerial vehicle to predict forest inventory metrics at tree and stand scales in natural pure Crimean pine forests. Int. J. Remote Sens. 2024, 45, 3846–3870. [Google Scholar] [CrossRef]
- Conti, L.A.; Barcellos, R.L.; Oliveira, P.; Neto, F.C.N.; Cunha-Lignon, M. Geographic Object-Oriented Analysis of UAV Multispectral Images for Tree Distribution Mapping in Mangroves. Remote Sens. 2025, 17, 1500. [Google Scholar] [CrossRef]
- Zhong, H.; Zhang, Z.; Liu, H.; Wu, J.; Lin, W. Individual Tree Species Identification for Complex Coniferous and Broad-Leaved Mixed Forests Based on Deep Learning Combined with UAV LiDAR Data and RGB Images. Forests 2024, 15, 293. [Google Scholar] [CrossRef]
- Chen, C.; Jing, L.; Li, H.; Tang, Y.; Chen, F.; Tan, B. Using time-series imagery and 3DLSTM model to classify individual tree species. Int. J. Digit. Earth 2024, 17, 2308728. [Google Scholar] [CrossRef]
- Ou, J.; Tian, Y.; Zhang, Q.; Xie, X.; Zhang, Y.; Tao, J.; Lin, J. Coupling UAV Hyperspectral and LiDAR Data for Mangrove Classification Using XGBoost in China’s Pinglu Canal Estuary. Forests 2023, 14, 1838. [Google Scholar] [CrossRef]
- Miao, S.; Zhang, K.F.; Zeng, H.; Liu, J. AI-Based Tree Species Classification Using Pseudo Tree Crown Derived From UAV Imagery. 2024. [Google Scholar] [CrossRef]
- Kulhandjian, H.; Irineo, B.; Sales, J.; Kulhandjian, M. Low-Cost Tree Health Categorization and Localization Using Drones and Machine Learning. In Proceedings of the 2024 International Conference on Computing, Networking and Communications (ICNC), Big Island, HI, USA, 19–22 February 2024; pp. 296–300. [Google Scholar] [CrossRef]
- Dietenberger, S.; Mueller, M.M.; Stöcker, B.; Dubois, C.; Arlaud, H.; Adam, M.; Hese, S.; Meyer, H.; Thiel, C. Accurate Mapping of Downed Deadwood in a Dense Deciduous Forest Using UAV-SfM Data and Deep Learning. Remote Sens. 2025, 17, 1610. [Google Scholar] [CrossRef]
- Xiong, Y.; Zeng, X.; Lai, W.; Liao, J.; Chen, Y.; Zhu, M.; Huang, K. Detecting and Mapping Individual Fruit Trees in Complex Natural Environments via UAV Remote Sensing and Optimized YOLOv5. IEEE J. Sel. Top. Appl. Earth Obs. Remote Sens. 2024, 17, 7554–7576. [Google Scholar] [CrossRef]
- Sánchez-Vega, J.A.; Silva-López, J.O.; Lopez, R.S.; Medina-Medina, A.J.; Tuesta-Trauco, K.M.; Rivera-Fernandez, A.S.; Silva-Melendez, T.B.; Oliva-Cruz, M.; Barboza, E.; da Silva Junior, C.A.; et al. Automatic Detection of Ceroxylon Palms by Deep Learning in a Protected Area in Amazonas (NW Peru). Forests 2025, 16, 1061. [Google Scholar] [CrossRef]
- Jarahizadeh, S.; Salehi, B. Deep Learning Analysis of UAV Lidar Point Cloud for Individual Tree Detecting. In Proceedings of the IGARSS 2024—2024 IEEE International Geoscience and Remote Sensing Symposium, Athens, Greece, 7–12 July 2024; pp. 9953–9956. [Google Scholar] [CrossRef]
- Ameslek, O.; Zahir, H.; Mitro, S.; Bachaoui, E.M. Identification and Mapping of Individual Trees from Unmanned Aerial Vehicle Imagery Using an Object-Based Convolutional Neural Network. Remote Sens. Earth Syst. Sci. 2024, 7, 172–182. [Google Scholar] [CrossRef]
- Zhang, Z.; Li, Y.; Cao, Y.; Wang, Y.; Guo, X.; Hao, X. MTSC-Net: A Semi-Supervised Counting Network for Estimating the Number of Slash pine New Shoots. Plant Phenomics 2024, 6, 0228. [Google Scholar] [CrossRef]
- Lv, L.; Zhao, Y.; Li, X.; Yu, J.; Song, M.; Huang, L.; Mao, F.; Du, H. UAV-Based Intelligent Detection of Individual Trees in Moso Bamboo Forests With Complex Canopy Structure. IEEE J. Sel. Top. Appl. Earth Obs. Remote Sens. 2024, 17, 11915–11930. [Google Scholar] [CrossRef]
- Persson, D. Tree Crown Detection Using Machine Learning: A Study on Using the DeepForest Deep-Learning Model for Tree Crown Detection in Drone-Captured Aerial Footage; KTH Royal Institute of Technology: Stockholm, Sweden, 2024. [Google Scholar]
- Zhang, S.; Cui, Y.; Zhou, Y.; Dong, J.; Li, W.; Liu, B.; Dong, J. A Mapping Approach for Eucalyptus Plantations Canopy and Single Tree Using High-Resolution Satellite Images in Liuzhou, China. IEEE Trans. Geosci. Remote Sens. 2023, 61, 1–13. [Google Scholar] [CrossRef]
- Arce, L.S.D.; Osco, L.P.; dos Santos de Arruda, M.; Furuya, D.E.G.; Ramos, A.P.M.; Aoki, C.; Pott, A.; Fatholahi, S.; Li, J.; de Araújo, F.F.; et al. Mauritia flexuosa palm trees airborne mapping with deep convolutional neural network. Sci. Rep. 2021, 11, 19619. [Google Scholar] [CrossRef] [PubMed]
- Bennett, L.; Wilson, B.; Selland, S.; Qian, L.; Wood, M.; Zhao, H.; Boisvert, J. Image to attribute model for trees (ITAM-T): Individual tree detection and classification in Alberta boreal forest for wildland fire fuel characterization. Int. J. Remote Sens. 2022, 43, 1848–1880. [Google Scholar] [CrossRef]
- Cabrera-Ariza, A.M.; Lara-Gómez, M.A.; Santelices-Moya, R.E.; Meroño de Larriva, J.E.; Mesas-Carrascosa, F.J. Individualization of Pinus radiata Canopy from 3D UAV Dense Point Clouds Using Color Vegetation Indices. Sensors 2022, 22, 1331. [Google Scholar] [CrossRef] [PubMed]
- Csillik, O.; Cherbini, J.; Johnson, R.; Lyons, A.; Kelly, M. Identification of Citrus Trees from Unmanned Aerial Vehicle Imagery Using Convolutional Neural Networks. Drones 2018, 2, 39. [Google Scholar] [CrossRef]
- Han, P.; Ma, C.; Chen, J.; Chen, L.; Bu, S.; Xu, S.; Zhao, Y.; Zhang, C.; Hagino, T. Fast Tree Detection and Counting on UAVs for Sequential Aerial Images with Generating Orthophoto Mosaicing. Remote Sens. 2022, 14, 4113. [Google Scholar] [CrossRef]
- Kestur, R.; Kulkarni, A.; Bhaskar, R.; Sreenivasa, P.; Sri, D.D.; Choudhary, A.; Prabhu, B.V.B.; Anand, G.; Narasipura, O. MangoGAN: A general adversarial network-based deep learning architecture for mango tree crown detection. J. Appl. Remote Sens. 2022, 16, 014527. [Google Scholar] [CrossRef]
- La Rosa, L.E.C.; Zortea, M.; Gemignani, B.H.; Oliveira, D.A.B.; Feitosa, R.Q. FCRN-Based Multi-Task Learning for Automatic Citrus Tree Detection From UAV Images. In Proceedings of the 2020 IEEE Latin American GRSS & ISPRS Remote Sensing Conference (LAGIRS), Santiago, Chile, 22–26 March 2020; pp. 403–408. [Google Scholar] [CrossRef]
- Luo, M.; Tian, Y.; Zhang, S.; Huang, L.; Wang, H.; Liu, Z.; Yang, L. Individual Tree Detection in Coal Mine Afforestation Area Based on Improved Faster RCNN in UAV RGB Images. Remote Sens. 2022, 14, 5545. [Google Scholar] [CrossRef]
- Lou, X.; Huang, Y.; Fang, L.; Huang, S.; Gao, H.; Yang, L.; Weng, Y.; Hung, I.K. Measuring loblolly pine crowns with drone imagery through deep learning. J. For. Res. 2022, 33, 227–238. [Google Scholar] [CrossRef]
- Miraki, M.; Sohrabi, H.; Fatehi, P. Citrus trees identification and trees stress detection based on spectral data derived from UAVs. Res. Hortic. Sci. 2022, 1, 27–40. [Google Scholar] [CrossRef]
- Miyoshi, G.T.; Arruda, M.d.S.; Osco, L.P.; Marcato Junior, J.; Gonçalves, D.N.; Imai, N.N.; Tommaselli, A.M.G.; Honkavaara, E.; Gonçalves, W.N. A Novel Deep Learning Method to Identify Single Tree Species in UAV-Based Hyperspectral Images. Remote Sens. 2020, 12, 1294. [Google Scholar] [CrossRef]
- Mohan, M.; Leite, R.V.; Broadbent, E.N.; Jaafar, W.S.W.M.; Srinivasan, S.; Bajaj, S.; Corte, A.P.D.; do Amaral, C.H.; Gopan, G.; Saad, S.N.M.; et al. Individual tree detection using UAV-lidar and UAV-SfM data: A tutorial for beginners. Open Geosci. 2021, 13, 1028–1039. [Google Scholar] [CrossRef]
- Osco, L.P.; dos Santos de Arruda, M.; Marcato Junior, J.; da Silva, N.B.; Ramos, A.P.M.; Moryia, É.A.S.; Imai, N.N.; Pereira, D.R.; Creste, J.E.; Matsubara, E.T.; et al. A convolutional neural network approach for counting and geolocating citrus-trees in UAV multispectral imagery. ISPRS J. Photogramm. Remote Sens. 2020, 160, 97–106. [Google Scholar] [CrossRef]
- Salamí, E.; Gallardo, A.; Skorobogatov, G.; Barrado, C. On-the-Fly Olive Tree Counting Using a UAS and Cloud Services. Remote Sens. 2019, 11, 316. [Google Scholar] [CrossRef]
- Wu, Z.; Jiang, M.; Li, H.; Shen, Y.; Song, J.; Zhong, X.; Ye, Z. Urban carbon stock estimation based on deep learning and UAV remote sensing: A case study in Southern China. All Earth 2023, 35, 272–286. [Google Scholar] [CrossRef]
- Xia, K.; Wang, H.; Yang, Y.; Du, X.; Feng, H. Automatic Detection and Parameter Estimation of Ginkgo biloba in Urban Environment Based on RGB Images. J. Sens. 2021, 2021, 1–12. [Google Scholar] [CrossRef]
- Zhang, L.; Lin, H.; Wang, F. Individual Tree Detection Based on High-Resolution RGB Images for Urban Forestry Applications. IEEE Access 2022, 10, 46589–46598. [Google Scholar] [CrossRef]
- Akinbiola, S.; Salami, A.T.; Awotoye, O.O.; Popoola, S.O.; Olusola, J.A. Application of UAV photogrammetry for the assessment of forest structure and species network in the tropical forests of Southern Nigeria. Geocarto Int. 2023, 38, 2190621. [Google Scholar] [CrossRef]
- Duan, X.; Chang, M.; Wu, G.; Situ, S.; Zhu, S.; Zhang, Q.; Huangfu, Y.; Wang, W.; Chen, W.; Yuan, B.; et al. Estimation of biogenic volatile organic compound (BVOC) emissions in forest ecosystems using drone-based lidar, photogrammetry, and image recognition technologies. Atmos. Meas. Tech. 2024, 17, 4065–4079. [Google Scholar] [CrossRef]
- Gyawali, A.; Aalto, M.; Ranta, T. Tree Species Detection and Enhancing Semantic Segmentation Using Machine Learning Models with Integrated Multispectral Channels from PlanetScope and Digital Aerial Photogrammetry in Young Boreal Forest. Remote Sens. 2025, 17, 1811. [Google Scholar] [CrossRef]
- Jo, W.K.; Park, J.H. High-Accuracy Tree Type Classification in Urban Forests Using Drone-Based RGB Imagery and Optimized SVM. Korean J. Remote Sens. 2025, 41, 209–223. [Google Scholar] [CrossRef]
- Gahrouei, O.R.; Côté, J.F.; Bournival, P.; Giguère, P.; Béland, M. Comparison of Deep and Machine Learning Approaches for Quebec Tree Species Classification Using a Combination of Multispectral and LiDAR Data. Can. J. Remote Sens. 2024, 50, 2359433. [Google Scholar] [CrossRef]
- Hooshyar, M.; Li, Y.S.; Chun Tang, W.; Chen, L.W.; Huang, Y.M. Economic Fruit Trees Recognition in Hillsides: A CNN-Based Approach Using Enhanced UAV Imagery. IEEE Access 2024, 12, 61991–62005. [Google Scholar] [CrossRef]
- Miao, S.; Zhang, K.F.; Zeng, H.; Liu, J. Improving Artificial-Intelligence-Based Individual Tree Species Classification Using Pseudo Tree Crown Derived from Unmanned Aerial Vehicle Imagery. Remote Sens. 2024, 16, 1849. [Google Scholar] [CrossRef]
- Yang, Y.; Meng, Z.; Zu, J.; Cai, W.; Wang, J.; Su, H.; Yang, J. Fine-Scale Mangrove Species Classification Based on UAV Multispectral and Hyperspectral Remote Sensing Using Machine Learning. Remote Sens. 2024, 16, 3093. [Google Scholar] [CrossRef]
- Pierdicca, R.; Nepi, L.; Mancini, A.; Malinverni, E.S.; Balestra, M. UAV4TREE: DEEP LEARNING-BASED SYSTEM FOR AUTOMATIC CLASSIFICATION OF TREE SPECIES USING RGB OPTICAL IMAGES OBTAINED BY AN UNMANNED AERIAL VEHICLE. ISPRS Ann. Photogramm. Remote Sens. Spatial Inf. Sci. 2023, X-1/W1-2023, 1089–1096. [Google Scholar] [CrossRef]
- Xu, S.; Wang, R.; Shi, W.; Wang, X. Classification of Tree Species in Transmission Line Corridors Based on YOLO v7. Forests 2023, 15, 61. [Google Scholar] [CrossRef]
- Chen, X.; Shen, X.; Cao, L. Tree Species Classification in Subtropical Natural Forests Using High-Resolution UAV RGB and SuperView-1 Multispectral Imageries Based on Deep Learning Network Approaches: A Case Study within the Baima Snow Mountain National Nature Reserve, China. Remote Sens. 2023, 15, 2697. [Google Scholar] [CrossRef]
- Li, Y.F.; Xu, Z.H.; Hao, Z.B.; Yao, X.; Zhang, Q.; Huang, X.Y.; Li, B.; He, A.Q.; Li, Z.L.; Guo, X.Y. A comparative study of the performances of joint RFE with machine learning algorithms for extracting Moso bamboo (Phyllostachys pubescens) forest based on UAV hyperspectral images. Geocarto Int. 2023, 38, 2207550. [Google Scholar] [CrossRef]
- Imangholiloo, M.; Luoma, V.; Holopainen, M.; Vastaranta, M.; Mäkeläinen, A.; Koivumäki, N.; Honkavaara, E.; Khoramshahi, E. A New Approach for Feeding Multispectral Imagery into Convolutional Neural Networks Improved Classification of Seedlings. Remote Sens. 2023, 15, 5233. [Google Scholar] [CrossRef]
- Egli, S.; Höpke, M. CNN-Based Tree Species Classification Using High Resolution RGB Image Data from Automated UAV Observations. Remote Sens. 2020, 12, 3892. [Google Scholar] [CrossRef]
- Huang, Y.; Wen, X.; Gao, Y.; Zhang, Y.; Lin, G. Tree Species Classification in UAV Remote Sensing Images Based on Super-Resolution Reconstruction and Deep Learning. Remote Sens. 2023, 15, 2942. [Google Scholar] [CrossRef]
- Martins, G.B.; La Rosa, L.E.C.; Happ, P.N.; Filho, L.C.T.C.; Santos, C.J.F.; Feitosa, R.Q.; Ferreira, M.P. Deep learning-based tree species mapping in a highly diverse tropical urban setting. Urban For. Urban Green. 2021, 64, 127241. [Google Scholar] [CrossRef]
- Moura, M.M.; de Oliveira, L.E.S.; Sanquetta, C.R.; Bastos, A.; Mohan, M.; Corte, A.P.D. Towards Amazon Forest Restoration: Automatic Detection of Species from UAV Imagery. Remote Sens. 2021, 13, 2627. [Google Scholar] [CrossRef]
- Quan, Y.; Li, M.; Hao, Y.; Liu, J.; Wang, B. Tree species classification in a typical natural secondary forest using UAV-borne LiDAR and hyperspectral data. GIScience Remote Sens. 2023, 60, 2171706. [Google Scholar] [CrossRef]
- Shi, W.; Liao, X.; Sun, J.; Zhang, Z.; Wang, D.; Wang, S.; Qu, W.; He, H.; Ye, H.; Yue, H.; et al. Optimizing Observation Plans for Identifying Faxon Fir (Abies fargesii var. Faxoniana) Using Monthly Unmanned Aerial Vehicle Imagery. Remote Sens. 2023, 15, 2205. [Google Scholar] [CrossRef]
- Koreň, M.; Scheer, Ľ.; Sedmák, R.; Fabrika, M. Evaluation of tree stump measurement methods for estimating diameter at breast height and tree height. Int. J. Appl. Earth Obs. Geoinf. 2024, 129, 103828. [Google Scholar] [CrossRef]
- Albuquerque, R.W.; Matsumoto, M.H.; Calmon, M.; Ferreira, M.E.; Vieira, D.L.M.; Grohmann, C.H. A protocol for canopy cover monitoring on forest restoration projects using low-cost drones. Open Geosci. 2022, 14, 921–929. [Google Scholar] [CrossRef]
- Nasiri, V.; Darvishsefat, A.A.; Arefi, H.; Griess, V.C.; Sadeghi, S.M.M.; Borz, S.A. Modeling Forest Canopy Cover: A Synergistic Use of Sentinel-2, Aerial Photogrammetry Data, and Machine Learning. Remote Sens. 2022, 14, 1453. [Google Scholar] [CrossRef]
- Solvin, T.M.; Puliti, S.; Steffenrem, A. Use of UAV photogrammetric data in forest genetic trials: Measuring tree height, growth, and phenology in Norway spruce (Picea abies L. Karst.). Scand. J. For. Res. 2020, 35, 322–333. [Google Scholar] [CrossRef]
- Vivar-Vivar, E.D.; Pompa-García, M.; Martínez-Rivas, J.A.; Mora-Tembre, L.A. UAV-Based Characterization of Tree-Attributes and Multispectral Indices in an Uneven-Aged Mixed Conifer-Broadleaf Forest. Remote Sens. 2022, 14, 2775. [Google Scholar] [CrossRef]
- Vasilakos, C.; Verykios, V.S. Burned Olive Trees Identification with a Deep Learning Approach in Unmanned Aerial Vehicle Images. Remote Sens. 2024, 16, 4531. [Google Scholar] [CrossRef]
- Leidemer, T.; Caceres, M.L.L.; Diez, Y.; Ferracini, C.; Tsou, C.Y.; Katahira, M. Evaluation of Temporal Trends in Forest Health Status Using Precise Remote Sensing. Drones 2025, 9, 337. [Google Scholar] [CrossRef]
- Joshi, D.; Witharana, C. Vision Transformer-Based Unhealthy Tree Crown Detection in Mixed Northeastern US Forests and Evaluation of Annotation Uncertainty. Remote Sens. 2025, 17, 1066. [Google Scholar] [CrossRef]
- Tahrupath, K.; Guttila, J. Detecting Weligama Coconut Leaf Wilt Disease in Coconut Using UAV-Based Multispectral Imaging and Object-Based Classification. 2025. [Google Scholar] [CrossRef]
- Kwang, C.S.; Razak, S.F.A.; Yogarayan, S.; Zahisham, M.Z.A.; Tam, T.H.; Noor, M.K.A.M.; Abidin, H. Ganoderma Disease in Oil Palm Trees Using Hyperspectral Imaging and Machine Learning. J. Hum. Earth Future 2025, 6, 67–83. [Google Scholar] [CrossRef]
- Afsar, M.M.; Iqbal, M.S.; Bakhshi, A.D.; Hussain, E.; Iqbal, J. MangiSpectra: A Multivariate Phenological Analysis Framework Leveraging UAV Imagery and LSTM for Tree Health and Yield Estimation in Mango Orchards. Remote Sens. 2025, 17, 703. [Google Scholar] [CrossRef]
- Yin, D.; Cai, Y.; Li, Y.; Yuan, W.; Zhao, Z. Assessment of the Health Status of Old Trees of Platycladus orientalis L. Using UAV Multispectral Imagery. Drones 2024, 8, 91. [Google Scholar] [CrossRef]
- Yuan, B.K.K.; Ling, L.S.; Avtar, R. Oil palm tree health status detection using canopy height model and NDVI. AIP Conf. Proc. 2024, 3240, 020012. [Google Scholar] [CrossRef]
- Anwander, J.; Brandmeier, M.; Paczkowski, S.; Neubert, T.; Paczkowska, M. Evaluating Different Deep Learning Approaches for Tree Health Classification Using High-Resolution Multispectral UAV Data in the Black Forest, Harz Region, and Göttinger Forest. Remote Sens. 2024, 16, 561. [Google Scholar] [CrossRef]
- Johansen, K.; Duan, Q.; Tu, Y.H.; Searle, C.; Wu, D.; Phinn, S.; Robson, A.; McCabe, M.F. Mapping the condition of macadamia tree crops using multi-spectral UAV and WorldView-3 imagery. ISPRS J. Photogramm. Remote Sens. 2020, 165, 28–40. [Google Scholar] [CrossRef]
- Kahsay, A.G. Comparison of Thermal Infrared and Multispectral UAV Imagery for Detecting Pine Trees (Pinus brutia) Health Status in Lefka Ori National Park in West Crete, Greece. Master’s Thesis, University of Twente, Enschede, The Netherlands, 2022. [Google Scholar]
- Hao, X.; Cao, Y.; Zhang, Z.; Tomasetto, F.; Yan, W.; Xu, C.; Luan, Q.; Li, Y. CountShoots: Automatic Detection and Counting of Slash Pine New Shoots Using UAV Imagery. Plant Phenomics 2023, 5, 0065. [Google Scholar] [CrossRef]
- Qiu, S.; Zhu, X.; Zhang, Q.; Tao, X.; Zhou, K. Enhanced Estimation of Crown-Level Leaf Dry Biomass of Ginkgo Saplings Based on Multi-Height UAV Imagery and Digital Aerial Photogrammetry Point Cloud Data. Forests 2024, 15, 1720. [Google Scholar] [CrossRef]
- Juan-Ovejero, R.; Elghouat, A.; Navarro, C.J.; Reyes-Martín, M.P.; Jiménez, M.N.; Navarro, F.B.; Alcaraz-Segura, D.; Castro, J. Estimation of aboveground biomass and carbon stocks of Quercus ilex L. saplings using UAV-derived RGB imagery. Ann. For. Sci. 2023, 80, 44. [Google Scholar] [CrossRef]
- Goswami, A.; Khati, U.; Goyal, I.; Sabir, A.; Jain, S. Automated Stock Volume Estimation Using UAV-RGB Imagery. Sensors 2024, 24, 7559. [Google Scholar] [CrossRef]
- Safonova, A.; Guirado, E.; Maglinets, Y.; Alcaraz-Segura, D.; Tabik, S. Olive Tree Biovolume from UAV Multi-Resolution Image Segmentation with Mask R-CNN. Sensors 2021, 21, 1617. [Google Scholar] [CrossRef] [PubMed]
- Thanh, H.N.; Le, T.H.; Van, D.N.; Thuy, Q.H.; Kim, A.N.; Duc, H.L.; Van, D.P.; Trong, T.P.; Van, P.T. Forest cover change mapping based on Deep Neuron Network, GIS, and High-resolution Imagery. Vietnam. J. Earth Sci. 2025, 47, 151–175. [Google Scholar] [CrossRef]
- Carneiro, G.A.; Santos, J.; Sousa, J.J.; Cunha, A.; Pádua, L. Chestnut Burr Segmentation for Yield Estimation Using UAV-Based Imagery and Deep Learning. Drones 2024, 8, 541. [Google Scholar] [CrossRef]
- Wang, F.; Song, L.; Liu, X.; Zhong, S.; Wang, J.; Zhang, Y.; Wu, Y. Forest stand spectrum reconstruction using spectrum spatial feature gathering and multilayer perceptron. Front. Plant Sci. 2023, 14, 1223366. [Google Scholar] [CrossRef] [PubMed]
- Jayathunga, S.; Pearse, G.D.; Watt, M.S. Unsupervised Methodology for Large-Scale Tree Seedling Mapping in Diverse Forestry Settings Using UAV-Based RGB Imagery. Remote Sens. 2023, 15, 5276. [Google Scholar] [CrossRef]
- Sos, J.; Penglase, K.; Lewis, T.; Srivastava, P.K.; Singh, H.; Srivastava, S.K. Mapping and monitoring of vegetation regeneration and fuel under major transmission power lines through image and photogrammetric analysis of drone-derived data. Geocarto Int. 2023, 38, 2280597. [Google Scholar] [CrossRef]
- Hobart, M.; Pflanz, M.; Tsoulias, N.; Weltzien, C.; Kopetzky, M.; Schirrmann, M. Fruit Detection and Yield Mass Estimation from a UAV Based RGB Dense Cloud for an Apple Orchard. Drones 2025, 9, 60. [Google Scholar] [CrossRef]
- Oswald, D.; Pourreza, A.; Chakraborty, M.; Khalsa, S.D.S.; Brown, P.H. 3D radiative transfer modeling of almond canopy for nitrogen estimation by hyperspectral imaging. Precis. Agric. 2025, 26, 12. [Google Scholar] [CrossRef]
- Chen, H.; Cao, J.; An, J.; Xu, Y.; Bai, X.; Xu, D.; Li, W. Research on Walnut (Juglans regia L.) Yield Prediction Based on a Walnut Orchard Point Cloud Model. Agriculture 2025, 15, 775. [Google Scholar] [CrossRef]
- Lu, X.; Li, W.; Xiao, J.; Zhu, H.; Yang, D.; Yang, J.; Xu, X.; Lan, Y.; Zhang, Y. Inversion of Leaf Area Index in Citrus Trees Based on Multi-Modal Data Fusion from UAV Platform. Remote Sens. 2023, 15, 3523. [Google Scholar] [CrossRef]
- Paul, S.; Poliyapram, V.; İmamoğlu, N.; Uto, K.; Nakamura, R.; Kumar, D.N. Canopy Averaged Chlorophyll Content Prediction of Pear Trees Using Convolutional Autoencoder on Hyperspectral Data. IEEE J. Sel. Top. Appl. Earth Obs. Remote Sens. 2020, 13, 1426–1437. [Google Scholar] [CrossRef]
Disclaimer/Publisher’s Note: The statements, opinions and data contained in all publications are solely those of the individual author(s) and contributor(s) and not of MDPI and/or the editor(s). MDPI and/or the editor(s) disclaim responsibility for any injury to people or property resulting from any ideas, methods, instructions or products referred to in the content. |
© 2025 by the authors. Licensee MDPI, Basel, Switzerland. This article is an open access article distributed under the terms and conditions of the Creative Commons Attribution (CC BY) license (https://creativecommons.org/licenses/by/4.0/).