Article

DeepSwinLite: A Swin Transformer-Based Light Deep Learning Model for Building Extraction Using VHR Aerial Imagery

Department of Geomatics Engineering, Gebze Technical University, Gebze 41400, Turkey
*
Author to whom correspondence should be addressed.
Remote Sens. 2025, 17(18), 3146; https://doi.org/10.3390/rs17183146
Submission received: 5 August 2025 / Revised: 9 September 2025 / Accepted: 10 September 2025 / Published: 10 September 2025
(This article belongs to the Special Issue Advances in Deep Learning Approaches: UAV Data Analysis)

Abstract

Accurate extraction of building features from remotely sensed data is essential for supporting research and applications in urban planning, land management, transportation infrastructure development, and disaster monitoring. Despite the prominence of deep learning as the state-of-the-art (SOTA) methodology for building extraction, substantial challenges remain, largely stemming from the diversity of building structures and the complexity of background features. To mitigate these issues, this study introduces DeepSwinLite, a lightweight architecture based on the Swin Transformer, designed to extract building footprints from very high-resolution (VHR) imagery. The model integrates a novel local-global attention module to enhance the interpretation of objects across varying spatial resolutions and facilitate effective information exchange between different feature abstraction levels. It comprises three modules: multi-scale feature aggregation (MSFA), improving recognition across varying object sizes; multi-level feature pyramid (MLFP), fusing detailed and semantic features; and AuxHead, providing auxiliary supervision to stabilize and enhance learning. Experimental evaluations on the Massachusetts and WHU Building Datasets reveal the superior performance of DeepSwinLite architecture when compared to existing SOTA models. On the Massachusetts dataset, the model attained an OA of 92.54% and an IoU of 77.94%, while on the WHU dataset, it achieved an OA of 98.32% and an IoU of 92.02%. Following the correction of errors identified in the Massachusetts ground truth and iterative enhancement, the model’s performance further improved, reaching 94.63% OA and 79.86% IoU. A key advantage of the DeepSwinLite model is its computational efficiency, requiring fewer floating-point operations (FLOPs) and parameters compared to other SOTA models. This efficiency makes the model particularly suitable for deployment in mobile and resource-constrained systems.

1. Introduction

The accurate delineation of building footprints is crucial for numerous fields, including urban planning [1,2,3], land management [4,5], disaster monitoring [6], urban renewal [7], infrastructure management [8], and transportation infrastructure development [9]. Furthermore, precise building footprint extraction significantly contributes to achieving Sustainable Development Goals (SDGs), which enhance urban governance and support evidence-based decision-making [10,11,12]. Advances in automated extraction methodologies facilitate the implementation of more effective urban policies [13,14]. Progress in this field directly supports specific SDGs. Under SDG 11 (“Sustainable Cities and Communities”), accurate building footprint extraction constitutes a fundamental step towards promoting planned and sustainable urban development. Similarly, spatial analyses aligned with SDG 13 (“Climate Action”) hold significant importance for identifying buildings located within disaster-prone areas, such as those susceptible to landslides, floods, and wildfires [15]. Such analyses provide essential data for resource allocation, crisis management, and mitigation strategies.
Semantic segmentation leveraging deep learning has emerged as a cornerstone in the recent progress observed across the field of computer vision [16], achieving significant success in image classification tasks [17]. However, applying semantic segmentation models developed for RGB images to remote sensing (RS) data presents significant challenges. RGB imagery often suffers from limited spectral diversity and blurred object boundaries [18], which can lead to less transparent and consistent feature representations [19]. Consequently, the development of specialized segmentation algorithms tailored to the unique characteristics of RS imagery is essential for highly accurate building footprint extraction [20]. Early computer vision techniques employed spectral features, edge detection, and thresholding techniques for building extraction. These approaches, however, proved to be problematic, particularly in complex urban environments characterized by significant variations in building structure, color, and size. Subsequently, machine learning techniques were applied to segmentation tasks, although limitations in generalizability across large datasets and insufficient accuracy levels were frequently reported. More recently, prominent deep learning (DL) architectures, including U-Net [21], DeepLabV3+ [22], SegFormer [23], PAN [24], MANet [25], LinkNet [26], and UperNet [27], have been employed for building extraction.
In recent years, the applicability of Transformer architecture, originally introduced by [28], to building extraction applications has been studied. More recently, the Swin Transformer has emerged as an efficient architectural design for image processing applications. The model has demonstrated superior performance across diverse domains, including building footprint extraction, owing to its scalable design enabled by the shifted window mechanism [29]. It is particularly effective in overcoming the receptive field limitations of CNN-based models. As a result, the deep learning architecture demonstrates enhanced proficiency in recognizing and modeling large-scale spatial structures. For instance, SDSC-UNet demonstrated high accuracy in building segmentation by effectively utilizing multi-scale feature representations [30]. In a study by [29], the Swin Transformer was integrated into the U-Net architecture, resulting in improved performance. To be specific, the model enhanced its performance by extracting large building structures by using patch merging and self-attention mechanisms. It can capture building connectivity more effectively than CNN-based models. On the other hand, the MAFF-HRNet incorporates a multi-scale attention mechanism to protect building boundaries [31]. Ref. [32] designed window-based cascaded multi-head self-attention mechanisms. Benefitting from Swin Transformer-based models integrated with several modules, this study proposes a new model, called DeepSwinLite, to automatically extract building footprints from aerial imagery, aiming to reduce the computational cost while improving segmentation accuracy. Despite recent advances in DL, building footprint extraction from VHR imagery remains a challenging task due to the presence of complex urban structure, occluded buildings, and background heterogeneity. The extraction of buildings from VHR remote sensing data is hindered by their inherently low inter-class variance and elevated intra-class variance [33], resulting from their complex structural forms, scale variability, and diverse visual textures. In addition, the presence of natural elements such as trees and shadows introduces further ambiguity. These factors collectively render the task of precise building delineation through automated methods highly challenging [34]. Moreover, methodologies developed for occluded building detection frequently rely on additional data sources, including LiDAR or multi-view imagery, thereby elevating extraction expenses [35]. Major contributions of this research can be given as follows:
i.
Novel Architecture: We introduced a Swin Transformer-based network with three modules: MLFP fuses multi-level features, MSFA aggregates multi-scale context, and AuxHead provides auxiliary supervision to stabilize training. Together, they preserve spatial detail and improve building-boundary segmentation in VHR imagery.
ii.
Comprehensive Benchmarking: We conducted DeepSwinLite against both classical baselines (U-Net, DeepLabV3+, SegFormer) and recent SOTA models (LiteST-Net, SCTM, MAFF-HRNet) on the Massachusetts and WHU datasets, considering both accuracy and computational efficiency (parameters, FLOPs).
iii.
Refined Dataset and Reproducibility: We identified and corrected annotation errors in the original Massachusetts dataset and released the refined version with source code to ensure reproducibility and foster further research.

2. Datasets

To comprehensively assess the robustness and generalization capacity of the proposed model, two widely recognized benchmark datasets, the WHU Building Dataset and the Massachusetts Building Dataset, were selected that offer complementary features. The selection of these datasets was deliberate, based on their widespread use in the building footprint extraction literature and their pronounced differences in spatial resolution, annotation detail, geographic extent, and urban complexity. This enables a more rigorous and balanced evaluation of the performance of the model in a range of real-world scenarios. Detailed descriptions of each dataset are provided in the following sections.
Containing both high-resolution aerial imagery and aligned mask annotations, the WHU Building Dataset, captured in 2012, serves as a valuable resource for building extraction tasks [36]. The dataset covering an area of approximately 450 km2 was obtained from aerial images over Christchurch, New Zealand. The spatial resolutions of aerial images ranged from 0.3 m to 2.5 m, which were resampled to 0.3 m. This study employed a dataset consisting of aerial imagery from diverse global cities to provide evaluations for model performances due to its coverage of challenging regions with shadows. The dataset consists of 8189 image tiles (patch size: 512 × 512 pixels), which were divided into training (4736), validation (1036), and testing (2416).
The Massachusetts building dataset includes a total of 151 aerial images of the city of Boston (MA, USA), captured around 2011, covering a diverse collection of buildings exhibiting varied sizes and architectural types, spanning both urban and suburban areas to ensure comprehensive representativeness [37]. Each image has a resolution of 1500 × 1500 pixels, corresponding to a spatial coverage of approximately 2.25 km2 per image. The dataset, covering approximately 340 km2, was partitioned into three subsets (training, validation, and testing) for model development and evaluation. Before training the DL models, several pre-processing steps were performed to use the dataset for building footprint detection. Initially, all images were cropped into 512 × 512 patches with a half overlap, which resulted in the appearance of white (empty) regions. To prevent these regions from affecting the training process, the image patches containing white pixels and their corresponding labels were removed.
In addition to leveraging the Massachusetts dataset as a widely recognized benchmark, particular attention was paid to addressing its known labeling inconsistencies, which could negatively impact model training and evaluation. In other words, the decision to refine the Massachusetts Building Dataset stems from the presence of systematic and significant annotation errors that could adversely affect the training, evaluation, and generalization capabilities of deep learning models. The Massachusetts dataset, created using vector data from the OpenStreetMap (OSM) platform, contained various types of labeling errors. Since the OSM data are continuously updated by volunteer contributors, manual data entry may bring the risk of inconsistency and inaccuracy [38]. Also, the resolution of the images exacerbates labeling errors by contributing to problems such as blurred buildings [39]. These errors were carefully analyzed and categorized into six main groups: mislabeling, inclusion of non-building elements, false positive estimates, missing labels, spatial misalignment, and object contamination (Figure 1). The red lines in the figure show the building boundaries in the dataset. The first type of error (Figure 1a) involves the incorrect assignment of labels to boundaries of building footprints, while the second error is related to building labels that were assigned to courtyards or other open areas (Figure 1b).
For accurate ground reference data, building labels should only cover the actual structural boundaries. Complex building structures, including those with internal courtyards, are particularly prone to such errors. The third type of error, which includes false positive estimates, occurs when building footprint labels are mistakenly applied to areas that do not actually contain any structures (Figure 1c). The fourth type of error (missing labels) arises when buildings were clearly visible in the images, but their borders were not indicated in the reference data (Figure 1d). The fifth error, indicating spatial misalignment problems, is caused by the deviation of building labels from their true positions and the misrepresentation of footprints (Figure 1e). The final error, which can be described as object contamination, refers to the inclusion of adjacent elements (i.e., trees or soil) within building labels during annotation (Figure 1f). A thorough search and updating process was conducted on the dataset to resolve these problems. Since high-quality ground truth is essential for supervised learning, a systematic manual correction was conducted. This refinement, as an original contribution of the study, enabled a more reliable evaluation of model performance under improved label conditions.

3. Methodology

A novel DL network (DeepSwinLite) was developed to improve the prediction accuracy in building footprint detection by integrating the Swin Transformer backbone, MLFP module, MSFA module, decoder, and AuxHead module (Figure 2). With the successful integration of these modules, the proposed model can better extract contextual and spatial information from the dataset, increasing the segmentation accuracy of building footprints. The Swin Transformer is used as a backbone to provide more effective feature extraction from RS images. By employing a shifted window mechanism, it can effectively capture long-range dependencies, resulting in more comprehensive spatial feature representations. Integration of MSFA and MLFP modules into the proposed model provides improvement in the segmentation performance by enabling efficient processing of the low- and high-level features. On the other hand, the Auxhead module is applied during DL model training to boost the model’s learning capacity and reach a balanced gradient flow. Finally, the decoder enables the generation of model output through upsampling operations. It also improves the precision of the segmentation output by reducing the loss of detail. Integrating these components, the DeepSwinLite model is presented as an optimized architecture with robust generalization capabilities across scales for implementation in building footprint extraction tasks.

3.1. Architecture Overview

3.1.1. Swin Transformer Backbone

The encoder of the proposed DeepSwinLite model is built on the Swin Transformer architecture [32], which provides a hierarchical representation of the input images through shifted window-based multi-head self-attention mechanisms. Conventional CNN-based encoders primarily rely on local receptive fields, which can limit their ability to capture global context. In contrast, the Swin Transformer efficiently models both local and global dependencies, making it highly suitable for semantic segmentation tasks. In practice, the input image is first segmented into non-overlapping patches using a patch embedding layer. These patches are then processed through four sequential Swin Transformer stages, each consisting of multiple transformer blocks followed by a patch merge layer. This hierarchical design enables the model to extract features at multiple scales with increasing receptive fields, which is crucial for capturing both fine-grained building details and larger contextual structures in high-resolution aerial imagery. The output feature maps from each Swin stage are then passed to the MLFP module for multi-level fusion.

3.1.2. Multi-Level Feature Pyramid (MLFP)

This module is used to integrate features at multiple scales while minimizing the loss of spatial detail. It is composed of four essential components: lateral convolutions, dilated convolutions, a feature fusion layer, and an output convolution layer (Figure 3).
The first stage involves applying lateral 1 × 1 convolutional layers to standardize channel dimensions across feature maps of varying resolutions:
F i l a t = W 1 × 1 i × F i  
These normalized feature maps are subsequently fused in a top-down manner. It allows the preservation of fine-grained details while facilitating effective information flow across different scales. F i a g g refers to a feature map that is combined at a certain level, where i indicates the level:
F i a g g = F i l a t + Upsample F i + 1 a g g
By utilizing dilated convolutions with varying rates r { 1 , 2 , 3 } , the model processes aggregated features to acquire a broader spatial perspective, thereby improving its effectiveness in multi-scale object detection:
F d i l = r = 1 3 ReLU BN W 3 × 3 , d i l = r r × F a g g
The multi-scale features are subsequently integrated within the feature fusion layer, followed by a 1 × 1 convolution to reduce the channel dimensionality:
F f u s e d = W 1 × 1 f u s e × F d i l
Finally, a 3 × 3 convolutional layer is applied to generate the output feature map:
F o u t = W 3 × 3 o u t × F f u s e d
This structural design facilitates the simultaneous exploitation of detailed spatial information and rich semantic features, contributing to superior segmentation results.

3.1.3. Multi-Scale Feature Aggregation (MSFA)

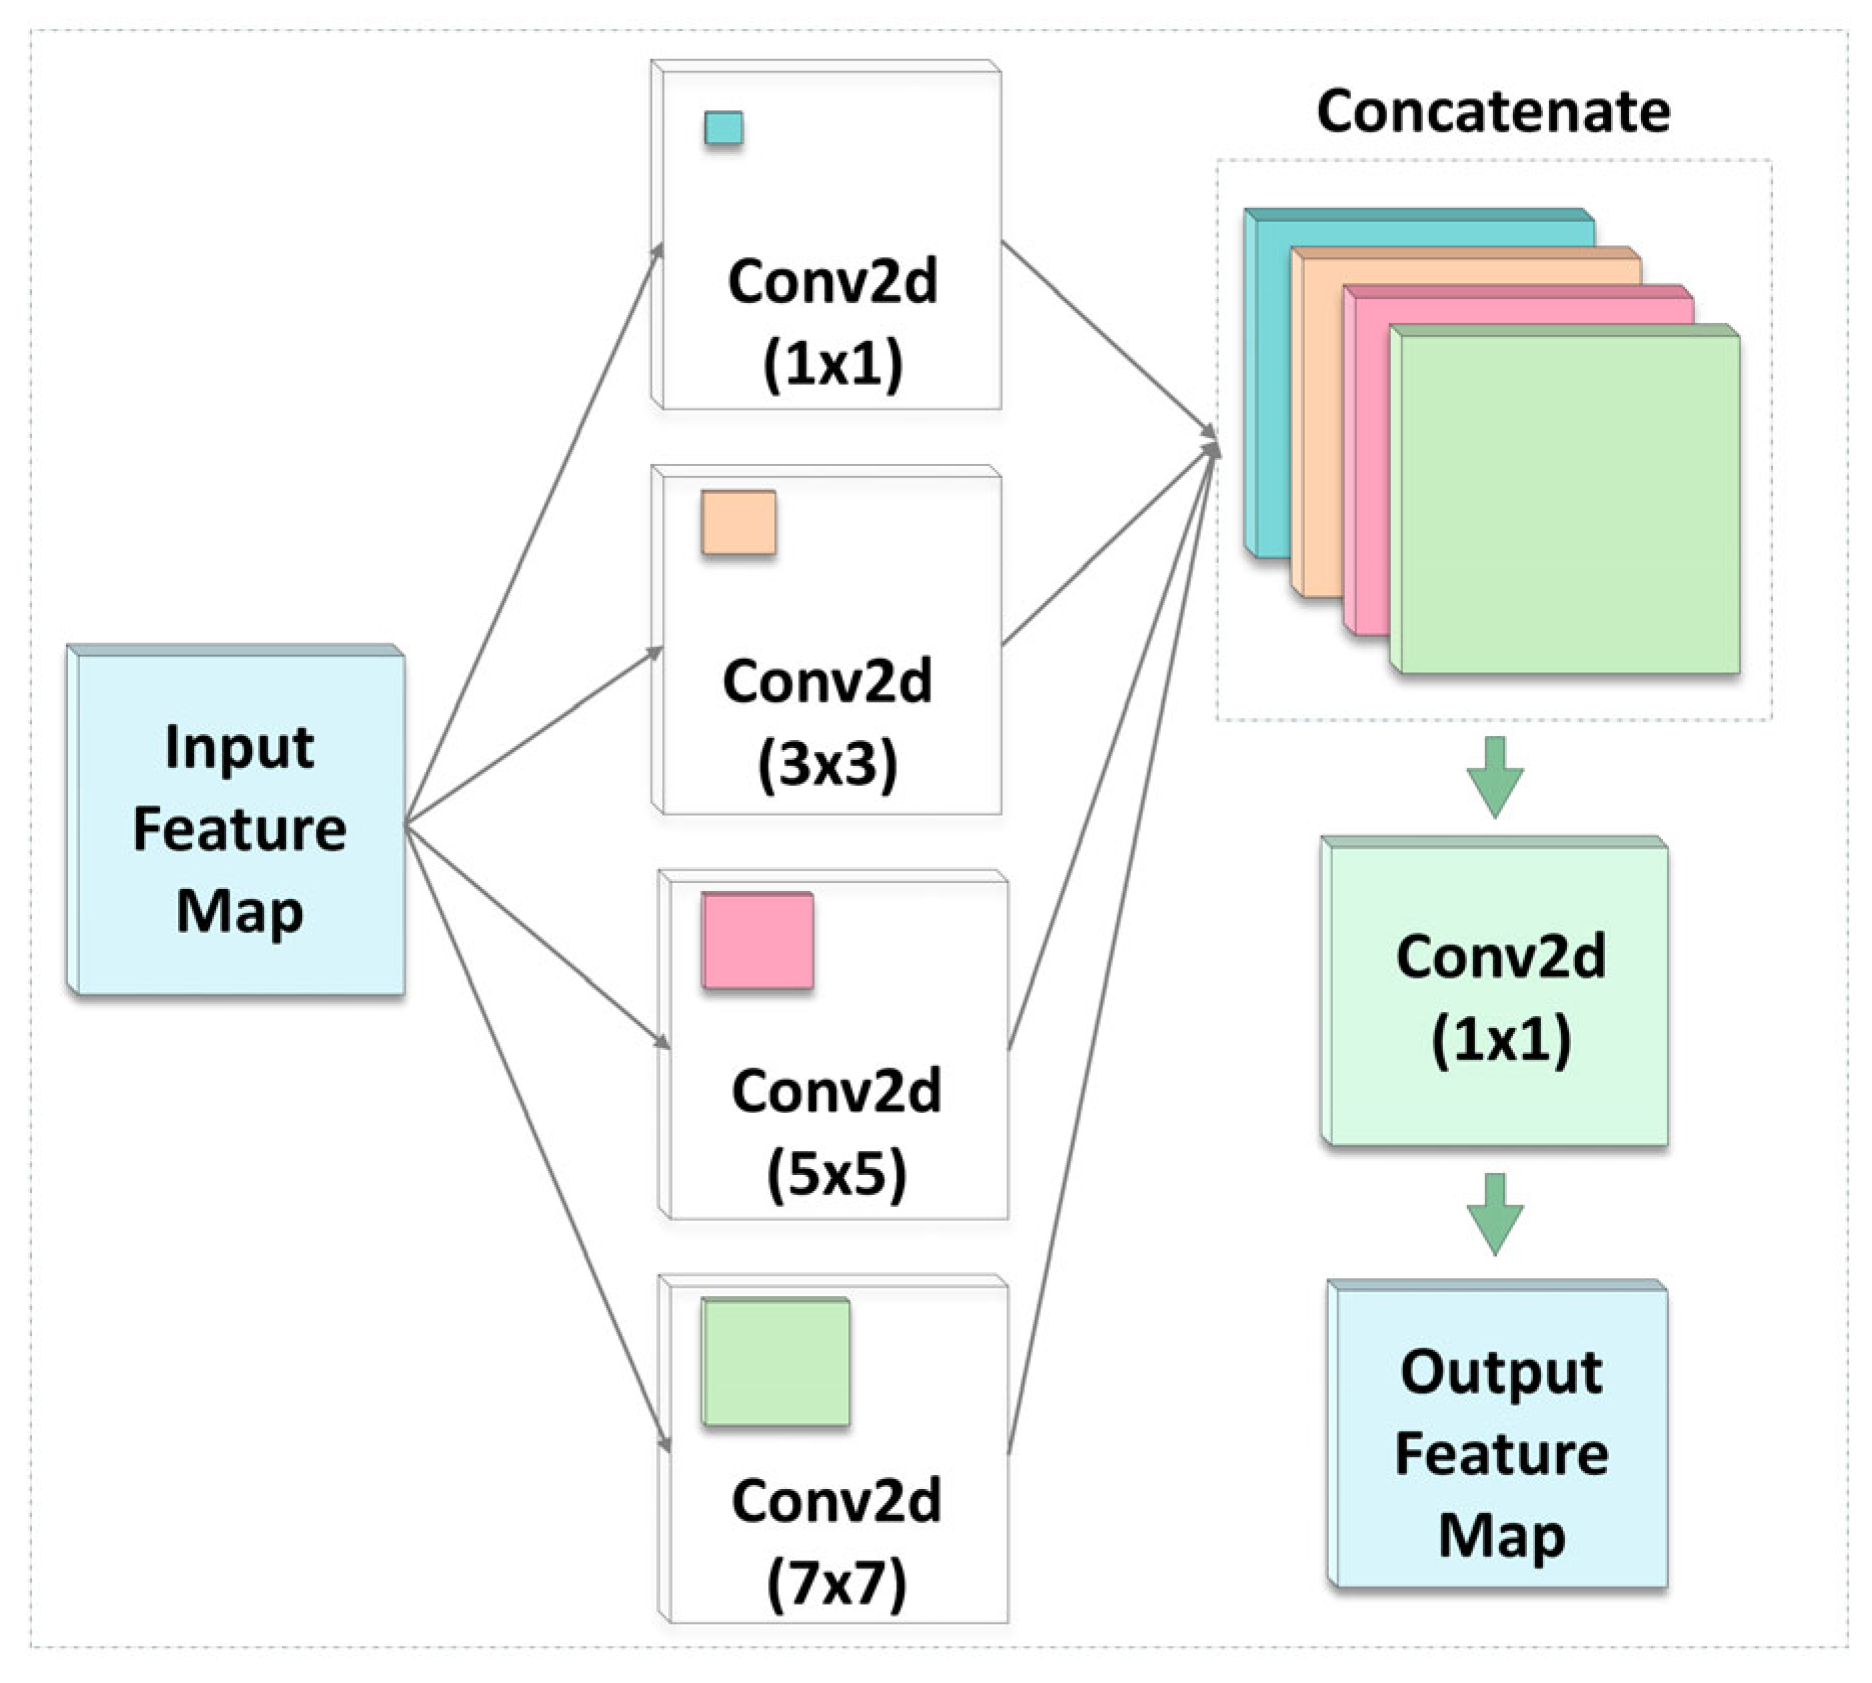
The MSFA module is constructed to create richer and more resilient feature representations by capturing information at various spatial scales within the proposed model (Figure 4). It demonstrates a pivotal function in enhancing segmentation performance by effectively capturing and integrating contextual information through the utilization of convoluted kernels at varying sizes. In other words, the module processes the same input feature map ( F i n ) using four convolutional filters with kernel sizes (i.e., 1 × 1, 3 × 3, 5 × 5 and 7 × 7). To ensure that the outputs of different kernel sizes have the same spatial dimensions, appropriate padding is applied to each convolutional operation (i.e., a padding rate of 0, 1, 2, and 3 for kernels of size 1 × 1, 3 × 3, 5 × 5, and 7 × 7, respectively). Therefore, this allows for safe concatenation along the channel dimension. Moreover, while the 1 × 1 convolution performs a simple linear transformation that preserves the channel dimensions, the others capture an increasingly larger spatial context.
Each convolution branch yields a unique feature map as follows:
F k =   W k   × k ×   F i n ,             k   { 1 ,   3 ,   5 ,   7 }
The feature maps are combined through channel-wise concatenation to form a unified feature representation that fuses information across multiple spatial scales:
F c o n c a t = Concat F 1 , F 3 , F 5 , F 7
A 1 × 1 convolutional fusion layer is employed to compress the concatenated feature map, thereby reducing the number of channels and enhancing computational efficiency:
F o u t = W 1 × 1 f u s e × F c o n c a t
The design allows the model to effectively integrate fine-grained spatial information with broader semantic context by leveraging multiple receptive field scales concurrently.

3.1.4. Decoder

A decoder is employed to increase the accuracy of the segmentation output by progressively reconstructing high-level semantic features into fine-grained spatial representations. It initiates the upsampling process with a transposed convolution layer that increases the spatial resolution while reducing the channel dimension from 128 to 64. Subsequent processing involves a regular convolutional block, which integrates a 3 × 3 convolutional operation with batch normalization and ReLU activation. They are combined to refine the feature representation and help the model learn sharper boundaries. The other transposed convolution layer further upsamples the feature map while maintaining the channel depth at 32. The output segmentation map is derived using a 1 × 1 convolution that aligns the number of output channels with the number of target categories. To produce class probabilities of each pixel, a SoftMax activation function is applied.

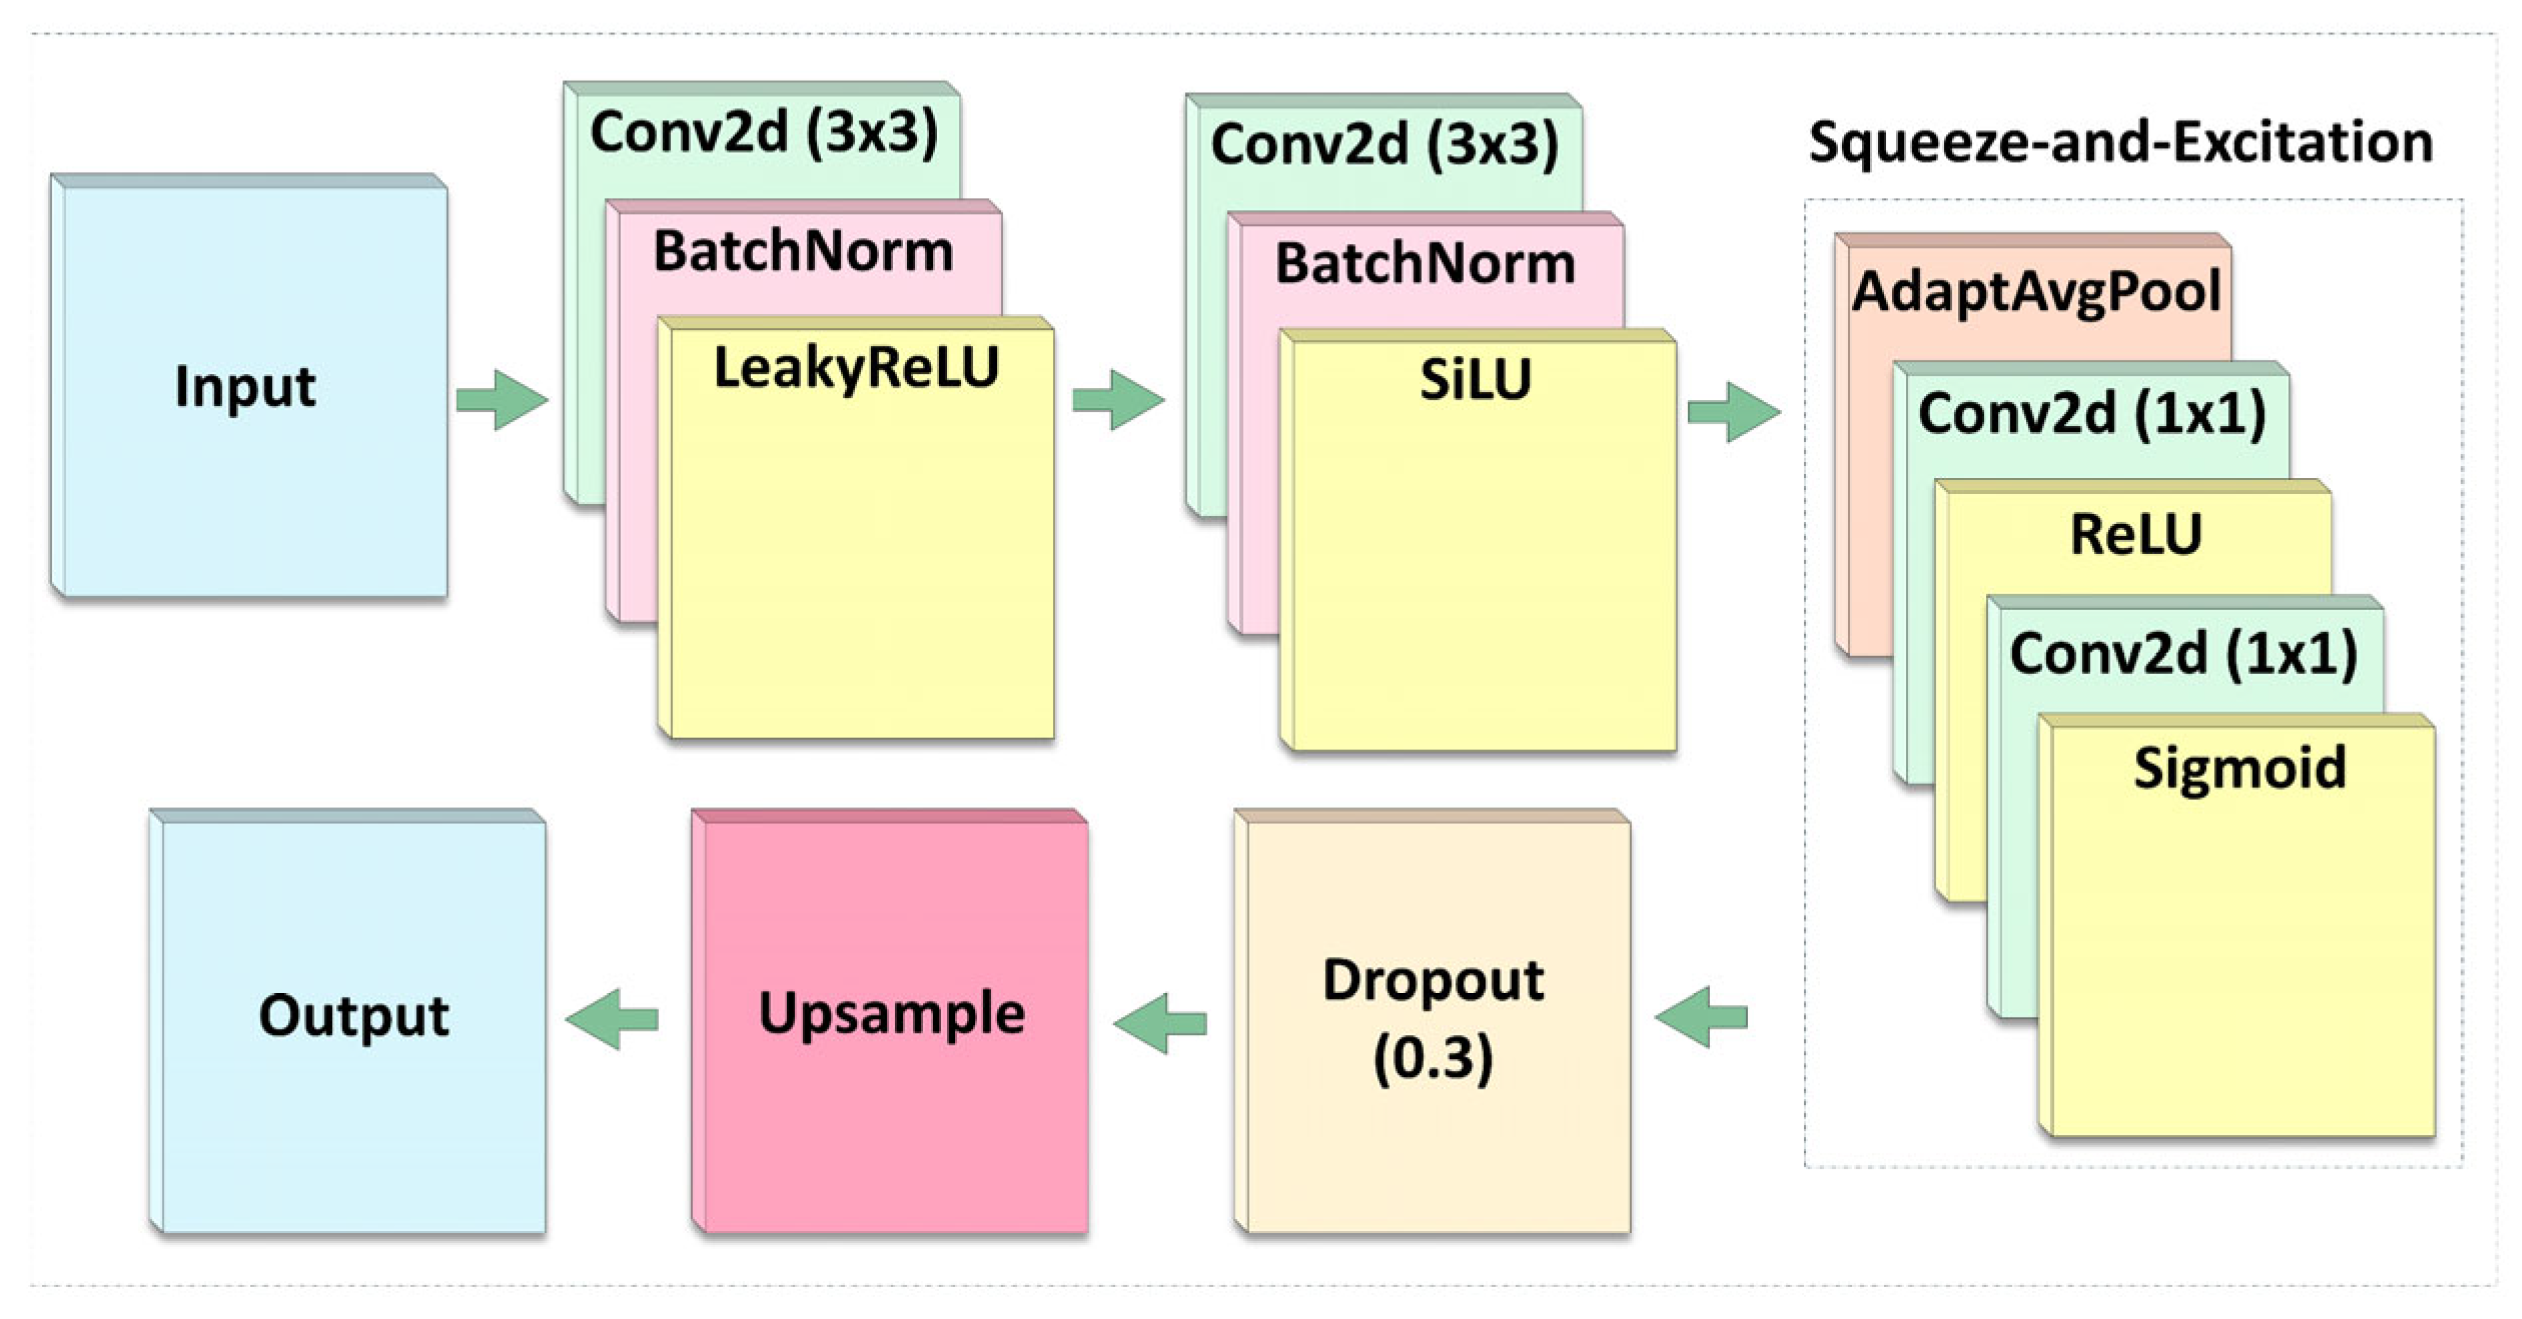
3.1.5. AuxHead Module

The Auxhead module is used to extract stronger feature representations of the model during the learning process, using information from deeper layers. It is illustrated in detail in Figure 5, and is positioned as shown in the overall DeepSwinLite architecture (Figure 2). It also provides additional supervision with feature maps from intermediate layers, and it reduces the risk of gradient loss, a problem commonly observed in DL networks. The module includes convolutional layers, activation functions, normalization, and dropout layers. There are two convolution blocks. The initial block begins by applying a 3 × 3 convolutional layer to the input feature map ( F i n ), reducing its channel dimensionality by half, and subsequently applying batch normalization and activation functions, namely LeakyReLU, SiLU and ReLU. In this module, different activation functions were deliberately selected at various stages of the AuxHead to benefit from their distinct characteristics: LeakyReLU was employed to ensure stable gradient flow, SiLU was chosen for its ability to provide smooth non-linear transformations, and ReLU was utilized in the SE block to support efficient feature gating. This combination was found to improve both the training strategy and the output quality of the auxiliary head in this study. W denotes the filter parameters that perform the convolution process (Equation (9)). These are learnable parameters and are updated during the training process.
F 1 = LeakyReLU BN W 3 × 3 1 × F i n
As a second block, a 3 × 3 convolution filter is implemented to achieve an additional reduction in feature dimensions:
F 2 = SiLU ( BN ( W 3 × 3 2 × F 1 ) )
A Squeeze-and-excitation block with adaptive average pooling (AAP) is then used to extract different features. At this stage, rescaling was performed by applying activation functions after pooling. After feature extraction, a dropout layer was applied to prevent overlearning.
F s e = SE F 2 = F 2 S i g ( W 2 ReLU W 1 AAP F 2 )
Even though both W 1 and W 2 are 1 × 1 convolutional layers, which are used for different parts of the excitation operation. W 1 reduces the size of the channel (bottleneck), while W 2 restores it to the original size. These two layers are used to represent different learnable parameters, so they are given different symbols to show how they work differently. In the last step, a 1 × 1 convolution filter is employed to produce the segmentation outputs. Also, ( Y a u x ^ ) is the prediction output produced by the model for the auxiliary task:
Y a u x ^ = W 1 × 1 × F s e
A dropout layer is added before the final output to reduce overfitting and improve generalization. The auxiliary output is upscaled to a resolution of 512 × 512 using bilinear interpolation to match the size of the main segmentation output. Furthermore, the loss specific to the auxiliary output is computed using both Cross-Entropy Loss and Dice Loss:
L a u x = L C E Y a u x ^ , Y + L D i c e Y a u x ^ , Y

3.2. Loss Function

The model includes a loss function consisting of two components: Cross Entropy (CE) Loss and Dice Loss, which are computed for the main and auxiliary outputs to facilitate more balanced and efficient learning. The aim is to enhance classification accuracy while refining the precision boundaries of the building footprint. Each output from the model (i.e., both main and auxiliary) generates two-class predictions, such as building and non-building pixels, which are converted into probability distributions through the SoftMax activation function. CE loss is employed to measure per-pixel classification accuracy and is defined as follows:
L C E = 1 N i = 1 N c = 1 C y i , c log y i , c ^ ,
Dice loss is used to evaluate the quality of segmentation overlap. It is expressed as follows:
L D i c e = 1 2 i = 1 N y i y i ^ i = 1 N y i + i = 1 N y i ^ + ϵ ,
Both CE and Dice losses are calculated independently for the main and auxiliary outputs:
L C E m a i n / a u x =   C E p r e d m a i n / a u x , t a r g e t ,
L D i c e m a i n / a u x = 1 2 y m a i n / a u x y m a i n / a u x ^ y m a i n / a u x + y m a i n / a u x ^ + ϵ   ,
The main and auxiliary losses are combined using weighted averaging to emphasize the contribution of the main output. In addition, the determination of the coefficients γ and δ was conducted through a process of trial and error, with the final values established at 0.7 and 0.3, respectively. They were determined based on their contribution to the optimization of the learning process:
L C E / D i c e w e i g h t e d = γ L C E / D i c e m a i n + δ L C E / D i c e a u x ,
Then, the total loss function is computed by combining the weighted CE and Dice losses:
L t o t a l = γ L C E w e i g h t e d + δ L D i c e w e i g h t e d ,

3.3. Evaluation Metrics

Ensuring the reliability of thematic maps produced from RS data requires a conclusive accuracy assessment phase before their deployment in analytical and decision-making contexts. Such rigorous evaluation underpins geospatial mapping by quantifying uncertainty and validating the credibility of spatial representations. This validation process establishes confidence in derived results and confirms fulfillment of analytical objectives [40]. To evaluate the performance of the models in this study, five accuracy metrics (precision, recall, accuracy, Intersection over Union (IoU), and F1-score) were employed. In all estimations, the building class was considered as the positive class, and the background class as the negative class.
By comparing the model’s predicted outputs with the ground truth annotations, the primary components of the confusion matrix are calculated: true positive (TP), true negative (TN), false positive (FP), and false negative (FN). In this context, TP denotes accurately identified building pixels, TN corresponds to correctly classified background pixels, FP represents background pixels misclassified as buildings, and FN refers to building pixels erroneously labeled as background. From these measures, five accuracy metrics are estimated using the following formulas:
P r e c i s i o n   = T P T P + F P   ,
R e c a l l = T P T P + F N   ,
F 1 - s c o r e = 2 × P r e c i s i o n × R e c a l l P r e c i s i o n + R e c a l l ,
A c c u r a c y = T P + T N T P + T N + F P + F N   ,
I o U = T P T P + F P + F N   .

4. Experimental Results and Evaluation

4.1. Experimental Setup

In the training stage, AdamW optimizer was selected, and a batch size of 8 was set. All models were operated with a learning rate of 1 × 10⁻⁴ and a weight decay of 0.0001 at 200 epochs. The ReduceLROnPlateau learning rate scheduler was employed, which dynamically adjusts the learning rate based on the observed improvement rate of the validation loss. It enables the model to learn through precise updates. Augmentation techniques of random rotations and normalization were employed to increase the size of the dataset and improve the generalization capabilities of the model. All encoder weights were randomly initialized to learn dataset-specific features without relying on pre-trained representations. ResNet50 was selected as the backbone for CNN-based models, namely U-Net, DeepLabV3+, PAN, MANet and LinkNet, and the MiT-B2 backbone is used for Transformer-based models, including SegFormer and UperNet. This selection strategy allows the performance of the proposed model to outperform both CNN-based models, which are efficient in capturing local patterns, and Transformers, which excel in learning large spatial relationships. Experiments were performed on a workstation equipped with an AMD Ryzen 7 5700X 8-Core Processor, 64 GB RAM, NVIDIA GeForce RTX 4070 SUPER GPU with 12 GB VRAM.

4.2. Experimental Results

The performance of the proposed model was quantitatively assessed on the Massachusetts Building Dataset, demonstrating superior results compared to SOTA architectures (Table 1). The proposed approach achieved the highest IoU score of 77.94%, signifying enhanced segmentation capability. It also attained the highest overall accuracy (OA) of 92.54%, marginally surpassing U-Net (92.27%) and PAN (92.26%). While PAN exhibited competitive accuracy, its lower estimated IoU (77.94% vs. PAN’s 69.78%) indicates comparatively weaker boundary localization performance. The proposed model yielded the highest F1-score (86.96%), exceeding U-Net (86.64%) and MANet (86.24%). A precision score of 87.98%, which is the highest among evaluated models, highlights its effectiveness in minimizing false positive detections. Conversely, MANet achieved the highest recall (86.87%), reflecting its strength in identifying true building pixels.
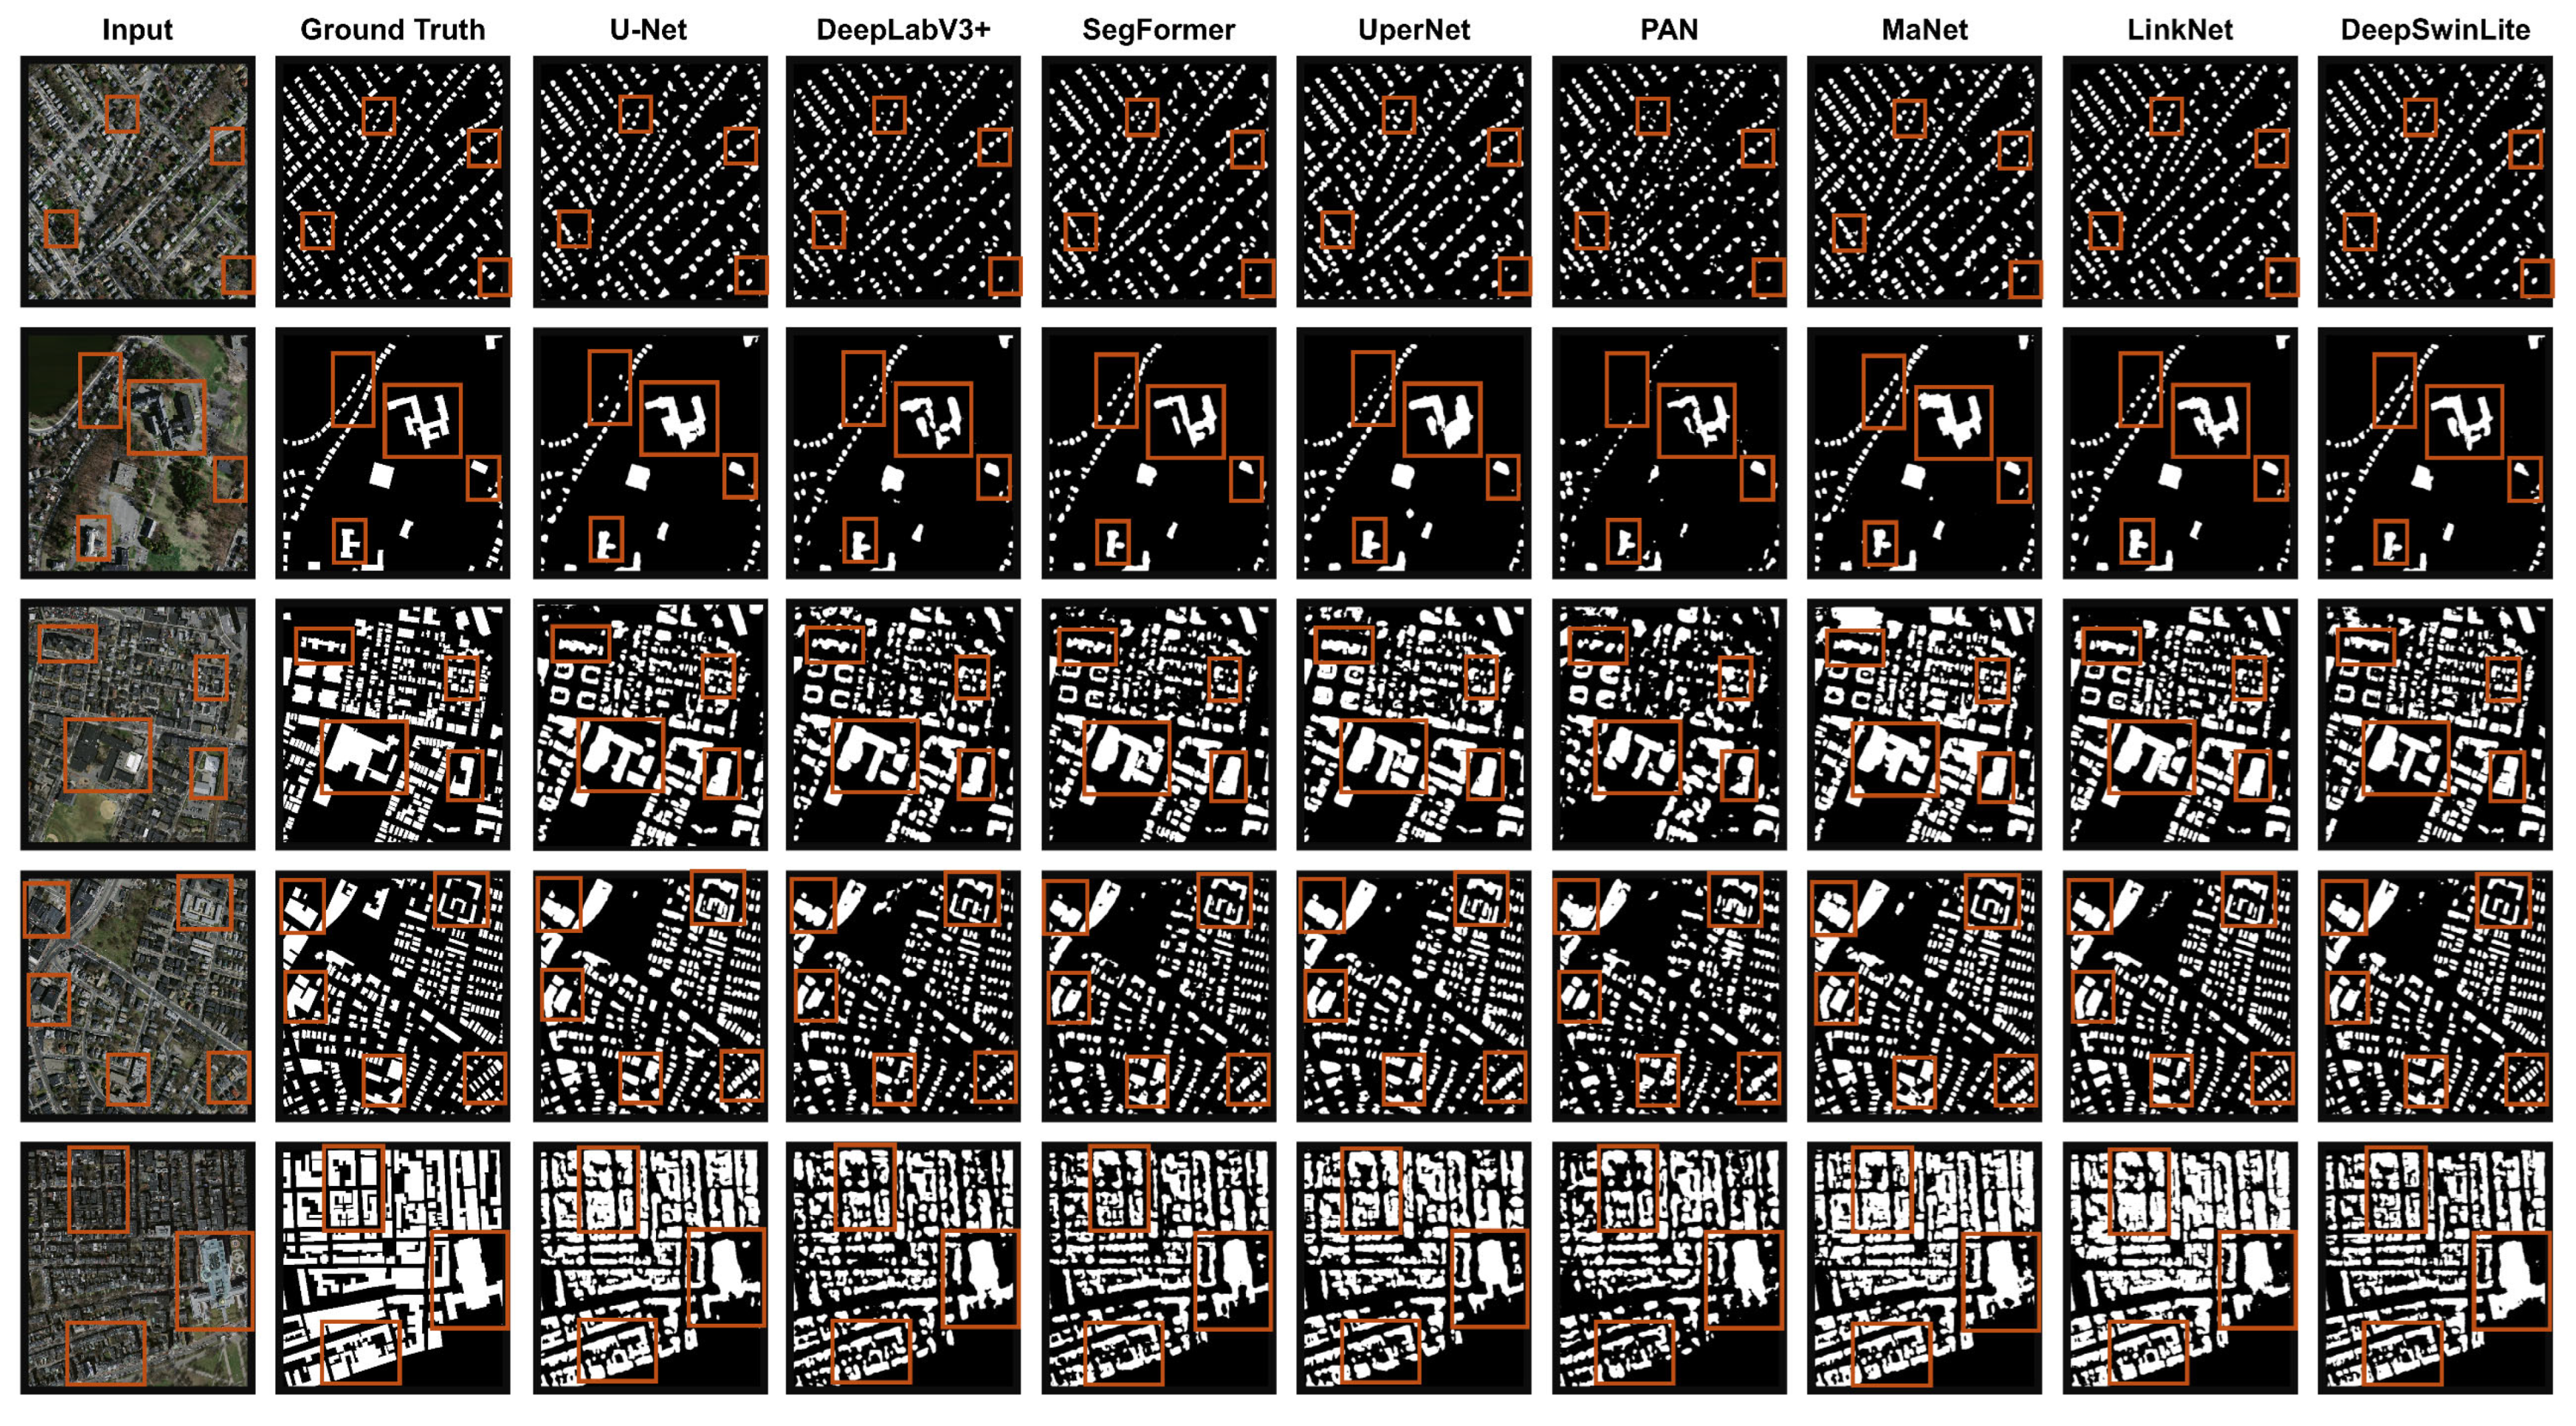
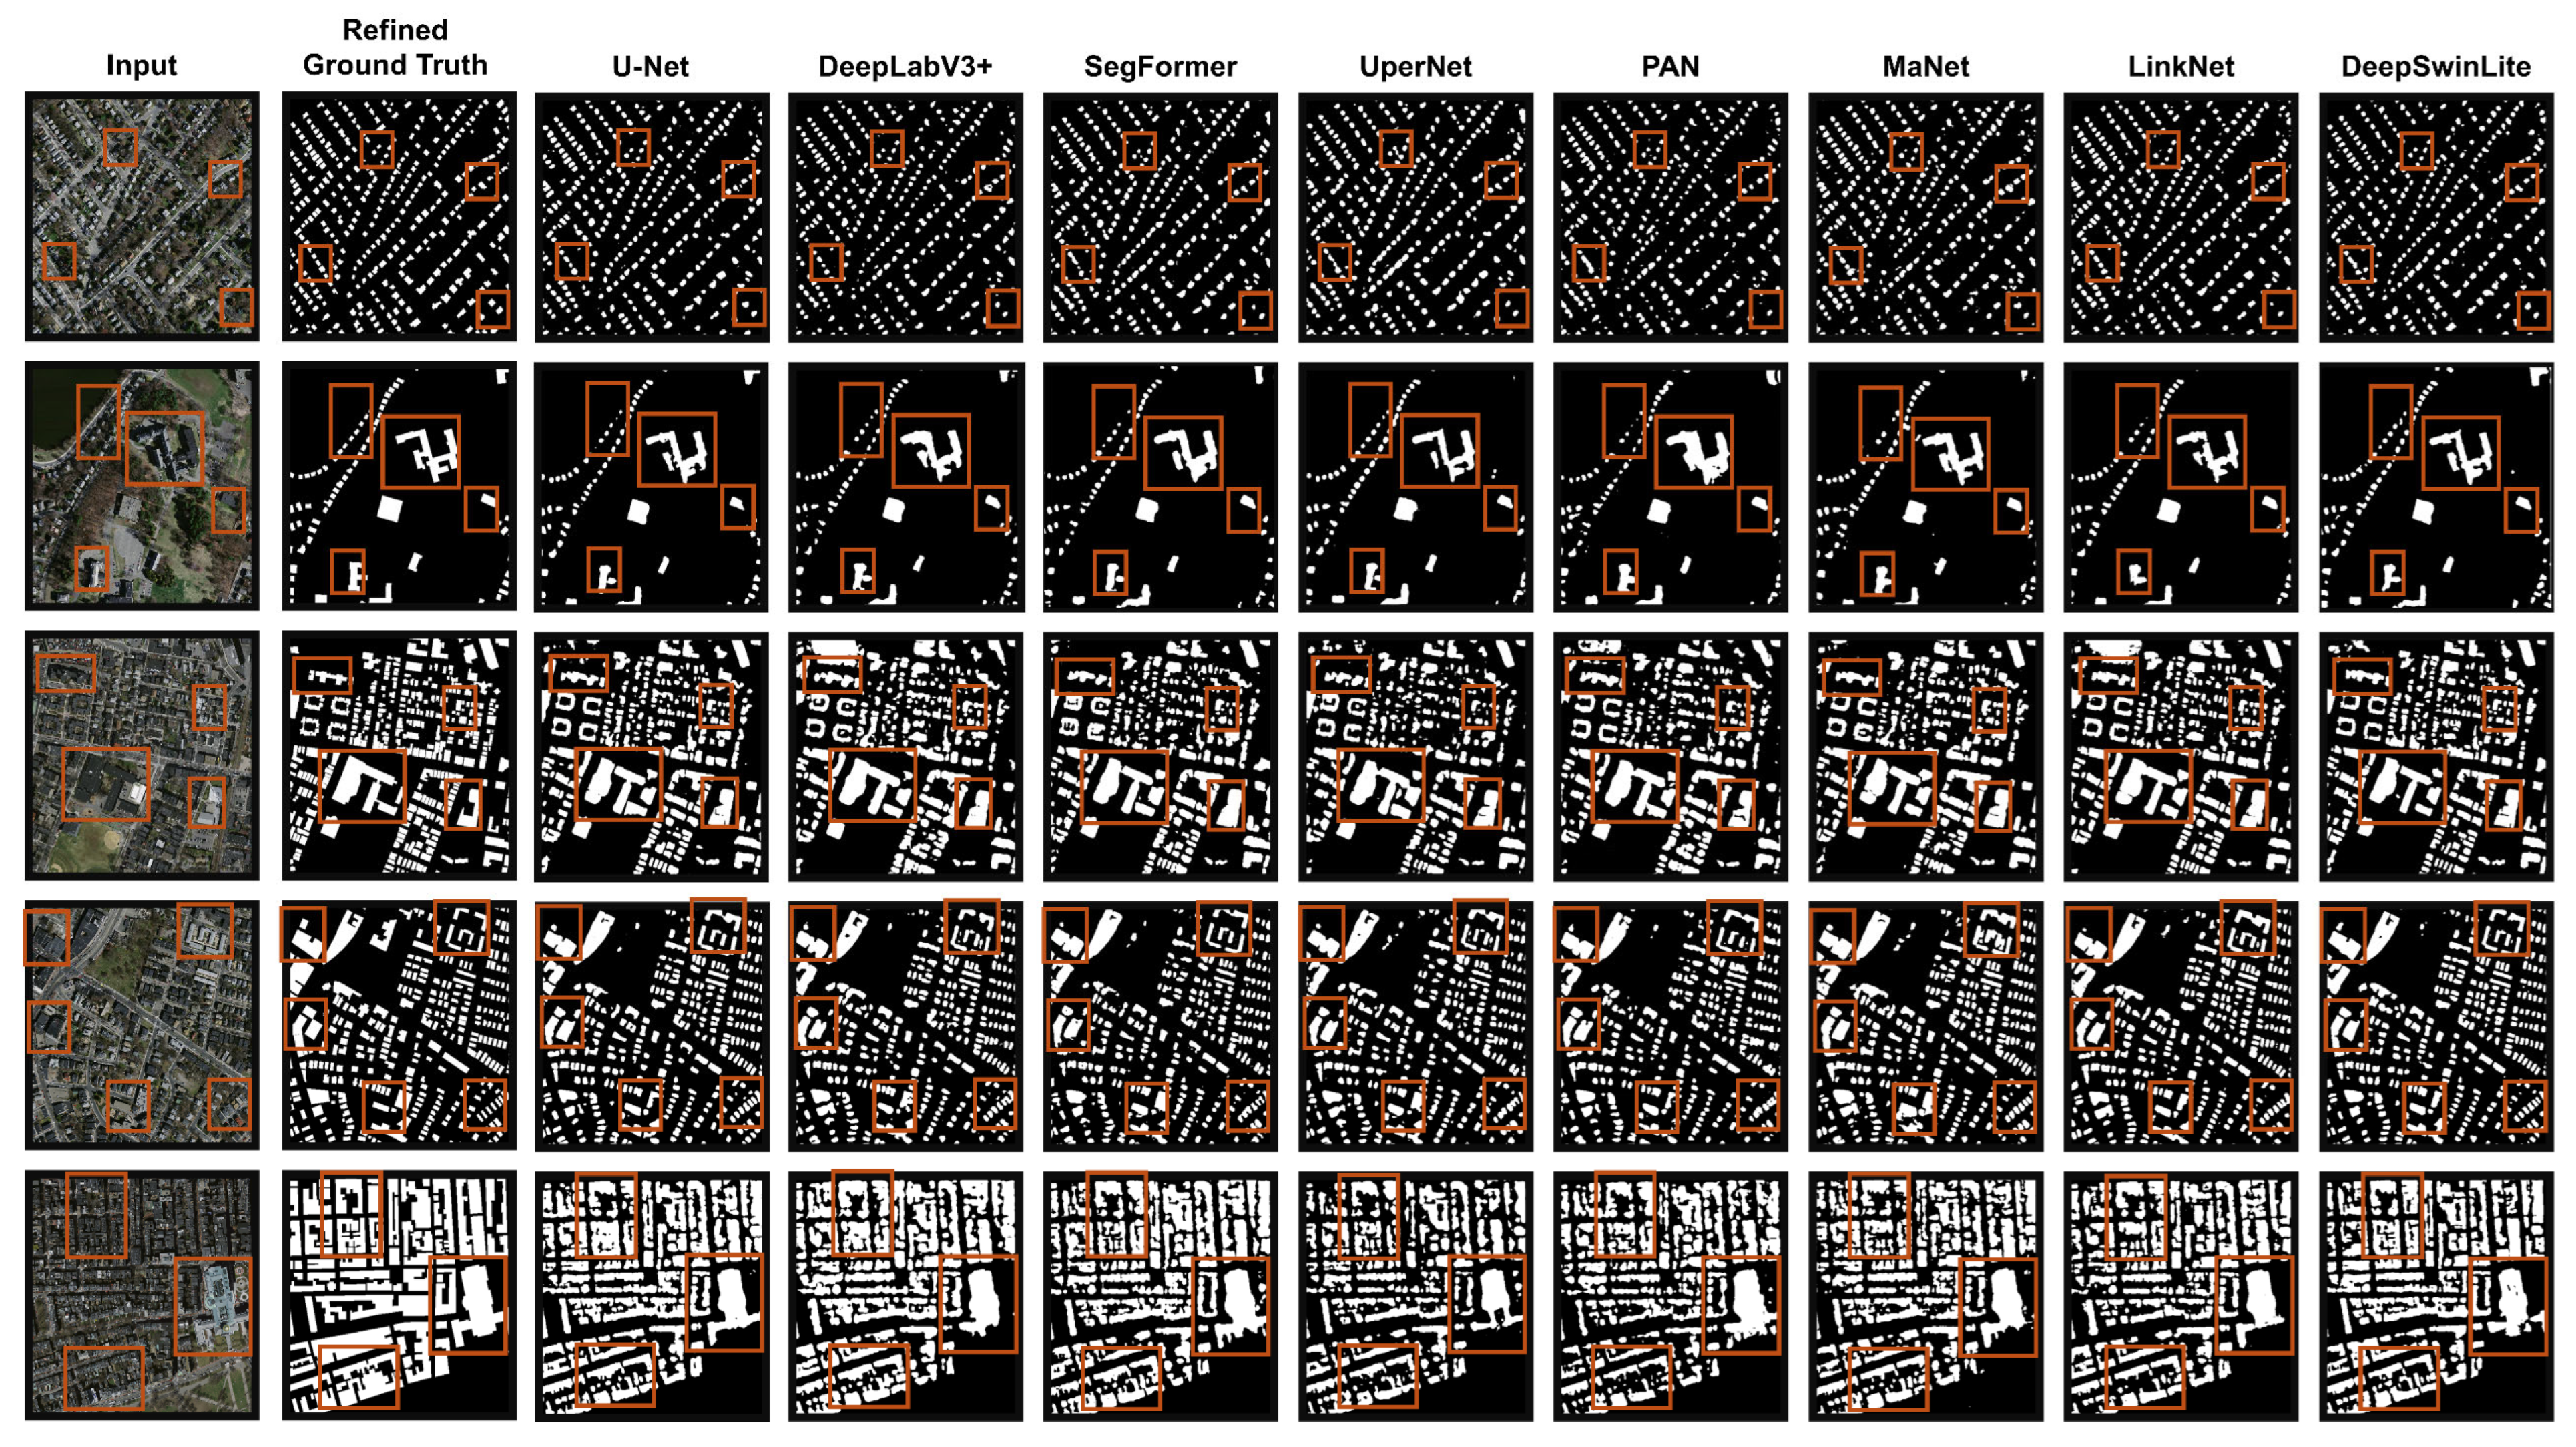
The results of the proposed and SOTA models are shown in Figure 6, where the first column presents the input images, followed by the corresponding ground truth building labels, and segmentation outputs of the DL models. Visual inspection revealed that the proposed model produced the most accurate segmentation results compared with the reference annotations. It effectively preserves building edge details and produces more precise segmentation results than the other models. While the U-Net model performs reasonably well, it fails to accurately capture small and intricate structures. On the other hand, DeepLabV3+ successfully detects most buildings, but certain outputs exhibit fragmented structures. SegFormer and LinkNet generate smoother building contours, but they struggle with detecting small-scale buildings. UPerNet and PAN achieve partially accurate predictions, yet their output lacks fine-grained detail. Conversely, MANet demonstrates relatively balanced segmentation, but it tends to overfill certain regions.
The visual differences, particularly those highlighted in the red boxes, exhibit a strong correlation with the quantitative results displayed in Figure 6. The most substantial gains were observed when compared to weaker baselines, such as PAN, where DeepSwinLite achieves improvements of over 8% in IoU and 6% in F1-Score, especially in regions where there is dense building development or where there is a lot of shadowing. It is evident that there is moderate, yet significant advantages observed in comparison to classical models such as DeepLabV3+, with margins of approximately 4–5% in IoU and 3–4% in F1-score, indicative of more precise delineation of complex boundaries. In comparison with stronger recent models, such as MANet or LinkNet, DeepSwinLite demonstrates a consistent improvement in performance, as evidenced by a 1–2% increase in IoU and F1-score. This finding serves as a testament to the reliability and consistency of the improvements observed across various baselines. The numerical evidence corroborates the visual observations that DeepSwinLite yields the most reliable building delineation, particularly in challenging urban landscapes.
For the WHU building dataset, the DeepSwinLite model achieved the highest IoU score of 92.02%, outperforming other SOTA models (Table 2). LinkNet and UPerNet followed with IoU scores of 90.79% and 90.73%, respectively. In terms of overall accuracy, the proposed model records the highest score at 98.32%, followed by UPerNet at 98.08%. Other evaluated models range between 97.70% and 98.05%. The F1-score further highlights the superiority of the model, achieving 95.74%, with LinkNet following closely at 95.03%. Both visual inspection and statistical performance indicators confirmed that the proposed model outperformed existing approaches on the WHU Building Dataset.
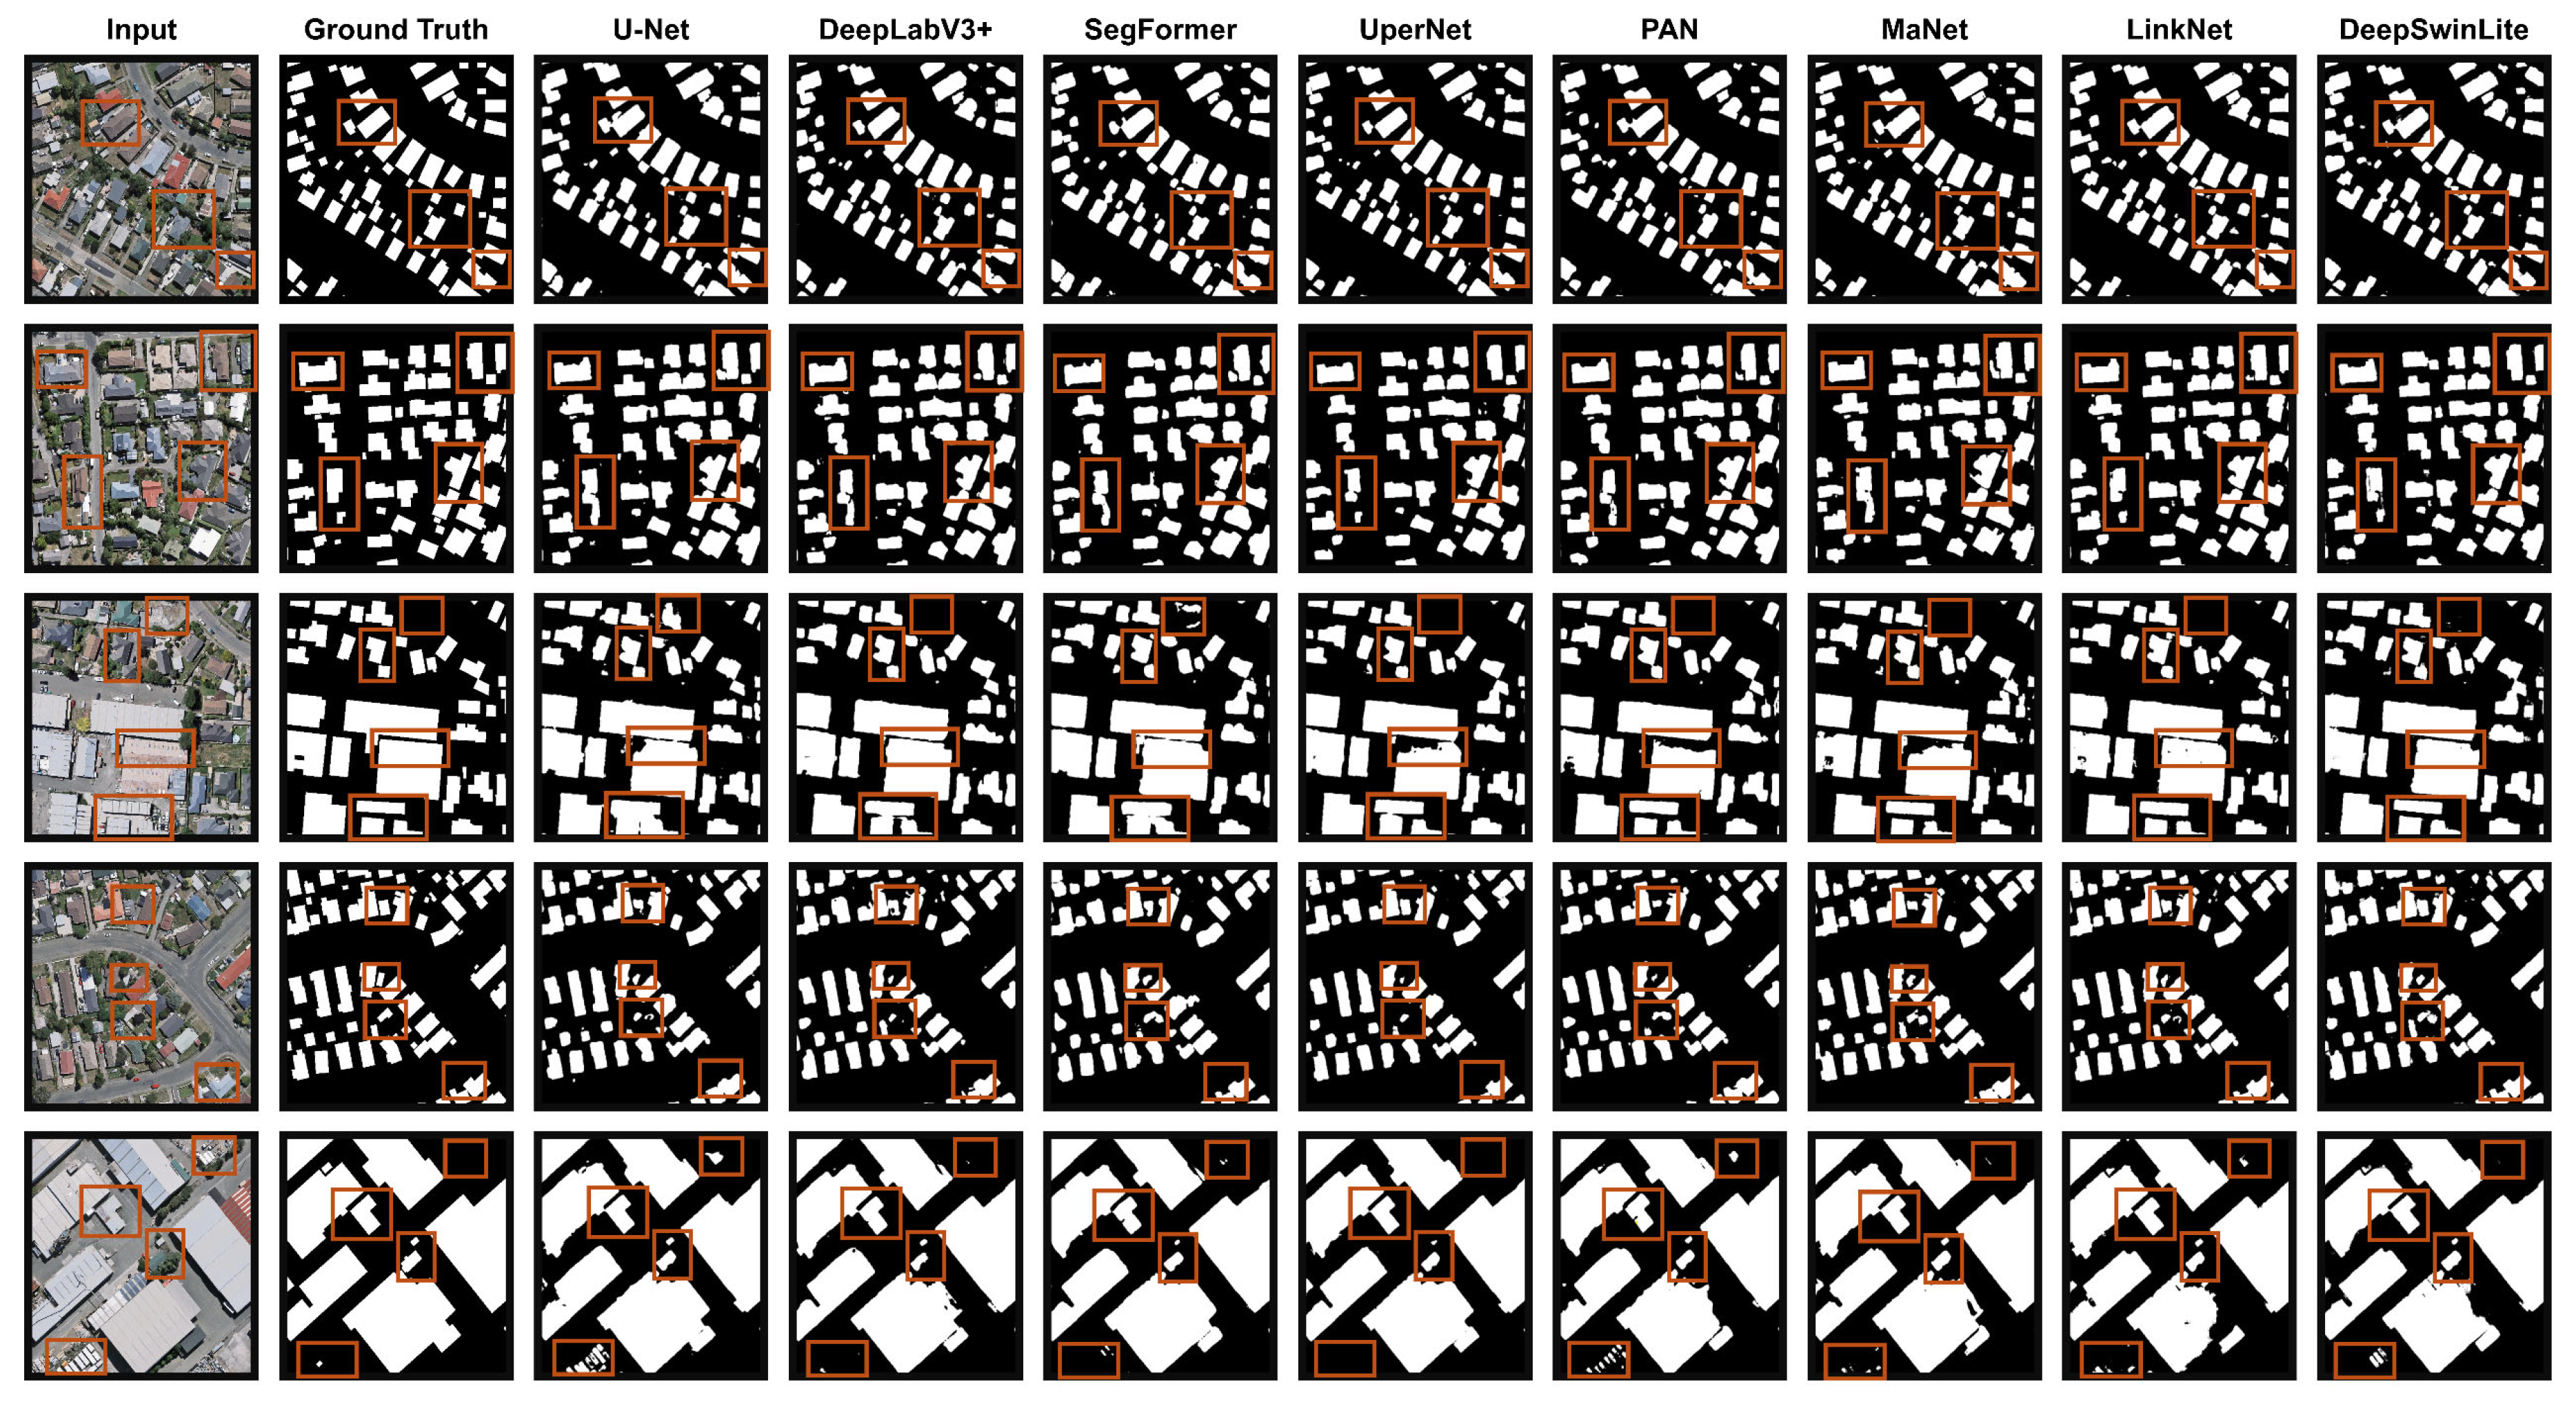
While the ground truth labels most closely coincide with the outputs of the proposed model in detecting small buildings, the proposed model exhibited smoother building edges and reduced erroneous region mergers (Figure 7). For large buildings, the proposed model also produced the most accurate and coherent segmentations, successfully minimizing internal cavities and generating structures that closely match the actual footprints. On the other hand, U-Net and DeepLabV3+ were generally effective in capturing the coarse boundaries of large buildings, yet they struggled to accurately detect corners and finer structural details. SegFormer and UPerNet performed well in identifying small buildings but showed limitations in separating closely located structures. Although these models captured the general outlines of large buildings, gaps and irregularities were frequently observed within the building interiors. The PAN model was inferior in both small- and large-scale building segmentation, leading to the loss of fine details and excessive overfilling. Similarly, MANet and LinkNet failed to produce sharp building edges and lacked the precision required for detecting smaller building components.
The WHU dataset results presented in Figure 7 clearly demonstrate that the red-boxed regions are the most illustrative for comparing segmentation quality among the models. In these areas, DeepSwinLite consistently produces more complete and accurate delineation, especially where small buildings are adjacent, partially occluded, or shadowed. These visual improvements are fully consistent with the quantitative results reported in Table 2. The largest margins are observed against PAN, with DeepSwinLite improving IoU by 2.1% and F1-score by 1.2% in the red-boxed regions, particularly within dense urban blocks. Moderate but meaningful advantages are also evident over SegFormer (ΔIoU 2.6%, ΔF1-score 1.5%), where DeepSwinLite better preserves fine structures highlighted in the red boxes. Even when compared with stronger models such as U-Net and LinkNet, DeepSwinLite still yields measurable improvements of about 1–1.5% IoU and 0.8% F1-score in these challenging, red-boxed areas. Overall, the numerical differences reinforce the visual evidence that DeepSwinLite delivers the most reliable building delineation in complex urban environments.
The effectiveness of the proposed and SOTA models was also evaluated using both the original and refined Massachusetts datasets (Table 3). The DeepSwinLite model demonstrated robust performance in building footprint segmentation by consistently achieving the highest accuracy in terms of all accuracy metrics considered. It also showed a strong ability to accurately delineate building boundaries, even in areas characterized by dense and complex urban structures (Figure 8).
An average improvement of 3% in IoU was observed across all models. This confirms that the quality of labeling has a direct and measurable impact on model performance. These findings underline the importance of employing accurate ground reference data for improved performance, previously underlined by [41]. It should be pointed out that the performances of U-Net, DeepLabV3+, and SegFormer were significantly improved on small structures when trained with the refined Massachusetts building dataset. The extraction of larger building footprints was more accurate.
The refined Massachusetts dataset results shown in Figure 8 further underline the advantages of DeepSwinLite, with the red-boxed regions offering the clearest evidence of segmentation differences among the models. In these highlighted areas, DeepSwinLite generates sharper boundaries and reduces fragmentation compared to its counterparts. The numerical results in Table 3 confirm these observations. The largest improvements were recorded over PAN, where DeepSwinLite provides 4.1% higher IoU and 3.0% higher F1-score, especially in red-boxed regions containing dense urban blocks and shadowed edges. Moderate but consistent gains are observed against SegFormer, with improvements of 2.2% IoU and 1.9% F1-score, indicating stronger preservation of fine-scale building structures. Even in comparisons with well-established baselines such as U-Net and LinkNet, the proposed model retains a measurable edge of 0.8–1.5% IoU and about 1% F1-score in the red-boxed areas. These consistent numerical differences reinforce the visual evidence, validating the robustness of DeepSwinLite on the refined dataset.
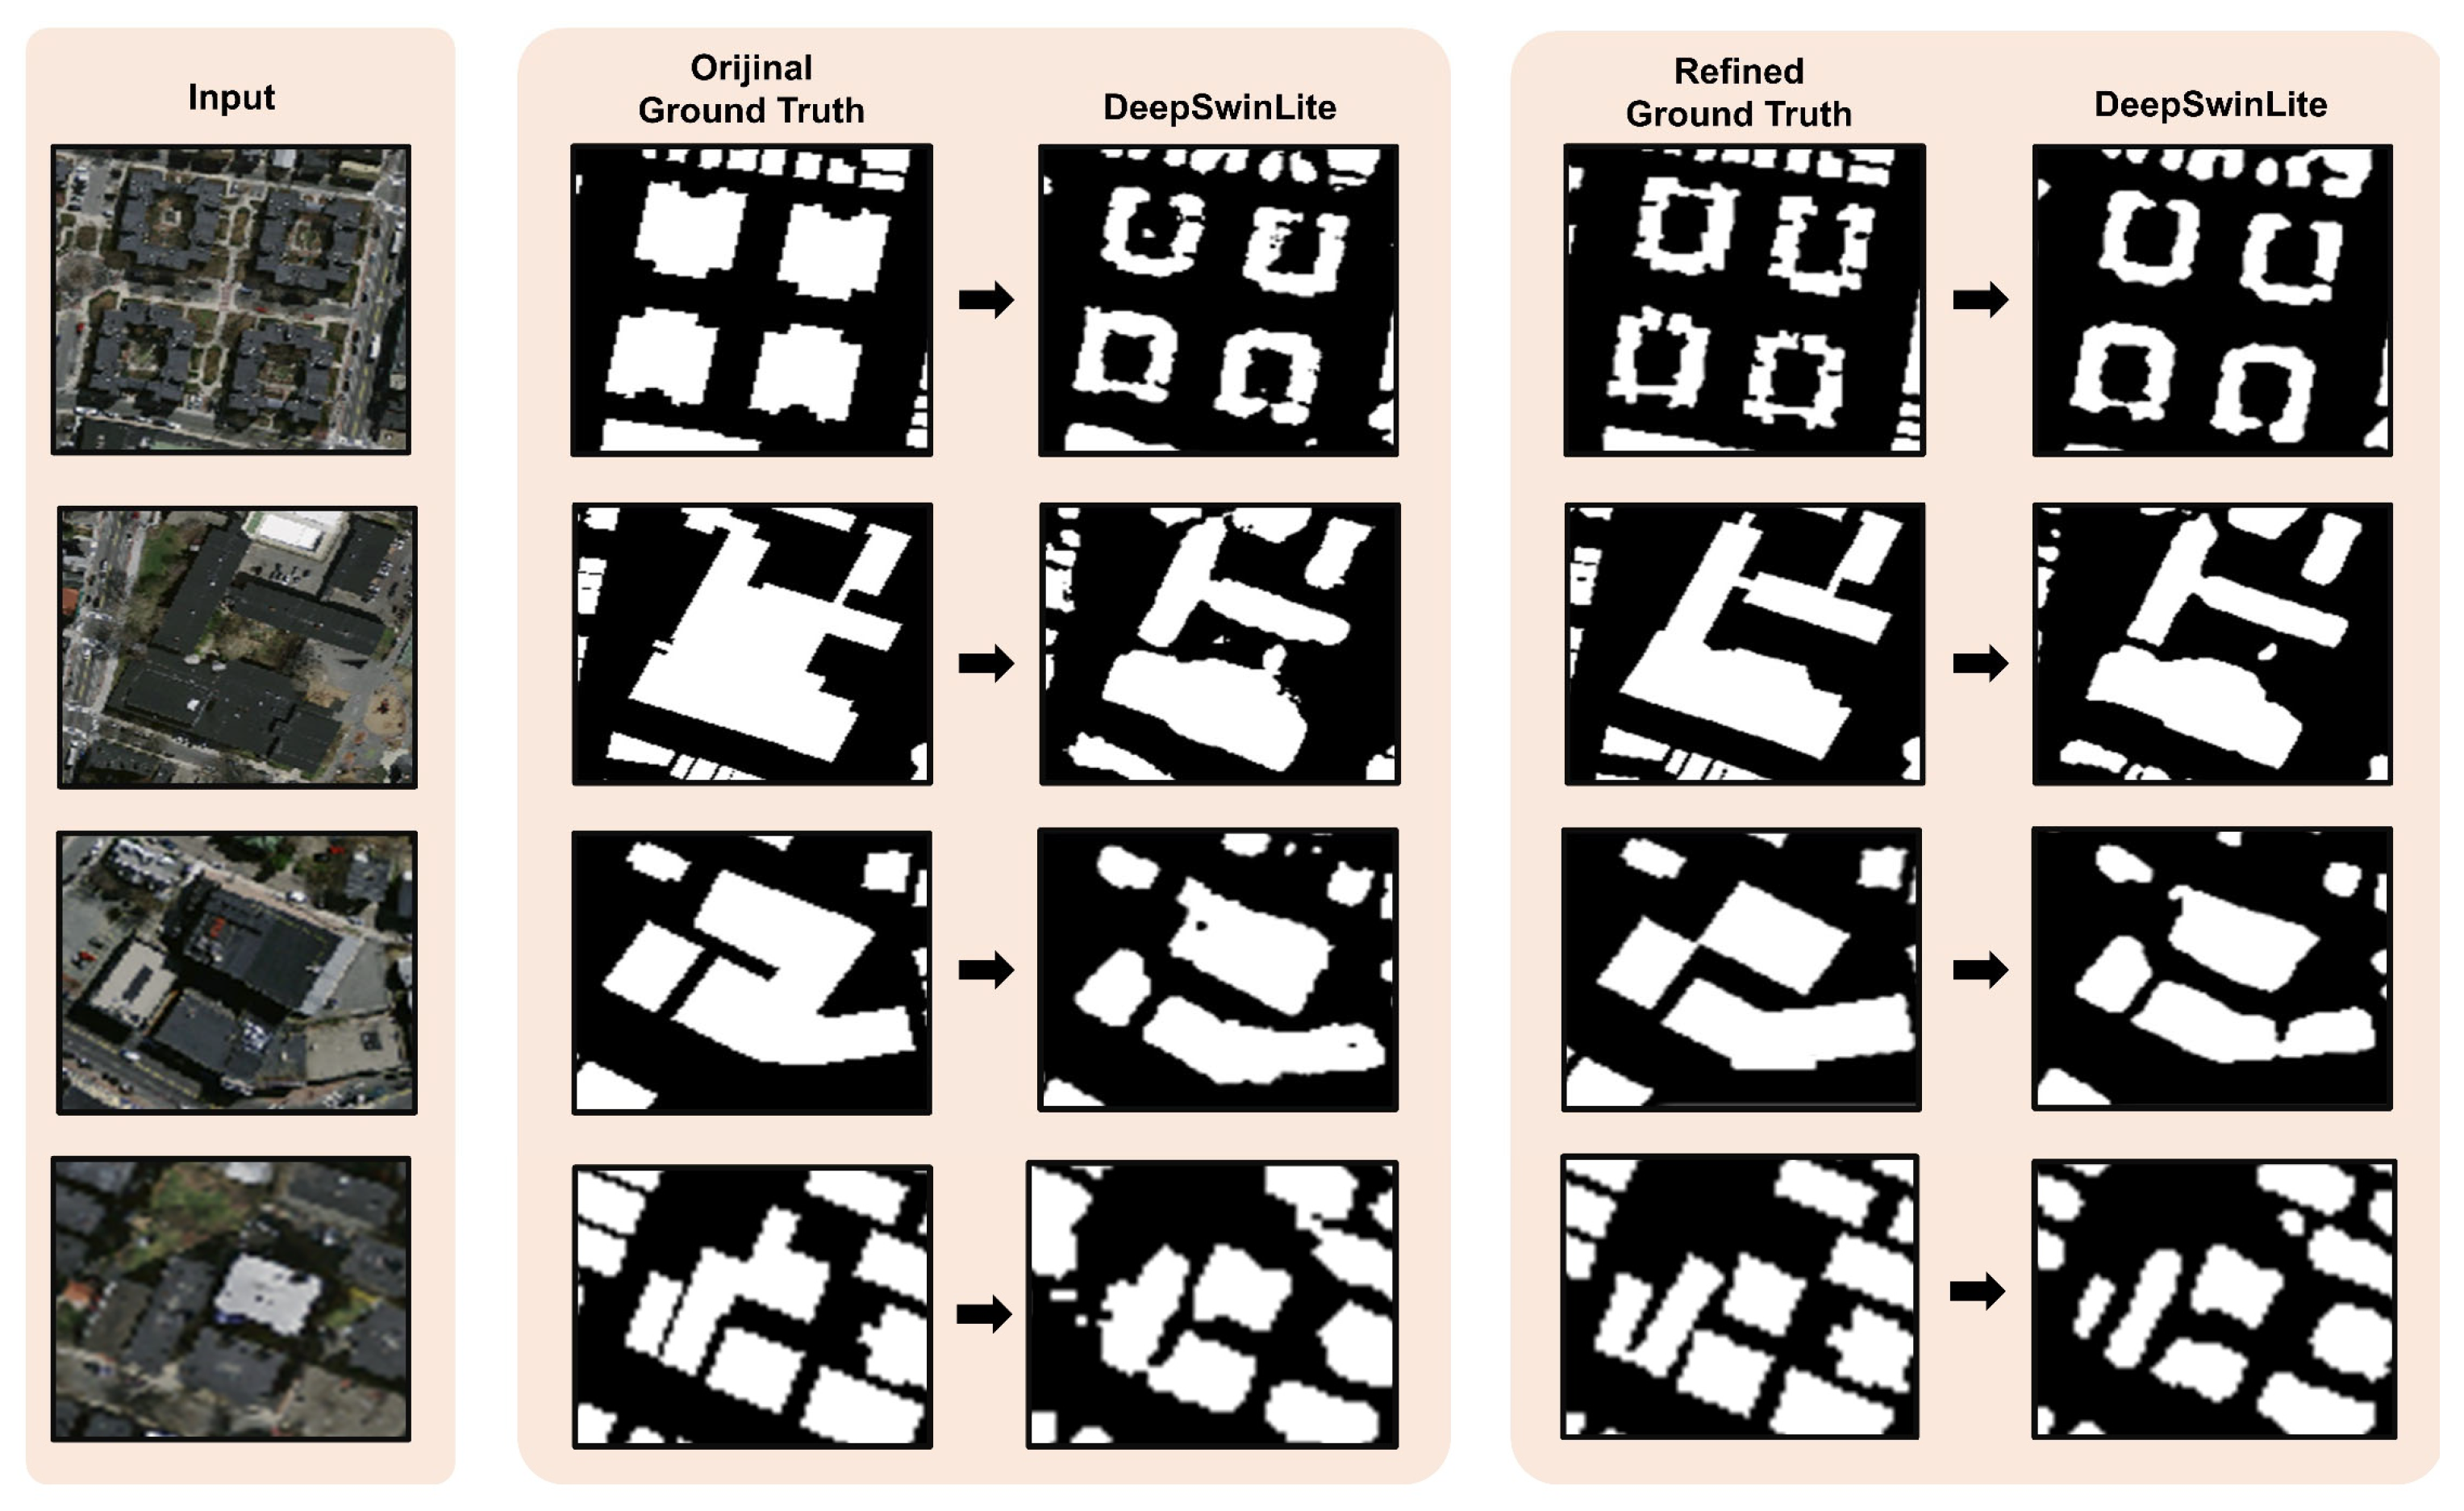
To illustrate the impact of annotation quality on segmentation performance more clearly, a comparative visualization was introduced (Figure 9). This figure presents side-by-side comparisons of the predictions of DeepSwinLite based on the original and refined ground truth annotations for selected samples from the Massachusetts dataset. Each row shows an input image, followed by the original ground truth, the prediction of the model based on this, the refined ground truth and, finally, the prediction based on the refined annotation. The comparative layout shows how inaccurate or noisy annotations (e.g., mislabeled boundaries) in the original dataset can affect the perceived performance of the model. In contrast, predictions aligned with the refined annotations demonstrate improved boundary consistency and clearer object delineation. This visual evidence supports the claim that annotation refinement contributes to more accurate training and reveals the true potential of the proposed architecture in challenging urban scenes.

4.3. Computational Cost Analysis

The processing cost of each model on both datasets was evaluated by calculating FLOPs and the number of parameters. MANet exhibited the highest computational complexity with 74.65 FLOPs and 147.44 M parameters, indicating a substantial demand for training (Table 4). The proposed model demonstrated superior efficiency with only 37.17 FLOPs and 7.81 million parameters, indicating much lower memory requirements and faster inference capabilities. In the experiments with the Massachusetts dataset, the proposed model required the lowest processing time (96 s) per epoch, which is close to the training times of PAN and MANet. SegFormer had the longest duration per epoch, which can be attributed to its Transformer-based architecture and higher optimization requirements. For the WHU building dataset, the training times of all models increased significantly because of the increase in dataset size. The proposed model again required the least processing time (304 s per epoch), which clearly indicates its compact effectiveness with compact design handling large datasets with fewer parameters.

4.4. Ablation Study

A comprehensive ablation study was conducted to evaluate the impact of the Auxhead, MLFP and MSFA modules on segmentation performance and computational efficiency (Table 5). DeepSwinLite achieved the highest overall performance, demonstrating a well-balanced trade-off between accuracy and computational cost, with an F1-score of 0.8696, an IoU of 0.7794, 37.17 GFLOPs, 7.81 M parameters and 96.0 s/epoch. When the Auxhead module was removed, a slight improvement in precision was observed, but recall and IoU both declined. This suggests that the Auxhead module improves boundary sensitivity and recall, even though removing it slightly reduces computational load (FLOPs dropped to 35.96), but increases training time per epoch, possibly due to differences in backpropagation without auxiliary supervision. The most drastic performance drop occurred when the MLFP module was ablated. The IoU plummeted to 0.6997, the F1-score to 0.8095 and the accuracy to 0.8959, which clearly highlights the critical role of the MLFP in fusing hierarchical, multi-level features. This configuration yielded the lowest FLOPs (6.44 G), the highest parameter count (10.33 M), and a slightly longer epoch duration (98.0 s). This indicates a shift in computational workload from operations to parameter-heavy processing. Performance was also negatively affected by removing the MSFA module, with IoU dropping to 0.7669 and F1-score to 0.8564. Although FLOPs decreased significantly (13.54 G), epoch time also decreased (85.0 s), suggesting that, while MSFA is moderately efficient, removing it sacrifices valuable multi-scale contextual information.
In terms of contributions from individual modules, the model comprising only the Auxhead module exhibited the poorest performance of all variants, despite having the lowest FLOPs (5.61 G) and a relatively short training time (69.4 s). This confirms that Auxhead alone is insufficient for effective segmentation. Conversely, the MLFP-only configuration performed best among the single-module variants, achieving an F1-score of 0.8492 and an IoU of 0.7560 while maintaining a reasonable computational load of 12.34 GFLOPs and taking 77.2 s per epoch. This reinforces the substantial standalone value of MLFP. Lastly, the MSFA-only model produced slightly better results than the Auxhead-only version but still underperformed compared to the full model. Despite having relatively low FLOPs (6.42 G) and parameters (10.25 M), the IoU and F1-score were moderate at 0.7218 and 0.8274, respectively. Overall, the results validated the complementary roles of all three modules, with MLFP emerging as the most critical component. While removing modules can yield lower FLOPs and faster inference, this clearly comes at the cost of segmentation accuracy and robustness. The full DeepSwinLite architecture offers the best balance between performance and cost, especially in applications that demand precise boundary delineation.

5. Discussion

The performances of the DeepSwinLite model on both building datasets were compared to those of various SOTA models in the literature. The proposed model’s performance on the Massachusetts dataset surpassed that of most deep learning models, particularly in terms of precision, recall, F1-score, and IoU metrics (Table 6). However, CSA-Net was superior to all models regarding the accuracy measure, where the improvement against the proposed model was about 2%. Despite having a relatively small number of parameters (7.81 million) and the lowest computational complexity (37.17 GFLOPs) among the compared models, DeepSwinLite achieves competitive segmentation performance. This efficiency is especially noteworthy when compared to more complex architectures such as SCTM (271.52 M parameters), MBR-HRNet (31.02 M, 68.71 GFLOPs), and OCANet (38.42 M, 68.45 GFLOPs), which demand significantly higher computational resources. Furthermore, the latest approaches, namely SCANet (F1-score = 0.8629, IoU = 0.7549, 73.2 M parameters) and BuildNext-Net (F1-score = 0.8644, IoU = 0.7612, 31.65 M parameters and 38.45 GFLOPs), as well as CRU-Net (F1-score = 0.8420, IoU = 0.7271) and DFF-Net (F1-score = 0.8420, IoU = 0.7260, 32.15 M parameters and 222.49 GFLOPs), were also incorporated into the comparative analysis. This provides a more up-to-date and comprehensive evaluation of the latest state-of-the-art methods. The results indicate that DeepSwinLite continues to achieve superior segmentation performance, while maintaining substantially lower parameter counts and computational demands, thereby reinforcing its effectiveness and efficiency relative to these most recent architectures. In addition to comparisons with high-complexity models, several lightweight architectures were also included in the benchmark (e.g., LiteST-Net, MBR-HRNet, 3DJA-UNet3+), enabling a fair assessment of DeepSwinLite’s efficiency and performance among similarly resource-conscious models. These models were categorized as lightweight yet high-performing architectures for building extraction by researchers (e.g., [42]).
Considering the WHU building dataset, the proposed model delivered higher segmentation accuracy than most models, specifically SCTM (78.17%), MAFF-HRNet (91.69%), and MDBES-Net (91.78%) (Table 7). The only exception was LiteST-Net, which slightly outperformed the model (0.08%). Differences in design settings in other studies (i.e., the number of training, validation, and test samples) may have contributed to this minor variation in performance.
From a computational complexity perspective, DeepSwinLite demonstrates significant advantages due to its lightweight architecture. Unlike LiteST-Net (18.03 M), MBR-HRNet (31.02 M), and SCTM (271.52 M), it relies on significantly fewer parameters. Moreover, recent models such as SCANet (F1-score = 0.9579, IoU = 0.9161), BuildNext-Net (F1-score = 0.9540, IoU = 0.9121), CRU-Net (F1-score = 0.9526, IoU = 0.9095), and DFF-Net (F1-score = 0.9500, IoU = 0.9050) were also included in the benchmark. Despite their strong performance, DeepSwinLite achieved comparable or superior results with significantly fewer parameters (7.81 M) and lower computational cost (37.17 GFLOPs), thereby ensuring better memory efficiency and making the model particularly suitable for deployment in resource-constrained environments. Moreover, the inclusion of other lightweight architectures in the benchmark enables a balanced evaluation and reinforces the competitiveness of DeepSwinLite in terms of both segmentation performance and computational cost.
Although the proposed model achieves satisfactory results on the Massachusetts and WHU datasets, certain constraints and limitations are acknowledged. Notably, the model is tested on two benchmark datasets, which may limit the generalizability of the results. Further investigations involving diverse building datasets across varying spatial resolutions are planned to comprehensively validate the effectiveness of the model. Furthermore, the WHU dataset is notably extensive, which results in a per-epoch training time of 304 s, a duration that underscores the suitability of the proposed model for large-scale applications. The proposed model performs well in detecting small objects, but in dense urban areas, its performance somewhat deteriorates. Furthermore, some images in the WHU dataset contain strong shadows generated by tall buildings, which can obscure object boundaries and potentially reduce segmentation accuracy. However, the DeepSwinLite model exhibits robustness in such cases thanks to its MSFA and transformer-based backbone capabilities. The components facilitate the distinction between real building structures and shadow effects in the model. Furthermore, data augmentation strategies such as random rotations and normalization were used during training to improve the generalization of the model to shadow-affected areas. This approach was adopted to mitigate the adverse effects of lighting inconsistencies on the prediction quality. In addition, manually correcting the labeling errors in the Massachusetts dataset was laborious.
To ascertain the optimal weighting of the hybrid loss function components, an empirical tuning process was conducted. The coefficients γ and δ, which control the contributions of the auxiliary and main loss terms, respectively, were determined through a series of experiments on the validation set. Through the implementation of iterative testing, a combination of γ = 0.7 and δ = 0.3 was identified as providing an optimal trade-off between training stability and segmentation accuracy. Higher values of γ were observed to overemphasize the auxiliary supervision, potentially leading to overfitting and suboptimal convergence. Conversely, excessively low δ values were shown to reduce the guidance from the main segmentation objective. This configuration was thus adopted in the experiments to ensure a balanced and effective optimization process.
To further assess the robustness of the proposed model, McNemar’s test, a widely used statistical significance test, was conducted between all model pairs on the Massachusetts (Table 8) and WHU (Table 9) building datasets. Contingency tables were constructed using agreement and disagreement counts between predictions and ground truth, and the continuity-corrected Chi-square statistic (χ2) was applied [56,57]. It should be noted that estimated statistical values higher than the critical threshold ( χ 1,0.05 2 = 3.84 ) indicate statistical significance. The results on the Massachusetts dataset (Table 8) confirmed that DeepSwinLite’s superiority was statistically significant in almost all pairwise comparisons (p < 0.05), with the only exception being U-Net, where the margin was weaker but still significant (p = 0.0189). Similarly, on the WHU dataset, the proposed model achieved statistically significant improvements over nearly all models, further demonstrating that the observed performance gains are not only consistent across benchmarks but also statistically reliable and robust.
The integration of automated labeling approaches into the model training pipeline will be explored to enhance data quality and reduce the time required for annotation. The robustness of the model’s generalization will be further validated through testing on datasets from heterogeneous geographical and structural environments. Despite the demonstrated success of deep learning algorithms in RS, it is essential to consider that their predictions may exhibit considerable uncertainty [58,59]. Therefore, deeper insights related to the decision-making process of the model can be provided by leveraging explainable AI techniques, which help to enhance the transparency and comprehensibility of the model [56].

6. Conclusions

A lightweight and robust Swin Transformer-based DL model called DeepSwinLite was proposed in this study for performing effective and high-accurate building footprint extraction. To enhance its capability of distinguishing buildings across different objects, the architecture was supported with MLFP, MSFA, and Auxhead modules. These modules are specifically engineered to enable robust detection of buildings exhibiting diverse scales and structural configurations present in remotely sensed images. Experimental results demonstrate that the proposed DeepSwinLite model outperforms SOTA models on both the Massachusetts and WHU building datasets. The model consistently achieved high IoU, F1-score, recall, precision, and accuracy values, particularly in segmenting small-scale buildings and densely populated urban spaces. Its ability to produce accurate, high-fidelity, and balanced predictions makes it particularly effective for building footprint extraction. As a result of the ablation study, the removal of the MLFP module caused the most significant decrease in model performance, resulting in a significant decrease in IoU and OA values. On the other hand, it was confirmed that the refinement process applied to the Massachusetts dataset directly improved segmentation performance by about 3% in terms of IoU, highlighting the crucial role of data quality in DL-based building extraction tasks. It was found that improved labeling enhances the clarity of boundary delineation and reduces fragmentation. The key advantage of the proposed model is its computational efficiency, requiring fewer FLOPs and parameters compared to other SOTA models, which makes the model particularly suitable for deployment in mobile and resource-constrained systems.
Despite the encouraging findings, this study is not without its limitations. Firstly, the evaluation was restricted to two benchmark datasets (i.e., Massachusetts and WHU), which may not fully represent the diversity of geographic regions, acquisition conditions, or sensor modalities. Secondly, while the model has been demonstrated to show improvements in delineating small building structures, its performance can still be subject to degradation in dense urban environments characterized by heavy shadowing, adjacent buildings, and partial occlusions. Thirdly, the refinement of the Massachusetts dataset was performed manually, a process that is labor-intensive and not easily scalable. Fourthly, it should be noted that the current experiments relied solely on RGB aerial imagery. Incorporating height information (e.g., DSM/LiDAR) or additional sensing modalities (e.g., SAR) could improve discrimination between buildings and spectrally similar surfaces. In conclusion, although DeepSwinLite demonstrates computational efficiency, further compression may be required for the deployment of legacy or highly resource-constrained devices.
Consequently, future research will focus on several key directions to enhance generalization and practical deployment: (i) extending the evaluation to cross-city and cross-sensor datasets to validate robustness under diverse geographic and sensor conditions; (ii) applying domain adaptation and advanced data augmentation techniques to mitigate distribution shifts; (iii) developing shadow- and edge-aware modules together with boundary-preserving loss functions to improve delineation in complex urban settings; (iv) exploring automated label refinement strategies, including weakly supervised and self-supervised approaches, to reduce the reliance on manual annotation; and (v) integrating explainable AI methods to enable systematic failure analysis and promote trustworthy adoption in urban planning and disaster management.

Author Contributions

Conceptualization, E.O.Y. and T.K.; methodology, E.O.Y. and T.K.; software E.O.Y.; validation, E.O.Y.; formal analysis, E.O.Y.; investigation, E.O.Y. and T.K.; data curation, E.O.Y. and T.K.; writing—original draft preparation, E.O.Y.; writing—review and editing, E.O.Y. and T.K.; visualization, E.O.Y.; supervision, T.K. All authors have read and agreed to the published version of the manuscript.

Funding

This research received no external funding.

Data Availability Statement

The authors are grateful to the providers for making publicly available datasets. Codes for DeepSwinLite and a refined version of the Massachusetts building dataset can be accessed via a GitHub repository (available at https://github.com/elifozlemyilmaz/DeepSwinLite 4 August 2025).

Conflicts of Interest

The authors declare no conflicts of interest.

Abbreviations

The following abbreviations are used in this manuscript:
AFActivation Function
APPAdaptive Average Pooling
CECross Entropy
CNNConvolutional Neural Network
DLDeep Learning
FLOPsFloating-Point Operations
FNFalse Negative
FPFalse Positive
GGiga
IoUIntersection over Union
MMillions
MLFPMulti-Level Feature Pyramid
MSFAMulti-Scale Feature Aggregation
OAOverall Accuracy
OSMOpenStreetMap
RGBRed-Green-Blue
RSRemote Sensing
SDGsSustainable Development Goals
sSeconds
SOTAThe State-of-the-Art
TNTrue Negative
TPTrue Positive
VHRVery High-Resolution

References

  1. Chen, C.; Deng, J.; Lv, N. Illegal Constructions Detection in Remote Sensing Images Based on Multi-Scale Semantic Segmentation. In Proceedings of the IEEE International Conference on Smart Internet of Things, Beijing, China, 14–16 August 2020; pp. 300–303. [Google Scholar] [CrossRef]
  2. Hu, Q.; Zhen, L.; Mao, Y.; Zhou, X.; Zhou, G. Automated Building Extraction Using Satellite Remote Sensing Imagery. Autom. Constr. 2021, 123, 103509. [Google Scholar] [CrossRef]
  3. Zhou, W.; Song, Y.; Pan, Z.; Liu, Y.; Hu, Y.; Cui, X. Classification of Urban Construction Land with Worldview-2 Remote Sensing Image Based on Classification and Regression Tree Algorithm. In Proceedings of the IEEE International Conference on Computational Science and Engineering, Guangzhou, China, 21–24 July 2017; pp. 277–283. [Google Scholar] [CrossRef]
  4. Pan, X.Z.; Zhao, Q.G.; Chen, J.; Liang, Y.; Sun, B. Analyzing the Variation of Building Density Using High Spatial Resolution Satellite Images: The Example of Shanghai City. Sensors 2008, 8, 2541–2550. [Google Scholar] [CrossRef] [PubMed]
  5. Li, R.; Zheng, S.; Zhang, C.; Duan, C.; Su, J.; Wang, L.; Atkinson, P.M. Multiattention Network for Semantic Segmentation of Fine-Resolution Remote Sensing Images. IEEE Trans. Geosci. Remote Sens. 2021, 60, 5607713. [Google Scholar] [CrossRef]
  6. Rahnemoonfar, M.; Chowdhury, T.; Murphy, R. RescueNet: A High-Resolution UAV Semantic Segmentation Dataset for Natural Disaster Damage Assessment. Sci. Data 2023, 10, 913. [Google Scholar] [CrossRef]
  7. Huang, J.; Yang, G. Research on Urban Renewal Based on Semantic Segmentation and Spatial Syntax: Taking Wuyishan City as an Example. In Proceedings of the International Conference on Smart Transportation and City Engineering, Chongqing, China, 6–8 December 2024; pp. 1179–1185. [Google Scholar] [CrossRef]
  8. Ma, S.; Zhang, X.; Fan, H.; Li, T. An Infrastructure Segmentation Neural Network for UAV Remote Sensing Images. In Proceedings of the International Conference on Robotics, Intelligent Control and Artificial Intelligence, Hangzhou, China, 1–3 December 2023; pp. 226–231. [Google Scholar] [CrossRef]
  9. Wang, H.; Chen, Y.; Cai, Y.; Chen, L.; Li, Y.; Sotelo, M.A.; Li, Z. SFNet-N: An Improved SFNet Algorithm for Semantic Segmentation of Low-Light Autonomous Driving Road Scenes. IEEE Trans. Intell. Transp. Syst. 2022, 23, 21405–21417. [Google Scholar] [CrossRef]
  10. Chen, J.; Jiang, Y.; Luo, L.; Gong, W. ASF-Net: Adaptive Screening Feature Network for Building Footprint Extraction from Remote-Sensing Images. IEEE Trans. Geosci. Remote Sens. 2022, 60, 4706413. [Google Scholar] [CrossRef]
  11. Haghighi Gashti, E.; Delavar, M.R.; Guan, H.; Li, J. Semantic Segmentation Uncertainty Assessment of Different U-Net Architectures for Extracting Building Footprints. ISPRS Ann. Photogramm. Remote Sens. Spat. Inf. Sci. 2024, 10, 141–148. [Google Scholar] [CrossRef]
  12. Herfort, B.; Lautenbach, S.; Porto de Albuquerque, J.; Anderson, J.; Zipt, A. A Spatio-Temporal Analysis Investigating Completeness and Inequalities of Global Urban Building Data in OpenStreetMap. Nat. Commun. 2023, 14, 3985. [Google Scholar] [CrossRef]
  13. Fang, F.; Zheng, K.; Li, S.; Xu, R.; Hao, Q.; Feng, Y.; Zhou, S. Incorporating Superpixel Context for Extracting Building from High-Resolution Remote Sensing Imagery. IEEE J. Sel. Top. Appl. Earth Obs. Remote Sens. 2023, 17, 1176–1190. [Google Scholar] [CrossRef]
  14. Zhu, X.X.; Tuia, D.; Mou, L.; Xia, G.S.; Zhang, L.; Xu, F.; Fraundorfer, F. Deep Learning in Remote Sensing: A Comprehensive Review and List of Resources. IEEE Geosci. Remote Sens. Mag. 2017, 5, 8–36. [Google Scholar] [CrossRef]
  15. United Nations. Transforming Our World: The 2030 Agenda for Sustainable Development. Available online: https://sdgs.un.org/2030agenda (accessed on 30 June 2025).
  16. Lv, J.; Shen, Q.; Lv, M.; Li, Y.; Shi, L.; Zhang, P. Deep Learning-Based Semantic Segmentation of Remote Sensing Images: A Review. Front. Ecol. Evol. 2023, 11, 1201125. [Google Scholar] [CrossRef]
  17. Huang, L.; Jiang, B.; Lv, S.; Liu, Y.; Fu, Y. Deep-Learning-Based Semantic Segmentation of Remote Sensing Images: A Survey. IEEE J. Sel. Top. Appl. Earth Obs. Remote Sens. 2023, 17, 8370–8396. [Google Scholar] [CrossRef]
  18. Chen, Y.; Bruzzone, L. Toward Open-World Semantic Segmentation of Remote Sensing Images. In Proceedings of the IEEE International Geoscience and Remote Sensing Symposium, Pasadena, CA, USA, 16–21 July 2023. [Google Scholar] [CrossRef]
  19. Liu, S.; Ding, W.; Liu, C.; Liu, Y.; Wang, Y.; Li, H. ERN: Edge Loss Reinforced Semantic Segmentation Network for Remote Sensing Images. Remote Sens. 2018, 10, 1339. [Google Scholar] [CrossRef]
  20. Zhao, D.; Wang, C.; Gao, Y.; Shi, Z.; Xie, F. Semantic Segmentation of Remote Sensing Image Based on Regional Self-Attention Mechanism. IEEE Geosci. Remote Sens. Lett. 2021, 19, 8010305. [Google Scholar] [CrossRef]
  21. Ronneberger, O.; Fischer, P.; Brox, T. U-Net: Convolutional Networks for Biomedical Image Segmentation. In Proceedings of the 18th International Conference on Medical Image Computing and Computer-Assisted Intervention, Munich, Germany, 5–9 October 2015; pp. 234–241. [Google Scholar] [CrossRef]
  22. Chen, L.-C.; Zhu, Y.; Papandreou, G.; Schroff, F.; Adam, H. Encoder-Decoder with Atrous Separable Convolution for Semantic Image Segmentation. In Proceedings of the European Conference on Computer Vision, Munich, Germany, 8–14 September 2018; pp. 801–818. [Google Scholar] [CrossRef]
  23. Xie, E.; Wang, W.; Yu, Z.; Anandkumar, A.; Alvarez, J.M.; Luo, P. SegFormer: Simple and Efficient Design for Semantic Segmentation with Transformers. Adv. Neural Inf. Process. Syst. 2021, 34, 12077–12090. [Google Scholar] [CrossRef]
  24. Li, H.; Xiong, P.; An, J.; Wang, L. Pyramid Attention Network for Semantic Segmentation. arXiv 2018, arXiv:1805.10180. [Google Scholar] [CrossRef]
  25. Fan, T.; Wang, G.; Li, Y.; Wang, H. MA-Net: A Multi-Scale Attention Network for Liver and Tumor Segmentation. IEEE Access 2020, 8, 179656–179665. [Google Scholar] [CrossRef]
  26. Chaurasia, A.; Culurciello, E. LinkNet: Exploiting Encoder Representations for Efficient Semantic Segmentation. In Proceedings of the IEEE Visual Communications and Image Processing, Petersburg, FL, USA, 10–13 December 2017; pp. 1–4. [Google Scholar] [CrossRef]
  27. Xiao, T.; Liu, Y.; Zhou, B.; Jiang, Y.; Sun, J. Unified Perceptual Parsing for Scene Understanding. In Proceedings of the European Conference on Computer Vision, Munich, Germany, 8–14 September 2018; pp. 418–434. [Google Scholar] [CrossRef]
  28. Vaswani, A.; Shazeer, N.; Parmar, N.; Uszkoreit, J.; Jones, L.; Gomez, A.N.; Kaiser, Ł.; Polosukhin, I. Attention Is All You Need. In Proceedings of the Advances in Neural Information Processing Systems 30, Long Beach, CA, USA, 4–9 December 2017; pp. 5998–6008. [Google Scholar] [CrossRef]
  29. Xiao, X.; Guo, W.; Chen, R.; Hui, Y.; Wang, J.; Zhao, H. A Swin Transformer-Based Encoding Booster Integrated in U-Shaped Network for Building Extraction. Remote Sens. 2022, 14, 2611. [Google Scholar] [CrossRef]
  30. Zhang, R.; Zhang, Q.; Zhang, G. SDSC-UNet: Dual Skip Connection ViT-Based U-Shaped Model for Building Extraction. IEEE Geosci. Remote Sens. Lett. 2023, 20, 6005005. [Google Scholar] [CrossRef]
  31. Che, Z.; Shen, L.; Huo, L.; Hu, C.; Wang, Y.; Lu, Y.; Bi, F. MAFF-HRNet: Multi-Attention Feature Fusion HRNet for Building Segmentation in Remote Sensing Images. Remote Sens. 2023, 15, 1382. [Google Scholar] [CrossRef]
  32. Liu, Z.; Lin, Y.; Cao, Y.; Hu, H.; Wei, Y.; Zhang, Z.; Lin, S.; Guo, B. Swin Transformer: Hierarchical Vision Transformer Using Shifted Windows. In Proceedings of the IEEE/CVF International Conference on Computer Vision, Montreal, QC, Canada, 10–17 October 2021; pp. 9993–10002. [Google Scholar] [CrossRef]
  33. Guo, H.; Du, B.; Zhang, L.; Su, X. A coarse-to-fine boundary refinement network for building footprint extraction from remote sensing imagery. ISPRS J. Photogramm. Remote Sens. 2022, 183, 240–252. [Google Scholar] [CrossRef]
  34. Li, Y.; Hong, D.; Li, C.; Yao, J.; Chanussot, J. HD-Net: High-resolution decoupled network for building footprint extraction via deeply supervised body and boundary decomposition. ISPRS J. Photogramm. Remote Sens. 2024, 209, 51–65. [Google Scholar] [CrossRef]
  35. Tang, Q.; Li, Y.; Xu, Y.; Du, B. Enhancing building footprint extraction with partial occlusion by exploring building integrity. IEEE Trans. Geosci. Remote Sens. 2024, 62, 5650814. [Google Scholar] [CrossRef]
  36. Ji, S.; Wei, S.; Lu, M. Fully Convolutional Networks for Multi-Source Building Extraction from an Open Aerial and Satellite Imagery Dataset. IEEE Trans. Geosci. Remote Sens. 2018, 57, 547–586. [Google Scholar] [CrossRef]
  37. Mnih, V. Machine Learning for Aerial Image Labeling. Ph.D. Thesis, University of Toronto, Toronto, ON, Canada, 2013. [Google Scholar]
  38. Haklay, M.; Weber, P. OpenStreetMap: User-Generated Street Maps. IEEE Pervasive Comput. 2008, 7, 12–18. [Google Scholar] [CrossRef]
  39. Khalel, A.; El-Saban, M. Automatic Pixelwise Object Labeling for Aerial Imagery Using Stacked U-Nets. arXiv 2018, arXiv:1803.04953. [Google Scholar] [CrossRef]
  40. Kavzoglu, T.; Tso, B.; Mather, P.M. Classification Methods for Remotely Sensed Data, 3rd ed.; CRC Press: Boca Raton, FL, USA, 2024; pp. 1–350. [Google Scholar]
  41. Kavzoglu, T. Increasing the Accuracy of Neural Network Classification Using Refined Training Data. Environ. Model. Softw. 2009, 24, 850–858. [Google Scholar] [CrossRef]
  42. Yang, D.; Gao, X.; Yang, Y.; Guo, K.; Han, K.; Xu, L. Advances and future prospects in building extraction from high-resolution remote sensing images. IEEE J. Sel. Top. Appl. Earth Obs. Remote Sens. 2025, 18, 6994–7016. [Google Scholar] [CrossRef]
  43. Yu, Y.; Wang, C.; Kou, R.; Wang, H.; Yang, B.; Xu, J.; Fu, Q. Enhancing Building Segmentation with Shadow-Aware Edge Perception. IEEE J. Sel. Top. Appl. Earth Obs. Remote Sens. 2025, 18, 1–12. [Google Scholar] [CrossRef]
  44. Han, J.; Zhan, B. MDBES-Net: Building Extraction from Remote Sensing Images Based on Multiscale Decoupled Body and Edge Supervision Network. IEEE J. Sel. Top. Appl. Earth Obs. Remote Sens. 2023, 17, 519–534. [Google Scholar] [CrossRef]
  45. Yuan, W.; Zhang, X.; Shi, J.; Wang, J. LiteST-Net: A Hybrid Model of Lite Swin Transformer and Convolution for Building Extraction from Remote Sensing Image. Remote Sens. 2023, 15, 1996. [Google Scholar] [CrossRef]
  46. Yan, G.; Jing, H.; Li, H.; Guo, H.; He, S. Enhancing Building Segmentation in Remote Sensing Images: Advanced Multi-Scale Boundary Refinement with MBR-HRNet. Remote Sens. 2023, 15, 3766. [Google Scholar] [CrossRef]
  47. Zhang, B.; Huang, J.; Wu, F.; Zhang, W. OCANet: An Overcomplete Convolutional Attention Network for Building Extraction from High-Resolution Remote Sensing Images. IEEE J. Sel. Top. Appl. Earth Obs. Remote Sens. 2024, 17, 18427–18443. [Google Scholar] [CrossRef]
  48. Ran, S.; Gao, X.; Yang, Y.; Li, S.; Zhang, G.; Wang, P. Building Multi-Feature Fusion Refined Network for Building Extraction from High-Resolution Remote Sensing Images. Remote Sens. 2021, 13, 2794. [Google Scholar] [CrossRef]
  49. Li, S.; Bao, T.; Liu, H.; Deng, R.; Zhang, H. Multilevel Feature Aggregated Network with Instance Contrastive Learning Constraint for Building Extraction. Remote Sens. 2023, 15, 2585. [Google Scholar] [CrossRef]
  50. Li, Y.; Li, Y.; Zhu, X.; Fang, H.; Ye, L. A Method for Extracting Buildings from Remote Sensing Images Based on 3DJA-UNet3+. Sci. Rep. 2024, 14, 19067. [Google Scholar] [CrossRef] [PubMed]
  51. Yang, D.; Gao, X.; Yang, Y.; Jiang, M.; Guo, K.; Liu, B. CSA-Net: Complex Scenarios Adaptive Network for Building Extraction for Remote Sensing Images. IEEE J. Sel. Top. Appl. Earth Obs. Remote Sens. 2024, 17, 938–953. [Google Scholar] [CrossRef]
  52. Wang, Z.; Liu, Y.; Li, J.; Zhang, X.; Zhang, Y.; Wu, Q.; Wang, H. SCANet: Split Coordinate Attention Network for Building Footprint Extraction. arXiv 2025, arXiv:2507.20809. [Google Scholar] [CrossRef]
  53. OuYang, C.; Li, H. BuildNext-Net: A Network Based on Self-Attention and Equipped with an Efficient Decoder for Extracting Buildings from High-Resolution Remote Sensing Images. IEEE J. Sel. Top. Appl. Earth Obs. Remote Sens. 2025, 18, 16385–16402. [Google Scholar] [CrossRef]
  54. Chen, Z.; Chen, W.; Zheng, J.; Ding, Y. CRU-Net: An Innovative Network for Building Extraction from Remote Sensing Images Based on Channel Enhancement and Multiscale Spatial Attention with ResNet. Concurr. Comput. Pract. Exp. 2025, 37, e70249. [Google Scholar] [CrossRef]
  55. Chen, J.; Liu, B.; Yu, A.; Quan, Y.; Li, T.; Guo, W. Depth Feature Fusion Network for Building Extraction in Remote Sensing Images. IEEE J. Sel. Top. Appl. Earth Obs. Remote Sens. 2024, 17, 16577–16591. [Google Scholar] [CrossRef]
  56. Teke, A.; Kavzoglu, T. Exploring the Decision-Making Process of Ensemble Learning Algorithms in Landslide Susceptibility Mapping: Insights from Local and Global Explainable AI Analyses. Adv. Space Res. 2024, 74, 3765–3785. [Google Scholar] [CrossRef]
  57. Kavzoglu, T.; Bilucan, F. Effects of Auxiliary and Ancillary Data on LULC Classification in A Heterogeneous Environment Using Optimized Random Forest Algorithm. Earth Sci. Inform. 2023, 16, 415–435. [Google Scholar] [CrossRef]
  58. Kavzoglu, T.; Uzun, Y.K.; Berkan, E.; Yilmaz, E.O. Global-Scale Explainable AI Assessment for OBIA-Based Classification Using Deep Learning and Machine Learning Methods. Adv. Geod. Geoinf. 2025, 74, e62. [Google Scholar] [CrossRef]
  59. Yilmaz, E.O.; Uzun, Y.K.; Berkan, E.; Kavzoglu, T. Integration of LIME with Segmentation Techniques for SVM Classification in Sentinel-2 Imagery. Adv. Geod. Geoinf. 2025, 74, e61. [Google Scholar] [CrossRef]
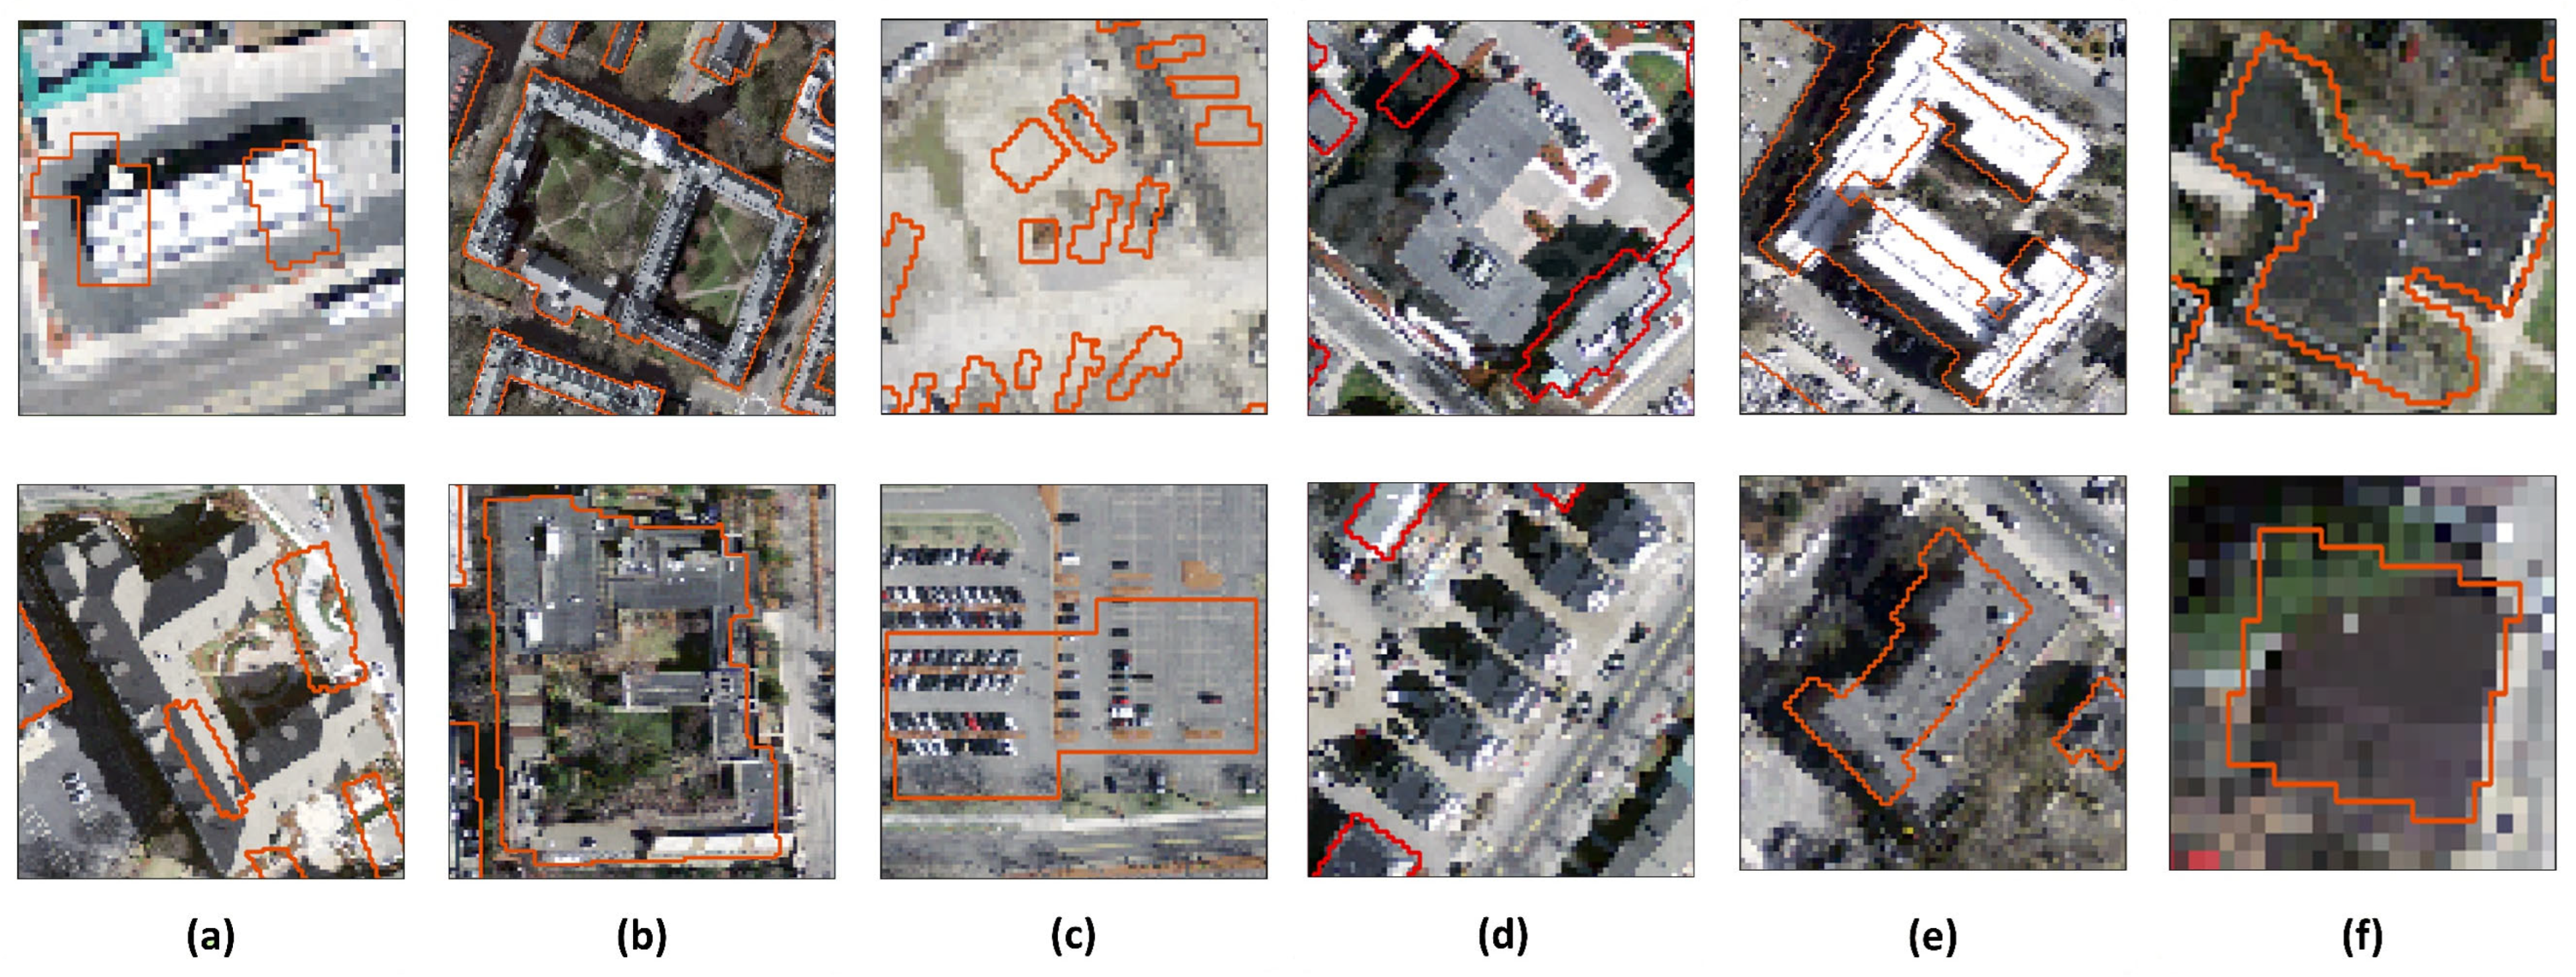
Figure 1. Annotation error types observed in the Massachusetts building dataset: (a) incorrect labeling, (b) inclusion of non-building areas (e.g., courtyards), (c) false positive predictions, (d) missing labels, (e) spatial misalignment, and (f) object contamination.
Remotesensing 17 03146 g001
Figure 2. Detailed description of DeepSwinLite architecture. The model consists of a Swin Transformer Backbone, MLFP module, MSFA module, Decoder, and AuxHead module. Arrows indicate the flow of the model through the modules.
Remotesensing 17 03146 g002
Figure 3. Detailed view of the multi-level feature pyramid module.
Remotesensing 17 03146 g003
Figure 4. Multi-scale feature aggregation module.
Remotesensing 17 03146 g004
Figure 5. Schematic representation of the AuxHead Module, which is also outlined in Figure 2 as part of the overall DeepSwinLite architecture.
Remotesensing 17 03146 g005
Figure 6. Building footprint extraction results for the Massachusetts building dataset using the proposed and SOTA models. Note that the red boxes highlight regions with noticeable differences in building delineation quality among the models, especially near complex boundaries and shadowed regions.
Remotesensing 17 03146 g006
Figure 7. Building footprint extraction results for the WHU building dataset using the proposed and SOTA models. Note that the red boxes highlight regions with noticeable differences in building delineation quality among the models, especially near complex boundaries or shadowed regions.
Remotesensing 17 03146 g007
Figure 8. Visual analysis of segmentation quality for the refined Massachusetts building dataset for all models. Note that the red boxes highlight regions with noticeable differences in building delineation quality among the models, especially near complex boundaries or shadowed regions.
Remotesensing 17 03146 g008
Figure 9. Comparison of DeepSwinLite’s results using the original and refined ground truths. From left to right: input image, original annotation and prediction, refined annotation and prediction.
Remotesensing 17 03146 g009
Table 1. Performance comparison for the proposed and SOTA models using the Massachusetts building dataset (%). Note that bold values indicate the best results.
ModelPrecisionRecallIoUF1-ScoreAccuracy
U-Net [21]87.2686.0577.4786.6492.27
DeeplabV3+ [22]86.1481.6073.3683.6090.95
SegFormer [23]87.1983.4275.4185.1391.70
UperNet [27]86.3684.4275.6685.3491.62
PAN [24]82.8177.1769.7880.2192.26
MANet [25]85.6586.8776.8586.2491.78
LinkNet [26]87.1084.5476.2285.7491.91
DeepSwinLite87.9886.0377.9486.9692.54
Table 2. Performance comparison for the proposed and SOTA models using the WHU building dataset (%). Note that bold values indicate the best results.
ModelPrecisionRecallIoUF1-ScoreAccuracy
U-Net [21]93.8995.9290.5294.8797.93
DeeplabV3+ [22]95.1694.8290.7294.9998.03
SegFormer [23]93.7794.7389.4594.2497.70
UperNet [27]96.4093.6990.7394.9998.08
PAN [24]95.5393.6289.9694.5497.89
MANet [25]94.2995.6990.6994.9797.98
LinkNet [26]95.3894.6990.7995.0398.05
DeepSwinLite95.4796.0292.0295.7498.32
Table 3. Performance comparison for the proposed and SOTA models using the refined Massachusetts building dataset (%). Note that bold values indicate the best results.
ModelPrecisionRecallIoUF1-ScoreAccuracy
U-Net [21]89.6885.6979.0387.5394.35
DeeplabV3+ [22]88.8483.8777.0686.1193.79
SegFormer [23]88.3584.9377.6186.5293.85
UperNet [27]88.6884.1377.1886.2093.80
PAN [24]87.5983.1375.7685.1593.33
MANet [25]87.6283.7876.2985.5593.45
LinkNet [26]88.1385.2977.7586.6393.86
DeepSwinLite90.4486.1479.8688.1194.63
Table 4. Evaluation of computational cost for the Massachusetts and WHU datasets.
ModelFLOPs
(G)
Param.
(M)
Epoch Time (s/epoch)
MassachusettsWHU
U-Net [21]42.8732.52130.0346.0
DeeplabV3+ [22]36.9126.68119.0326.0
SegFormer [23]21.1924.70149.0583.0
UperNet [27]29.0125.57112.0586.0
PAN [24]34.9224.2693.0310.0
MANet [25]74.65147.4498.0335.0
LinkNet [26]43.1531.18120.0350.0
DeepSwinLite37.177.8196.0304.0
Table 5. Results of the ablation study (%).
Model
Configuration
PrecisionRecallIoUF1-ScoreAccuracyFLOPs
(G)
Param.
(M)
Epoch Time (s/epoch)
DeepSwinLite87.9886.0377.9486.9692.5437.177.8196.0
w/o Auxhead88.4484.2076.7786.1092.2835.967.74114.0
w/o MLFP83.6678.8969.9780.9589.596.4410.3398.0
w/o MSFA86.7284.6576.6985.6490.0613.546.3785.0
w Auxhead only84.5380.5472.3382.3692.925.616.9669.4
w MLFP only87.1183.0675.6084.9293.9312.346.3077.2
w MSFA only83.9781.6672.1882.7490.196.4210.2566.0
Table 6. Performance comparison with SOTA models using the Massachusetts building dataset (%). Note that the results of the other models are taken from their original publications and may be based on different experimental conditions, including training procedures and data splits (bold values indicate the best results).
ModelPrecisionRecallF1-ScoreAccuracyIoUParam.
(M)
FLOPs
(G)
DeepSwinLite87.9886.0386.9692.5477.947.8137.17
SCTM [43]---87.6669.71271.52-
MDBES-Net [44]86.8884.2185.52-75.5526.42-
LiteST-Net [45]--76.1092.5076.5018.03-
MBR-HRNet [46]86.4080.8583.53-70.9731.0268.71
OCANet [47]84.4881.4282.92-70.8238.4268.45
BMFR-Net [48]85.3984.8985.1494.4674.1220.00-
MFA-Net [49]87.1183.8485.44-74.58--
3DJA-UNet3+ [50]--86.9692.0477.8616.05-
MAFF-HRNet [2]83.1579.2981.17-68.32--
CSA-Net [51]87.2782.4484.7994.4773.5920.0040.10
SCANet [52]88.3884.3086.29-75.4973.2-
BuildNext-Net [53]88.0184.9286.4495.2776.1231.6538.45
CRU-Net [54]86.7881.7784.20-72.71--
DFF-Net [55]87.2081.3084.20 72.6032.15222.49
Table 7. Performance comparison with SOTA models using the WHU building dataset (%). Note that the results of the other models are taken from their original publications and may be based on different experimental conditions, including training procedures and data splits (bold values indicate the best results).
ModelPrecisionRecallF1-ScoreAccuracyIoUParam.
(M)
FLOPs
(G)
DeepSwinLite95.4796.0295.7498.3292.027.8137.17
SCTM [43]---89.7578.17271.52-
MDBES-Net [44]95.7495.6395.68-91.7826.42-
LiteST-Net [45]--92.5098.4092.1018.30-
MBR-HRNet [46]95.4894.8895.18-91.3131.0268.71
OCANet [47]95.4094.5394.96-90.4138.4268.45
BMFR-Net [48]94.3194.4294.3698.7489.3220.00-
MFA-Net [49]94.6496.0295.33-91.07--
3DJA-UNet3+ [50]--95.1598.0791.1316.05-
MAFF-HRNet [2]95.9095.4395.66-91.69--
CSA-Net [51]95.4193.8094.6098.8189.7520.0040.10
SCANet [52]95.9295.6795.79-91.6173.2-
BuildNext-Net [53]95.3195.4995.4098.9791.2131.6538.45
CRU-Net [54]93.1597.4795.26-90.95--
DFF-Net [55]95.4094.6095.00-90.5032.15222.49
Table 8. McNemar’s test results for pairwise comparisons on the Massachusetts Building dataset. Note that b denotes the number of cases where Model A was correct (✓) and Model B was incorrect (✗), while c denotes the number of cases where Model A was incorrect and Model B was correct. The χ2 (cc) column reports the continuity-corrected chi-square statistic from McNemar’s test.
Model AModel Bb (A✓, B✗)c (A✗, B✓)χ2 (cc)p-ValueSignificance
DeepSwinLiteDeeplabV3+86,10658,0445462.50<0.001Yes
DeepSwinLitePAN65,277119,17726,762.05<0.001Yes
DeepSwinLiteUperNet79,16460,0112635.52<0.001Yes
DeepSwinLiteMANet80,93463,51231,347.21<0.001Yes
DeepSwinLiteSegFormer71,11399,987592.21<0.001Yes
DeepSwinLiteLinkNet63,144120,670542.15<0.001Yes
DeepSwinLiteU-Net61,11760,2985.510.0189Yes
Table 9. McNemar’s test results for pairwise comparisons on the WHU Building dataset (notation of b, c, and χ2 (cc) is the same as in Table 8).
Model AModel Bb (A✓, B✗)c (A✗, B✓)χ2 (cc)p-ValueSignificance
DeepSwinLitePAN25,15717,3861419.10<0.001Yes
DeepSwinLiteSegFormer25,20618,2501113.12<0.001Yes
DeepSwinLiteU-Net22,50818,613368.74<0.001Yes
DeepSwinLiteMANet16,60920,249359.27<0.001Yes
DeepSwinLiteUperNet20,31822,35597.14<0.001Yes
DeepSwinLiteDeeplabV3+19,87818,44153.81<0.001Yes
DeepSwinLiteLinkNet17,70618,2608.500.0035Yes
Disclaimer/Publisher’s Note: The statements, opinions and data contained in all publications are solely those of the individual author(s) and contributor(s) and not of MDPI and/or the editor(s). MDPI and/or the editor(s) disclaim responsibility for any injury to people or property resulting from any ideas, methods, instructions or products referred to in the content.