Article

MSSA: A Multi-Scale Semantic-Aware Method for Remote Sensing Image–Text Retrieval

School of Software, Yunnan University, Kunming 650091, China
*
Author to whom correspondence should be addressed.
Remote Sens. 2025, 17(19), 3341; https://doi.org/10.3390/rs17193341
Submission received: 11 August 2025 / Revised: 23 September 2025 / Accepted: 24 September 2025 / Published: 30 September 2025
(This article belongs to the Section Remote Sensing Image Processing)

Abstract

Highlights

What are the main findings?
  • This study introduces a Multi-Scale Semantic-Aware Remote Sensing Image—Text Retrieval method (MSSA) that combines the Progressive Spatial Channel Joint Attention (PSCJA), Image-Guided Text Attention (IGTA), and Cross-Modal Semantic Extraction (CMSE), achieving advancements in cross-modal semantic alignment.
  • By synergistically enhancing multi-scale features and applying hierarchical perception of cross-modal semantics, MSSA effectively narrows the semantic gap between visual and linguistic representations, leading to improved retrieval accuracy. Experimental results confirm the method’s superior performance on the UCM Caption, RSITMD, and RSICD datasets.
What is the implication of the main finding?
  • MSSA presents a novel framework for cross-modal retrieval, resolving issues related to the inadequate representation of local details and global structures in remote sensing images, as well as inadequacies in cross-modal semantic alignment. This offers valuable insights for future research.
  • The attention mechanisms and CMSE module in MSSA may have transferable applications to other tasks involving multi-scale objects, such as general or medical image—text matching.

Abstract

In recent years, the convenience and potential for information extraction offered by Remote Sensing Image–Text Retrieval (RSITR) have made it a significant focus of research in remote sensing (RS) knowledge services. Current mainstream methods for RSITR generally align fused image features at multiple scales with textual features, primarily focusing on the local information of RS images while neglecting potential semantic information. This results in insufficient alignment in the cross-modal semantic space. To overcome this limitation, we propose a Multi-Scale Semantic-Aware Remote Sensing Image–Text Retrieval method (MSSA). This method introduces Progressive Spatial Channel Joint Attention (PSCJA), which enhances the expressive capability of multi-scale image features through Window-Region-Global Progressive Attention (WRGPA) and Segmented Channel Attention (SCA). Additionally, the Image-Guided Text Attention (IGTA) mechanism dynamically adjust textual attention weights based on visual context. Furthermore, the Cross-Modal Semantic Extraction Module (CMSE) incorporated learnable semantic tokens at each scale, enabling attention interaction between multi-scale features of different modalities and the capturing of hierarchical semantic associations. This multi-scale semantic-guided retrieval method ensures cross-modal semantic consistency, significantly improving the accuracy of cross-modal retrieval in RS. MSSA demonstrates superior retrieval accuracy in experiments across three baseline datasets, achieving a new state-of-the-art performance.

1. Introduction

Remote sensing images are geospatial representations captured by remote sensing devices such as drones, airplanes, and satellites. Modern technological evolution has brought about a massive surge in high-resolution RS images, which have become an essential data source for numerous fields, covering areas such as monitoring environmental changes, planning urban development, and managing disaster responses. Therefore, effectively retrieving valuable information from extensive RS image repositories through text searches is essential for mining RS data and delivering knowledge-based services. In the early stage, RS image retrieval primarily relied on manual annotation, with experienced experts performing land cover classification and feature extraction. As deep learning and machine learning continue to advance at a swift pace, along with the creation of multiple standardized RS image datasets, it facilitated the integration of emerging technologies such as CNNs [1], Transformer [2], and GANs [3] into RSITR.
Considering the large number and often small size of targets in RS images, feature extraction at a single scale typically struggles to fully capture the diverse and detailed information about land cover. Thus, the fusion of features at multiple scales has proven to be a highly effective approach for enhancing retrieval performance. Such approaches generally utilize a dual-branch architecture [4,5,6,7,8,9,10,11], with one branch dedicated to extracting multi-scale image features and fusing them through certain strategies, while another branch employs a text encoder to extract text features. Subsequently, a process of comprehensive alignment is carried out to integrate the multi-scale fused visual features with linguistic representations, facilitating the achievement of cross-modal retrieval. For instance, Pan et al. [12] developed an approach that utilizes both multi-scale visual feature fusion and coarse-level text enhancement to strengthen text semantics and align with visual information. Yuan et al. [13] developed a novel approach where hierarchical visual attention mechanisms effectively capture discriminative visual features, and these features are subsequently applied to steer the process of text depiction. Zheng et al. [14] proposed a bidirectional scale decoupling module for selective multi-scale feature extraction with inter-scale interference suppression.
Despite the promising results achieved by these methods in RSITR tasks, two critical issues remain: First, they overlook the feature enhancement across different scales for both images and text, failing to fully exploit the potential information of hierarchical features. Features in RS images convey a wealth of information ranging from regional environmental characteristics to detailed object features in smaller areas; similarly, text features exhibit a hierarchical difference from general concepts to specific descriptions. The lack of attention to feature diversity and hierarchy probably result in critical information being overlooked, adversely affecting the model’s recognition and retrieval capabilities. Second, existing methods inadequately consider the semantic information at various levels of images and sentences. They only perform alignment between the image features fused at multi-scales with text features, limiting the modeling capacity for complex cross-modal semantic relationships and the dynamic changes of these relationships. For example, specific features in RS images can be described not only by color and shape but also by their contextual relationships, such as the presence of adjacent features. A sentence “a building next to a grassland“ carries significant more information than the keyword “grassland”, as it conveys a relationship between the building and the grassland. Exclusive reliance on global feature alignment may lead to a loss of semantic details and ambiguities in alignment relationships, leading to suboptimal retrieval results that do not satisfy the requirements of practical applications.
In order to tackle these limitations, this paper proposes a Multi-Scale Semantic-Aware Remote Sensing Image–Text Retrieval method, referred to as MSSA. This method first extracts three groups of multi-scale RS image and text features through Dual-Branch Feature Encoding (DBFE). Then, within the Cross-Modal Semantic-Aware Module (CMSAM), it enhances feature representation through Progressive Spatial Channel Joint Attention (PSCJA) and Image-Guided Text Attention Mechanism (IGTA), and designs a Cross-Modal Semantic Extraction (CMSE) module to probe the underlying connections between visual and textual features to enhance their semantic consistency. Specifically, PSCJA progressively encodes features in both spatial and channel dimensions using Window-Region-Global Progressive Attention (WRGPA) and Segmented Channel Attention (SCA), which substantially enhances the model’s capability in capturing local details and global structures in RS images. This hierarchical feature learning mechanism enables the model to extract key visual information accurately, thereby enhancing the representational power of multi-scale image features and improving the model’s perception in handling complex RS scenes. IGTA focuses on enhancing text features, treating text representations as query vectors, while image representations act as both key vectors and value vectors, performing attention-based interactions. This process allows the model to dynamically allocate attention weights based on visual context, selectively reinforcing text features which are closely related to the image content. This significantly improves the expressiveness of text features while also effectively reducing interference from irrelevant information. The CMSE introduces a set of learnable semantic tokens for each modality at different scales, and based on a cross-attention mechanism, achieves the learning and extraction of rich multi-scale cross-modal semantics. This module can effectively capture semantic cues from different modalities, enhancing the alignment of semantic-level features. Finally, the Multi-Scale Semantic Fusion Module (MSFM) integrates the obtained semantic clues to acquire image and text representations for the final matching. The key contributions in this work are summarized below.
  • We propose a Multi-Scale Semantic-Aware Remote Sensing Image–Text Retrieval method (MSSA) that explicitly models semantic alignment between visual and textual modalities at multiple scales. MSSA integrates multi-scale complementary image–text information and rich semantic clues through intra-modal feature enhancement and cross-modal semantic extraction, producing more discriminative, fine-grained matches and thereby improving the accuracy of cross-modal RSITR.
  • We devise a innovative Progressive Spatial Channel Joint Attention (PSCJA) mechanism that jointly and progressively encodes features along spatial and channel dimensions via two complementary modules: Window-Region-Global Progressive Attention (WRGPA) and Segmented Channel Attention (SCA). By coupling progressive spatial aggregation with segmented channel modulation, PSCJA constructs dynamic multi-scale feature representations, especially suitable for complex scenes with large areas and low feature contrast, effectively reducing misjudgment rates.
  • We design a Cross-Modal Semantic Extraction Module (CMSE), which introduces a set of learnable semantic tokens for multi-scale cross-modal features. Each set of tokens interacts with the corresponding scale features to extract semantic descriptors from images and texts through attention interaction, providing representations for establishing scale aware semantic alignment, reducing dependence on direct matching of dense features, and improving robustness to scale changes.
  • The MSSA method achieves mR values of 56.16%, 45.40%, and 32.43% on the UCM Caption, RSITMD and RSICD, respectively, which are 4.05%, 6.08%, and 4.83% higher than the current leading method, demonstrating a significant improvement over existing methods and setting new state-of-the-art benchmarks.

2. Related Work

2.1. Remote Sensing Image–Text Retrieval

RSITR fundamentally involves analysis and processing of RS images, such as satellite or aerial photography, to identify corresponding textual information associated with these images, or to retrieve images from extensive databases based on user-generated text queries. Due to significant modality differences between images and text data, accurately capturing and integrating information from both modalities has emerged as a critical challenge in cross-modal retrieval. In response, researchers have sequentially proposed various methods that have garnered widespread attention. Zheng et al. [14] developed a bidirectional scale-decoupling module to adaptively extract latent features while suppressing interference from other scales. Yuan et al. [15] proposed a novel RSITR architecture that leveraged both comprehensive and localized information. This framework incorporates a dynamic fusion module for multi-level information, which corrects global information with local details and enriches local information with global context. Rahhal et al. [16] designed a multilingual framework based on a Transformer that supports retrieval in four distinct languages. Yang et al. [17] crafted a multi-scale cross-modal alignment Transformer that aligns images and text at distinct scales separately. Zhong et al. [18] introduced a new RSITR method by integrating multi-scale information from RS images to strengthen the expression of target information, thereby enhancing retrieval accuracy. Hu et al. [19] proposed an end-to-end framework aimed at alleviating the granularity discrepancies between RS images and text through prompt-based feature aggregation and text-guided visual modulation; they also introduced an effective mixed cross-modal loss to address challenges posed by high similarity, thereby achieving more accurate image–text matching. Guan et al. [20] focused on the positional correspondence between image regions and text descriptions, specifically proposing a cross-modal location information reconstruction task to learn the position-aware correlation between modalities, achieving a good balance between performance and efficiency. Chen et al. [21] proposed a relevance-guided adaptive learning method called RGAL to address the issue of incomplete semantic alignment between RSITR, where images are rich in details while the corresponding text is often abstract. Sun et al. [22] proposed a remote sensing cross-modal image pre-alignment method that integrates global and local information by introducing the Gswin transformation block and the pre-alignment mechanism to enhance retrieval accuracy. Zhang et al. [23] developed a patch classification framework based on feature similarity, which reduces interference from large targets by establishing different receptive fields in the feature space, thereby enhancing the ability to extract features from small targets.
The aforementioned works proposed targeted solutions for feature extraction, feature fusion, cross-modal feature granularity discrepancies, and semantic alignment specific to the RSITR task. In contrast to these studies, this paper approaches the problem from the perspective of collaborative enhancement of multi-scale features and hierarchical perception of cross-modal semantics. Building upon this principle, we propose a multi-scale semantic-aware retrieval framework.

2.2. Attention-Based Feature Representation in RS

In the RSITR task, a core requirement for image representation is the effective adaptation to the features of large-sized, multi-target, and multi-scale RS images, accurately capturing the spatial associations between detailed textures, object-level entities, and scene-level patterns. The visual attention mechanism has become a key technology to meet this requirement due to its capability for modeling long-range dependencies. In recent years, Transformer [2] has gained widespread application in the field of computer vision, gradually overcoming the limitations of CNNs [1] in capturing long-range associations. The core advantages of parallel computation and long-range dependency handling are both achieved through the self-attention mechanism, providing technical support for the representation of RS images. Dosovitskiy et al. [24] first introduced the Transformer to visual tasks, achieving global attention interaction by dividing images into fixed-size patches. However, the computational complexity is too high, making it difficult to balance inference efficiency with the need for multi-target capture. Liu et al. [25] adopted a hierarchical construction method using CNNs and innovatively designed a window attention mechanism. This effectively balances the receptive field and computational cost; however, the fixed window size struggles to accommodate the scale differences between small and large targets in RS scenes, which can lead to the loss of relevant information across windows. Yan et al. [26] emphasize the fusion of modal features from ultra-high-resolution RS images and the capture of boundary details. They enhance segmentation accuracy by deeply integrating multimodal features and cross-modal contextual information. Zhan et al. [27] integrated dual temporal features in their attention mechanism, addressing the problem of insufficient fusion of temporal information and semantic details in traditional algorithms. Zhu et al. [28] proposed a multi-task joint learning framework for image–text segmentation and retrieval, refining foreground features and filtering background noise through the introduction of a semantically guided spatial attention mechanism, thus effectively improving retrieval performance. Wu et al. [29] introduced a pseudo-region generation module that adaptively clusters grid features to achieve fine-grained perception of local objects, enhancing the model’s ability to understand the semantic information in RS images. Yang et al. [30] proposed an attention calibration and filtering mechanism to address potential misalignments and irrelevant information between images and text descriptions.
However, these existing approaches lack a semantic modeling framework that effectively integrates the multi-scale hierarchical features and spatial channel interactions of RS images, consequently limiting their capacity to fully satisfy the demands of the RSITR task.

2.3. Remote Sensing Cross-Modal Semantic Modeling

Extracting semantic information from images has a significant impact on accurately identifying and matching the features of RS images with textual descriptions, thereby facilitating deeper contextual understanding and cross-modal learning [31,32,33,34]. In the past few years, a wide range of studies have focused on the semantic understanding of RS images. By way of example, Cheng et al. [35] constructed a deep neural network intended for aligning semantics, which employs attention mechanism to improve the link between images and associated text and uses a gating mechanism to filter out irrelevant data in order to achieve distinct visual representations. Zheng et al. [14] addressed scale and semantic decoupling in RSITR, designing a label-supervised semantic decoupling module to highlight essential semantic information. Lee et al. [36] developed a framework that dynamically associates image regions with relevant textual elements through similarity, subsequently performing multi-level semantic distillation by contrasting local and global linguistic representations. Zheng et al. [10] developed a new cross-attention model that leverages regional semantic characteristics of RS images in image–text retrieval. Sun et al. [37] designed a strong–weak prompt generation module that utilizes attention mechanism and pre-trained classification model to generate fine-grained and global category semantic prompts, significantly improving the model’s retrieval performance. Wang et al. [38] proposed a graph-based hierarchical semantic consistency network that effectively integrates this. In the past few years, a wide range of studies have focused on the semantic understanding in RS image and text channel information through graph node communication, Unimodal Graph Aggregation, and Cross-Modal Graph Aggregation modules. Zheng et al. [39] introduced a Whole-Semantic Sparse Coding Network (WSSCN), which constructs a robust semantic library and an overall semantic sparse representation coding module to achieve multi-semantic decoupling and precise semantic sparse feature expression.
These works provide effective strategies for semantic understanding in RSITR from the perspectives of semantic alignment, decoupling, prompt generation, and fusion. However, given the specific characteristics of RS scenarios and the deep requirements of cross-modal integration, issues such as insufficient hierarchical semantic coverage and inadequate cross-modal semantic alignment still exist. This suggests that there is still considerable room for enhancing matching performance.
The studies mentioned above have devised targeted solutions for specific challenges, demonstrating their effectiveness. Building upon this foundation, we propose MSSA, a novel framework that substantially enhances feature representation for RS images and text, strengthens multi-scale semantic awareness, and improves cross-modal feature alignment. The core innovation of MSSA is the Cross-Modal Semantic-Aware Module (CMSAM), which includes three key components: First, the PSCJA, which effectively captures multi-scale features by gradually fusing information from different spaces and channels. Second, the IGTA, which aims to enhance the expressiveness of text features, empowering the model to concentrate more closely on text features that correspond to unique image content. Finally, the CMSE module introduces learnable semantic tokens and aligns the semantic spaces for imagery and textual data based on the cross-attention.

3. Preliminaries

Self-Attention enables the model to take into account the relationship between each element in the sequence during encoding. This mechanism empowers the model to concentrate on information at various locations in the input sequence and capture global dependencies. Assuming the input visual feature X R N × C , where N signifies the count of tokens, while C represents the channel number. This mechanism is expressed as follows:
head i = Softmax Q i ( K i ) T d k V i
A self ( X ) = Concat ( head 1 , head 2 , , head h )
Here, Q i = X i × W i Q , K i = X i × W i K , V i = X i × W i v (i = 1, 2,…, h) represent visual feature with the shape of N × d k , X i is the i-th head of the input feature, and W i refers the projection matrix. The variable h indicates the number of heads, each of which has a dimensionality of d k = C / h , and this value is employed to scale the dot product to avoid excessively large values.
Window-Attention is a simplification and improvement of Self-Attention, which restricts the range of attention calculations to reduce computational complexity and improve efficiency. In Window-Attention, the feature map I R H × W × C is evenly divided into n local windows in a non-overlapping manner, with the default window size of M = 7 × 7. Its computational form is as follows:
W 1 , W 2 , , W n = Split ( I ) , W i R M × C , i = 1 , , n
Win i = A window ( W i ) = Softmax Q i ( K i ) T d k V i
I = Merge ( Win 1 , Win 2 , , Win n )
where Split is used to evenly divide the feature map into n local windows. Q i , K i , V i represent the visual features of the i-th window, they are calculated solely within the current window rather than across the entire feature map. For the i-th window, the attention output is denoted as Wini. Merge is utilized to integrate the outputs of window-attention back into the feature map.
Cross-Attention amalgamates information from different feature sources, which is crucial for cross-modal learning. Assuming there are two input feature sets, X a and X b , this mechanism performs attention computation by matching the query vector from one feature set with the key vector and value vector from the other feature set. This can be defined by the following formula:
A cross ( X a , X b ) = Softmax Q a ( K b ) T d k V b
Here, Q a originates from the feature set X a , while K b and V b are derived from the feature set X b . This mechanism allows for the effective integration of information from multiple sources, which in turn boosts the model’s expression and generalization ability.
Channel-Attention focuses on learning the importance distribution across feature map channels. Each channel functions as a “filter” for specific features, capturing distinct patterns or characteristics in images. This mechanism enhances the importance of significant channels while diminishing the impact of less critical ones by allocating different weights to each channel. The formal representation is given by the following:
A channel ( X ) = Softmax ( K i ) T V i d ( Q i ) T
where Q i , K i , V i are derived through linear projection of the channel dimension. This mechanism fundamentally aims to adjust the “attention” of each channel to enable the network to concentrate better on important features.

4. Method

4.1. Overview

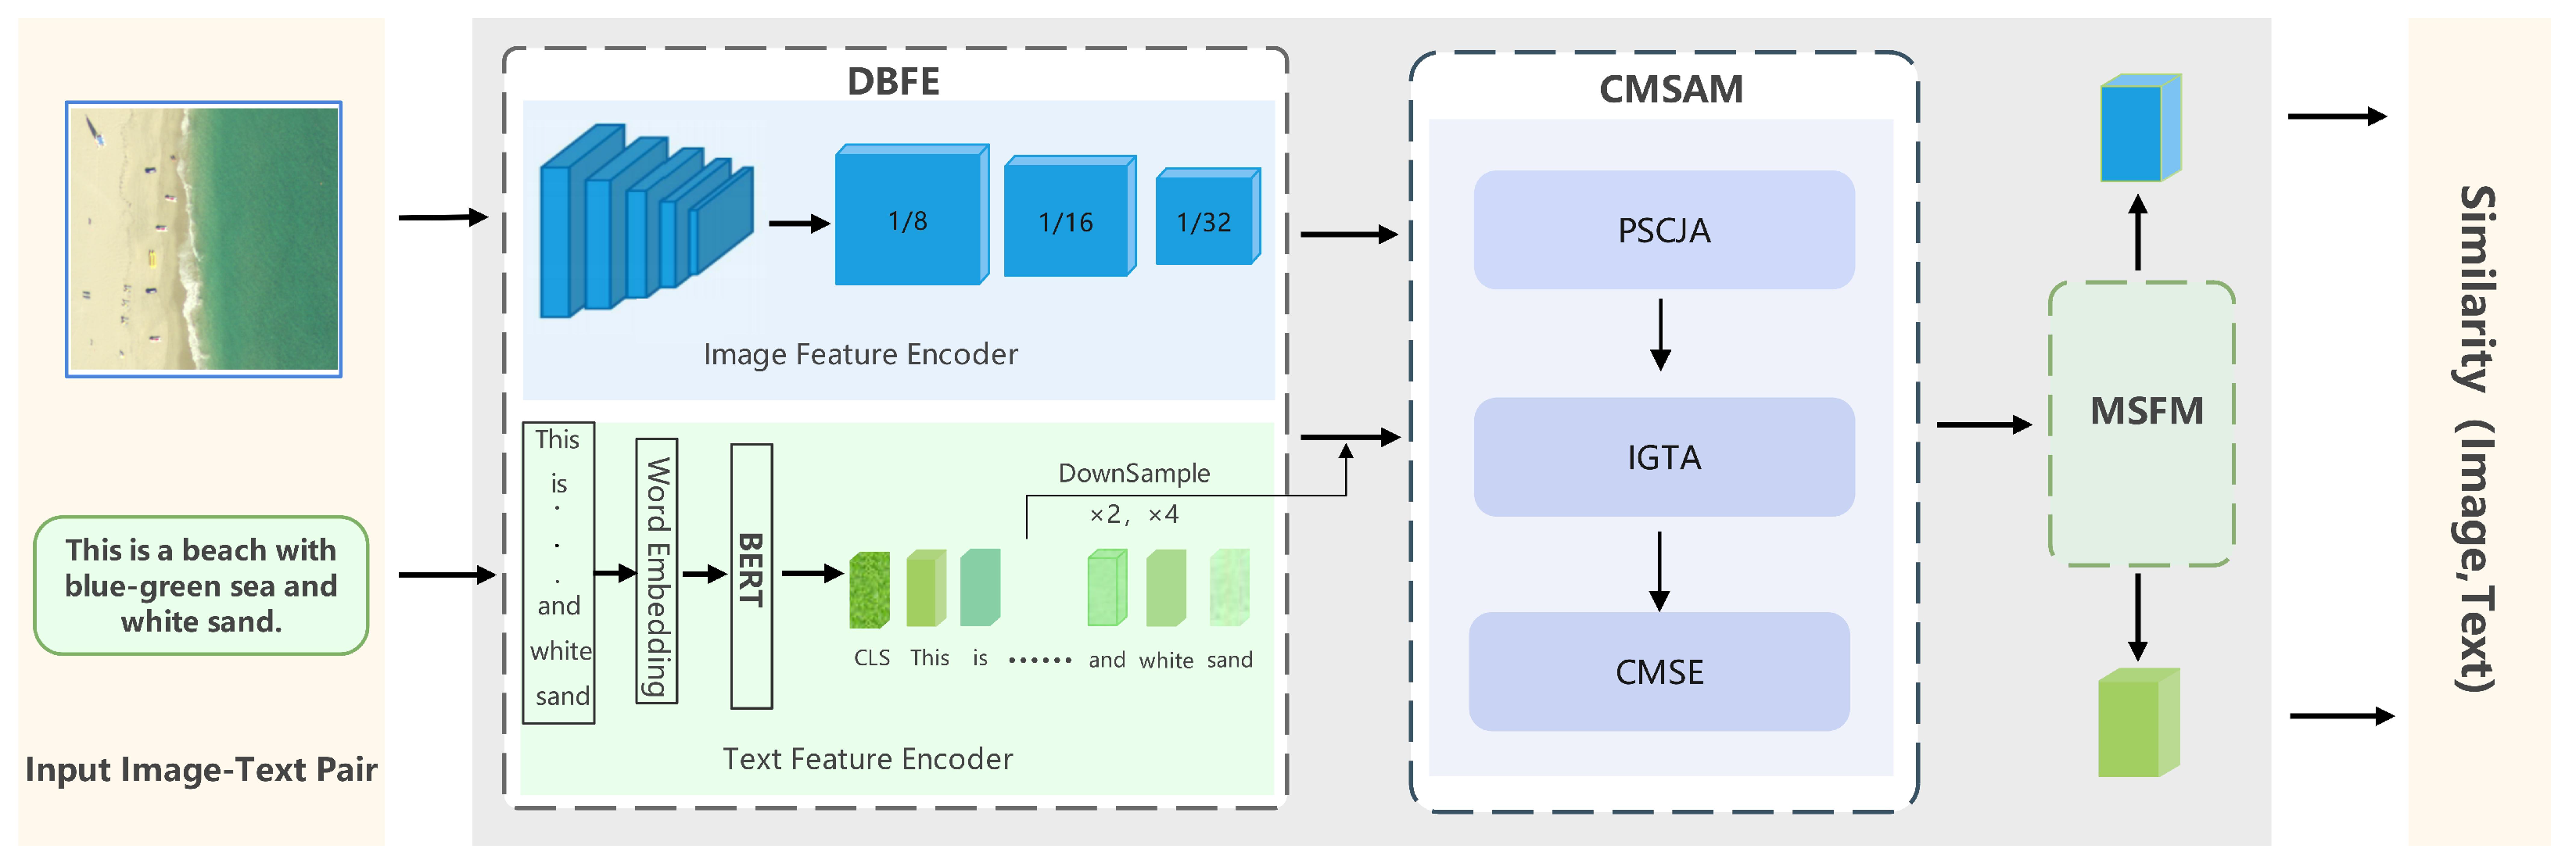
As illustrated in Figure 1, the input image–text pairs are first processed through the Dual-Branch Feature Encoding module (DBFE, Section 4.2), where one branch uses the image feature encoder to process the RS image, generating three feature maps of varying scales, denoted as I m , m 1 / 8 , 1 / 16 , 1 / 32 . The other branch employs the text feature encoder to encode the input sentence, outputting the [cls] token and the embeddings of each word. This branch then undergoes two downsampling operations to yield three text features of different scales, denoted as T n , n 1 / 1 , 1 / 2 , 1 / 4 . Subsequently, the features from both images and text, captured at multiple scales, are progressively input into the Cross-Modal Semantic-Aware Module (CMSAM, Section 4.3), which enhances the expressiveness of multi-scale image and text features respectively based on the Progressive Spatial Channel Joint Attention (PSCJA) and the Image-Guided Text Attention (IGTA). Additionally, the Cross-Modal Semantic Extraction (CMSE) module introduces a set of learnable semantic tokens for each modality at different scales, which interact with the enhanced image and text features through cross-attention mechanism to extract multi-scale semantic information. Finally, the semantically enriched representations of both modalities at varying scales are fed into the Multi-Scale Semantic Fusion Module (MSFM, Section 4.4); in this module, cross-modal semantic interaction and fusion occur, culminating in matching based on the fused results.

4.2. Dual-Branch Feature Encoding (DBFE)

Considering the inherent multi-scale characteristics of RS images, which range from pixel-level fine-grained targets to medium-scale structures and finally to global scenes at the full image level, different levels of objects carry differentiated semantic information. At the same time, text descriptions also exhibit hierarchical semantic differences (from words to phrases to complete sentences). To comprehensively capture the uniqueness and relationships of the various levels of semantics within RS scenes, it is essential to synchronize the semantic expression logic of text descriptions, transitioning from local vocabulary to global sentences, we design the DBFE module, which inputs a batch of image–text pairs, processes them through the image feature encoder and text feature encoder, and outputs the feature maps at original image scales of 1/8, 1/16, and 1/32, as well as the global and local tokens of input text.

4.2.1. Image Feature Encoder

Utilizing a ResNet [40] model, the image feature encoder processes the input image to derive features across various scales. Let I be the input image and I i denote the feature maps yielded by the i-th layer of convolution within ResNet architecture (e.g., conv _ 3 × , conv _ 4 × , conv _ 5 × ). In theory, a range of visual architectures can function as encoders for multi-scale image features. However, for practical purposes, we opt for the ResNet family of models—specifically ResNet18, ResNet50, and ResNet101—for the task of feature extraction. The process of extracting multi-scale feature maps can be represented as follows:
I 1 , I 2 , , I n = ResNet ( I )

4.2.2. Text Feature Encoder

The text feature encoder leverages a BERT [41] model that has been pre-trained to facilitate the extraction of text features. The input sentence T is first divided into a token sequence, expressed as [CLS], t1, t2,…, tn, [SEP], in which [CLS] and [SEP] serve as dedicated tokens indicating the initiation and termination of the sentence, respectively. This process is prone to being represented as follows:
t c l s , t l o c a l = BERT ( T )
Here, t c l s signifies the output that corresponds to the BERT’s class token. t l o c a l = t 1 l o c a l , t 2 l o c a l , , t n l o c a l denotes the output features for each individual token within the input sentence, with n represents the overall count of words.

4.3. Cross-Modal Semantic-Aware Module (CMSAM)

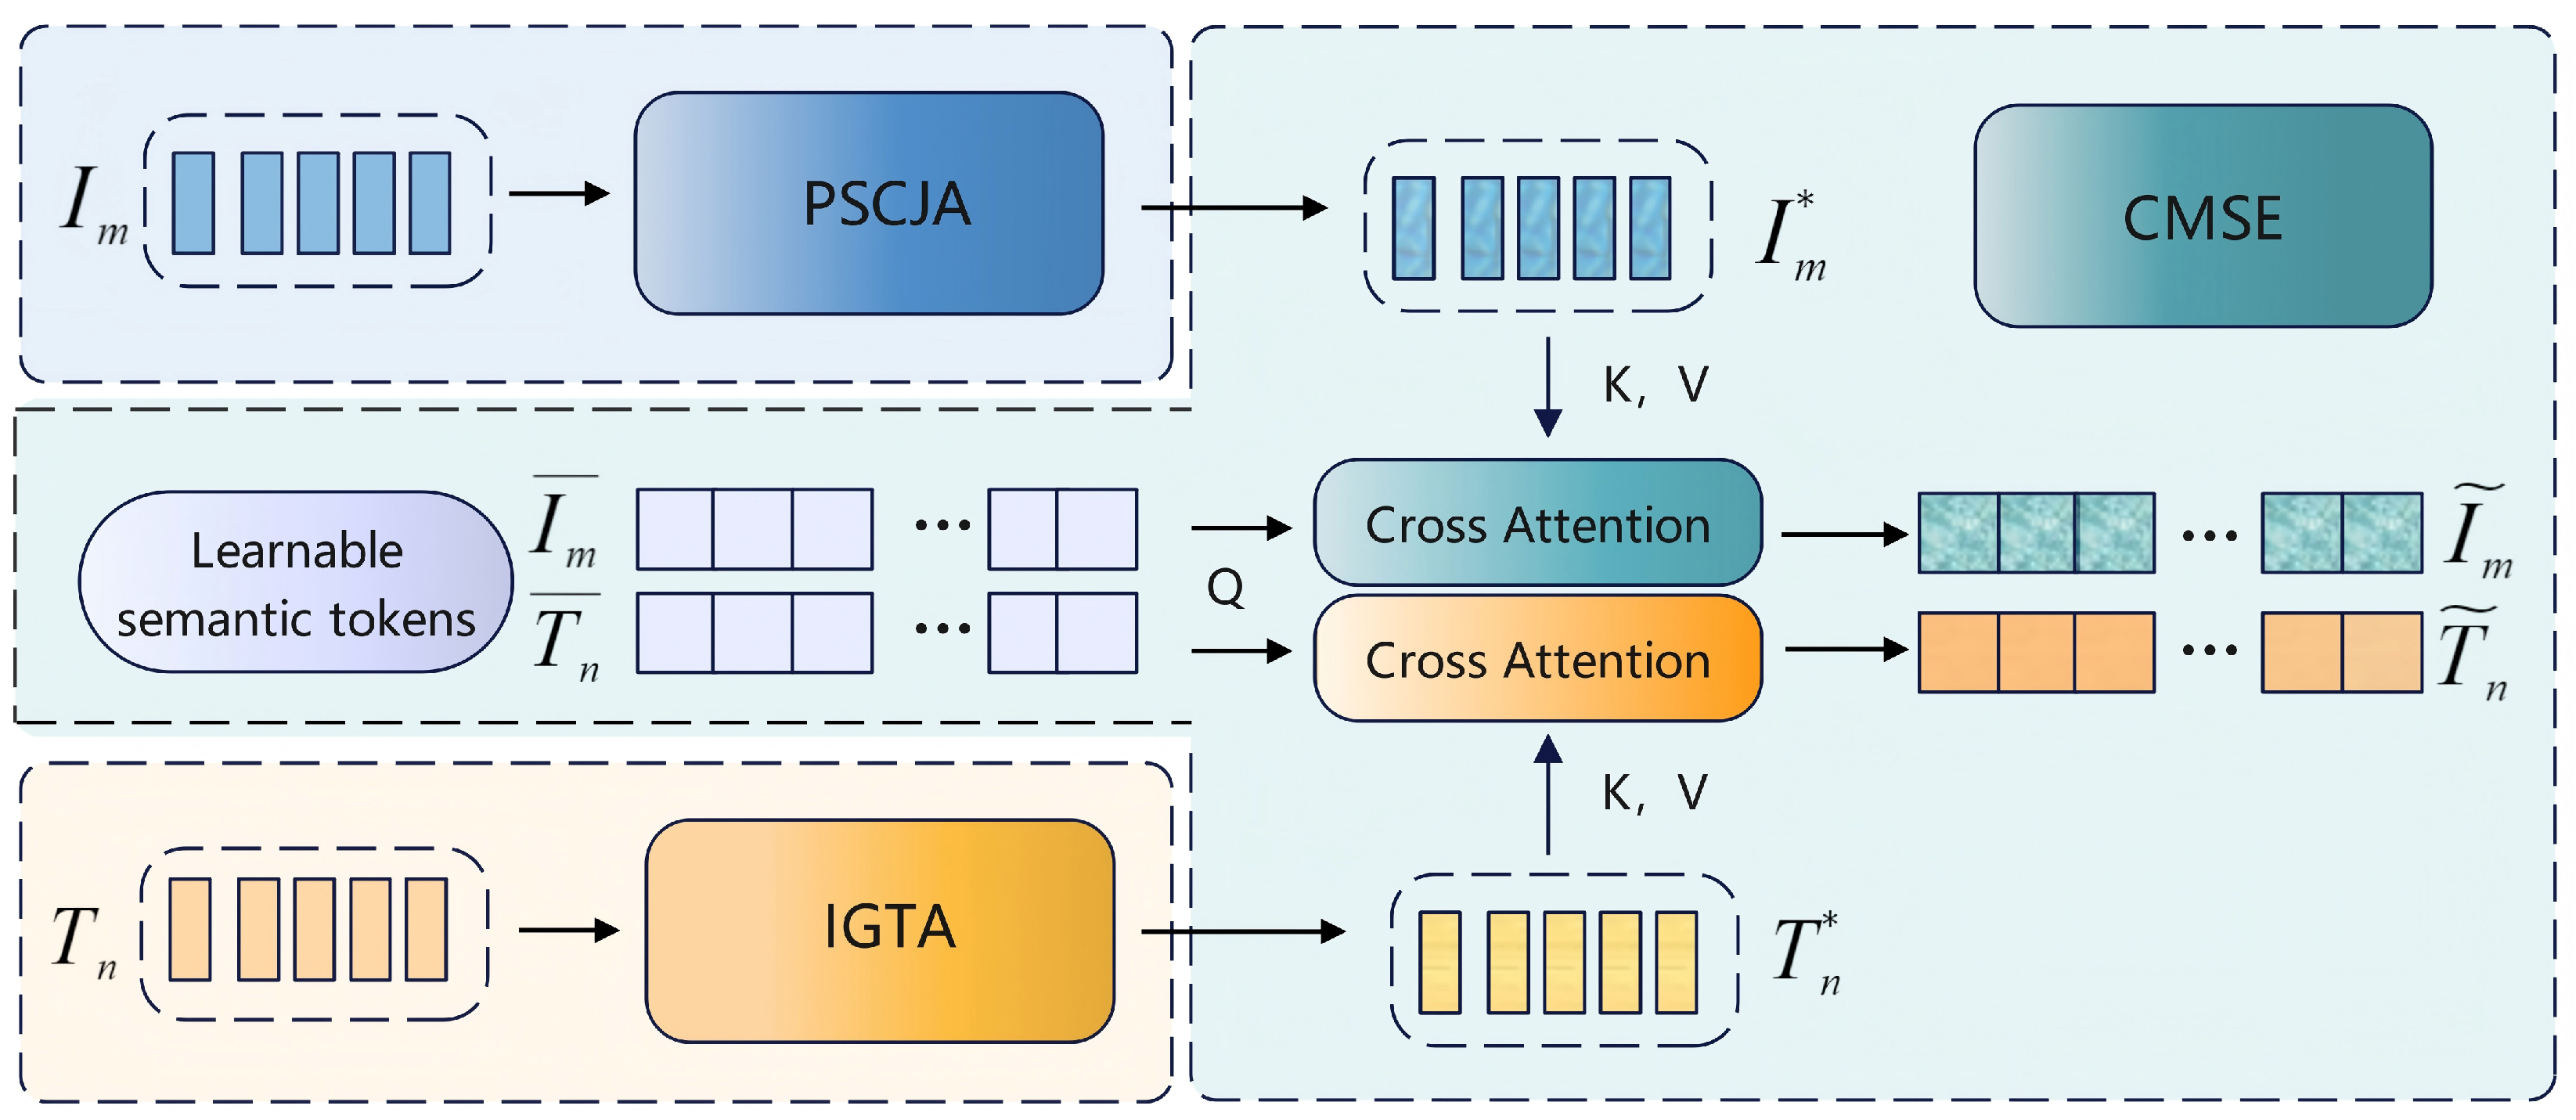
To effectively capture the semantic correlations between multi-scale RS image and textual data, this study propose the CMSAM module. As shown in Figure 2, CMSAM achieves intra-modal feature enhancement and cross-modal semantic alignment through three sub-modules: (1) PSCJA: This module performs joint spatial-channel feature learning on the multi-scale image representations generated by the image feature encoder. This process optimizes the feature representations, thereby guiding the model to focus on salient regions and key attributes within the image. (2) IGTA: This module focuses on enhancing text features by employing image context to guide the acquisition of multi-scale text features, thereby improving the text’s understanding of relevant visual content. (3) CMSE: This module introduces three groups of learnable semantic tokens, which interact with image and text features at different scales through attention mechanism. These interactions promotes cross-modal semantic alignment, ensuring that the feature representation is no longer a simple stacking of information but a comprehensive integrator of visual and linguistic information.
With I m and T n ( m 1 / 8 , 1 / 16 , 1 / 32 , n 1 / 1 , 1 / 2 , 1 / 4 ) representing three groups of image and text features at varying scales, the following sections will provide a detailed introduction to PSCJA, IGTA, and CMSE.

4.3.1. Progressive Spatial Channel Joint Attention (PSCJA)

By progressively fusing shallow detail features with deeper semantic features, it is effectively possible to overcome the difficulty of capturing desired information in RS image due to scale differences. To this end, we propose a novel PSCJA mechanism for image feature enhancement. This mechanism consists of two parts: Window-Region-Global Progressive Attention (WRGPA) and Segmented Channel Attention (SCA). WRGPA progressively perceives significant information from local to global contexts within the spatial dimension, effectively capturing multi-level details in RS images. Meanwhile, SCA segments the channels into multiple groups and performs attention computation on a per-group basis, allowing focused examination of important feature channels while reducing computational overhead.
(1)
Window-Region-Global Progressive Attention (WRGPA)
To address the challenge of cooperative representation of multi-scale objects in RS images, this paper proposes a progressive spatial attention mechanism composed of Window-Attention, Region-Attention, and Global-Attention (as shown in Figure 3). This mechanism progressively fuses multi-scale spatial information from local to global, enhancing the spatial representation capability in image–text retrieval. Where windows refer to the small local areas in the feature map (as indicated by the red lines in Figure 3). Regions are formed by dividing the feature map into four equal-sized larger areas, achieved by splitting it both horizontally and vertically (as shown in the four regions divided by the blue lines in Figure 3). Global represents the overall structure of the entire feature map. Compared with traditional methods, all attention calculations of this scheme are performed within the window, accurately capturing multi-level spatial features of RS images while maintaining computational efficiency (reducing complexity from O( N 2 C ) to O( N M C ), indicating that it scales linearly with the number of pixels, represented by N. The core advantage of this approach lies in its ability to maintain local computational efficiency while achieving global perception. This design conforms to the spatial distribution prior of object distribution in RS images.
Window-Attention: In the proposed WRGPA module, the Window-Attention mechanism is first used to model local regions, capturing local spatial contextual information and facilitating efficient local feature extraction. This module specifically focuses on information modeling within each local window, enabling the extraction of fine-grained spatial features while maintaining the computational cost manageable. Given an input feature map I m R H × W × C , it is partitioned into non-overlapping n windows, with every window consisting of M = 7 × 7 tokens. According to the definition in Section 3, the attention calculation within each window is performed as follows:
W i = Window-Attention ( W i ) = A w i n d o w ( W i ) , i = 1 , , n
Region-Attention: To expand the model’s receptive field and promote the fusion of inter-window information, we introduce the Region-Attention. This mechanism incorporates the Window Shuffle operation to break the limitations of traditional Window-Attention, expanding the scope of feature fusion from a single window to the entire region. Specifically, in standard Window-Attention, the windows are independent of each other, and their outputs depend only on their own inputs, which limits the information exchange between windows. To facilitate inter-window interaction, the feature map is divided equally along horizontal and vertical orientations, resulting in four regions of equal size { R k } k = 1 4 , R k R H 2 × W 2 × C , each containing an equal number of windows. Then, as illustrated in Figure 3, the feature maps corresponding to each window are divided according to the number of windows within the region and rearranged (Window Shuffle). Let W i ( k ) R M × C ( i = 1 , 2 , , N k ) represent the i-th window’s feature within the k-th region, with N k indicating the total number of windows in each region. The Window Shuffle operation divides the M tokens within each window into N k parts, which are then recombined into a new “Shuffle” window as follows:
W i ( k ) = W i ( k , 1 ) , W i ( k , 2 ) , , W i ( k , N k ) , W i ( k , j ) R M N k × C
W ^ j k = Concat W 1 ( k , j ) , W 2 ( k , j ) , , W N ( k , j ) R M × C
where j = 1 , 2 , , N k indicates the j-th segment after splitting each window into N k parts. This operation establishes cross-window feature connection relationships while preserving computational efficiency.
After the rearrangement, Window-Attention is applied to the new window structure to facilitate feature fusion within the region. Finally, the Reverse Shuffle operation is used to restore the scrambled features to their original spatial order, thus maintaining the spatial organization within the feature map. The essence of Reverse Shuffle is the inverse process of Window Shuffle. The attention calculation for each region is as follows:
R k = Region-Attention ( R k ) = Reverse Shuffle A window ( Window Shuffle ( R k ) ) , k = 1 , 2 , 3 , 4
Global-Attention: Building upon the foundation of local and regional modeling, to further enhance the semantic fusion capability across regions, we design the Global-Attention module. This module introduces four “proxy windows” that are strategically positioned at the center of the feature map, to represent the four regions. These “proxy windows” are responsible for aggregating cross-regional information. Specifically, the four “proxy windows” are denoted as { P i } i = 1 4 , P i R M × C , and each window sequentially serves as query vector, interacting with the other three “proxy windows” to achieve cross-regional semantic fusion. Since these “proxy windows” carry the global information of their respective regions, this mechanism enables global semantic modeling across regions with almost no increase in computational overhead. The Global-Attention calculation for each “proxy window” is as follows:
P i = Global-Attention P i , { P j } j i = A cross P i , { P j } j i , i = 1 , 2 , 3 , 4
Through such a progressive feature learning mechanism, during the second WRGPA operation, each token can obtain a global receptive field over the entire feature map. WRGPA is represented as follows:
I m = WRGPA ( I m ) = Global-Attention Region-Attention ( Window-Attention ( I m ) )
(2)
Segmented Channel Attention (SCA)
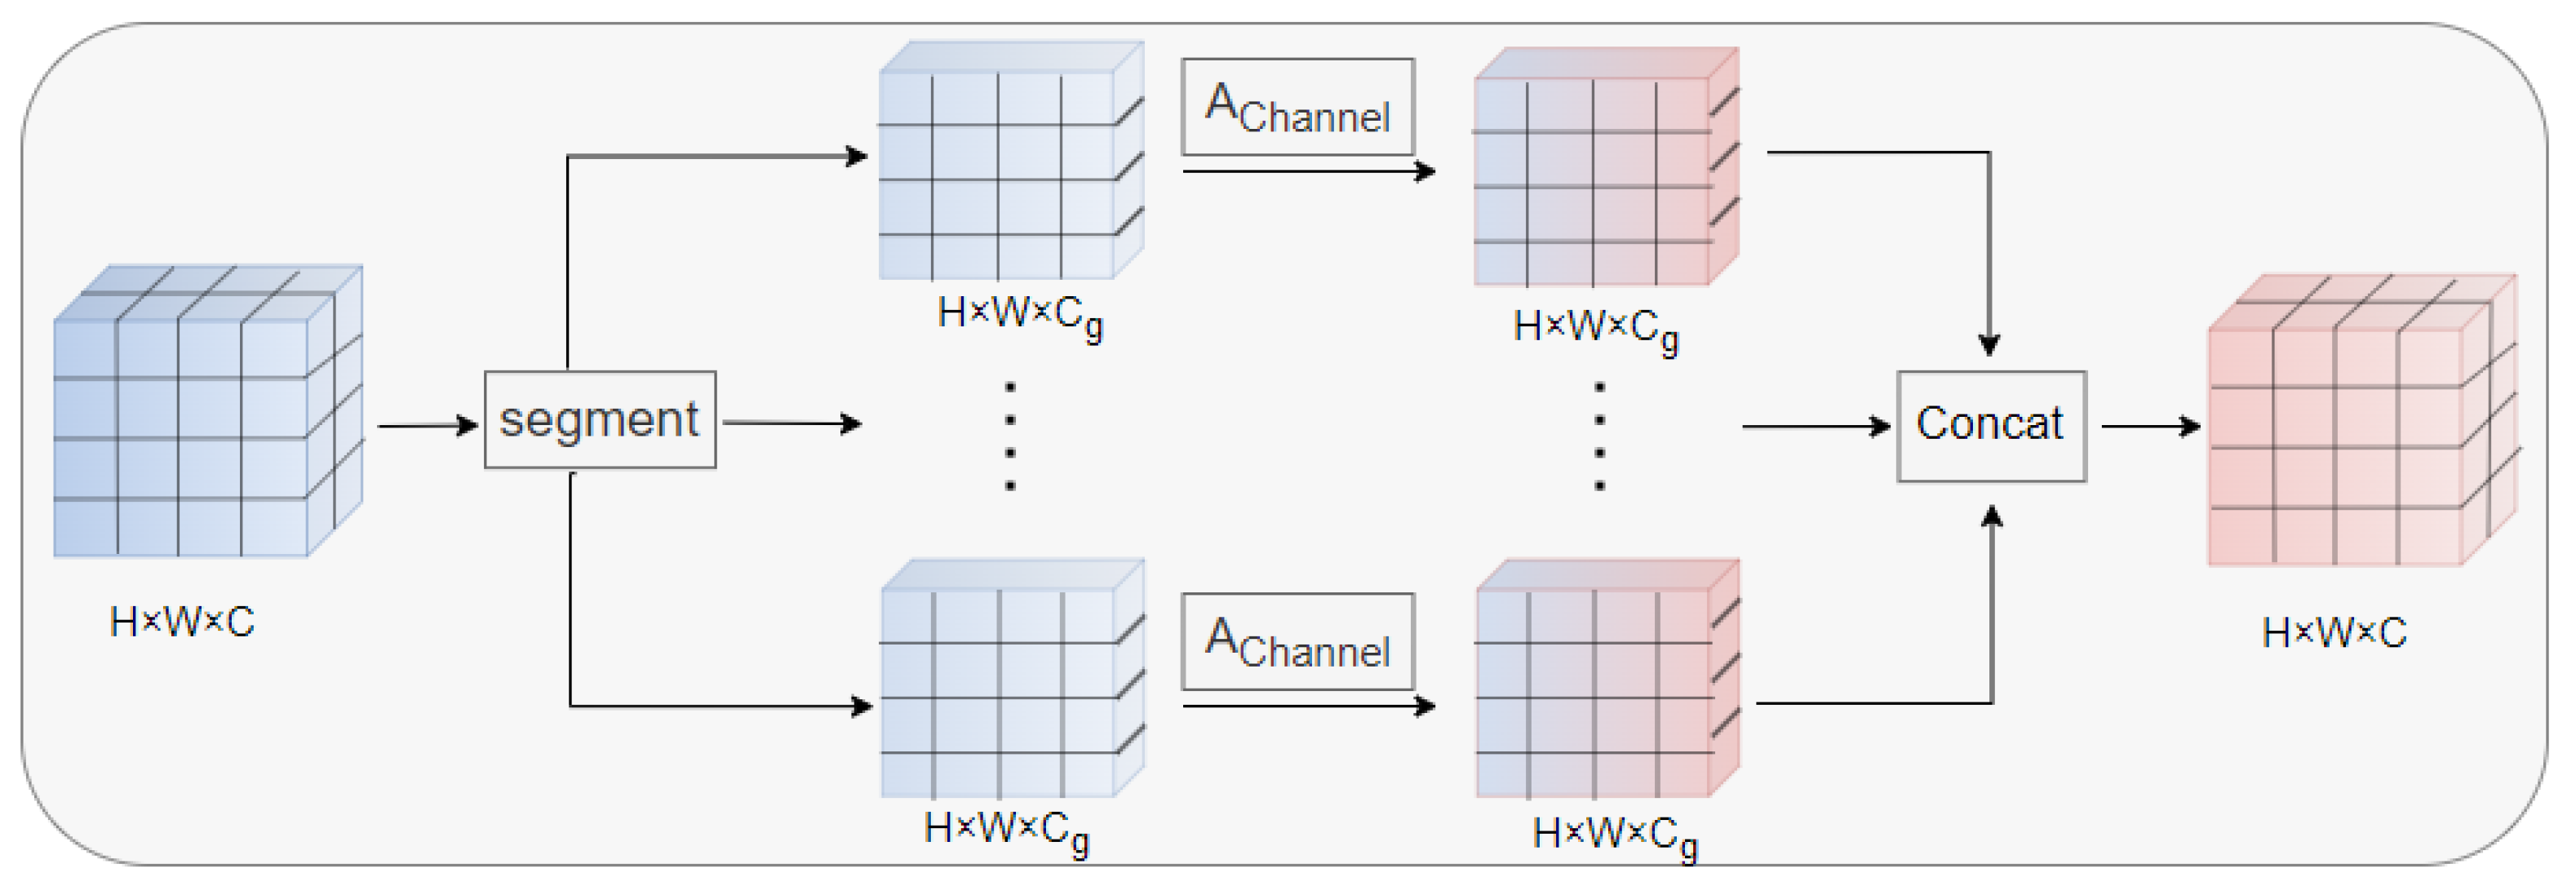
In the feature representation of RS images, different channels often correspond to specific information about objects. Accurately capturing the differences in feature importance across channel dimensions is crucial for enhancing the model’s ability to discriminate complex RS scenes. Therefore, we introduce a channel attention module to extract attention weights for each channel; it helps the model in making better choices grounded in the important feature channels. Typically, channel-level attention can be achieved by applying self-attention to the transposed feature map. However, in our multi-scale feature maps, the computational complexity increases to O( C 2 ) as the number of channels increases. To address this, we designed SCA to achieve the dual objectives of capturing channel associations and optimizing computational efficiency. Specifically, as shown in Figure 4, SCA first performs a non-overlapping, equidistant segmentation operation along the channel dimension of the input feature map I m R H × W × C , dividing the input channels into G groups, with each group represented as G i R H × W × C g ,   C g = C / G . Subsequently, channel attention calculations are conducted independently for each subgroup, generating channel weights within each group through linear projection, thereby enhancing the feature response of key channels within the group. Finally, the attention outputs from all groups are concatenated along the channel dimension to reconstruct the complete feature map. The segment operation of SCA reduces complexity from O( N C 2 ) to O( N C 2 / G ). This approach not only saves computational costs but also avoids extensive redundant channel correlations, allowing for a more refined capture of local dependencies among the channels within each group. The aforementioned process can be expressed as follows:
G 1 , G 2 , , G G = Segment ( I m ) , G i R H × W × C g , i = 1 , 2 , , G
G i = A channel ( G i )
I m * = Concat ( G 1 , G 2 , , G G )
The process of SCA can be represented as follows:
I m * = SCA ( I m ) = Concat A channel Segment ( I m )
(3)
Progressive Spatial Channel Joint Attention (PSCJA)
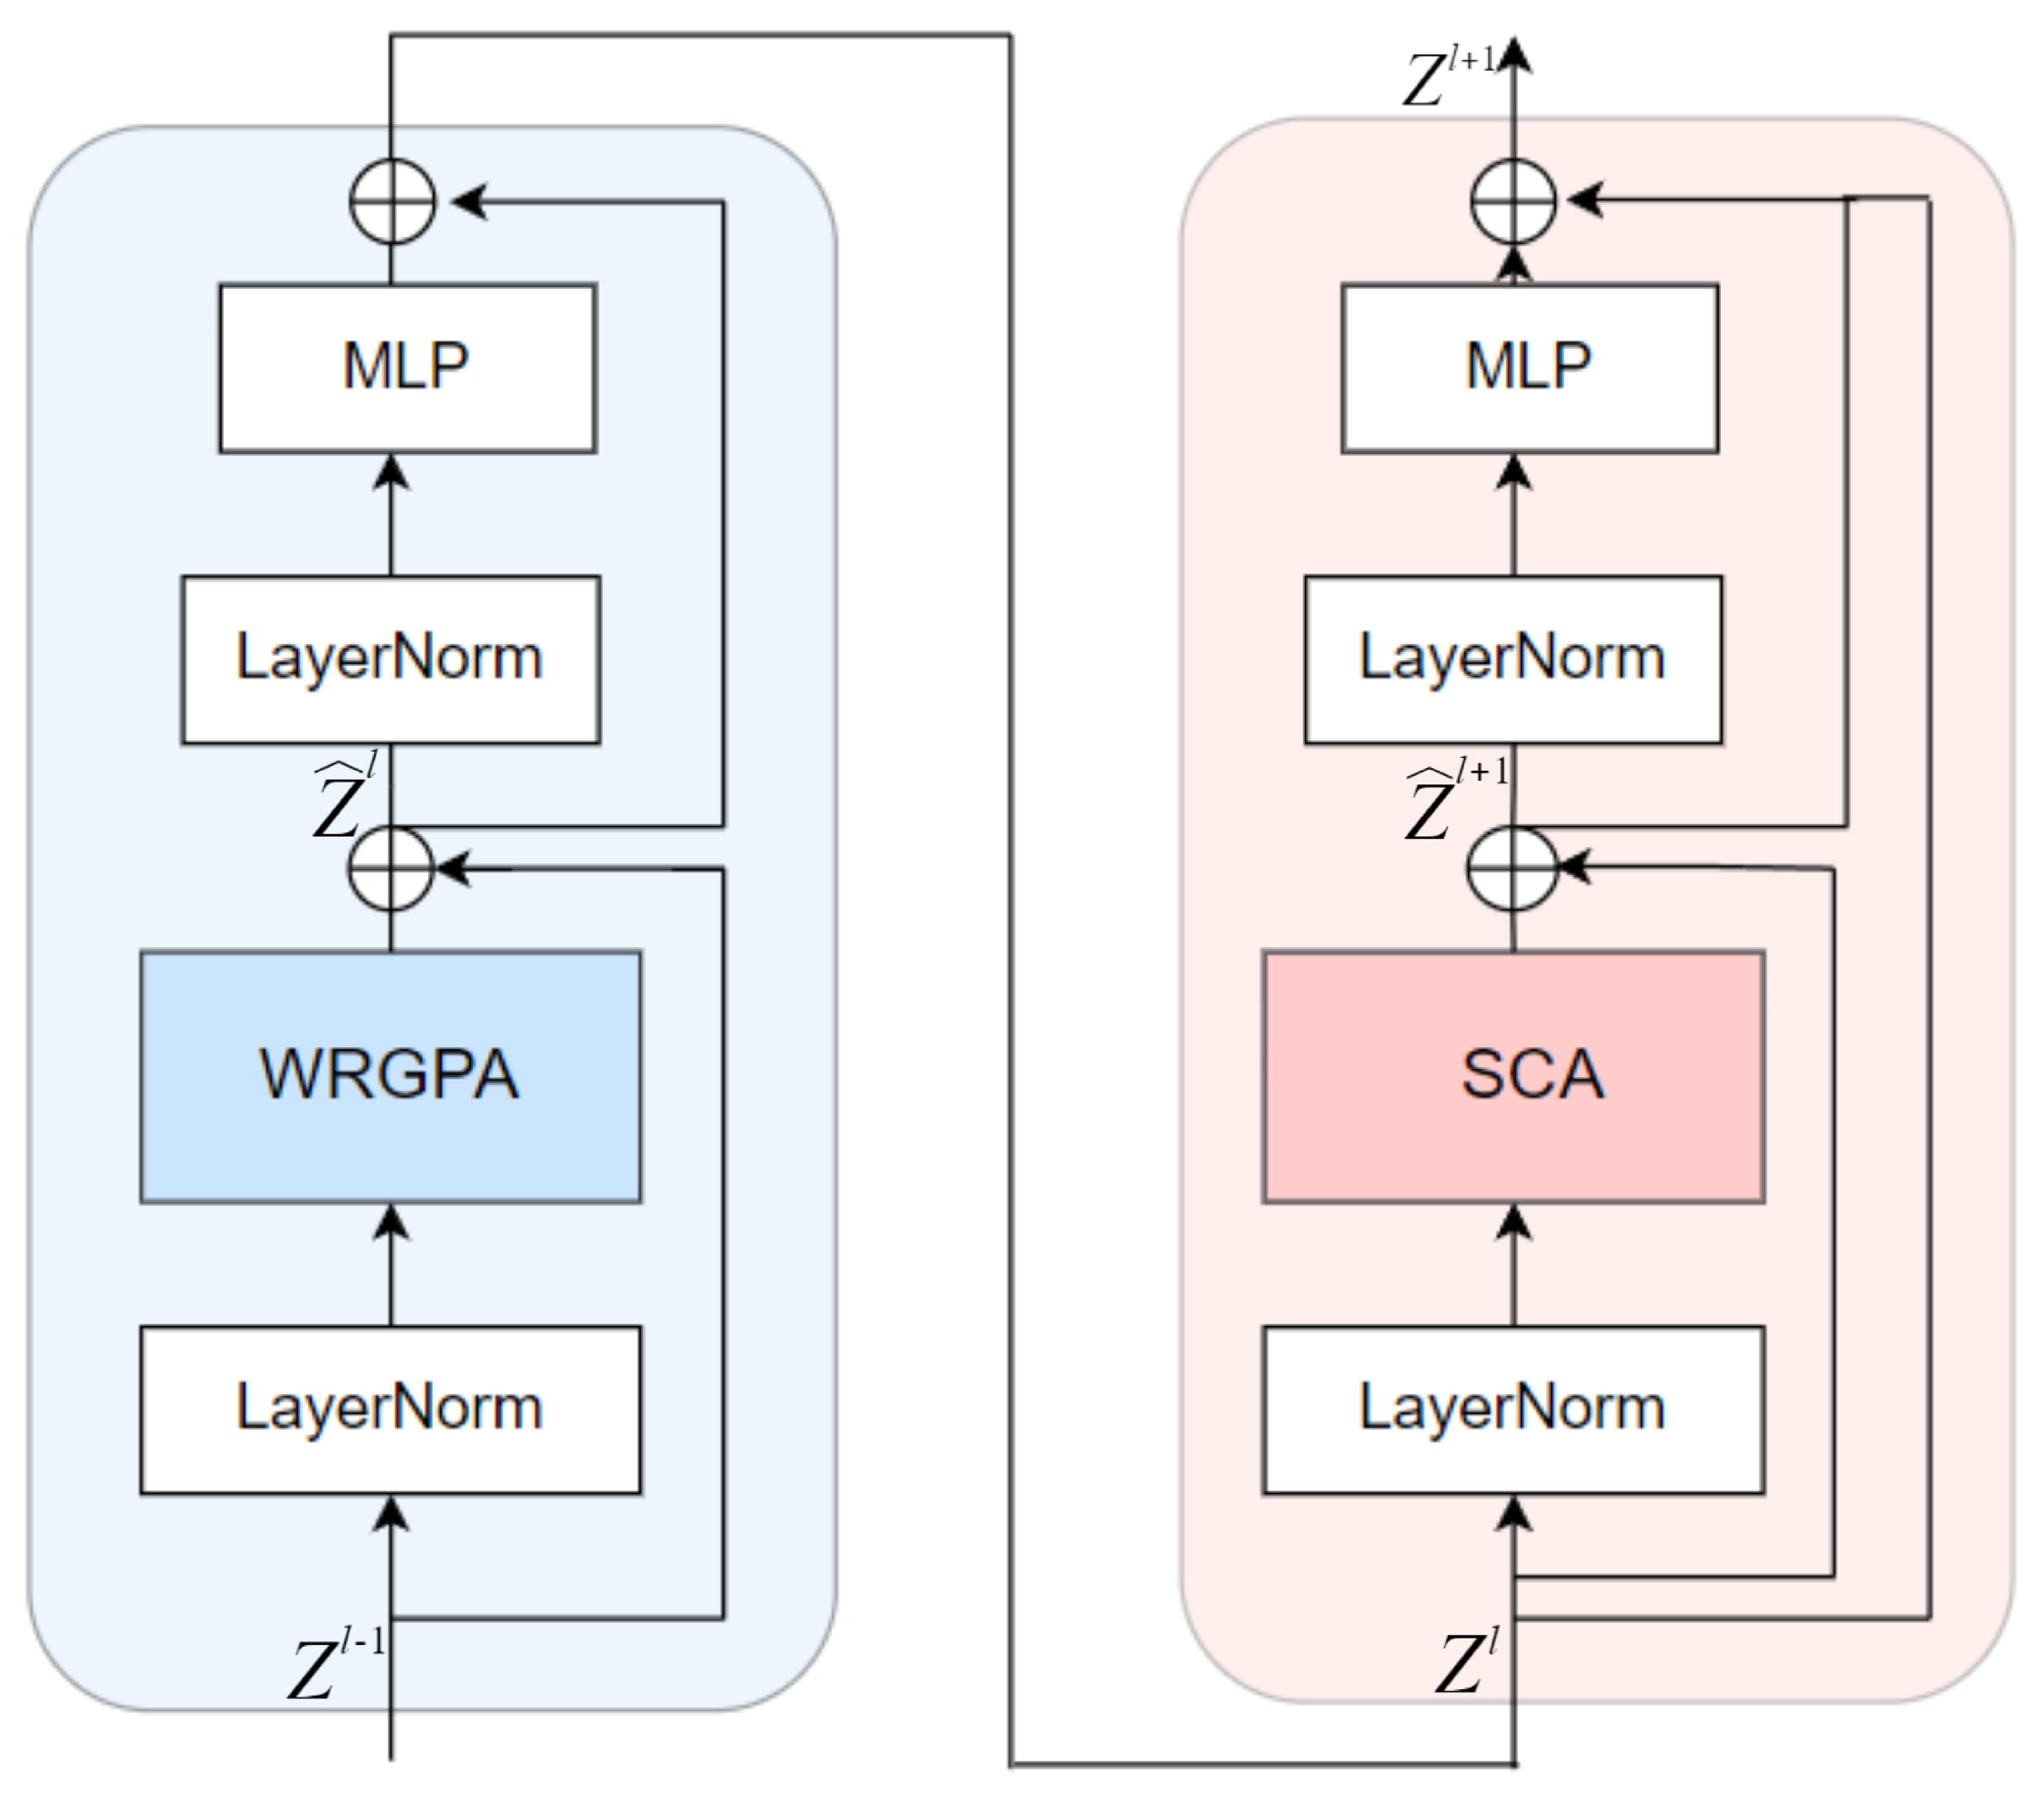
As shown in Figure 5, the PSCJA is composed of the WRGPA-Block and the SCA-Block, balancing computational overhead and information perception from local to global. This mechanism first performs WRGPA in the spatial dimension, enabling the model to progressively capture significant features ranging from local to global contexts. Subsequently, it executes SCA in the channel dimension to further refine the model’s capability to identify the feature channels that are most pertinent to the task. The following is the formal representation of WRGPA-Block:
z ^ l = WRGPA LN ( z l 1 ) + z l 1
z l = WRGPA-Block ( z l 1 ) = MLP LN ( z ^ l ) + z ^ l
The following is the formal representation of SCA-Block:
z ^ l + 1 = SCA LN ( z l ) + z l
z l + 1 = SCA-Block ( z l ) = MLP LN ( z ^ l + 1 ) + z ^ l + 1 + z l
The PSCJA can be formalized as follows:
I m * = PSCJA ( I m ) = SCA-Block WRGPA-Block ( I m )

4.3.2. Image-Guide Text Attention (IGTA)

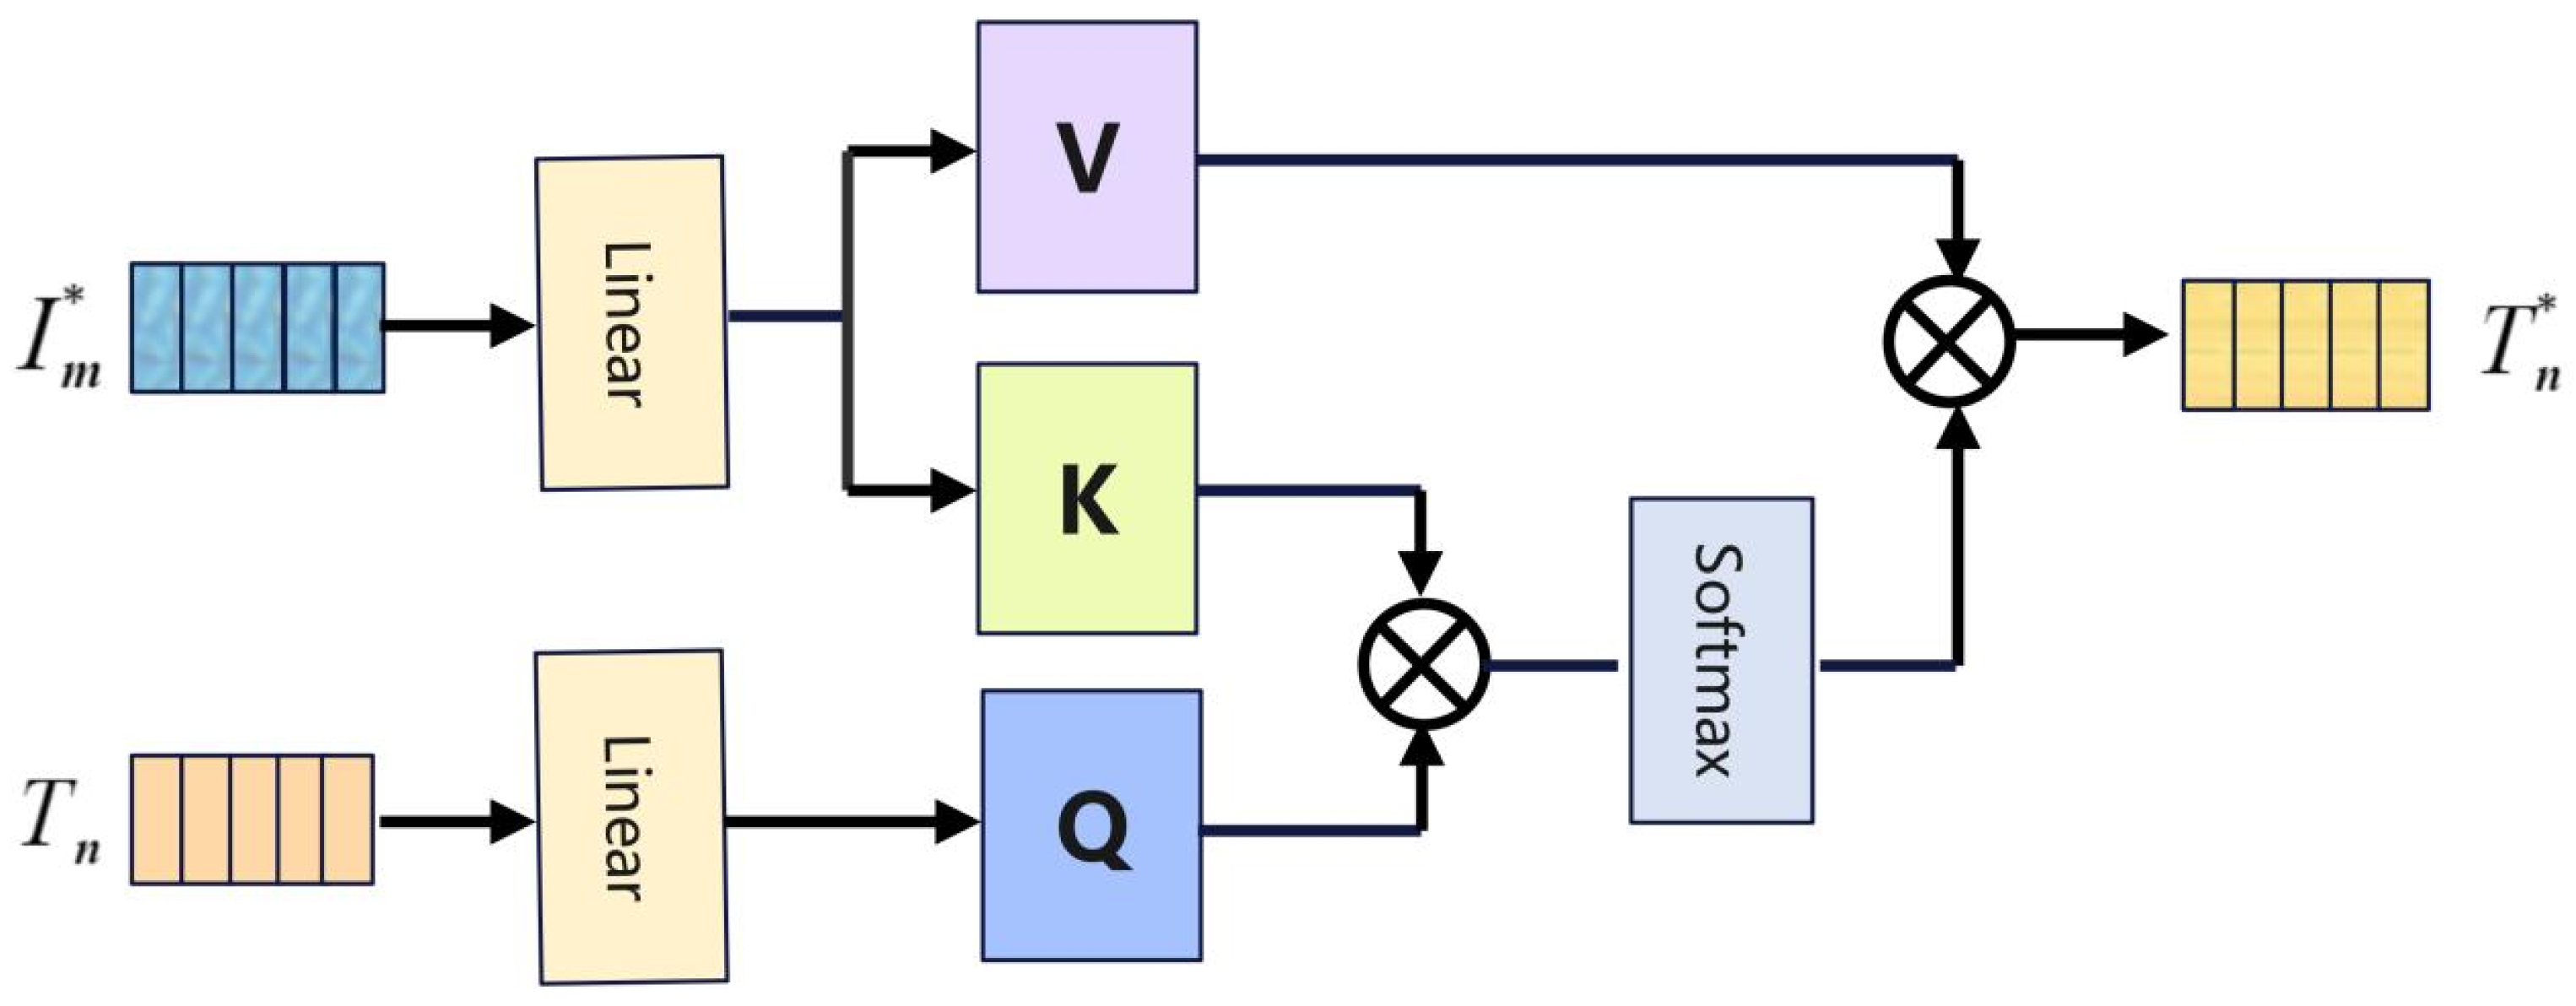
As shown in Figure 6, in order to identify and emphasize key information within the text, and enhance the semantic understanding of sentences, the text features T n are sent into the IGTA to facilitate cross-modal learning between text and images. In this process, the text features T n serve as the query vector, whereas the image features I m * serve the roles of both the key and the value vector. Through this attention mechanism, the text features T n are guided during the learning process, resulting in the generation of enhanced text features T n * . This enables the text features to effectively focus on the related image features. This approach ensures that the text aligns more closely with the semantic content of the images, improving the overall cross-modal understanding. This visual feature driven text attention optimization significantly avoids the interference of original image noise and improves the correlation between the enhanced text features and visual semantics in the output.
T n * = IGTA ( T n , I m * ) = A c r o s s ( T n , I m * )

4.3.3. Cross-Modal Semantic Extraction (CMSE)

After intra-modal feature enhancement via PSCJA and IGTA, we obtain richly informative image features I m * and text features T n * , the former retains multi-scale visual details while filtering redundant noise, and the latter focuses on image-relevant linguistic content. However, two critical limitations remain for RSITR: First, the enhanced intra-modal features still lack explicit cross-modal semantic alignment. Second, the multi-scale semantic hierarchy has not been fully integrated, leading to fragmented semantic representation when facing complex RS scenes. To address these limitations and further extract deeper cross-modal semantic associations, this study proposes the CMSE module. As shown in Figure 2, this module introduces a set of learnable semantic tokens (each set contains 20 tokens, represented as I ¯ m , T ¯ n ) for each scale of both image and text features, and interacts with them through the attention mechanism. This process effectively captures semantic cues from different modalities, thereby enhancing the expressiveness of the features. Specifically, to derive image semantic features, the semantic tokens I ¯ m serve as a query vector and interact with the image features I m * through attention, generating a new image semantic representation I ˜ m . Similarly, the semantic tokens T ¯ n also interact with the text features T n * to extract relevant semantic information, producing a new text semantic representation T ˜ n . CMSE models semantics independently at each scale to avoid information confusion caused by multi-scale semantic mixing in existing algorithms. On the other hand, this process visibly captures cross-modal semantic clues, I ˜ m and T ˜ n not only retain their respective modal characteristics but also share a unified semantic space, laying a solid foundation for subsequent multi-scale fusion. The process is represented as follows:
I ˜ m , T ˜ n = CMSE ( I ¯ m , I m * , T ¯ n , T n * ) = A cross ( I ¯ m , I m * ) , A cross ( T ¯ n , T n * )
The complete CMSAM can be formally expressed as follows:
I m * = PSCJA ( I m ) , T n * = IGTA ( T n , I m * )
I ˜ m , T ˜ n = CMSE ( I ¯ m , I m * , T ¯ n , T n * )
I m * , T n * , I ˜ m , T ˜ n = CMSAM ( I m , T n , I ¯ m , T ¯ n ) = CMSE IGTA ( PSCJA ( I m , T n , I ¯ m , T ¯ n ) )
where, I m , I m * R B × N m × C m , I ¯ m , I ˜ m R B × 20 × C m represent the image features before and after enhancement, the initialized image semantic tokens, and the image semantic representation at different scales, respectively. Similarly, T n , T n * R B × N n × C n , T ¯ n , T ˜ n R B × 20 × C n denote the text features before and after enhancement, the initialized text semantic tokens, and the text semantic representation at various scales, respectively.

4.4. Multi-Scale Semantic Fusion Module (MSFM)

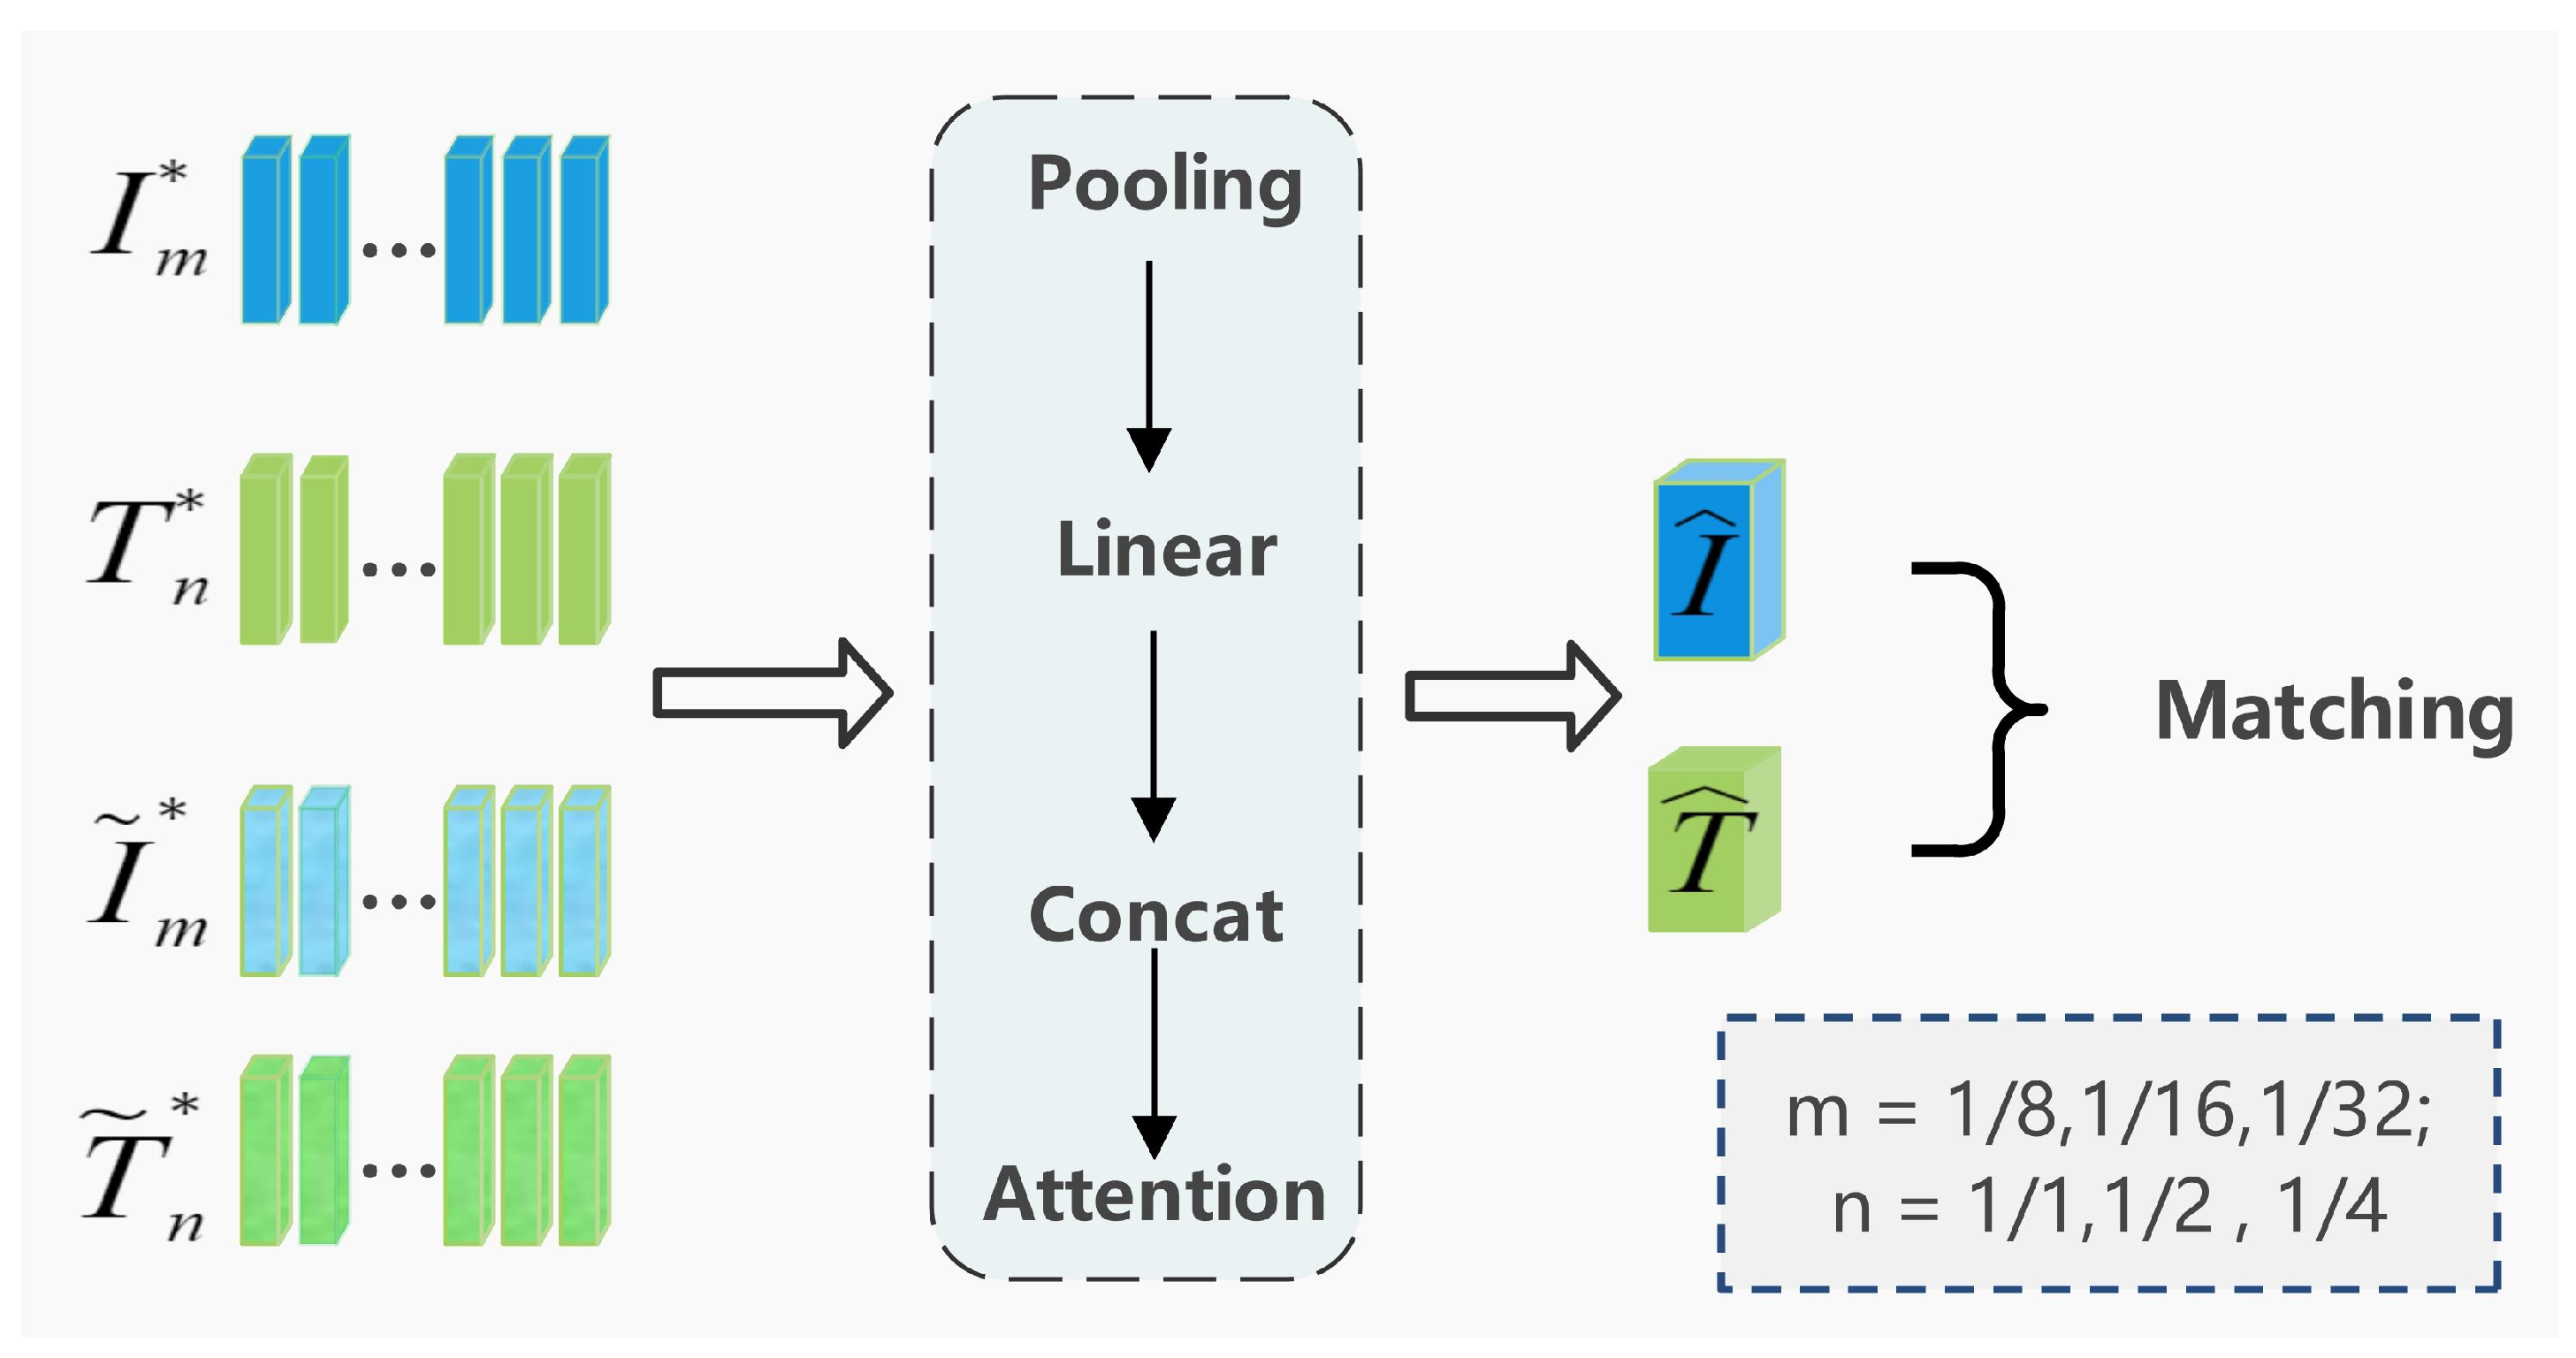
Relying solely on features from a single scale may not fully capture the intricate details of objects, and it fails to bridge the semantic gap between low-level detailed features and high-level semantic features—where low-level features lack semantic context while high-level features lose fine-grained discriminability. For this reason, this paper proposes MSFM. As illustrated in Figure 7, the MSFM is fed with the output from the CMSAM. The multi-scale image feature is denoted as I m * R B × N m × C m , with the corresponding semantic representation as I ˜ m R B × 20 × C m ; the multi-scale text feature is denoted as T n * R B × N n × C n , with the corresponding semantic representation as T ˜ n R B × 20 × C n ( m 1 / 8 , 1 / 16 , 1 / 32 . n 1 / 1 , 1 / 2 , 1 / 4 , N m , C m and N n , C n represent the number of tokens and channels for different scales of image and text features, respectively). First, the multi-scale image features I m * ( I 1 / 8 * R B × 784 × 512 , I 1 / 16 * R B × 196 × 1024 , I 1 / 32 * R B × 49 × 2048 ) undergo the pooling procedure to obtain I 1 / 8 R B × 1 × 512 , I 1 / 16 R B × 1 × 1024 , I 1 / 32 R B × 1 × 2048 , so as to maintain key information at various levels. Then, the features are compressed to 128 dimensions through a linear layer, resulting in I 1 / 8 , I 1 / 16 , I 1 / 32 R B × 1 × 128 , which aims to construct a unified feature space, eliminating dimension disparities. This is followed by concatenating them in the second dimension to generate the global image feature I ˘ m R B × 3 × 128 . Similarly, the same pooling, linear, and concatenation operations are performed on the multi-scale text features T n * , image semantics I ˜ m , and text semantics T ˜ n , resulting in the global text feature T ˘ , global image semantic I ^ , and global text semantic T ^ ( T ˘ , I ^ , T ^ R B × 3 × 128 ). Finally, the global image semantic I ^ and text semantic T ^ are respectively interacted with the global image feature I ˘ and text feature T ˘ through attention mechanisms. The matching score is computed as the cosine similarity between the global image representation and the corresponding text embedding, which effectively gauging the coherence between the visual and textual modalities.
X = f ( X ) = Concat ( Linear ( Pooling ( X ) ) )
I ˘ = f ( I m * ) , I ^ = f ( I ˜ m ) , T ˘ = f ( T n * ) , T ^ = f ( I ˜ m ) , m 1 / 8 , 1 / 16 , 1 / 32 , n 1 / 1 , 1 / 2 , 1 / 4
I ^ = A cross ( I ^ , I ˘ ) , T ^ = A cross ( T ^ , T ˘ )
Sim ( I ^ , T ^ ) = I ^ · T ^ I ^ · T ^
This multi-scale fusion strategy yields more complete and informative cross-modal embeddings for visual-linguistic data, improving the model’s capacity to capture fine-grained semantic relationships.

4.5. Objective Function

This study employs a triplet loss supervised model for training, which is designed to diminish the disparity between positive samples within the feature space while increasing the separation between negative samples, thus enhancing its ability to differentiate among various categories of features. Specifically, by calculating the cosine similarity between the global visual semantics and text semantics, positive and negative samples can be selected by their similarity ranking, after which we compute the similarity between visual semantics, text semantics, and their corresponding positive and negative samples to obtain the LI loss and LT loss, respectively. The objective aims to maximize the distance across positive and negative samples, that can be mathematically expressed as follows:
L i 2 t = max 0 , margin + α L I pos L I neg
L t 2 i = max 0 , margin + α L T pos L T neg
L = L i 2 t + L t 2 i
where α is a hyperparameter employed to modulate the loss weighting for positive and negative samples, and margin specifies the threshold for the difference in similarity. L I p o s , L I n e g represent the loss between visual semantics and positive and negative text semantics, respectively. Similarly, L T p o s , L T n e g represent the losses between text semantics and positive and negative visual semantics, respectively. The cumulative loss is computed as the aggregate of the losses incurred in both directions.

5. Experiments

5.1. Dataset, Implementation Details, and Evaluation Metrics

Our experiments were performed on three benchmark RSITR datasets, namely, UCM Caption [31], RSITMD [3], and RSICD [42]. UCM Caption features a collection of 2100 RGB aerial shots covering 21 scene classifications, where every image is paired with five descriptions, collectively forming 2032 unique caption annotations. The RSITMD dataset establishes a new benchmark in high-resolution remote sensing cross-modal matching. Its unique value lies in the explicit modeling of inter-object relationships, differentiating it from existing RS paired datasets. The resource includes 4743 images covering 32 scene types, with 23,715 annotated descriptions (21,829 unique). The RSICD consists of 10,921 RS images, each with five descriptions, totaling 18,190 unique annotations. As far as we are aware, RSICD is the largest-scale dataset in the field of RSITR, and is characterized by substantial intra-class variability and minimal inter-class dissimilarity among the sample images. We use 80% of the data for training, 10% for testing, and 10% for validation.
In the experimental setup, the input image resolution is standardized to 224 × 224, we use 32 as the batch size and set the learning rate at 1 × 10 5 , optimized using Adam. The experiments were performed utilizing the PyTorch 3.8.10 deep learning framework on a machine equipped with an NVIDIA GeForce RTX 3090 GPU. To maintain fairness when comparing with previous research, we adhered to the established conventions of past studies by conducting retrievals in two directions: image-to-text and text-to-image. Our assessment employed three Recall@K metrics (with K values of 1, 5, and 10); R@K measures the fraction of correct matches found in the highest-ranked K retrieved candidates relative to the total query set, and mR represents the average precision of all results.

5.2. Comparison with State-of-the-Arts

We conduct comprehensive comparisons between our proposed MSSA approach and five established cross-modal retrieval methods (MTFN [43], SCAN [36], VSE++ [44], CAMERA [45], and CAMP [46]), as well as 16 specialized RSITR retrieval methods (AMFMN [13], SWAN [12], HyperMatch [47], GaLR [15], SMLGN [48], MCRN [49], CABIR [10], HVSA [50], SSJDN [14], LW-MCR [51], KAMCL [52], MGRM [53], MSITA [54], MSA [17], GHSCN [38], and PGRN [19]).
SCAN provides context for inferring image–text similarity by assigning variable weights to different image regions and words. VSE++ improves image–text retrieval performance by introducing hard negative samples and the maximum hinge loss function (MH). CAMP effectively fuses text and image features through an adaptive message passing mechanism, thereby improving the accuracy of retrieval. MTFN employs a multi-modal tensor fusion network to project multiple modal features into various tensor spaces. CAMERA adaptively captures the information flow of inter-modal context from different perspectives for multi-modal retrieval. AMFMN is a RSITR method with fine-grained and multi-scale features. GaLR is a RSITR method based on global and local information. MCRN addresses the challenges of multi-source (image, text, and audio) cross-modal retrieval. CABIR overcomes the defects present in existing research in solving the interference arising from overlapping image semantic attributes due to the complexity of multi-scene semantics. LW-MCR is a lightweight multi-scale RSITR method. SWAN proposes an innovative context-sensitive integration framework designed to mitigate semantic ambiguity through the amplification of contextual awareness. HVSA considers the significant substantial variances in images and the pronounced resemblance among textual descriptions, addressing the varying levels of matching difficulty across different samples. HyperMatch models the relationship between RS image features to improve retrieval accuracy. KAMCL proposes knowledge-assisted momentum contrast learning for RSITR. SSJDN emphasizes scale and semantic decoupling during matching. MGRM tackles the issue of information redundancy and precision degradation in existing methods. MSITA boosts retrieval performance by capturing multi-scale salient information. SMLGN employs dual guidance strategies: intra-modal fusion of hierarchical features and inter-modal bidirectional fine-grained interaction, facilitating the development of a unified semantic representation space. MSA presents a single-scale alignment method to enhance performance based on the previous multi-scale fusion features. GHSCN employs a graph-based hierarchical semantic consistency network, which enhances intra-modal associations and cross-modal interactions between RS images and text through unimodal and cross-modal graph aggregation modules (UGA/CGA). PGRN introduces an end-to-end Prompt-based Granularity-unified Representation Network designed to mitigate cross-modal semantic granularity discrepancies.
From Table 1, it is evident that MSSA excels in the RSITR task on the UCM Caption dataset, with a significant improvement in performance. When compared to other methods, MSSA achieved outstanding results in retrieving text from images, with a score of 22.38 on R@1, which improved to 60.95 on R@5 and 79.52 on R@10. In the reverse direction, the model scored 15.80 on R@1, 64.76 on R@5, and 93.52 on R@10, respectively. These results indicate that MSSA exhibits robust retrieval capabilities regardless of the direction of the query, whether the retrieval process is driven by textual queries to locate images or by visual content to identify corresponding text. Notably, compared to the classical RSITR method AMFMN, the comprehensive evaluation metric mR improved by 10.08%. Compared to the lightweight LW-MCR, MSSA achieved a performance increase of 10.81%. SSJDN simultaneously optimizes scale decoupling and semantic decoupling, yet our method still attained an improvement of 4.57%. Although SMLGN employs a more complex backbone, our approach still outperforms it, increasing retrieval accuracy by 7.86%. MSA proposes a multi-scale alignment strategy, but our method achieved an improvement of 4.05% and surpassed the latest PGRN method by 4.1%. This enhancement underscores the superiority and stability of MSSA, confirming that the retrieval approach based on multi-scale semantic guidance proposed in this paper offers significant advantages. Furthermore, it demonstrates that MSSA effectively mitigates semantic confusion, resulting in improved retrieval accuracy.
Table 2 reveals that MSSA exhibits the best performance among all compared approaches on the RSITMD dataset, excelling in every evaluation criterion, with the exception of the R@1 and R@5 precision in the text-to-image retrieval. Nevertheless, the R@1 precision in this direction was 15.09, which is 0.44 lower than the MSA method, placing MSSA second only to MSA; the R@5 precision was 47.21, which is 0.22 lower than the most recent method. In the comparison of the comprehensive evaluation metric mR, our method improved the mR value by 15.68% compared to the classical remote sensing image–text retrieval method AMFMN. Compared to the method based on global and local information (GALR), our method achieved an enhancement of 13.99%. MSITA captures multi-scale significant features, but MSSA still shows a substantial improvement in retrieval accuracy by 10.92%. Compared to the graph-based hierarchical semantic consistency alignment method CHSCN, the mR value increased by 6.39%. Compared to the latest PGRN, MSSA’s mR value is higher by 6.08%. These outcomes emphasize the fundamental contribution of cross-modal multi-scale feature learning to the enhanced system capabilities. By effectively fusing features at various levels, MSSA is able to capture the deeper relationships across the spectrum of visual and textual feature, providing a more comprehensive understanding of their interconnections. This, in turn, boosts the model’s recognition capabilities and retrieval accuracy. Consequently, the approach proves to be both feasible and effective in addressing the challenges of information asymmetry and feature sparsity in cross-modal retrieval, further validating the necessity and efficacy of multi-scale semantic perception.
On the RSICD dataset, the experimental results of MSSA is compared with other methods, and the results are presented in Table 3. It is evident from the table that HyperMatch models the relationships between RS image features, resulting in an improvement in retrieval accuracy, and our method achieves a gain of 12.68 compared to it. The mR value of MSSA is 11.82% higher than that of SWAN. Looking at some recent related methods, MSSA shows an improvement of nearly 10% over MSA, demonstrating outstanding performance. When compared to the latest method, PGRN, MSSA achieved gains of 6.31, 6.58, and 10.43 in image-to-text retrieval for R@1, R@5, and R@10, respectively. Similarly, in text-to-image retrieval, MSSA outperformed existing methods by 2.29 and 4.1 in R@5 and R@10, respectively. Furthermore, the mR value increased by nearly 5%, highlighting the overall improvement in MSSA’s retrieval performance. These results indicate the significance of incorporating multi-scale semantic information, which equips the model with improved capability to discern both fine-grained and high-level relationships between visual and textual data, consequently advancing its capacity to comprehend and distill complex cross-modal features. The enhanced retrieval accuracy not only reflects the power of this approach but also demonstrates MSSA’s superior generalization capabilities in handling richly informative and complex RS scenarios.

5.3. Ablation Studies

Using the UCM Caption dataset, we performed extensive ablation studies to quantitatively assess the impact of the key innovative elements of MSSA. First, we examined the feasibility and effectiveness of the CMSAM module. Next, we compared its performance with three different attention mechanisms to validate that the designed PSCJA is capable of effectively capturing RS image features, transitioning seamlessly from local to global contexts. Furthermore, we assessed the necessity of multi-scale alignment within the MSSA model and investigated how varying the number of learnable semantic tokens affects retrieval performance. Lastly, to control for potential biases from text feature encoding, we evaluated various visual backbones including ResNet model (ResNet18, ResNet50, ResNet108) and ViT as image feature extractors.
CMSAM is a key innovative module in MSSA that consists of three components: PSCJA, IGTA, and CMSE. To verify how the combined influence of these three factors contributes to the improvement of retrieval results, we conducted ablation experiments by sequentially removing each module. In Table 4, the check marks under PSCJA, IGTA, and CMSE indicate that the module is retained; otherwise, it means the module is removed.
From the results in Table 4, it is evident that, when only a module is retained, the comprehensive performance (measured by the mR value) of the model does not reach an ideal level. Specifically, with only the PSCJA retained, the mR value is 53.43; with only the IGTA retained, the mR value is 53.25; and, with only the CMSE retained, the mR value is 52.69. However, when both the PSCJA and IGTA are retained to enhance image and text features, the mR values are improved by 1.67, 1.85, and 2.41 compared to the individual modules, respectively. This indicates that PSCJA and IGTA can effectively capture multi-scale RS image and text features, providing key feature representations for cross-modal retrieval. While the other two combinations, PSCJA and CMSE, achieve an mR of 55.3, but suffer from limited Text-to-Image metrics (e.g., Text-to-Image R@1) due to the lack of IGTA’s visual guidance for text; IGTA and CMSE attain an mR of 54.43, benefiting from text optimization yet showing insufficient Image-to-Text precision (e.g., Image-to-Text R@1), as image features are not enhanced by PSCJA. Furthermore, when the three modules work together, the mR value reaches 56.16, and the image to text R@1 and R@5, as well as the text-to-image R@1 and R@10, which also achieve their best values. Based on this, it is speculated that PSCJA and IGTA provide high-quality cross-modal inputs for CMSE, while CMSE further captures the deep semantic associations that have not been resolved by the previous modules. In addition, the comparison of R@1, R@5, and R@10 indicators in all combinations shows that omitting any module will lead to performance defects, which fully highlights the necessity of joint design of three modules.
The above analysis fully indicates that there is a significant synergistic effect between intra-modal feature enhancement and cross-modal semantic extraction. Both work together at different levels and scales to perceive and fuse cross-modal semantic information, dramatically boosting the model’s retrieval accuracy and generalization capability. In other words, relying solely on either intra-modal feature enhancement or cross-modal semantic extraction cannot fully unleash the model’s potential. The combination of all three components is crucial to enhancing retrieval effectiveness.
Table 5 presents the results of replacing the PSCJA with three other attention mechanisms, evaluated under the same dataset and configuration to assess the superiority of PSCJA in progressively extracting features from spatial and channel dimensions. The three attention mechanisms compared are (1) Vanilla MSA [2], which calculates attention for every single token within the input sequence in relation to each of the remaining tokens, capturing global long-range dependencies; (2) SW-MSA [25], composed of window attention and sliding window attention, which restricts the scope of attention to within the window and between adjacent windows, balancing the receptive field and computational efficiency; (3) Focal Self-Attention (FSA) [55] mimics the observation mechanism of human eyes and enables every token to concentrate on nearby tokens at a fine level of detail while also addressing more distant tokens at a broader level, thereby effectively representing both local and global visual relationships.
As shown in Table 5, although Vanilla MSA can provide global, fine-grained attention for each token, it incurs excessive “meaningless” computations because of the substantial redundancy in RS images, resulting in suboptimal performance. SW-MSA, on the other hand, captures local area details effectively and achieves an R@1 precision of 22.53 in image-to-text retrieval, which is 0.15 higher than PSCJA. However, owing to the existence of various scale-varied objects (buildings, roads, vegetation, etc.) in RS images, this mechanism struggles to adapt well to these multi-scale features within a fixed-scale window. It also fails to fully capture the contextual information over a large range (e.g., urban areas, forests, rivers), resulting in an mR value that is 1.59 lower than PSCJA. FSA introduces a mechanism to selectively focus on important information, achieving R@1 and R@5 values of 19.80 and 70.75 in the text-to-image retrieval, which are 3.99 and 5.99 higher than PSCJA, respectively. However, due to the irregularly shaped targets present in RS images, a fixed attention range is inadequate to capture these target features well, leading to the overall mR value not surpass that of PSCJA. For WRGPA, its R@1 metric in image-to-text reaches 24.29, which is the highest value among all attention mechanisms. This indicates that WRGPA can accurately capture local fine-grained features in RS images through the progressive spatial attention design. However, other indicators are lower than PSCJA due to the lack of integration of channel semantic information. SCA performs well on R@5 (70.95) and R@10 (88.67) in text-to-image, indicating that SCA can selectively activate image channel features related to text semantics. However, its modeling of spatial multi-scale features is insufficient, resulting in poor overall performance. The PSCJA presented in our study takes into account the multi-scale features of RS images and effectively captures important visual information from local to global through a hierarchical feature learning mechanism. The experimental results further confirm the superiority of PSCJA in RS image feature extraction.
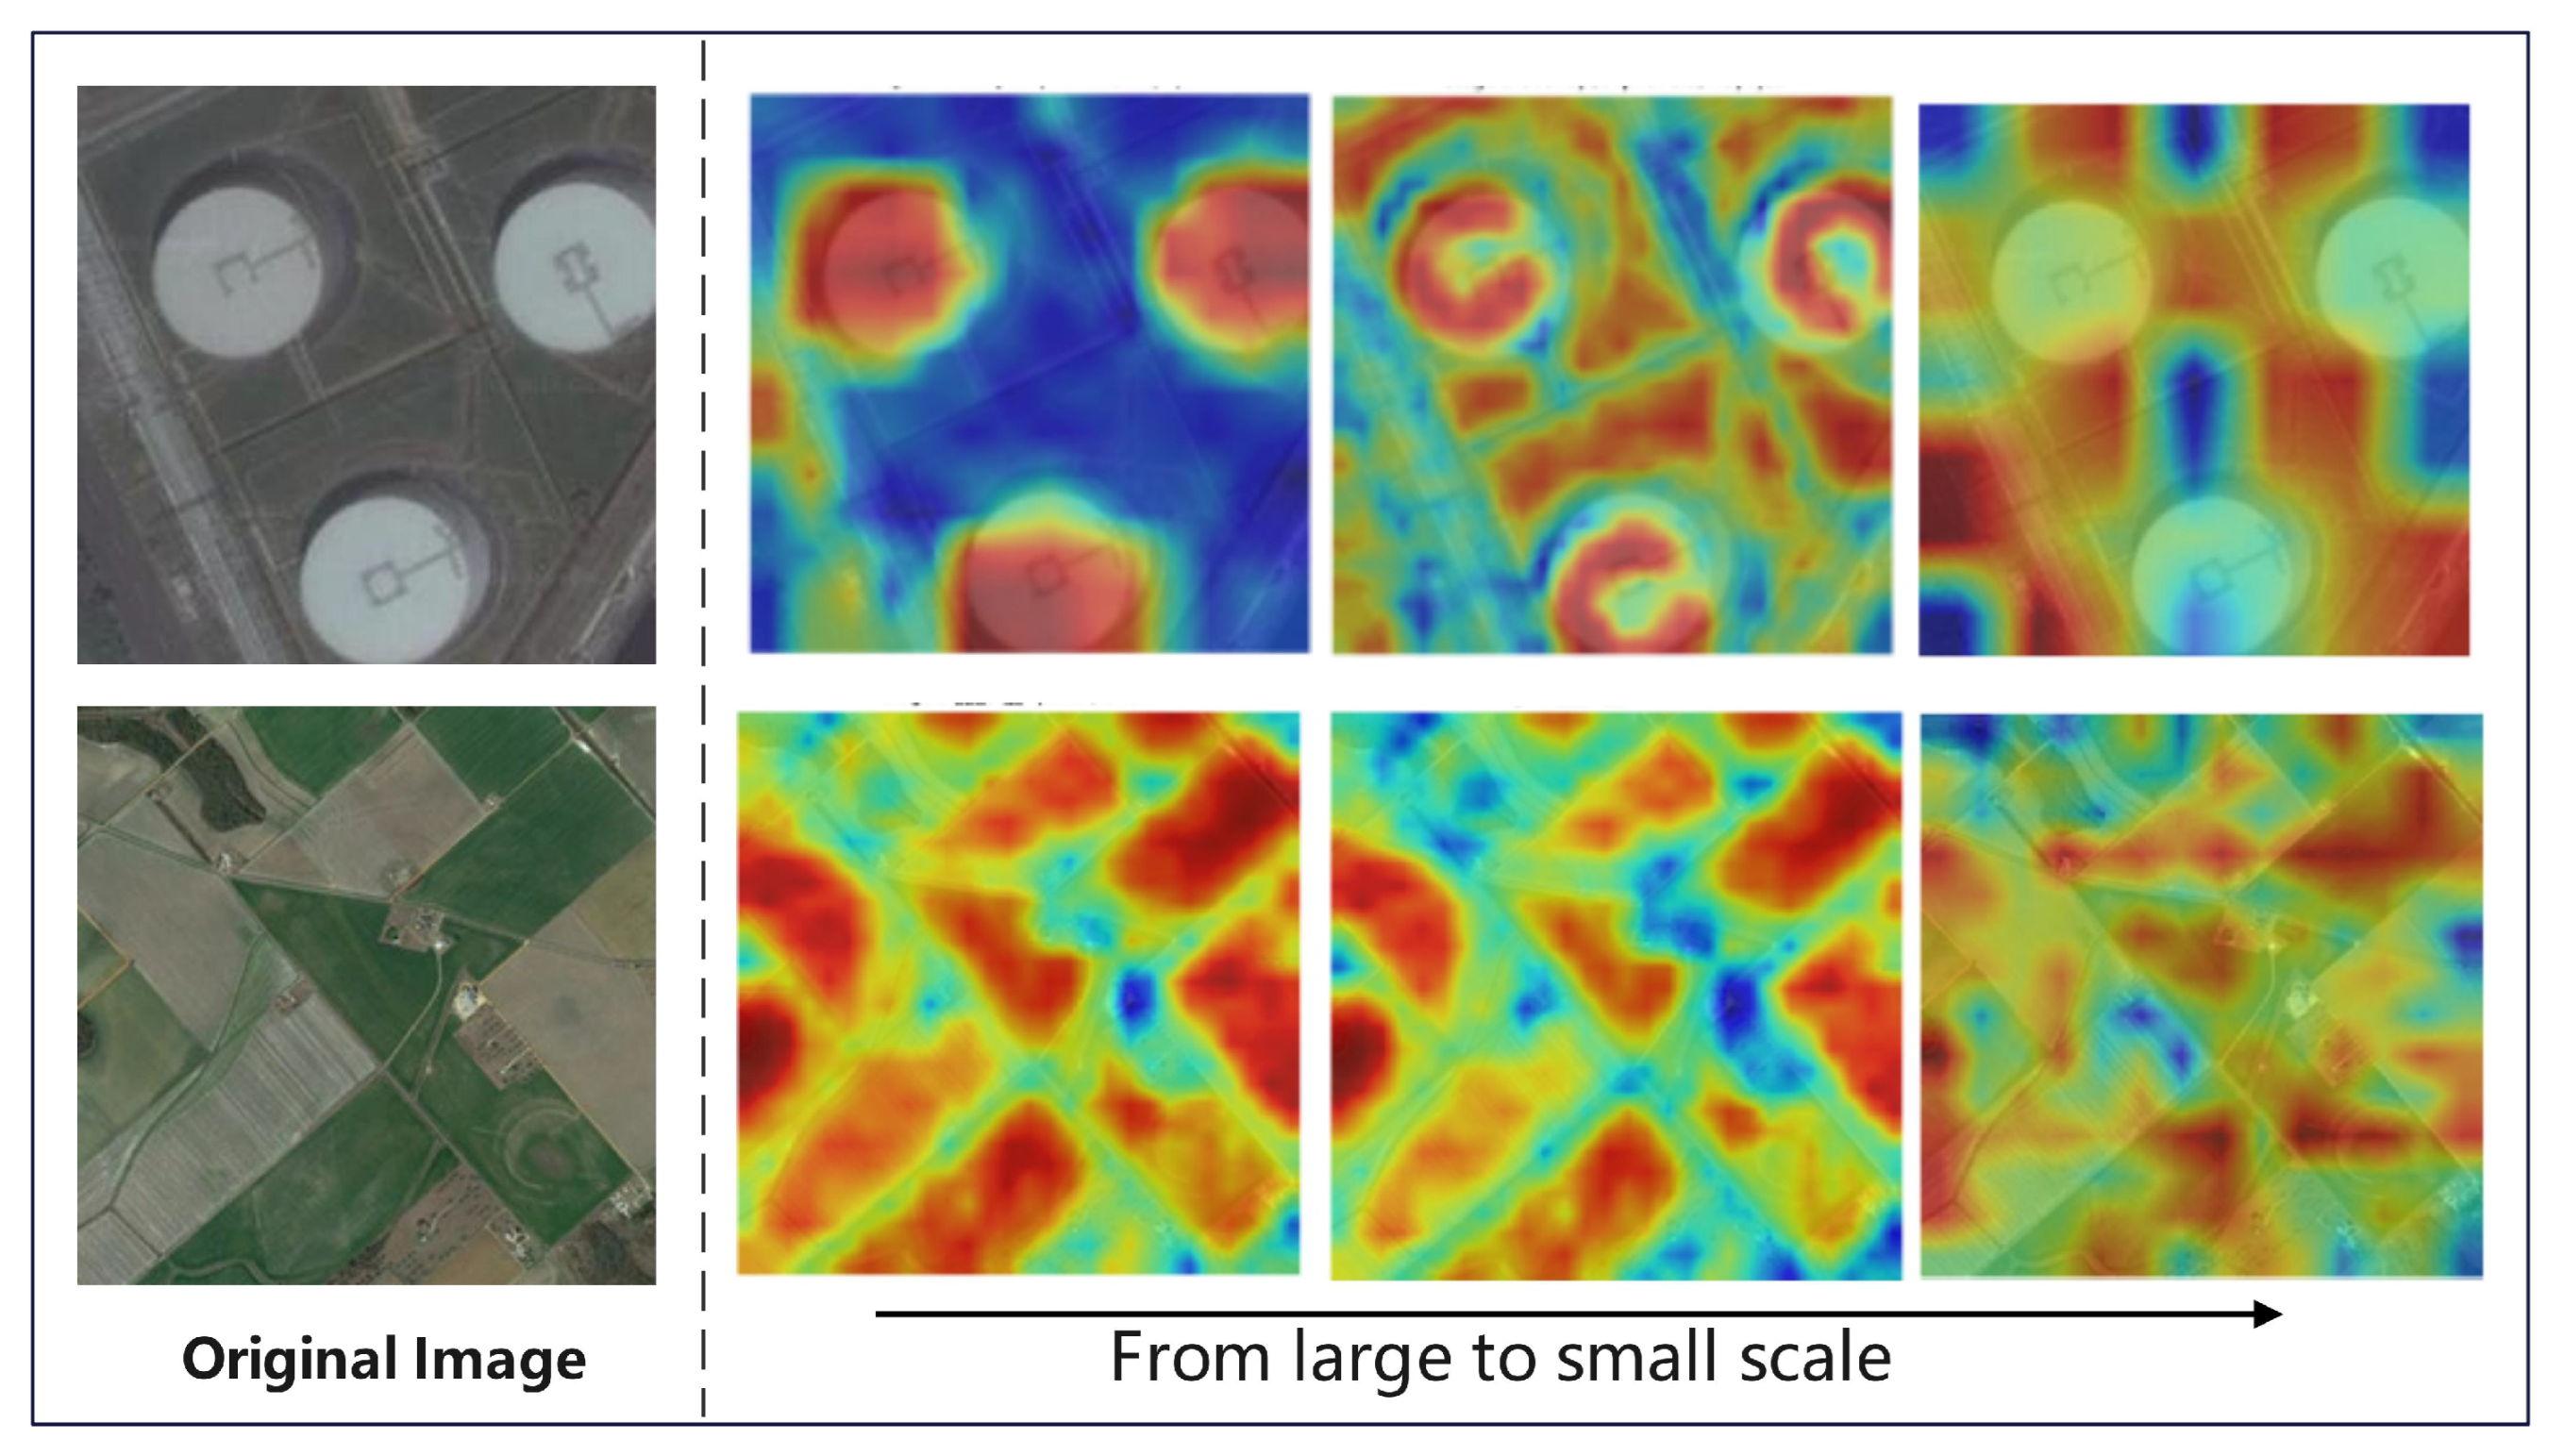
As shown in Figure 8, the visual results of the PSCJA mechanism at multiple scales intuitively validate its hierarchical semantic perception and scale-adaptive representation capabilities. In the industrial scene of oil tanks, the larger-scale feature maps clearly capture multiple targets and their boundaries. As the scale of the feature maps decreases, the areas of focus gradually expand from the overall oil tank to the spatial relationships of the surrounding facilities. In the agricultural scene, PSCJA effectively captures the global semantic structure of the scene, which corresponds closely to the salient visual information of the original image. This indicates that our proposed joint attention mechanism, transitioning from local to global spatial channels, aligns well with the characteristics of RS images.
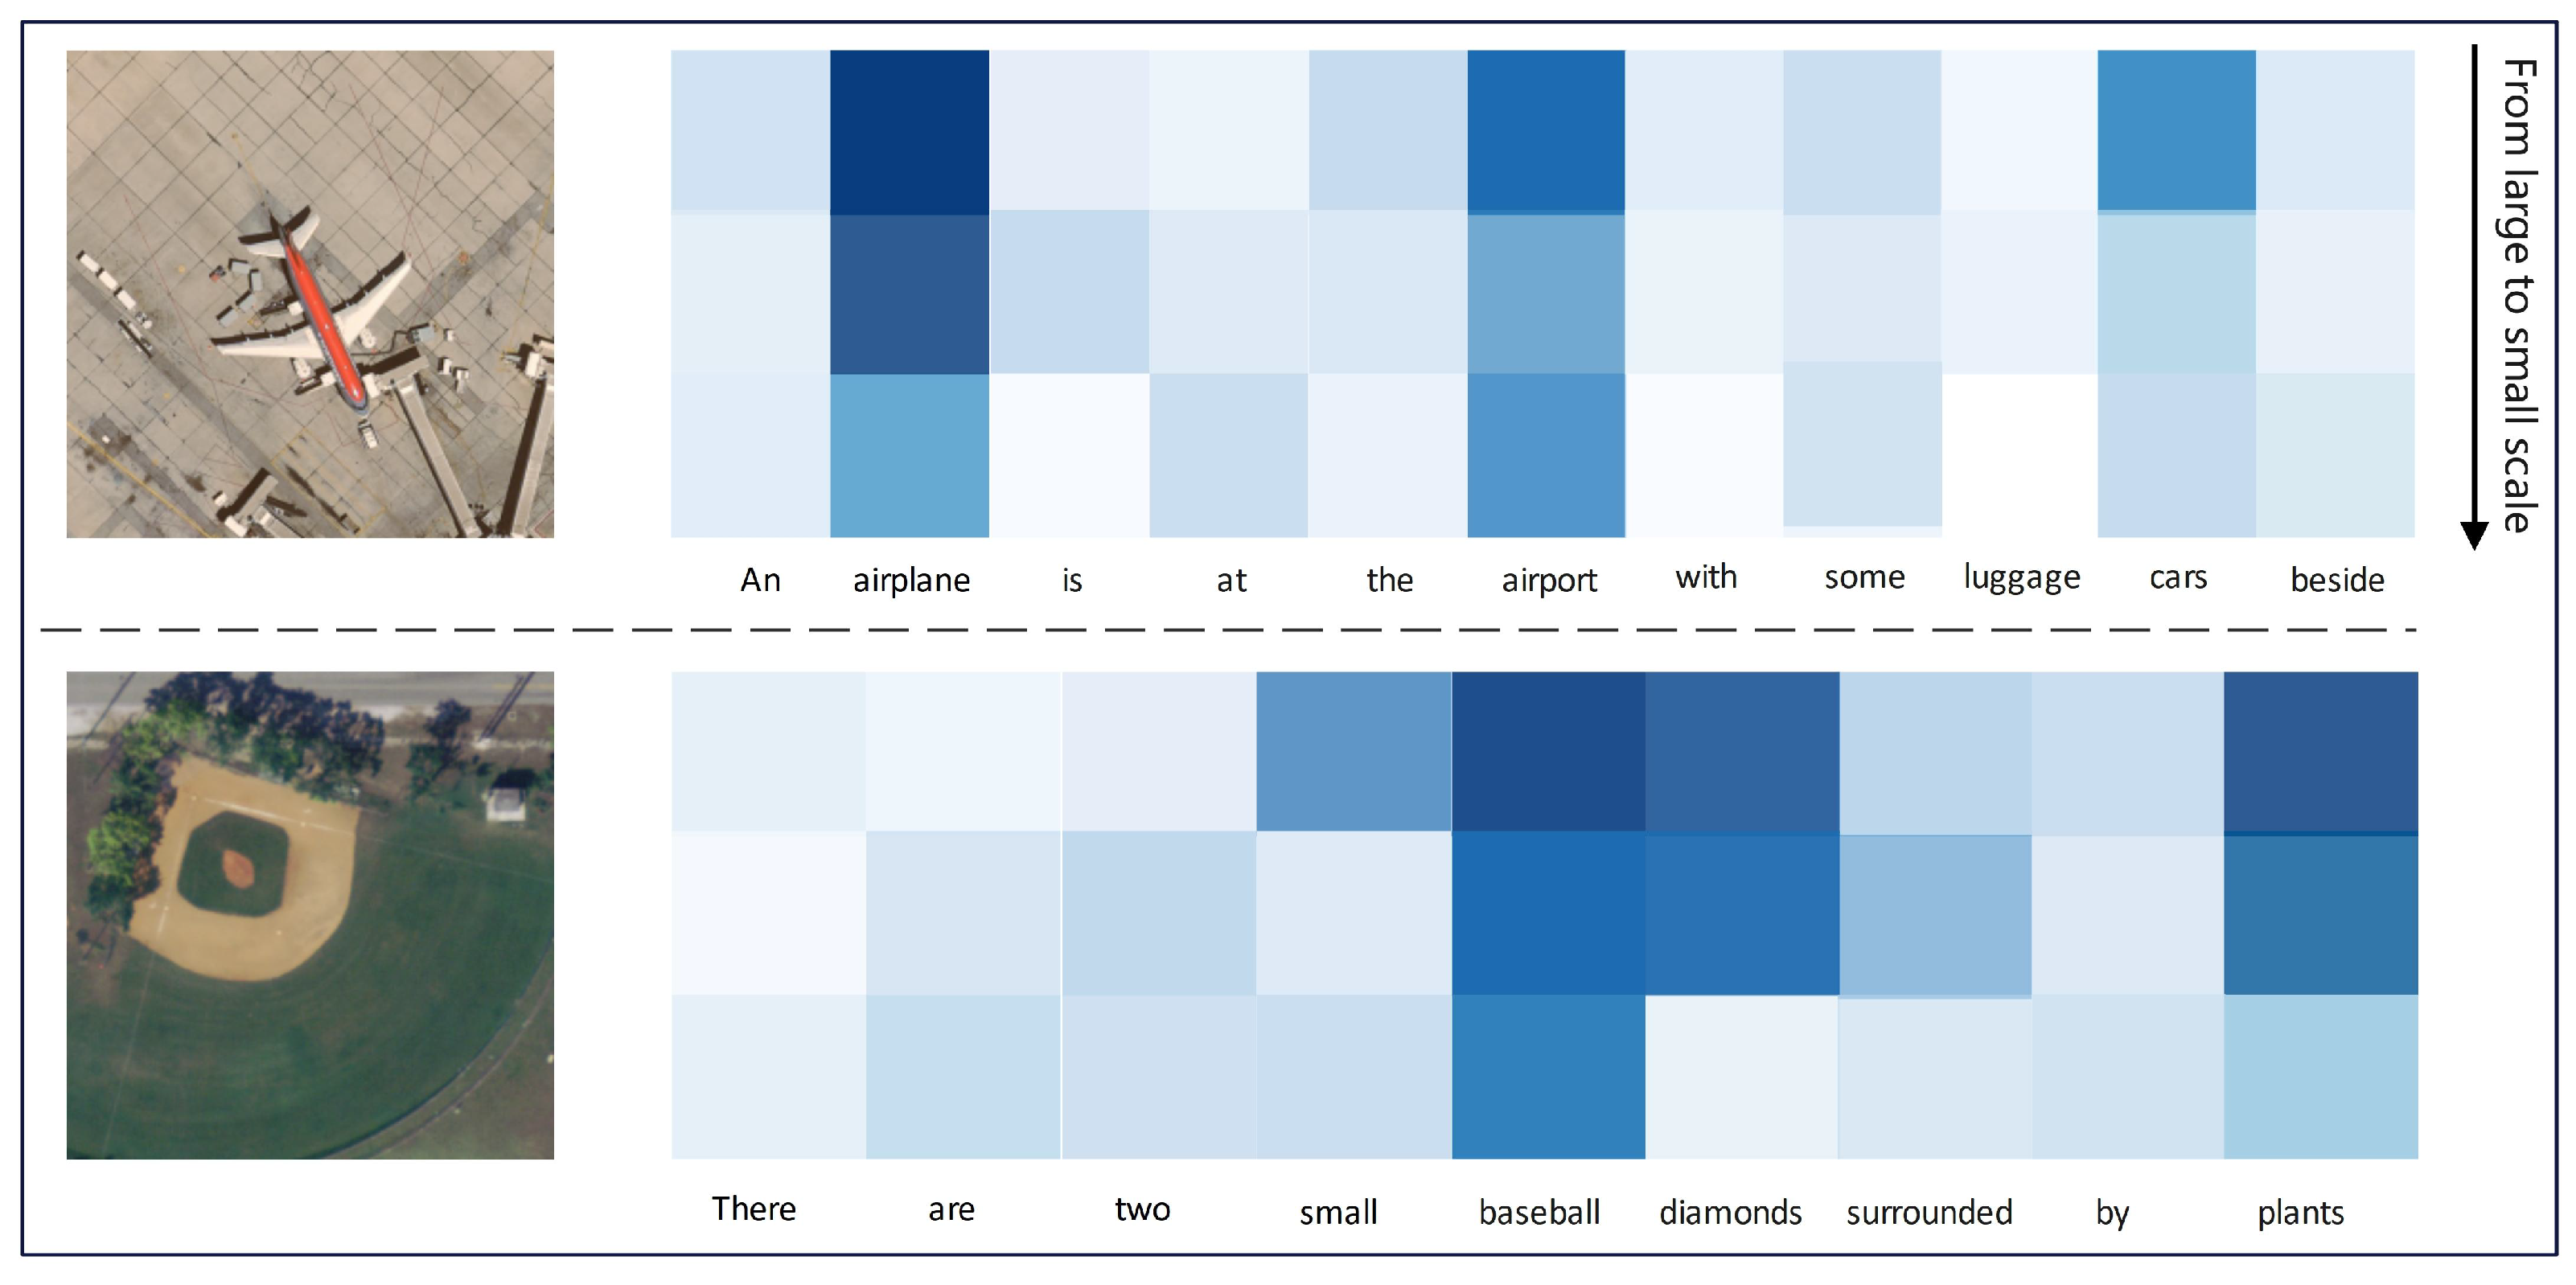
To verify the effectiveness of the IGTA, we visualized it. As shown in Figure 9, two cases are presented, with the horizontal axis representing each word described in the sentence and the vertical axis representing features at different scales, decreasing in order from top to bottom. We use the depth of color to reflect the attention level of each word. The darker the color, the higher the attention weight of the word. In the first example, the airport RS image and the text ”An airplane is stopped at the airport with some luggage cars nearby” correspond to higher attention weights for words such as “airplane”, “airport”, and “luggage cars” in the text, accurately matching with visual content such as airplanes and airport facilities in the image. In the second example, the RS image is of a baseball field and the text description is “Two small baseball diamonds surrounded by plants”. The attention weights of words such as “baseball diamonds” and “plants” have significantly increased and are highly correlated with visual elements such as baseball fields and surrounding vegetation in the image. This indicates that IGTA has successfully focused text features on image related semantic information through cross-modal attention computation, verifying its design goal of guiding text to focus on image related content and improving the interpretability of cross-modal semantic alignment.
The cross-modal RSITR task requires combining information from multiple levels of representation, ranging from basic visual attributes (e.g., color, shape, and surface patterns) to intermediate features (such as key objects and their interactions), as well as high-level semantics and rich contextual information, to accurately understand and match images with text. MSSA is designed to extract multi-scale features and performs cross-modal semantic perception across three distinct hierarchical levels. With the aim of evaluating the rationality and necessity of this multi-scale strategy, we conducted ablation experiments on feature maps generated from the original images at scales of 1/8, 1/16, and 1/32, as well as various combinations of these scales, and compared their retrieval accuracy and inference time.
As illustrated in Table 6, the 1/8 resolution feature map attained an mR score of 52.91, which is 0.47 and 1.70 higher than the results from the lower resolution scales of 1/16 and 1/32, respectively. Although 1/8 resolution feature maps preserve more effective information to improve performance, they result in higher processing speed overhead; on the contrary, 1/32 resolution feature maps provide the fastest processing speed, but lose a large number of key tokens. This reflects a clear trade-off between the performance and processing speed of higher resolution feature maps. In addition, feature combinations from different scales produced better results, with mR values of 54.94, 54.42, and 53.49, significantly exceeding the results of single-scale features while their processing speed remained within an acceptable range without excessive speed loss. This demonstrates the synergistic effect of multi-scale features in enhancing model performance while balancing processing efficiency. Considering the above analysis, we ultimately chose feature maps of 1/8, 1/16, and 1/32, which allow for feature enhancement and semantic perception within and across modalities at each scale. This strategy overcomes the limitations of single scale features (slow speed or poor performance) and achieves more robust performance improvements at a reasonable processing speed.
CMSAM introduces learnable semantic tokens at three different scales to harvest a sophisticated semantic understanding from visual and textual attributes; this approach aims to strengthen the association between the two modalities and enhance the final matching performance. Generally, a greater number of tokens can capture richer and more diverse semantic information, as each token can learn different patterns and details. However, increasing the number of tokens also raises the model’s computational complexity and training difficulty. To examine this trade-off, we adjusted the number of learnable semantic tokens and evaluated its impact on the model performance.
As shown in Table 7, as the number of learnable semantic tokens increases gradually to fewer than 20, the mR value exhibits a stable upward trend, indicating that effective learning of semantic information. When the number of tokens reaches 25 and 30, the mR values are 56.22 and 56.33, respectively, which are 0.05 and 0.17 higher than the result with 20 tokens, with only minimal fluctuations. This phenomenon suggests that, beyond 20 tokens, additional tokens do not lead to substantial gains in information and may introduce redundancy or unnecessary information noise. In the process of semantic extraction, 20 tokens is adequate to encompass the vast majority of useful semantic information, thereby achieving optimal performance.
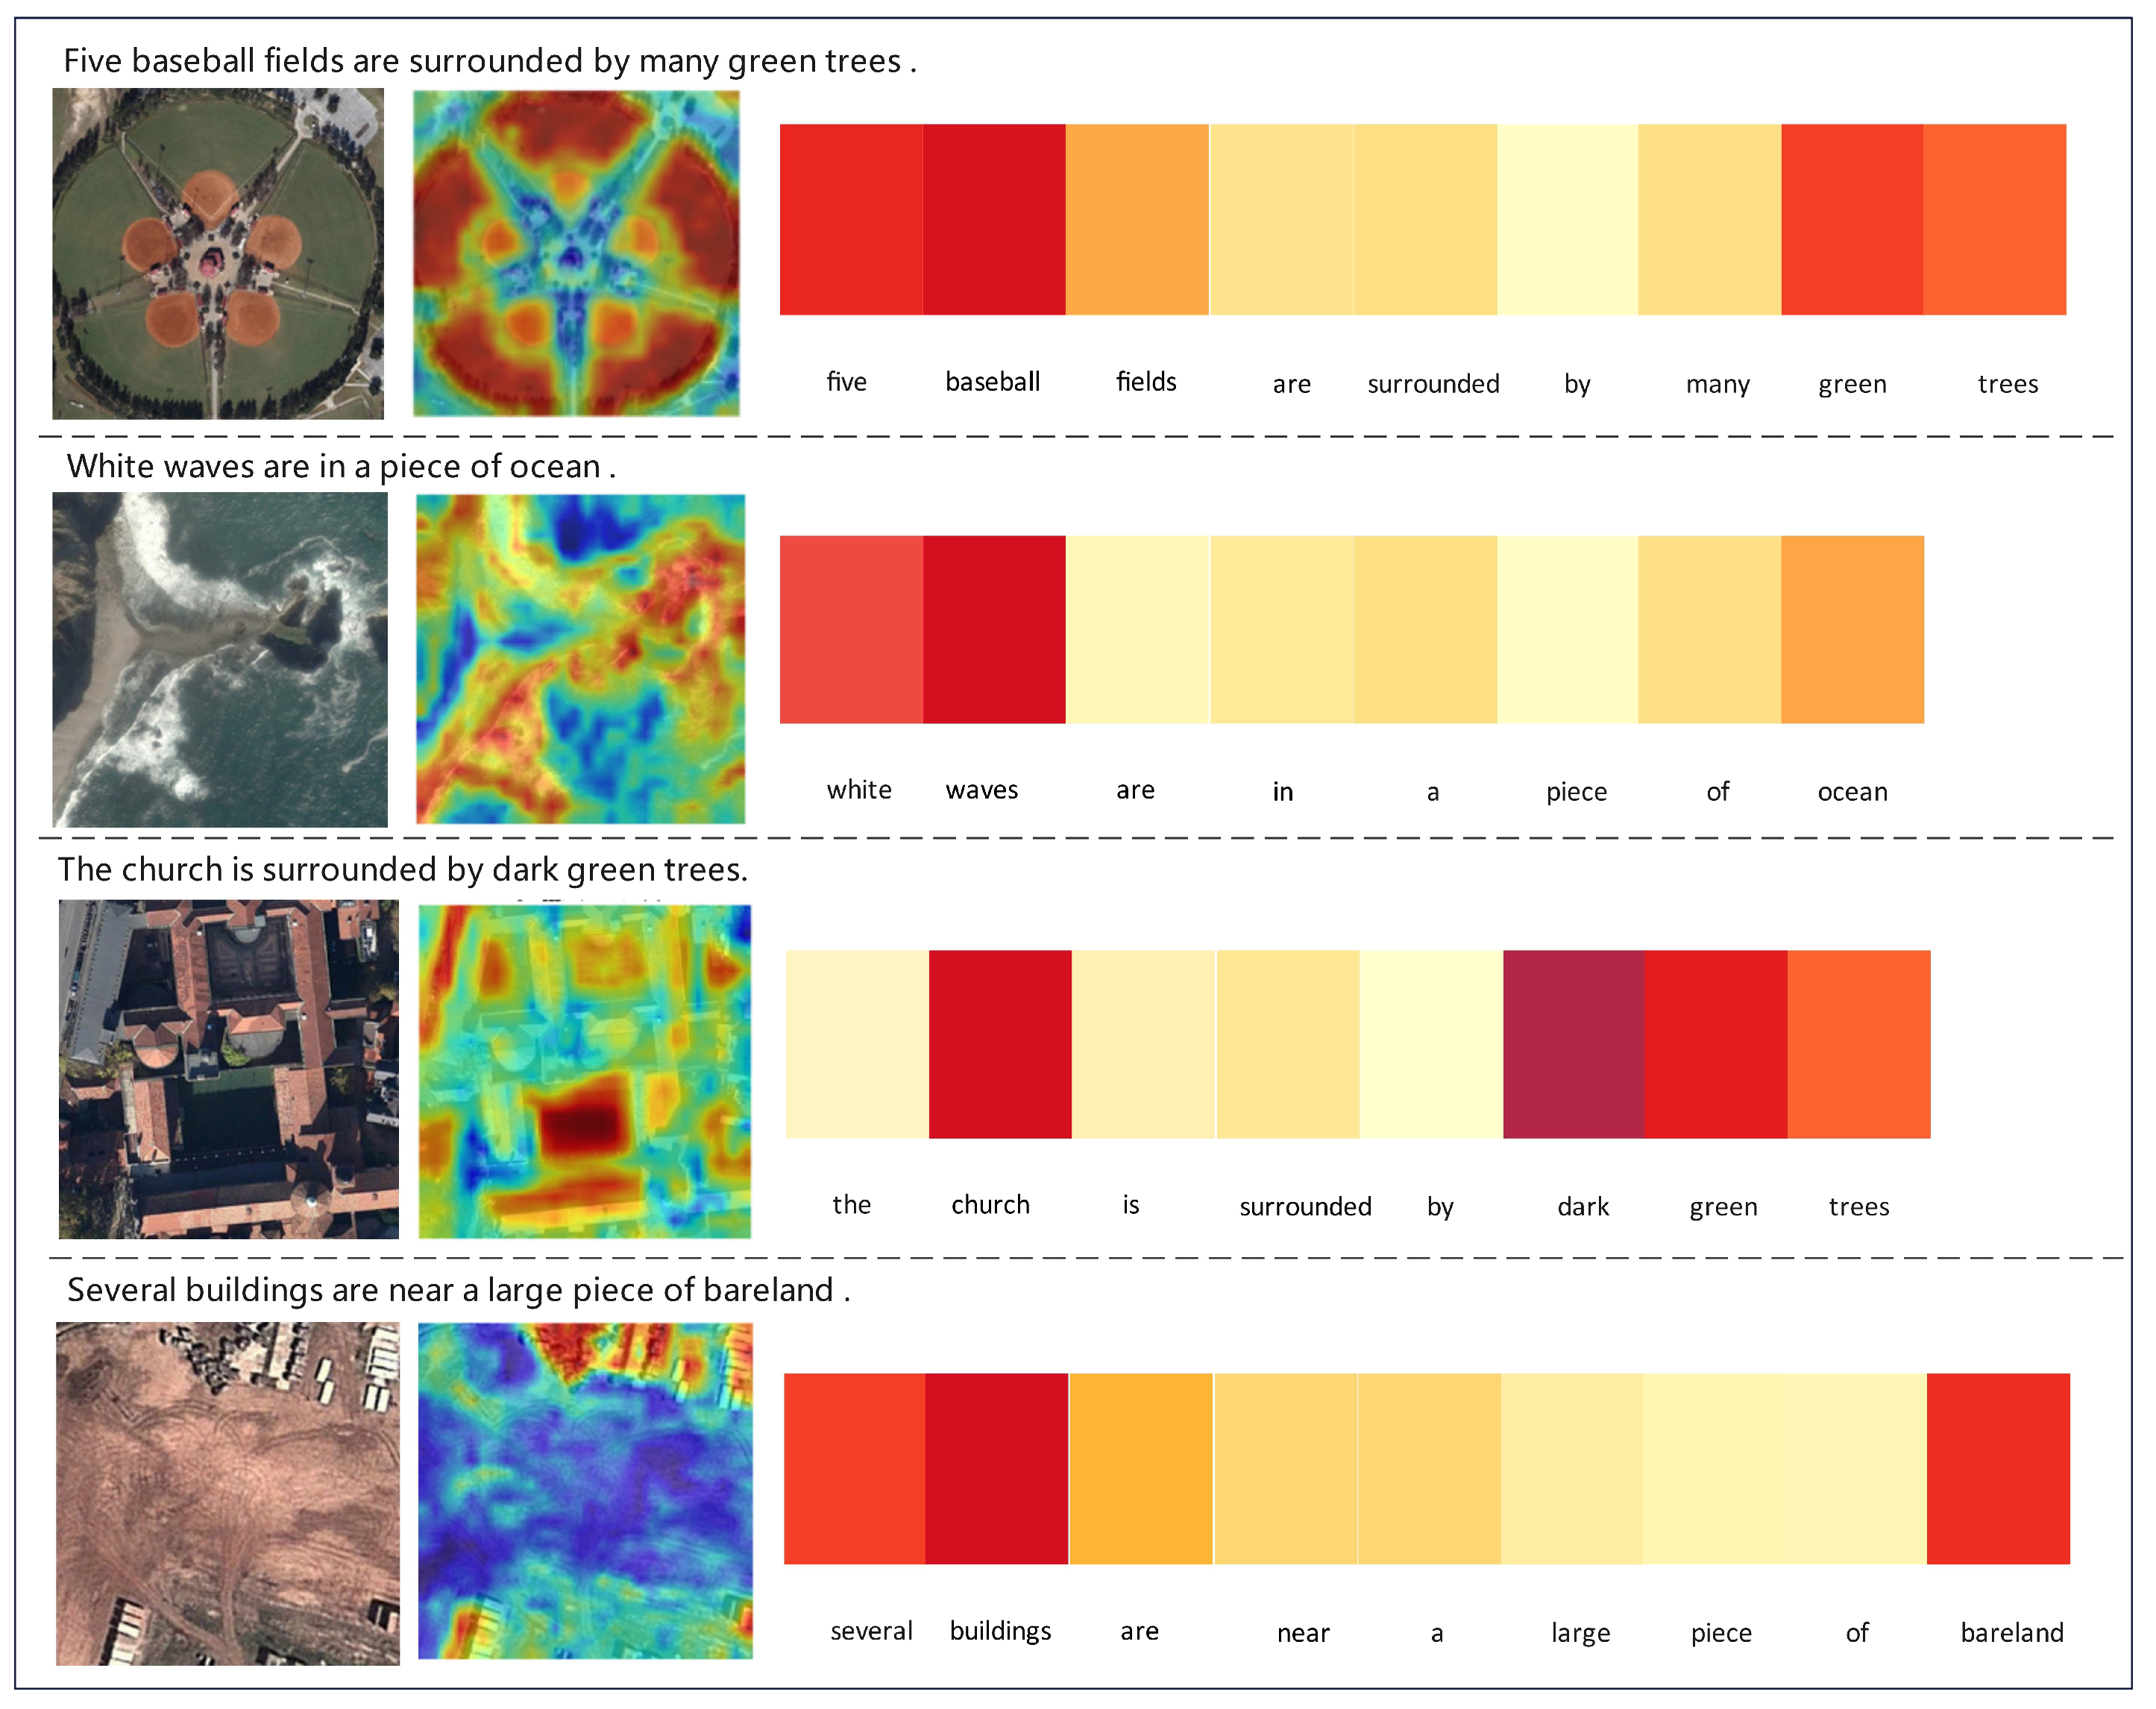
We visualized the learnable semantic tokens of the CMSE module, as shown in Figure 10. The left side displays the original image along with its corresponding textual description, while the right side illustrates the visual results of the semantic extraction from the image and text. From the experimental results, it is evident that the learnable semantic tokens accurately capture salient information across different modalities for various scenes, such as baseball fields, oceans, and barren land. The heatmaps of the learnable semantic tokens on the image side precisely locate the core visual regions (e.g., baseball fields, white waves, church buildings, bareland, and surrounding structures). Additionally, the attention intensity on the text side is closely related to the semantic significance of the text (e.g., the core meanings of “five/baseball fields”, “white/waves”, “church”, “dark green trees”, “several buildings/bareland”). The learning outcomes regarding quantity, target scope, color, and spatial relationships demonstrate a precise cross-modal alignment, which effectively validates the capability of the two sets of learnable semantic tokens in capturing the core semantics of both images and texts, as well as achieving cross-modal semantic matching.
We compared PSCJA with three Transformer-based attention mechanisms, Params and Flops, as shown in Table 8. Vanilla MSA is a standard multi-head self-attention mechanism that provides a baseline for traditional self attention methods despite its high computational complexity. SW-MSA adopts a sliding window with relatively low parameter count of only 16.83 M and FLOPs of 41.29 G, this indicates that SW-MSA can significantly reduce computational overhead when dealing with long sequences. PSCJA takes into account both local and global saliency features across spatial and channel dimensions, with a parameter count of 17.46 M and FLOPs of 43.31 G. Its complexity is slightly higher than that of SW-MSA, yet significantly lower than that of FSA.
To exclude interference from the text feature encoder, we systematically compared several image feature extraction networks, including ResNet series (ResNet18, ResNet50, ResNet101) and ViT. As can be seen from Table 9, ViT emerged as the top-performing image feature extraction model, achieving the mR value of 56.45. Among the ResNet series, ResNet50 delivered the best result, recuring second place overall with an mR value of 56.16, which is only 0.29 lower than ViT. However, it outperformed ResNet18 and ResNet101 by 0.36 and 2.48, respectively. Although ViT has a slightly better retrieval accuracy than ResNet50, its computational cost is much higher. From the perspective of model efficiency, ViT has 86.3 M parameters, which is approximately 3.2 times that of ResNet50 (26.28 M); at the same time, the inference time of ViT is 38.2 ms per image, while ResNet50 is 28.64 ms. The improvement in retrieval accuracy obtained from this approach is not cost-effective compared to the computational cost. Therefore, ResNet50 is chosen as the image feature extractor to achieve a more reasonable balance between performance and efficiency.
As shown in Figure 11a, the figure displays the variation trend of mR values across the UCM Caption dataset, where it can be observed that the mR value gradually increases throughout the training process, reaching its maximum at the 32nd epoch, and then shows a fluctuating downward trend. Figure 11b presents the change curve of the loss value, which is evident that the loss value decreases gradually during training, with a significant drop before the 30th epoch, followed by a slower reduction thereafter. As evidenced by these results, the developed algorithm displays reliable convergence properties.
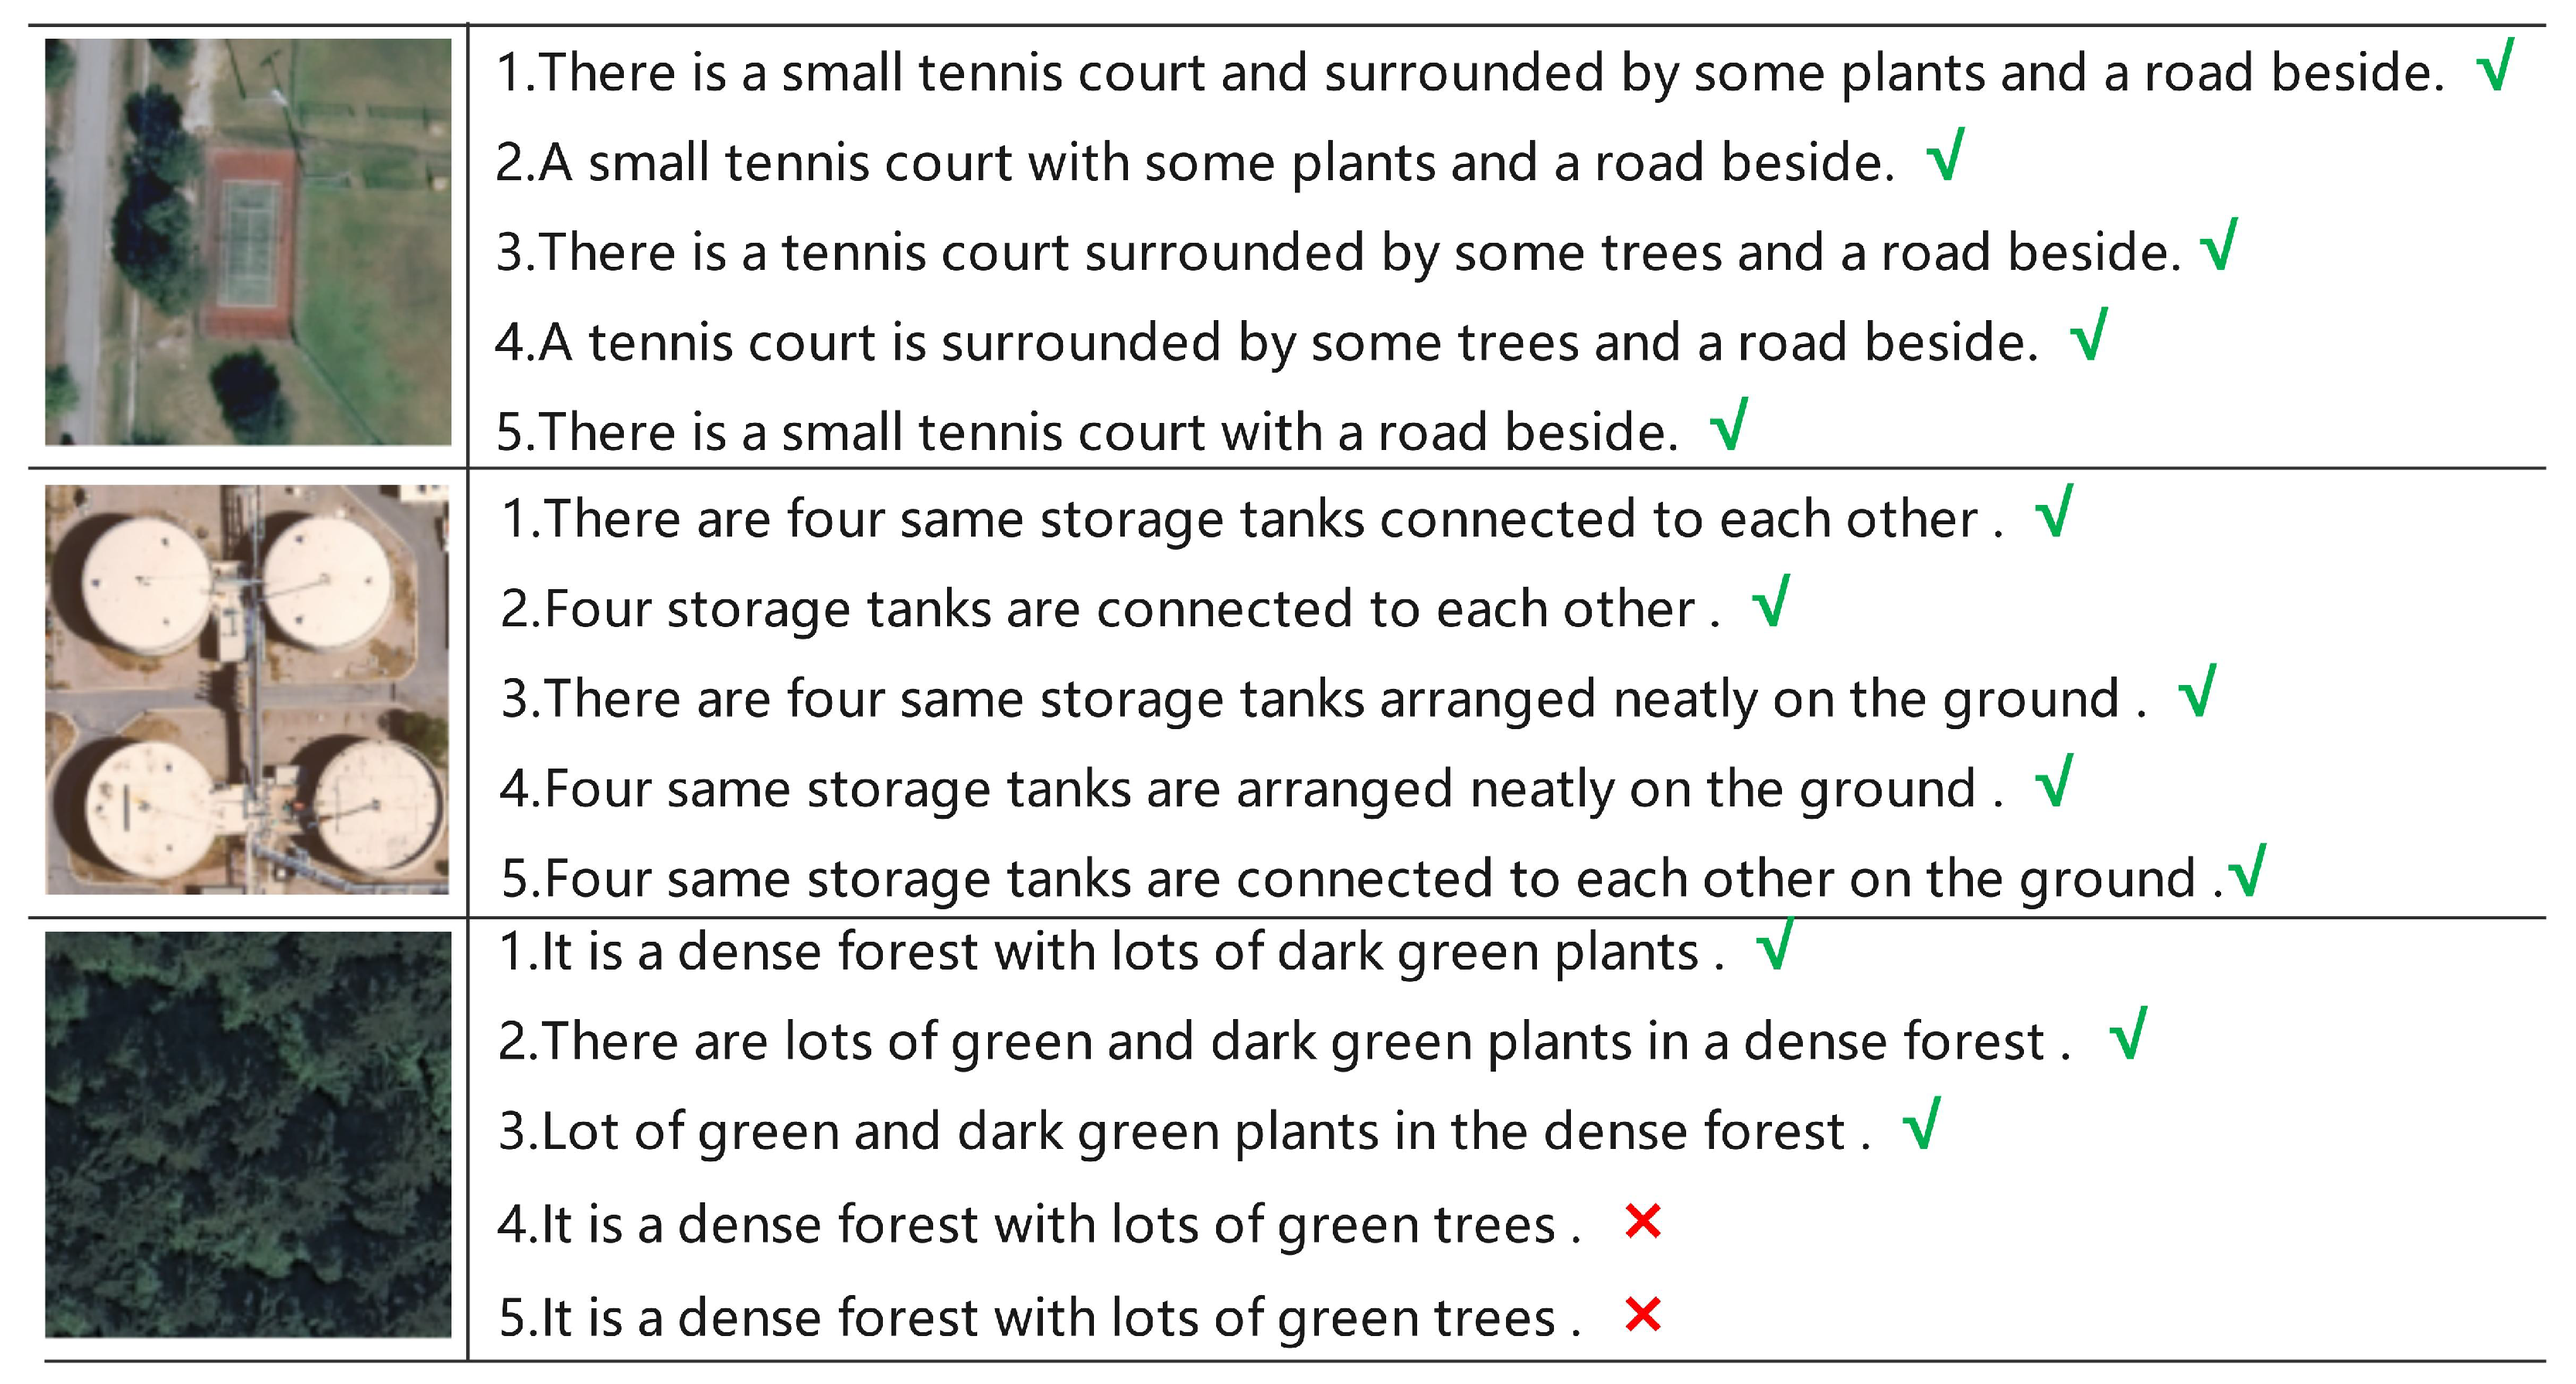
To intuitively verify the cross-modal retrieval performance of the proposed method, we conducted retrieval visualization experiments for “image-to-text” and “text-to-image” on the UCM Caption dataset. Displayed the top 5 retrieved results. The green markers in the figure indicate ground truth, while the red markers indicate incorrect search results. Looking at Figure 12, for the first query image, the top five text descriptions accurately capture core information such as “tennis court”, “surrounding plants”, and “adjacent road”, and the descriptions of details like “small” and “trees/plants” also match the images. The second query image accurately covers key semantics such as “four storage tanks” and “connected/arranged neatly”. For the third query image, the first three descriptions correctly express “dense forest” and “dark green plants”, but the fourth and fifth descriptions mistakenly refer to “plants” as “trees”, reflecting the model’s deficiency in distinguishing subdivided semantics like “general vegetation” and “trees”.
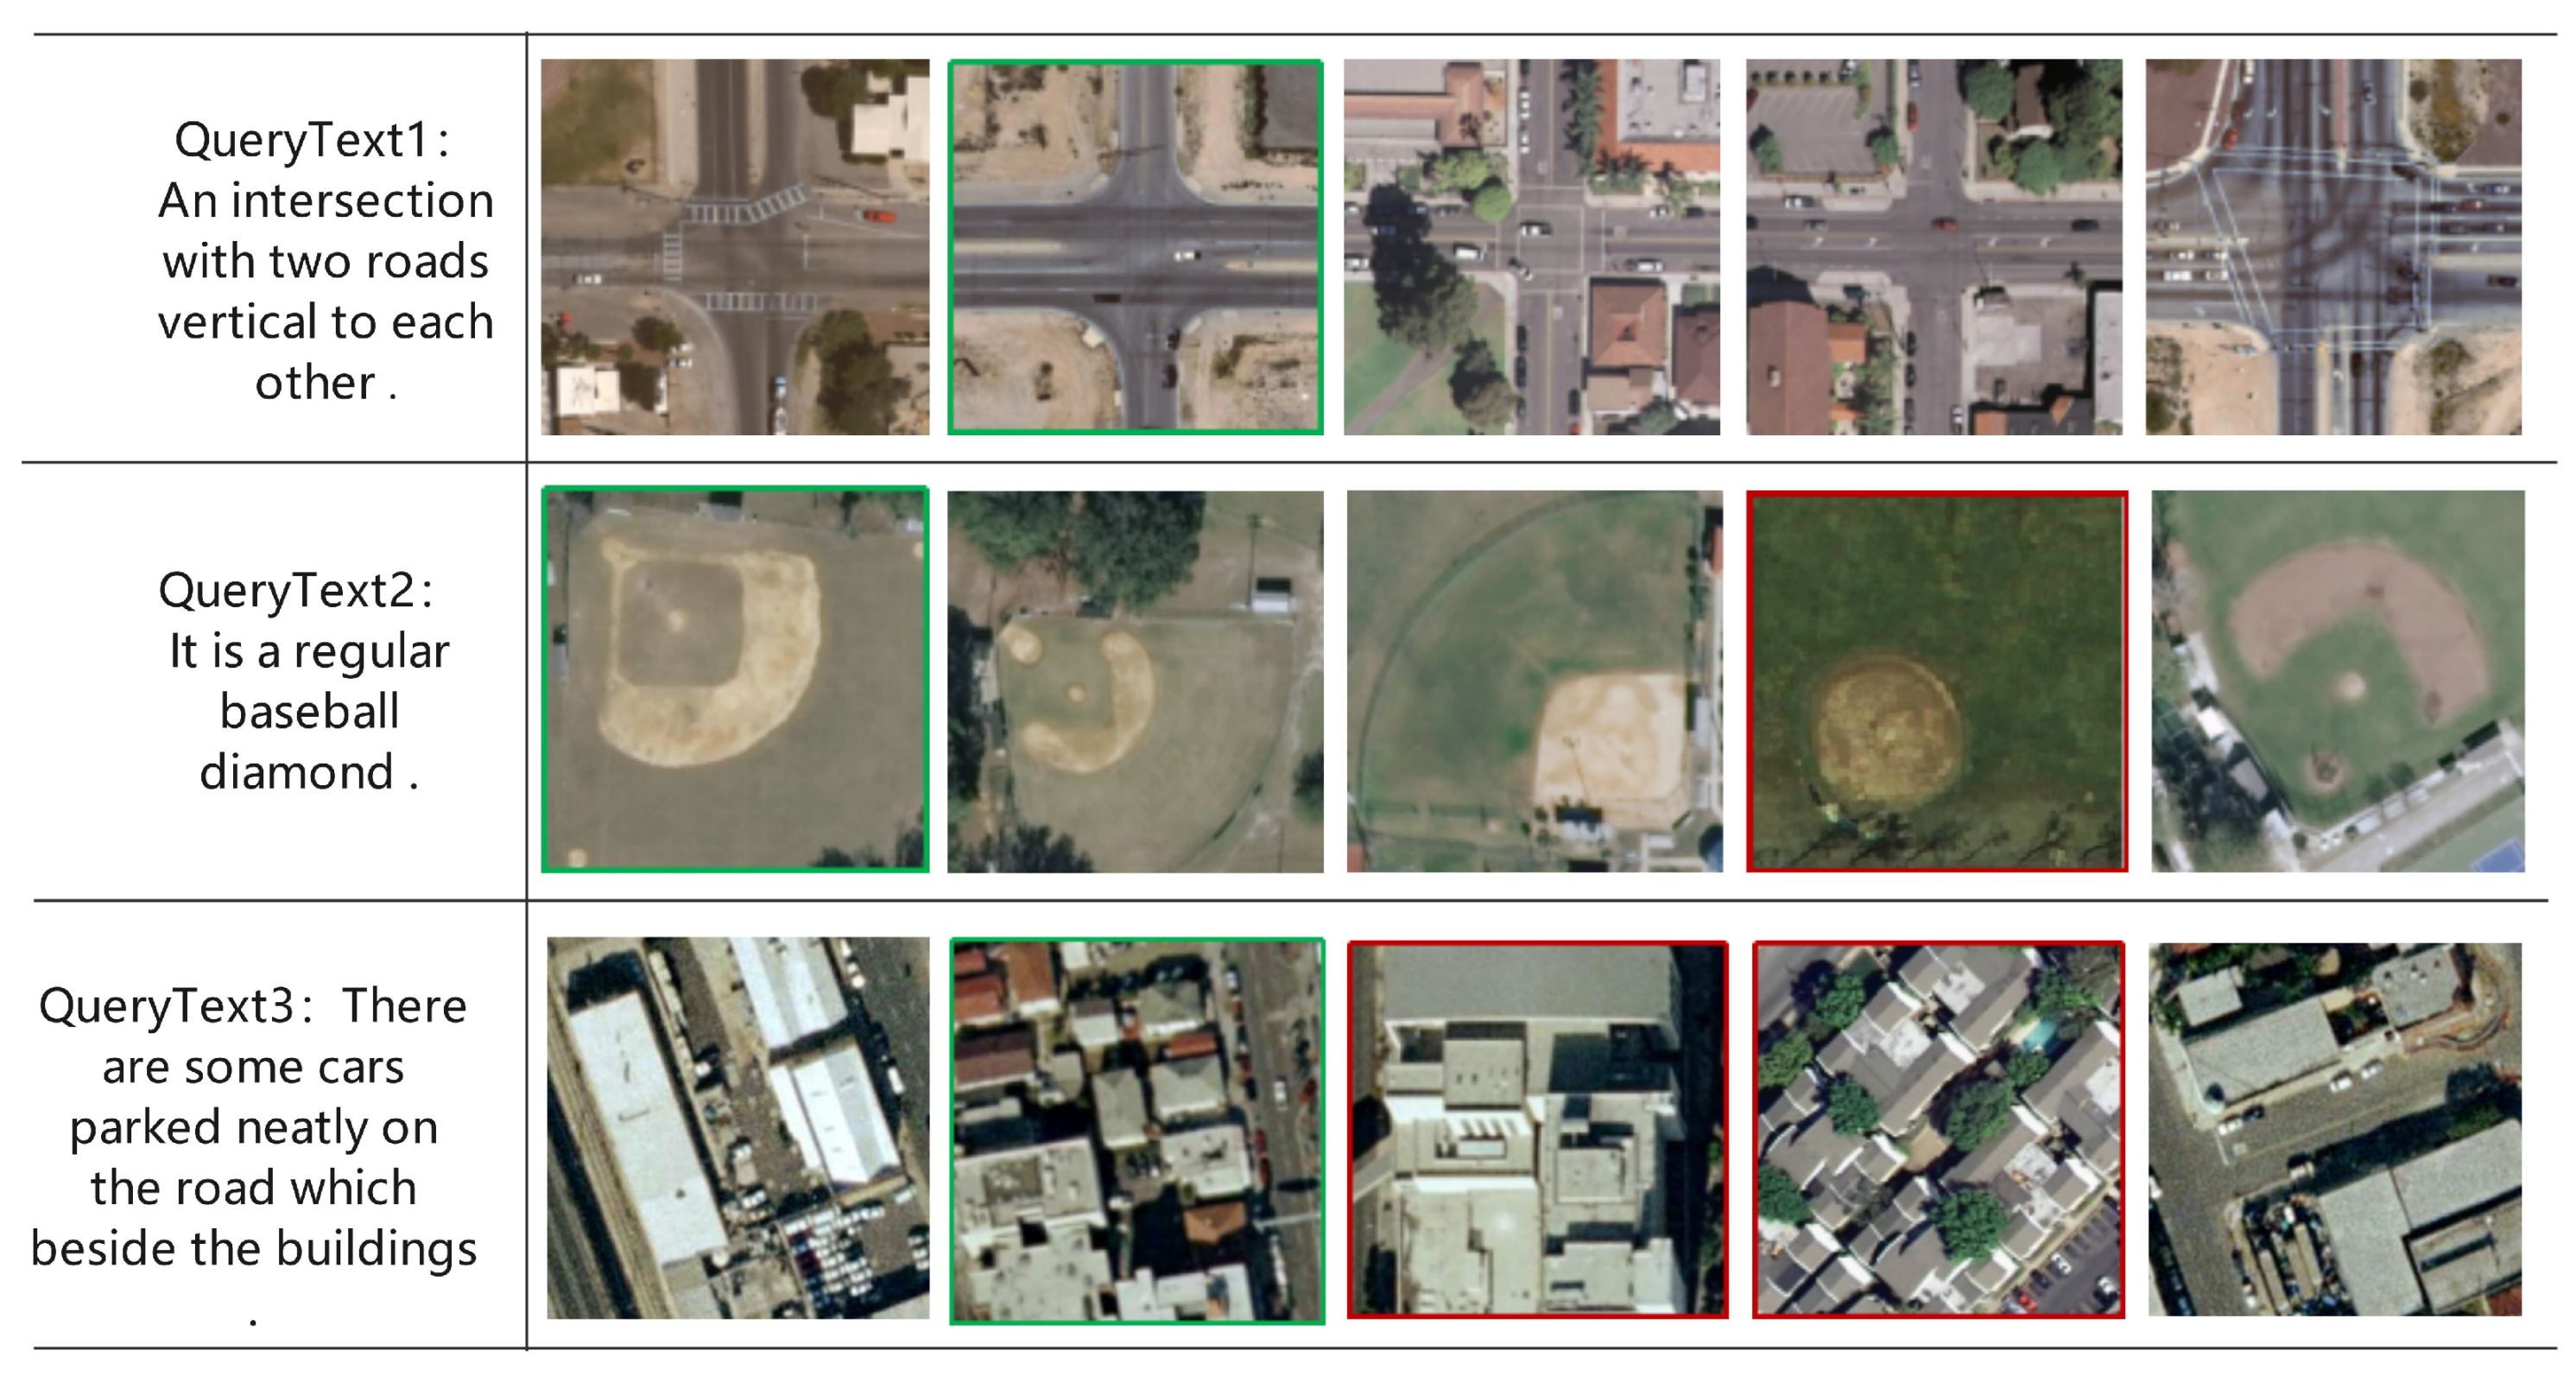
In the visualization results shown in Figure 13, for QueryText1, the top three retrieved images accurately match the intersection shape, and the ground truth result marked in green ranks second, indicating that the model can effectively understand the spatial relationship of “intersection” and “roads vertical”. The first three results for QueryText2 accurately present the diamond-shaped field features, while the fourth image is marked red due to deviations in the field shape, showing that the model still has room for optimization in judging precise geometric shapes like “regular baseball diamond”. For QueryText3, the first and second images contain buildings and roads but lack prominent vehicle features, and the third and fourth images are marked red because they lack the core element of “cars parked neatly”, indicating that the model still needs to be strengthened in the semantic alignment of fine-grained objects (such as “cars parked neatly”). These shortcomings also spurred our further efforts.
6. Discussion

Based on the detailed description of MSSA in Section 4 and the comprehensive experimental results and visual analyses in Section 5, the proposed MSSA method demonstrates advantages for multi-scale, semantic-aware remote sensing image–text retrieval. Compared with the classical AMFMN, MSSA improves mR by 10.08%, 15.68%, and 16.01% on the three evaluated datasets, respectively. This is mainly because AMFMN merely performs a simple multi-scale fusion, which struggles to balance the preservation of local details with the modeling of the global context. In contrast, MSSA enhances the discriminability of RS image features via PSCJA, which jointly optimizes the spatial and channel dimensions through WRGPA and SCA. The visualizations of PSCJA in Figure 8 show that our method more accurately separates foreground from background and captures object counts and boundaries. Furthermore, while SSJDN’s scale-semantic joint decoupling mitigates cross-scale interference, it does not substantially improve the intrinsic representational quality of the multi-scale features; MSSA enhances multi-scale features through PSCJA and IGTA, resulting in an increase of 11.67% in mR value (45.40%) compared to SSJDN (33.73%) on the RSITMD dataset. Moreover, even when compared to SMLGN, which employs a more complex backbone network for feature extraction, MSSA secures clear improvements in retrieval accuracy on the UCM Caption and RSITMD datasets. This indicates that our approach’s feature enhancement and semantic-aware processing can effectively recover retrieval-critical representations, even from sub-optimal initial features. In summary, through the synergistic interaction of the PSCJA, IGTA, and CMSE modules, MSSA achieves more robust intra-modal multi-scale enhancement and deeper cross-modal semantic alignment, establishing a new state-of-the-art in RSITR.

6.1. Limitations Analysis

Despite MSSA showing promising performance, it has several limitations that merit further investigation. First, while multi-scale features are critical for retrieval accuracy, they also introduce substantial attention computations, i.e., additional parameters, when processing high-resolution RS images with parallel multi-scale branches, both computational cost and memory footprint increase markedly. This results in higher inference latency and large GPU memory consumption. As shown in Table 6, the three-scale fusion inference time (28.6 ms) is nearly twice that of the single-scale (1/32: 14.8 ms), and such overhead constrains the feasibility and deployment efficiency of MSSA in million-image galleries, real-time RSITR applications (e.g., disaster response, online environmental monitoring), and resource-limited devices. Second, many RS scenes with different semantics are visually similar in texture, color, and spatial arrangement, so matching based on global or coarse-grained multi-scale embeddings tends to confuse appearance-similar but semantically distinct samples. The third query example in Figure 13 (where the fourth retrieved image confuses “residential area” with “buildings”) illustrates this issue. Finally, the model’s performance is affected by long-tail data distribution. For semantic concepts with low frequency in the training data, the model learns suboptimal visual–textual associations. This inadequacy limits its capability to accurately recognize rare or relation-dependent concepts, leading to a non-negligible rate of false positives in tasks requiring fine-grained semantic or relational understanding.

6.2. Future Work

To mitigate the computational burden while preserving retrieval accuracy, several strategies can be explored. These include model compression techniques, such as structured pruning and low-rank decomposition, numerical quantization (e.g., INT8 or mixed-precision inference), and knowledge distillation to transfer the knowledge from the computationally expensive MSSA model into a compact student network. Furthermore, the global dense attention mechanisms could be replaced with more efficient alternatives, such as sparse, local, or approximate attention, to reduce computational complexity. Another promising direction is the adoption of a two-stage retrieval pipeline. In the first stage, a lightweight model would rapidly retrievel a set of candidate matches using global descriptors. Subsequently, a second, more sophisticated stage would perform fine-grained, region-level or relation-level similarity computation for re-ranking of the candidate set. These optimizations have the potential to enable near-real-time deployment within acceptable resource constraints while maintaining—or even closely approaching—the original retrieval accuracy.
To enhance the model’s capability to discriminate between visually similar yet semantically distinct samples, future work should focus on strengthening fine-grained and relation-aware modeling through both representation learning and architectural innovations. From a representation learning perspective, strategies such as hard-negative mining and supervised contrastive losses can be employed to sharpen feature discrimination. Furthermore, the training set can be augmented with synthetically generated hard negatives and targeted data augmentation techniques, particularly to increase the representation of low-frequency semantic concepts. Architecturally, it is promising to incorporate local feature representations, potentially derived from object detection or superpixel segmentation, alongside mechanisms for cross-attention region alignment. To explicitly model complex scene structures, the integration of scene graphs, relational representations, or Graph Neural Networks (GNNs) could be explored to capture object spatial topology and semantic relationships effectively. Moreover, the fusion of multi-source information may provide complementary cues for disambiguation. The development of dedicated benchmark sets and fine-grained evaluation metrics tailored for high-similarity cases is also crucial to reliably quantify progress in this challenging area. Finally, these advanced techniques could be integrated into a two-stage re-ranking procedure, complemented by confidence calibration, to substantially reduce the false positive rates attributable to visual ambiguities.

7. Conclusions

Existing RSITR approaches primarily emphasize the integration of imaeg features across multiple scales, overlooking the enhancement of hierarchical feature representations and effective capture of scene semantic. This results in challenges when aligning the visual and linguistic representations at the semantic level. Thus, we propose a Multi-Scale Semantic-Aware Remote Sensing Image–Text Retrieval method (MSSA). The core innovation of MSSA lies in the design of the CMSAM module, which incorporates the PSCJA and IGTA for both visual and linguistic features. Along with the introduction of learnable semantic tokens at each scale, the cross-attention interaction is employed to learn the advanced semantic information of image and text features separately, obtaining semantic clues at different scales to guide the model’s matching process. The comprehensive evaluation results of multiple datasets validate the effectiveness of MSSA. Though MSSA has improved the performance of RSITR, certain limitations remain. These include challenges in effectively balancing efficiency and accuracy, as well as potential information loss during the fusion of image and text features. We plan to conduct more in-depth research into these questions in forthcoming work.

Author Contributions

Conceptualization: Y.L.; methodology: Z.H. and Y.L.; investigation: Z.H.; validation: Z.H.; software: Q.D.; resources: Q.D.; formal analysis: F.J. and J.L. (Junhui Liu); data curation: N.C.; writing—original draft preparation: Z.H.; writing—review and editing: Y.L. and Z.H.; visualization: J.L. (Jiayi Lv); supervision: F.J.; project administration: Q.D. and J.L. (Junhui Liu). All authors have read and agreed to the published version of the manuscript.

Funding

The research was supported in part by Yunnan Provincial Graduate Supervisor Team Construction Project (No.SJDSTD-23233578).

Data Availability Statement

Our source code is published at https://github.com/LiaoYun0x0/MSSA (accessed on 11 September 2025).

Conflicts of Interest

The authors declare no conflicts of interest.

Abbreviations

The following abbreviations are used in this manuscript:
RSITRRemote Sensing Image–Text Retrieval
RSRemote Sensing

References

  1. Alzubaidi, L.; Zhang, J.; Humaidi, A.J.; Al-Dujaili, A.; Duan, Y.; Al-Shamma, O.; Santamaría, J.; Fadhel, M.A.; Al-Amidie, M.; Farhan, L. Review of deep learning: Concepts, CNN architectures, challenges, applications, future directions. J. Big Data 2021, 8, 53. [Google Scholar] [CrossRef]
  2. Vaswani, A.; Shazeer, N.; Parmar, N.; Uszkoreit, J.; Jones, L.; Gomez, A.N.; Kaiser, L.; Polosukhin, I. Attention Is All You Need. arXiv 2017, arXiv:1706.03762. [Google Scholar] [CrossRef]
  3. Goodfellow, I.; Pouget-Abadie, J.; Mirza, M.; Xu, B.; Warde-Farley, D.; Ozair, S.; Courville, A.; Bengio, Y. Generative Adversarial Nets; MIT Press: Cambridge, MA, USA, 2014. [Google Scholar]
  4. Mi, L.; Li, S.; Chappuis, C.; Tuia, D. Knowledge-aware cross-modal text-image retrieval for remote sensing images. In Proceedings of the Second Workshop on Complex Data Challenges in Earth Observation (CDCEO 2022), Vienna, Austria, 25 July 2022. [Google Scholar] [CrossRef]
  5. Wang, Y.; Ma, J.; Li, M.; Tang, X.; Han, X.; Jiao, L. Multi-scale interactive transformer for remote sensing cross-modal image-text retrieval. In Proceedings of the IGARSS 2022–2022 IEEE International Geoscience and Remote Sensing Symposium, Kuala Lumpur, Malaysia, 17–22 July 2022; IEEE: Piscataway, NJ, USA, 2022; pp. 839–842. [Google Scholar] [CrossRef]
  6. Zhang, X.; Li, W.; Wang, X.; Wang, L.; Zheng, F.; Wang, L.; Zhang, H. A fusion encoder with multi-task guidance for cross-modal text–image retrieval in remote sensing. Remote Sens. 2023, 15, 4637. [Google Scholar] [CrossRef]
  7. Abdullah, T.; Bazi, Y.; Al Rahhal, M.M.; Mekhalfi, M.L.; Rangarajan, L.; Zuair, M. TextRS: Deep bidirectional triplet network for matching text to remote sensing images. Remote Sens. 2020, 12, 405. [Google Scholar] [CrossRef]
  8. Hu, G.; Wen, Z.; Lv, Y.; Zhang, J.; Wu, Q. Global-local information soft-alignment for cross-modal remote-sensing image-text retrieval. IEEE Trans. Geosci. Remote Sens. 2024, 62, 5623915. [Google Scholar] [CrossRef]
  9. Cheng, R.; Cui, W. Image-Text Matching with Multi-View Attention. arXiv 2024, arXiv:2402.17237. [Google Scholar] [CrossRef]
  10. Zheng, F.; Li, W.; Wang, X.; Wang, L.; Zhang, X.; Zhang, H. A cross-attention mechanism based on regional-level semantic features of images for cross-modal text-image retrieval in remote sensing. Appl. Sci. 2022, 12, 12221. [Google Scholar] [CrossRef]
  11. Wang, Y.; Tang, X.; Ma, J.; Zhang, X.; Liu, F.; Jiao, L. Cross-Modal Remote Sensing Image–Text Retrieval via Context and Uncertainty-Aware Prompt. IEEE Trans. Neural Netw. Learn. Syst. 2024, 36, 11384–11398. [Google Scholar] [CrossRef]
  12. Pan, J.; Ma, Q.; Bai, C. Reducing Semantic Confusion: Scene-aware Aggregation Network for Remote Sensing Cross-modal Retrieval. In Proceedings of the ICMR’23: Proceedings of the 2023 ACM International Conference on Multimedia Retrieval, Thessaloniki, Greece, 12–15 June 2023; pp. 398–406. [Google Scholar] [CrossRef]
  13. Yuan, Z.; Zhang, W.; Fu, K.; Li, X.; Deng, C.; Wang, H.; Sun, X. Exploring a Fine-Grained Multiscale Method for Cross-Modal Remote Sensing Image Retrieval. arXiv 2022, arXiv:2204.09868. [Google Scholar] [CrossRef]
  14. Zheng, C.; Song, N.; Zhang, R.; Huang, L.; Wei, Z.; Nie, J. Scale-Semantic Joint Decoupling Network for Image-Text Retrieval in Remote Sensing. ACM Trans. Multimed. Comput. Commun. Appl. 2023, 20, 1–20. [Google Scholar] [CrossRef]
  15. Yuan, Z.; Zhang, W.; Tian, C.; Rong, X.; Zhang, Z.; Wang, H.; Fu, K.; Sun, X. Remote Sensing Cross-Modal Text-Image Retrieval Based on Global and Local Information. IEEE Trans. Geosci. Remote Sens. 2022, 60, 5620616. [Google Scholar] [CrossRef]
  16. Rahhal, M.M.A.; Bazi, Y.; Alsharif, N.A.; Bashmal, L.; Alajlan, N.; Melgani, F. Multilanguage Transformer for Improved Text to Remote Sensing Image Retrieval. IEEE J. Sel. Top. Appl. Earth Obs. Remote Sens. 2022, 15, 9115–9126. [Google Scholar] [CrossRef]
  17. Yang, R.; Wang, S.; Han, Y.; Li, Y.; Zhao, D.; Quan, D.; Guo, Y.; Jiao, L. Transcending Fusion: A Multi-Scale Alignment Method for Remote Sensing Image-Text Retrieval. IEEE Trans. Geosci. Remote Sens. 2024, 62, 4709217. [Google Scholar] [CrossRef]
  18. Jinyan, Z.; Jun, C.; Yu, L.; Yewei, W.; Xiaoqing, G. Cross-modal retrieval method based on MFF-SFE for remote sensing image-text. J. Univ. Chin. Acad. Sci. 2025, 42, 236–247. [Google Scholar] [CrossRef]
  19. Hu, M.; Yang, K.; Li, J. Prompt-Based Granularity-Unified Representation Network for Remote Sensing Image-Text Matching. IEEE J. Sel. Top. Appl. Earth Obs. Remote Sens. 2025, 18, 10172–10185. [Google Scholar] [CrossRef]
  20. Guan, J.; Shu, Y.; Li, W.; Song, Z.; Zhang, Y. PR-CLIP: Cross-Modal Positional Reconstruction for Remote Sensing Image–Text Retrieval. Remote Sens. 2025, 17, 2117. [Google Scholar] [CrossRef]
  21. Chen, X.; Zheng, X.; Lu, X. Relevance-Guided Adaptive Learning for Remote Sensing Image–Text Retrieval. IEEE Trans. Geosci. Remote Sens. 2025, 63, 5632713. [Google Scholar] [CrossRef]
  22. Sun, Z.; Zhao, M.; Liu, G.; Kaup, A. Cross-Modal Prealigned Method With Global and Local Information for Remote Sensing Image and Text Retrieval. IEEE Trans. Geosci. Remote Sens. 2024, 62, 4709118. [Google Scholar] [CrossRef]
  23. Zhang, J.; Wang, L.; Zheng, F.; Wang, X.; Zhang, H. An enhanced feature extraction framework for cross-modal image–text retrieval. Remote Sens. 2024, 16, 2201. [Google Scholar] [CrossRef]
  24. Dosovitskiy, A.; Beyer, L.; Kolesnikov, A.; Weissenborn, D.; Zhai, X.; Unterthiner, T.; Dehghani, M.; Minderer, M.; Heigold, G.; Gelly, S.; et al. An image is worth 16 × 16 words: Transformers for image recognition at scale. arXiv 2020, arXiv:2010.11929. [Google Scholar] [CrossRef]
  25. Liu, Z.; Lin, Y.; Cao, Y.; Hu, H.; Wei, Y.; Zhang, Z.; Lin, S.; Guo, B. Swin transformer: Hierarchical vision transformer using shifted windows. In Proceedings of the 2021 IEEE/CVF International Conference on Computer Vision (ICCV), Montreal, BC, Canada, 10–17 October 2021; pp. 10012–10022. [Google Scholar] [CrossRef]
  26. Yan, L.; Feng, Q.; Wang, J.; Cao, J.; Feng, X.; Tang, X. A Multilevel Multimodal Hybrid Mamba-Large Strip Convolution Network for Remote Sensing Semantic Segmentation. Remote Sens. 2025, 17, 2696. [Google Scholar] [CrossRef]
  27. Zhan, Z.; Ren, H.; Xia, M.; Lin, H.; Wang, X.; Li, X. Amfnet: Attention-guided multi-scale fusion network for bi-temporal change detection in remote sensing images. Remote Sens. 2024, 16, 1765. [Google Scholar] [CrossRef]
  28. Zhu, Z.; Kang, J.; Diao, W.; Feng, Y.; Li, J.; Ni, J. SIRS: Multitask joint learning for remote sensing foreground-entity image–text retrieval. IEEE Trans. Geosci. Remote Sens. 2024, 62, 1–15. [Google Scholar] [CrossRef]
  29. Wu, D.; Li, H.; Hou, Y.; Xu, C.; Cheng, G.; Guo, L.; Liu, H. Spatial–Channel Attention Transformer With Pseudo Regions for Remote Sensing Image-Text Retrieval. IEEE Trans. Geosci. Remote Sens. 2024, 62, 4704115. [Google Scholar] [CrossRef]
  30. Yang, X.; Li, C.; Wang, Z.; Xie, H.; Mao, J.; Yin, G. Remote Sensing Cross-Modal Text-Image Retrieval Based on Attention Correction and Filtering. Remote Sens. 2025, 17, 503. [Google Scholar] [CrossRef]
  31. Qu, B.; Li, X.; Tao, D.; Lu, X. Deep semantic understanding of high resolution remote sensing image. In Proceedings of the 2016 International Conference on Computer, Information and Telecommunication Systems (Cits), Kunming, China, 6–8 July 2016; IEEE: Piscataway, NJ, USA, 2016; pp. 1–5. [Google Scholar] [CrossRef]
  32. Wang, B.; Lu, X.; Zheng, X.; Li, X. Semantic descriptions of high-resolution remote sensing images. IEEE Geosci. Remote Sens. Lett. 2019, 16, 1274–1278. [Google Scholar] [CrossRef]
  33. Yuan, X.; Shi, J.; Gu, L. A review of deep learning methods for semantic segmentation of remote sensing imagery. Expert Syst. Appl. 2021, 169, 114417. [Google Scholar] [CrossRef]
  34. Wang, H.; Tao, C.; Qi, J.; Xiao, R.; Li, H. Avoiding negative transfer for semantic segmentation of remote sensing images. IEEE Trans. Geosci. Remote Sens. 2022, 60, 4413215. [Google Scholar] [CrossRef]
  35. Cheng, Q.; Zhou, Y.; Fu, P.; Xu, Y.; Zhang, L. A deep semantic alignment network for the cross-modal image-text retrieval in remote sensing. IEEE J. Sel. Top. Appl. Earth Obs. Remote Sens. 2021, 14, 4284–4297. [Google Scholar] [CrossRef]
  36. Lee, K.H.; Chen, X.; Hua, G.; Hu, H.; He, X. Stacked cross attention for image-text matching. In Proceedings of the European Conference on Computer Vision (ECCV), Munich, Germany, 8–14 September 2018; pp. 201–216. [Google Scholar] [CrossRef]
  37. Sun, T.; Zheng, C.; Li, X.; Gao, Y.; Nie, J.; Huang, L.; Wei, Z. Strong and Weak Prompt Engineering for Remote Sensing Image-Text Cross-Modal Retrieval. IEEE J. Sel. Top. Appl. Earth Obs. Remote Sens. 2025, 18, 6968–6980. [Google Scholar] [CrossRef]
  38. Wang, M.; Guo, J.; Song, B.; Su, K. Graph-Based Hierarchical Semantic Consistency Network for Remote Sensing Image–Text Retrieval. IEEE J. Sel. Top. Appl. Earth Obs. Remote Sens. 2025, 18, 15334–15346. [Google Scholar] [CrossRef]
  39. Zheng, C.; Wen, Q.; Li, X.; Yang, C.; Nie, J.; Guo, Y.; Qian, Y.; Wei, Z. Whole Semantic Sparse Coding Network for Remote Sensing Image-Text Retrieval. IEEE Trans. Geosci. Remote Sens. 2025, 63, 5406913. [Google Scholar] [CrossRef]
  40. He, K.; Zhang, X.; Ren, S.; Sun, J. Deep residual learning for image recognition. In Proceedings of the IEEE Conference on Computer Vision and Pattern Recognition, Las Vegas, NV, USA, 27–30 June 2016; pp. 770–778. [Google Scholar] [CrossRef]
  41. Devlin, J.; Chang, M.W.; Lee, K.; Toutanova, K. Bert: Pre-training of deep bidirectional transformers for language understanding. In Proceedings of the 2019 Conference of the North American Chapter of the Association for Computational Linguistics: Human Language Technologies, Minneapolis, MN, USA, 2–7 June 2019; Volume 1, pp. 4171–4186. [Google Scholar] [CrossRef]
  42. Lu, X.; Wang, B.; Zheng, X.; Li, X. Exploring models and data for remote sensing image caption generation. IEEE Trans. Geosci. Remote Sens. 2017, 56, 2183–2195. [Google Scholar] [CrossRef]
  43. Wang, T.; Xu, X.; Yang, Y.; Hanjalic, A.; Shen, H.T.; Song, J. Matching images and text with multi-modal tensor fusion and re-ranking. In Proceedings of the 27th ACM international Conference on Multimedia, Nice, France, 21–25 October 2019; pp. 12–20. [Google Scholar] [CrossRef]
  44. Faghri, F.; Fleet, D.J.; Kiros, J.R.; Fidler, S.V. Improving visual-semantic embeddings with hard negatives. arXiv 2017, arXiv:1707.05612. [Google Scholar] [CrossRef]
  45. Qu, L.; Liu, M.; Cao, D.; Nie, L.; Tian, Q. Context-aware multi-view summarization network for image-text matching. In Proceedings of the 28th ACM International Conference on Multimedia, Seattle, WA, USA, 12–16 October 2020; pp. 1047–1055. [Google Scholar] [CrossRef]
  46. Wang, Z.; Liu, X.; Li, H.; Sheng, L.; Yan, J.; Wang, X.; Shao, J. Camp: Cross-modal adaptive message passing for text-image retrieval. In Proceedings of the IEEE/CVF International Conference on Computer Vision, Seoul, Republic of Korea, 27 October–2 November 2019; pp. 5764–5773. [Google Scholar] [CrossRef]
  47. Yao, F.; Sun, X.; Liu, N.; Tian, C.; Xu, L.; Hu, L.; Ding, C. Hypergraph-enhanced textual-visual matching network for cross-modal remote sensing image retrieval via dynamic hypergraph learning. IEEE J. Sel. Top. Appl. Earth Obs. Remote Sens. 2022, 16, 688–701. [Google Scholar] [CrossRef]
  48. Chen, Y.; Huang, J.; Xiong, S.; Lu, X. Integrating multisubspace joint learning with multilevel guidance for cross-modal retrieval of remote sensing images. IEEE Trans. Geosci. Remote Sens. 2024, 62, 4702217. [Google Scholar] [CrossRef]
  49. Yuan, Z.; Zhang, W.; Tian, C.; Mao, Y.; Zhou, R.; Wang, H.; Fu, K.; Sun, X. MCRN: A multi-source cross-modal retrieval network for remote sensing. Int. J. Appl. Earth Obs. Geoinf. 2022, 115, 103071. [Google Scholar] [CrossRef]
  50. Zhang, W.; Li, J.; Li, S.; Chen, J.; Zhang, W.; Gao, X.; Sun, X. Hypersphere-based remote sensing cross-modal text–image retrieval via curriculum learning. IEEE Trans. Geosci. Remote Sens. 2023, 61, 5621815. [Google Scholar] [CrossRef]
  51. Yuan, Z.; Zhang, W.; Rong, X.; Li, X.; Chen, J.; Wang, H.; Fu, K.; Sun, X. A Lightweight Multi-Scale Crossmodal Text-Image Retrieval Method in Remote Sensing. IEEE Trans. Geosci. Remote Sens. 2022, 60, 1–19. [Google Scholar] [CrossRef]
  52. Ji, Z.; Meng, C.; Zhang, Y.; Pang, Y.; Li, X. Knowledge-aided momentum contrastive learning for remote-sensing image text retrieval. IEEE Trans. Geosci. Remote Sens. 2023, 61, 5625213. [Google Scholar] [CrossRef]
  53. Zhang, S.; Li, Y.; Mei, S. Exploring uni-modal feature learning on entities and relations for remote sensing cross-modal text-image retrieval. IEEE Trans. Geosci. Remote Sens. 2023, 61, 5626317. [Google Scholar] [CrossRef]
  54. Chen, Y.; Huang, J.; Li, X.; Xiong, S.; Lu, X. Multiscale salient alignment learning for remote-sensing image–text retrieval. IEEE Trans. Geosci. Remote Sens. 2023, 62, 4700413. [Google Scholar] [CrossRef]
  55. Yang, J.; Li, C.; Zhang, P.; Dai, X.; Xiao, B.; Yuan, L.; Gao, J. Focal self-attention for local-global interactions in vision transformers. arXiv 2021, arXiv:2107.00641. [Google Scholar]
Figure 1. The pipeline of Multi-Scale Semantic-Aware Remote Sensing Image–Text Retrieval (MSSA), which consists of three primary components: the Dual-Branch Feature Encoding Module (DBFE), the Cross-Modal Semantic-Aware Module (CMSAM), and the Multi-Scale Semantic Fusion Module (MSFM). The DBFE is tasked with the extraction of image and text features at multiple scales. These features are subsequently input into the CMSAM, which optimizes the intra-modal feature depiction of both images and text while also explores cross-modal semantic correlations. The MSFM performs multi-scale semantic interaction and fusion, achieving the alignment and matching of features across different modalities.
Remotesensing 17 03341 g001
Figure 2. The schematic diagram of the Cross-Modal Semantic Aware Module, CMSAM. It comprises PSCJA, IGTA, and CMSE, which optimize multi-scale features and achieve semantic alignment, facilitating a deep integration of visual and textual information.
Remotesensing 17 03341 g002
Figure 3. Schematic diagram of the Window-Region-Global Progressive Attention, WRGPA. The mechanism employs a hierarchical and progressive feature learning approach to capture multi-scale features of RS images. Through computationally efficient Window Attention, Region Attention, and Global Attention, the receptive field gradually expands from the window level to the regional and global levels.
Remotesensing 17 03341 g003
Figure 4. Schematic diagram of Segmented Channel Attention, SCA.
Remotesensing 17 03341 g004
Figure 5. Diagram of Progressive Spatial-Channel Joint Attention, PSCJA.
Remotesensing 17 03341 g005
Figure 6. Diagram of Image-Guide Text Attention, IGTA.
Remotesensing 17 03341 g006
Figure 7. Diagram of Multi-Scale Semantic Fusion Module, MSFM.
Remotesensing 17 03341 g007
Figure 8. PSCJA visualization at different scales.
Remotesensing 17 03341 g008
Figure 9. IGTA visualization at different scales.
Remotesensing 17 03341 g009
Figure 10. Visualization of learnable semantic tokens in CMSE module.
Remotesensing 17 03341 g010
Figure 11. Evaluation metrics mr and loss change curves.
Remotesensing 17 03341 g011
Figure 12. Top five results of image-to-text retrieval on UCM caption.
Remotesensing 17 03341 g012
Figure 13. Top five results of text-to-image retrieval on UCM caption.
Remotesensing 17 03341 g013
Table 1. Results and analysis on UCM caption dataset. The best results for each indicator are presented in bold.
MethodImage-to-TextText-to-ImagemR
R@1R@5R@10R@1R@5R@10
VSE++ (BMVC’18)12.3844.7665.7110.1031.8056.8536.93
SCAN-i2t (ECCV’18)12.8547.1469.5212.4846.8671.7143.43
SCAN-t2i (ECCV’18)14.2945.7167.6212.7650.3877.2444.67
MTFN (MM’19)10.4747.6264.2914.1952.3878.9544.65
CAMP-triplet (ICCV’19)10.9544.2965.719.9046.1976.2942.22
CAMP-bce (ICCV’19)14.7646.1967.6211.7147.2476.0043.92
CAMERA (MM’20) 8.3321.8333.117.5226.1940.7222.95
AMFMN-soft (TGRS’22)12.8651.9066.7614.1951.7178.4845.97
AMFMN-fusion (TGRS’22)16.6745.7168.5712.8653.2479.4346.08
AMFMN-sim (TGRS’22)14.7649.5268.1013.4351.8176.4845.68
LW-MCR-b (TGRS’22)12.3843.8159.5212.0046.3872.4841.10
LW-MCR-d (TGRS’22)15.2451.9062.8611.9050.9575.2444.68
LW-MCR-u (TGRS’22)18.1047.1463.8113.1450.3879.5245.35
CABIR (AS’22)15.1745.7172.8512.6754.1989.2348.30
SSJDN (ACM TOMM’23)17.8653.5772.0220.5462.5682.9851.59
SMLGN (GNTGRS’24)12.8649.5275.7114.2952.7684.6748.30
MSITA (GNTGRS’24)16.8649.3373.3314.2957.1691.5850.43
MSA (TGRS’24)13.3359.0577.1413.1457.5292.4852.11
PGRN (JSTARS’25)16.1951.4375.2413.6260.8695.0552.06
MSSA (Ours)22.3860.9579.5215.8164.7693.5256.16
Table 2. Results and analysis on RSITMD dataset. The best results for each indicator are presented in bold.
MethodImage-to-TextText-to-ImagemR
R@1R@5R@10R@1R@5R@10
VSE++ (BMVC’18)9.0721.6131.787.7327.8041.0023.17
SCAN-i2t (ECCV’18)11.0625.8839.389.8229.3842.1226.28
SCAN-t2i (ECCV’18)10.1828.5339.4910.1028.9843.5326.64
MTFN (MM’19)10.4027.6536.289.9631.3745.8426.92
CAMP-triplet (ICCV’19)11.7326.9938.058.2727.7944.3426.20
CAMP-bce (ICCV’19)9.0723.0133.195.2223.3238.3622.03
CAMERA (MM’20)8.3321.8233.117.5236.1940.7222.95
AMFMN-soft (TGRS’22)11.0625.8839.829.8233.9459.9028.74
AMFMN-fusion (TGRS’22)11.0629.2038.729.9634.0352.9629.32
AMFMN-sim (TGRS’22)10.6324.7841.8111.5134.6954.8729.72
GALR (TGRS’22)13.0530.0942.2010.4736.3453.3531.00
LW-MCR-b (TGRS’22)9.0722.7938.256.1127.7449.5625.55
LW-MCR-d (TGRS’22)10.1828.9839.827.7930.1849.7827.79
LW-MCR-u (TGRS’22)9.7326.7737.619.2534.0754.0328.58
MRCN (JAG’22)13.2729.4241.599.4235.5352.7430.33
HyperMatch (JSTARS’22)11.7328.1038.059.1632.3146.6427.67
SSJDN (ACM TOMM’23)11.2828.0941.5913.2343.7564.7333.73
SWAN (ICMR’23)13.3532.1546.9011.2440.4060.6034.11
HVSA (TGRS’23)13.2032.0845.5811.4339.2057.4533.16
MGRM (TGRS’23)13.5131.8746.2711.1137.2256.6132.76
MSITA (TGRS’23)15.2234.2047.6512.1539.9257.7234.48
KAMCL (TGRS’23)16.5135.2849.1213.5042.1559.3236.14
SMLGN (TGRS’24)17.2639.3851.5513.1943.9460.4037.62
MSA (TGRS’24)16.5941.0451.3315.5344.2060.8038.08
GHSCN (JSTARS’25)18.1438.7153.5413.6243.8566.1939.01
PGRN (JSTARS’25)15.9337.8352.4313.8147.4368.5039.32
MSSA (Ours)28.9849.5660.4015.0947.2171.1545.40
Table 3. Results and analysis on RSICD dataset. The best results for each indicator are presented in bold.
MethodImage-to-TextText-to-ImagemR
R@1R@5R@10R@1R@5R@10
VSE++ (BMVC’18)4.5616.7322.944.3715.3725.3514.89
SCAN-i2t (ECCV’18)5.8512.8919.843.7114.6026.7314.23
SCAN-t2i (ECCV’18)4.3910.9017.643.9112.6026.4913.25
MTFN (MM’19)5.0212.5219.744.9017.1729.4914.81
CAMP-bce (ICCV’19)4.2010.2415.452.7212.7622.8911.38
CAMP-triplet (ICCV’19)5.1212.8921.124.1515.2327.8114.39
CAMERA (MM’20)4.5713.0821.774.0015.9326.9714.39
AMFMN-soft (TGRS’22)5.0514.5321.575.0519.7431.0416.02
AMFMN-fusion (TGRS’22)5.3915.0823.404.9018.2831.4416.42
AMFMN-sim (TGRS’22)5.2114.7221.574.0817.0030.6015.53
GALR (TGRS’22)6.5018.9129.705.1119.5731.9218.62
GALR-MR (TGRS’22)6.5919.8531.044.6919.4832.1318.96
LW-MCR-b (TGRS’22)4.5713.7120.114.0216.4728.2314.52
LW-MCR-d (TGRS’22)3.2912.5219.934.6617.5130.0214.66
LW-MCR-u (TGRS’22)4.3913.3520.394.3018.8532.3415.59
MRCN (JAG’22)6.5919.4030.285.0319.3832.9918.95
CABIR (AS’22)8.5916.2724.135.4220.7733.5818.12
HyperMatch (JSTARS’22)7.1420.0431.026.0820.3733.8219.75
SWAN (ICMR’23)7.4120.1330.865.5622.2637.4120.61
SSJDN (ACM TOMM’23)7.6920.5432.205.5820.0736.5421.78
HVSA (TGRS’23)7.4720.6232.115.5121.1334.1320.16
MSITA (TGRS’24)8.6722.7133.916.1321.9835.3921.47
MSA (TGRS’24)7.5023.7036.966.7723.0439.0322.83
GHSCN(JSTARS’25)10.8124.5437.586.4124.7742.2324.39
PGRN(JSTARS’25)11.1628.5541.908.7129.3745.9327.60
MSSA (Ours)17.4735.1352.337.9831.6650.0332.43
Table 4. CMSAM’s role in retrieval performance enhancement. The best results for each indicator are presented in bold.
CMSAMImage-to-TextText-to-ImagemR
PSCJAIGTACMSER@1R@5R@10R@1R@5R@10
20.0056.1977.9513.6162.3390.4753.43
20.3353.3871.6714.5761.6285.9053.25
18.0556.3376.2814.5262.5488.4252.69
21.4357.2880.2315.6764.8991.1055.10
16.6355.9182.3515.1263.7592.8354.43
20.8759.8278.7314.9366.6790.7555.30
22.3860.9579.5215.8164.7693.5256.16
Table 5. Comparison of different attention mechanisms. The best results for each indicator are presented in bold.
AttentionImage-to-TextText-to-ImagemR
R@1R@5R@10R@1R@5R@10
Vanilla MSA18.5755.3877.0018.1965.4389.9554.09
SW-MSA22.5356.4376.7115.1967.8188.7654.57
FSA21.2355.5175.0419.8070.7589.9055.37
WRGPA24.2956.6772.8621.4368.4387.0555.12
SCA21.4351.4365.7120.1970.9588.6753.06
PSCJA22.3860.9579.5215.8164.7693.5256.16
Table 6. Comparison of retrieval performance and reasoning efficiency of multi scale feature map combination. The best results for each indicator are presented in bold.
ScaleImage-to-TextText-to-ImagemRInference Time (ms)
R@1R@5R@10R@1R@5R@10
I1/817.3356.4374.5214.2965.0089.8652.9121.3
I1/1617.1856.2273.4814.3164.7588.7152.4417.6
I1/3215.5754.7173.0512.5263.3888.0151.2114.8
I1/8 + I1/1620.9559.2478.0714.6265.0291.7154.9425.9
I1/8 + I1/3220.1457.1079.7614.4363.3291.7654.4223.7
I1/16 + I1/3219.5756.8677.9513.2962.4890.8153.4920.2
I1/8 + I1/16 + I1/3222.3860.9579.5215.8164.7693.5256.1628.6
Table 7. Influence of different number of learnable semantic tokens on retrieval performance. The best results for each indicator are presented in bold.
NumImage-to-TextText-to-ImagemR
R@1R@5R@10R@1R@5R@10
1020.9556.8176.5219.5762.6790.8654.56
1521.4358.7177.2420.0062.8192.1053.38
2022.3860.9579.5215.8164.7693.5256.16
2521.1060.0581.3816.6765.3892.7356.22
3020.8162.4079.4516.4365.5393.3356.33
Table 8. Comparison of complexity.
MethodVanilla MSASW-MSAFSAPSCJA
Params (M)18.7416.8319.3117.46
Flops (G)44.8641.2945.3743.31
Table 9. Comparison of different image feature encoders. The best results for each indicator are presented in bold.
ImageEncoderImage-to-TextText-to-ImagemRParams (M)Inference Time (ms)
R@1R@5R@10R@1R@5R@10
ResNet1821.8656.1974.0516.9063.0590.0153.6813.8321.7
ResNet5022.3860.9579.5215.8164.7693.5256.1626.2828.6
ResNet10121.4058.1079.1916.5765.2694.3055.8045.2744.1
ViT20.9561.0078.1018.4867.0593.1456.4586.338.2
Disclaimer/Publisher’s Note: The statements, opinions and data contained in all publications are solely those of the individual author(s) and contributor(s) and not of MDPI and/or the editor(s). MDPI and/or the editor(s) disclaim responsibility for any injury to people or property resulting from any ideas, methods, instructions or products referred to in the content.